


Languages
Pages
Legal

Analytical Method Development to Support Prioritization of Pesticides in Wastewater
REPORT TO THE
California Department of Pesticide Regulation
Contract # 14-C0103
Prepared by:
Thomas M. Young
Christopher Alaimo
Department of Civil and Environmental Engineering University of California, Davis
One Shields Avenue, Davis, CA, 95616
May 8, 2017

DISCLAIMER
The statements and conclusions in this report are those of the contractor and not necessarily those of the California Department of Pesticide Regulation. The mention of commercial products, their source, or their use in connection with material reported herein is not to be construed as actual or implied endorsement of such products.
i
ACKNOWLEDGEMENTS
The analytical method development and subsequent sample analyses described in this report
were performed by a laboratory team with important contributions from the following
individuals:
Christoph Moschet – Postdoctoral Scholar, CEE Dept, UC Davis Luann Wong – Junior Specialist, CEE Dept, UC Davis Bonny Lew– Junior Specialist, CEE Dept, UC Davis Nicole Yalung – Undergraduate Student Assistant, CEE Dept, UC Davis
The authors thank staff at the UC Davis and City of Palo Alto wastewater treatment plants for
their assistance with sample collection. The Project Officer from the California Department of
Pesticide Regulation, Dr. Jennifer Teerlink, provided critical input at every stage of the process
from the design of the sampling campaign to data analysis. Her input is greatly appreciated.
ii

TABLE OF CONTENTS ACKNOWLEDGEMENTS................................................................................................ ii LIST OF TABLES............................................................................................................. iv LIST OF FIGURES ........................................................................................................... iv LIST OF ACRONYMS ...................................................................................................... v EXECUTIVE SUMMARY ................................................................................................ 1 1 INTRODUCTION .................................................................................................... 2
1.1 Motivation................................................................................................................. 2 1.2 Research Objectives.................................................................................................. 2 1.3 Project Tasks............................................................................................................. 2
2 METHODS ............................................................................................................... 6 2.1 Method Development ............................................................................................... 6 2.2 Summary of Analytical Methods.............................................................................. 9 2.3 Data Analysis .......................................................................................................... 11
3 RESULTS ............................................................................................................... 13 3.1 Target Compound Analysis .................................................................................... 13 3.2 Nontarget Analysis ................................................................................................. 16
4 REFERENCES ....................................................................................................... 23
iii
LIST OF TABLES
Table 1-1: Analytes to be Included in the Target Method ………………………………………4 Table 2-1. Performance of LC-QTOF-MS analytical method for validation compounds in
wastewater ………………………………………………………………………….. 8
LIST OF FIGURES
Figure 3-1: Detection Frequency for Target Compounds …………………………………….. 14 Figure 3-2: Spatial and temporal changes in Permethrin mass loads across different sewer laterals
………………………………………………………………………………….…. 15 Figure 3-3 Spatial and temporal changes in the mass load of Fipronil and its measured byproducts
across different sewer laterals …………………………………………………..… 15 Figure 3-4 Spatial and temporal changes in Imidacloprid mass loads across different sewer
laterals …………………………………………………………………………..… 16 Figure 3-5: Example of extracted ion chromatogram for suspect compound Fluazifop …….... 17 Figure 3-6: Isotope pattern for suspected compound fluazifop …………………………….…. 18 Figure 3-7: Coelution of MS/MS fragments from Fluazifop ……………………………….…. 18 Figure 3-8: Summary of detection frequency for nontarget compounds in database ……….… 19 Figure 3-9: Ethoxylated surfactant structures identified in nontarget data analysis …………... 20 Figure 3-10: Ethoxylated surfactant analysis, ESI- data ……………………………………..…. 22 Figure 3-11: Ethoxylated surfactant analysis, ESI+ data. ………………………………………. 22
iv

LIST OF ACRONYMS
CE – collision energy DPR – Department of Pesticide Regulation EI – electron ionization ESI electrospray ionization GC – gas chromatography HRMS – high resolution mass spectrometry LC – liquid chromatography LOD – limit of detection LOQ – limit of quantification MS – mass spectrometry NCI – negative chemical ionization PCDL – Agilent Technologies personal compound database library QTOF – quadrupole time-of-flight RT – retention time
v
EXECUTIVE SUMMARY
Background: Detections of pesticides in treated wastewater discharges have raised water quality concerns, but the extent of the problem and the sources of the compounds to wastewater treatment plants are largely unknown. Robust and validated analytical methods are required to identify and quantify pesticides in wastewater; these methods are not currently available, especially for insecticides other than pyrethroids. The objectives of the research are to develop, validate, and demonstrate analytical methods to quantify the concentrations of a target list of pesticides in municipal wastewater influent and effluent and to simultaneously scan for the presence of pesticides and adjuvants not currently on the list.
Methods: Following initial method development and validation, 101 grab samples of wastewater were collected from a municipal wastewater treatment between February 2016 and January 2017. Samples were analyzed for target pesticides and were screened for a range of possible suspect and nontarget compounds using the validated methods. These methods included sample filtration and solid phase extraction followed by high resolution GC-MS or LC-MS analysis. Recoveries for a significant fraction of the target and validation compounds were between 75-120% and, with few exceptions, the limits of quantitation in wastewater influent ranged from 0.1 to 250 ng/L.
Results: Twelve target compounds were above the limits of quantitation in influent/lateral samples in over half of the samples analyzed. These included six synthetic pyrethroids (permethrin, deltamethrin, cypermethrin, cyhalothrin, cyfluthrin, and bifenthrin), fipronil and four of its degradation products (fipronil amide, fipronil-sulfide, fipronil-sulfone, and fipronil-desulfinyl), and one neonicitinoid insecticide (imidacloprid). Suspect screening identified numerous pharmaceuticals and personal care products in wastewater, but a limited number of additional pesticides. A large number of structurally diverse ethoxylated surfactants were identified through nontarget screening approaches.
Conclusions: Collectively, the targeted results emphasize the ubiquitous nature of pesticide contributions throughout the sewer system, with laterals from different locations and land use patterns each contributing a substantial fraction of the load of one of the most frequently detected compounds during one or more sampling events. Further, although the temporal patterns of the pesticide loads differed by compound, at every sampling date at least one of the compounds was at or near its highest loading value, resulting in a constantly elevated level of one or more compounds on every sampling date.
Future Work: The ubiquitous appearance of pesticides from a range of compound classes in the sewer system suggests that further investigation is required to understand the sources of pesticides entering wastewater treatment facilities in support of future source control efforts.
1
1 INTRODUCTION
1.1 Motivation
Detections of pesticides in treated wastewater discharges have raised water quality concerns, but
the extent of the problem and the sources of the compounds to wastewater treatment plants are
largely unknown. Addressing these problems requires robust and validated analytical methods to
identify and quantify pesticides in wastewater; these methods are not currently available,
especially for insecticides other than pyrethroids. Scanning for non-target pesticides and adjuvants
will allow identification of compounds entering wastewater system from sources not otherwise
identified.
1.2 Research Objectives
The objectives of this research are to develop, validate, and demonstrate analytical methods to
quantify the concentrations of a target list of pesticides in municipal wastewater influent and
effluent and to simultaneously scan for the presence of pesticides and adjuvants not currently on
the list. Beyond the quantitative concentration results, the robust, validated analytical methods
developed under this project will support future efforts to improve our understanding of the sources
and usage patterns of pesticides obtained at retail outlets. The combination of target and non-target
analytical methods provides a comprehensive consideration of pesticides and adjuvants of concern
for wastewater treatment operations and information about their primary sources.
1.3 Project Tasks
The project was organized around the following major tasks:
2
Task 1: Develop Target Analytical Methods for High Priority Pesticides
A total of 27 compounds (Table 1-1) were selected for targeted analytical method development in
wastewater, including both insecticide active ingredients and persistent and/or toxic degradation
products of the selected insecticides. This list was developed by DPR staff from store shelf surveys
of residential use pesticides and available toxicity data with the goal of including pesticides with
the greatest likelihood of being observed at concentrations above toxicity thresholds in wastewater.
Methods were developed for gas and liquid chromatography with high resolution mass
spectrometry (GC-HRMS and LC-HRMS) to allow simultaneous quantification of the target
compounds in Table 1-1 along with identification of insecticides or adjuvants not currently on the
list. All methods were developed to support subsequent implementation of the target compound
analysis procedures on unit resolution LC- and GC-MS systems. Extraction, concentration,
cleanup and analysis methods were developed and refined using wastewater influent and effluent
samples from the UC Davis wastewater treatment plant spiked with pesticides with a wide range
of physical-chemical characteristics. Compound recoveries, method reproducibility and detection
limits were determined for all compounds.
3
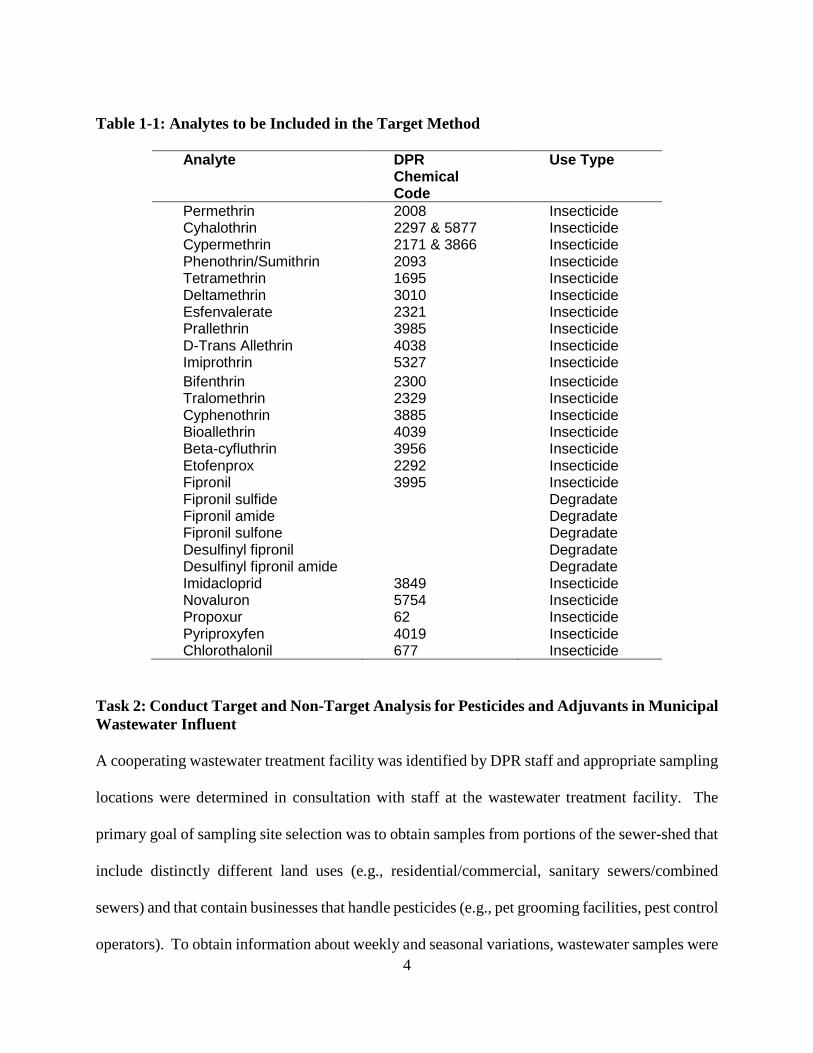
Table 1-1: Analytes to be Included in the Target Method
Analyte DPR Chemical
Use Type
Code Permethrin 2008 Insecticide
Cyhalothrin 2297 & 5877 Insecticide Cypermethrin 2171 & 3866 Insecticide
Phenothrin/Sumithrin 2093 Insecticide Tetramethrin 1695 Insecticide
Deltamethrin 3010 Insecticide Esfenvalerate 2321 Insecticide
Prallethrin 3985 Insecticide D-Trans Allethrin 4038 Insecticide
Imiprothrin 5327 Insecticide Bifenthrin 2300 Insecticide
Tralomethrin 2329 Insecticide Cyphenothrin 3885 Insecticide
Bioallethrin 4039 Insecticide Beta-cyfluthrin 3956 Insecticide
Etofenprox 2292 Insecticide Fipronil 3995 Insecticide
Fipronil sulfide Degradate Fipronil amide Degradate Fipronil sulfone Degradate
Desulfinyl fipronil Degradate Desulfinyl fipronil amide Degradate
Imidacloprid 3849 Insecticide Novaluron 5754 Insecticide Propoxur 62 Insecticide
Pyriproxyfen 4019 Insecticide Chlorothalonil 677 Insecticide
Task 2: Conduct Target and Non-Target Analysis for Pesticides and Adjuvants in Municipal Wastewater Influent
A cooperating wastewater treatment facility was identified by DPR staff and appropriate sampling
locations were determined in consultation with staff at the wastewater treatment facility. The
primary goal of sampling site selection was to obtain samples from portions of the sewer-shed that
include distinctly different land uses (e.g., residential/commercial, sanitary sewers/combined
sewers) and that contain businesses that handle pesticides (e.g., pet grooming facilities, pest control
operators). To obtain information about weekly and seasonal variations, wastewater samples were 4

collected on both weekdays and weekend days between February 2016 and January 2017. During
most sampling events, 12 sites were sampled, 10 sites representing various sub-divisions of the
sewer-shed, one combined influent and one effluent sample. A total of 101 wastewater samples
were analyzed using validated methods for quantification of target compounds and identification
of non-target pesticides and adjuvants using high resolution spectroscopy scans. Samples were
collected by the staff of the cooperating utility or by DPR and provided to UC Davis for analysis.
Each sampling event included at one field blank and one matrix spike duplicate for quality
assurance.
Task 3. Reporting
This final report summarizes the method development process and provides an overview of target
and nontarget analytical results. An excel spreadsheet containing all targeted compound analytical
results for all samples is being submitted as a separate deliverable. The full scan high resolution
data obtained in the study will be retained at UC Davis for at least five years to allow for subsequent
re-processing to determine the presence of newly recognized compounds of concern.
5
2 METHODS
2.1 Method Development
The analytical methods for the project were developed to support project objectives related to
both target and nontarget compounds. The target compounds amenable to GC-MS analysis were
primarily pyrethroid insecticides, and these have been successfully analyzed in both influent and
effluent wastewater sample by our laboratory and others in previous investigations (Weston and
Lydy, 2010; Parry and Young, 2013; Markle et al., 2014). Performance of the GC-MS methods,
therefore, was not subject to refinement in the initial project stages; subsequent quality control
measurements, including spike recovery tests in each analytical sample batch and independent
determination of limits of quantitation (LOQ), supported the adaptation of existing extraction
and chromatography approaches for these compounds.
Measurements of LC-MS amenable pesticides in wastewater influent has been less common and
so this was the primary focus of the method development effort. Because the target compounds
that are best analyzed by LC-MS are only analyzed in positive electrospray ionization mode, but
the nontarget analysis was designed to rely on both positive and negative ionization modes, a
broader list of compounds was used for method validation. A total of 32 LC-MS amenable
pesticides were selected, with 15 detectable in negative mode, 22 detectable in positive mode,
and 5 detectable in either mode. The validation compounds were chosen to represent pesticides
from different classes and with different physico-chemical properties. The same LC-MS
compounds had been previously used in method validation for surface water samples, and
complete information about their properties is summarized in Moschet et al. (2017). For the LC
MS measurements, 11 internal standards were used; for the GC-MS measurements, two
6

surrogates and one internal standard were used. All solvents were high purity (methanol, ethyl
acetate, hexane, acetone, dichloromethane from Fisher Scientific, acetonitrile from Burdick and
Jackson); ultra-pure water was supplied by an in-house deionized water system (MilliQ
Millipore).
Method validation was conducted using UC Davis influent wastewater samples spiked with the
validation compounds. After method optimization, recoveries were generally good, with 24/32
compounds yielding recoveries between 75 and 120%. Of the remaining eight compounds,
seven had recoveries of 57-74%, while one (novaluron) had a recovery of 45%. Limits of
quantitation for the validation compounds were 1-100 ng/L for 31/32 compounds; the LOQ for
methomyl was 612 ng/L. Matrix factors (the ratio of the instrument response to a spike in clean
solvent to the instrument response in the wastewater matrix) were determined for the validation
compounds to determine the range of matrix suppression to be expected. Values ranged from
1.27 to 33.9, with 23/32 values below 10. Given the broad range of physical chemical
characteristics and the use of a single extraction and analysis method, the overall performance is
considered satisfactory.
7
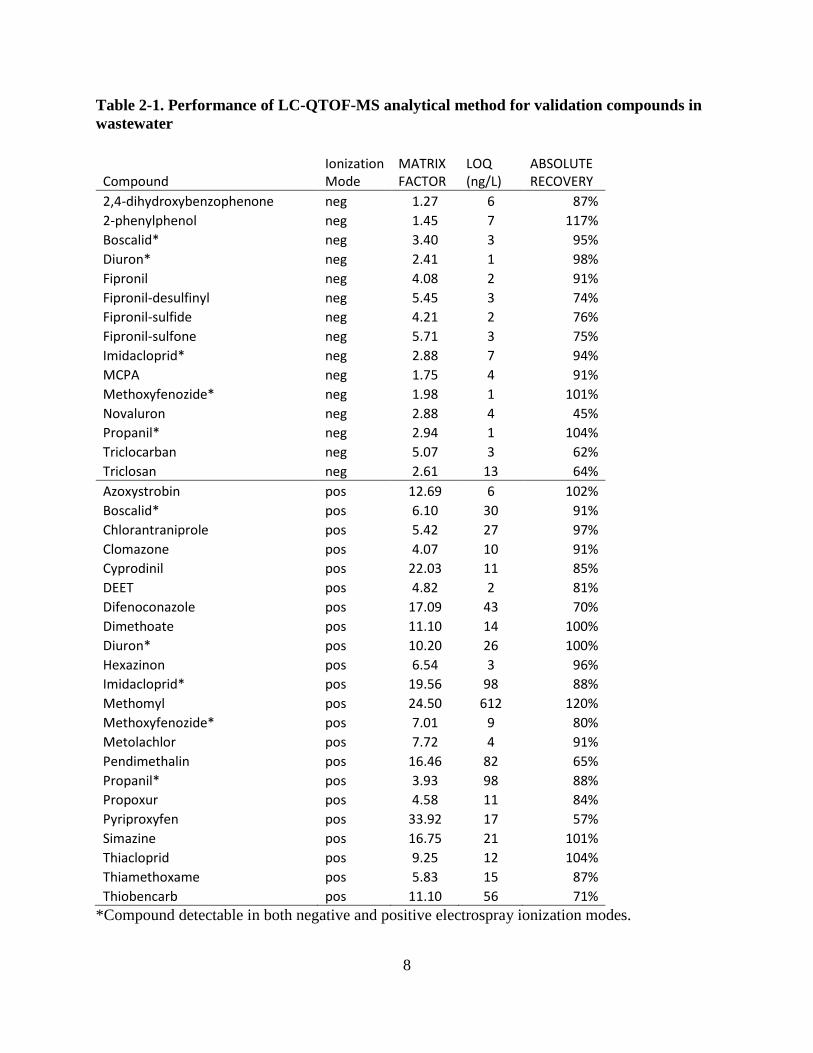
Table 2-1. Performance of LC-QTOF-MS analytical method for validation compounds in wastewater
Ionization MATRIX LOQ ABSOLUTE Compound Mode FACTOR (ng/L) RECOVERY 2,4-dihydroxybenzophenone neg 1.27 6 87% 2-phenylphenol neg 1.45 7 117% Boscalid* neg 3.40 3 95% Diuron* neg 2.41 1 98% Fipronil neg 4.08 2 91% Fipronil-desulfinyl neg 5.45 3 74% Fipronil-sulfide neg 4.21 2 76% Fipronil-sulfone neg 5.71 3 75% Imidacloprid* neg 2.88 7 94% MCPA neg 1.75 4 91% Methoxyfenozide* neg 1.98 1 101% Novaluron neg 2.88 4 45% Propanil* neg 2.94 1 104% Triclocarban neg 5.07 3 62% Triclosan neg 2.61 13 64% Azoxystrobin pos 12.69 6 102% Boscalid* pos 6.10 30 91% Chlorantraniprole pos 5.42 27 97% Clomazone pos 4.07 10 91% Cyprodinil pos 22.03 11 85% DEET pos 4.82 2 81% Difenoconazole pos 17.09 43 70% Dimethoate pos 11.10 14 100% Diuron* pos 10.20 26 100% Hexazinon pos 6.54 3 96% Imidacloprid* pos 19.56 98 88% Methomyl pos 24.50 612 120% Methoxyfenozide* pos 7.01 9 80% Metolachlor pos 7.72 4 91% Pendimethalin pos 16.46 82 65% Propanil* pos 3.93 98 88% Propoxur pos 4.58 11 84% Pyriproxyfen pos 33.92 17 57% Simazine pos 16.75 21 101% Thiacloprid pos 9.25 12 104% Thiamethoxame pos 5.83 15 87% Thiobencarb pos 11.10 56 71%
*Compound detectable in both negative and positive electrospray ionization modes.
8
2.2 Summary of Analytical Methods
Sample Extraction and Concentration
Wastewater samples (200 mL of raw wastewater or 1 L of treated effluent) were filtered through
a GF/F filter (0.45µm) which was retained for extraction. Filtered samples were spiked with 200
ng of a radio-labeled surrogate solution, and passed over an Oasis HLB cartridge (Waters,
Massachusetts, USA) to enrich neutral, cationic and anionic species with a broad range of Kow
values. Sodium sulfate (5 g) was added to the jar to collect residual water, and the jar was rinsed
with 3 x 4 mL 3:1 hexane/acetone to recover compounds sorbed to the container. Cartridges were
dried for one hour prior to extraction. Once dry, cartridges were eluted with 2 x 5 mL ethyl acetate,
which was combined with the jar rinse, and evaporated to 1 mL with nitrogen using a Turbovap
(Biotage). Cartridges were re-eluted with 2 x 5 mL methanol, and again evaporated to 1 mL.
Filters were air-dried and extracted in a sonicating bath with 2 x 20 mL 1:1 hexane/acetone, which
were then evaporated to 1 mL.
Sample Preparation and Analytical Method for LC-QTOF-MS
Samples were prepared for LC-QTOF-MS analysis by combining 500 µL each of the ethyl acetate
extract, methanol extract, and filter extract. The combined extract was evaporated to 200 µL,
brought to a final volume of 1 mL with ultrapure water, and spiked with 200 ng of an internal
standard solution. A calibration curve consisting of ten points between 0.1 – 250 ng/mL was
prepared in ultra-pure water/methanol (80:20 v/v) and spiked with internal standards at the same
concentrations as the samples.
9
LC-QTOF-MS (Agilent 1260 Infinity HPLC coupled to an Agilent 6530 QTOF-MS with a Zorbax
Eclipse Plus C18 column; 100 mm, 2.5 mm, 1.8 µm, Agilent Technologies, Inc.) analysis was
performed by injecting 5 µL of extract with the following mobile phases used in a 23 min run at a
flow rate of 0.35 mL/min: positive ionization mode: A) deionized water plus 0.1% formic acid, B)
acetonitrile plus 0.1% formic acid; negative ionization mode: A) ultra-pure water plus 1mM
ammonium fluoride, B) acetonitrile. The instrument was run in the 2 GHz, extended dynamic range
mode at 4 spectra/second. Acquisition was done in All-Ions fragmentation mode using collision
energies (CE) of 0, 10, 20, and 40 eV, i.e., all ions with m/z 50−1,050 were fragmented in the
collision cell with the corresponding CE. CE=0 means no fragmentation and is equal to a full MS
scan. MS settings (gas flows, gas temperatures, etc.) were optimized separately in positive and
negative ionization modes using target pesticides. Positive ionization mode was used to quantify
all 4 of the LC target compounds.
Extraction and Analytical Method for GC-QTOF-MS
Samples were prepared for GC-QTOF-MS analysis by combining 500 µL of the ethyl acetate
extract with 500 µL of the filter extract. The combined extract was evaporated to 200 µL and
spiked with Dibromooctafluorobisphenol (DBOFB, 10 ng) as an internal standard. A calibration
curve consisting of ten points between 0.1 – 250 ng/mL was prepared in ethyl acetate, spiking
surrogates and internal standard at the same concentrations as the samples.
GC-QTOF-MS analysis (Agilent 7890B GC coupled to an Agilent QTOF/MS 7200B with a HP
5MS UI 30 m × 0.25 mm, 0.25 µm column, Agilent Technologies, Inc.) was conducted once in
negative chemical ionization (NCI) mode using methane as collision gas and a second time in
10

electron ionization (EI) mode. NCI mode was used to quantify 21 of the 22 GC targets, as NCI is
much more sensitive for most pyrethroids and other halogenated compounds than EI.
EI mode was used for screening the Agilent GC/Q-TOF – Pesticide PCDL containing 750
pesticides with exact mass EI fragments and retention times. The chromatographic parameters for
the GC-EI-MS method were adapted from the Agilent method. Using these settings, the measured
RTs matched with the library RT within 0.5 min. To get the measured RT even closer to the library
RT, retention time locking was implemented via five injections of the same standard, one at the
original helium flow rate and four with −20%, −10%, +10%, and +20% of the selected helium
flow rate. The retention time of chlorpyrifos (library RT 19.993 min in the 40 min run) was used
to optimize helium flow by a regression curve of the multiple injections. Retention time locking
provided RTs for targets within 0.2 min of their library RTs.
Target Quantification
Target compounds (Table 1-1) were quantified using Agilent MassHunter Quantitative Analysis
software (B.07). For LC-QTOF-MS, the [M+H]+ or [M-H]- ions were used as quantifiers (exact
mass window ±10 ppm) and two main MS/MS fragments (taken from an existing library spectra)
measured in the All-Ions scans were used as qualifiers. For GC-QTOF-MS, the main NCI
fragment was used as quantifier and two additional fragments were used as qualifiers. For
method validation and quality control, pre-spiked (before extraction), post-spiked (before
injection) and procedural blank (extracted in ultra-pure water) samples, in triplicate, were used.
2.3 Data Analysis
Suspect Screening using All-Ions Workflow on LC-QTOF-MS
11
Suspect screening employed the Agilent MassHunter Qualitative Analysis (B.07) software by
applying the Find by Formula workflow in ESI+ and ESI- modes. The Agilent Pesticide PCDL
containing 1684 pesticides and transformation products (914 with MS/MS spectra) was used as a
suspect list. [M+H]+ and [M+Na]+ in the positive mode as well as [M-H]- and [M+F]- in the
negative mode were searched at m/z ±10 ppm and an isotope score (including exact mass
deviation of monoisotopic m/z, abundance deviation and exact mass difference of isotopes
versus theoretical pattern) of >70 was selected as a threshold. The threshold value was selected
as an optimum between false negatives and false positives for spiked target compounds. For
compounds without MS/MS fragments in the library, the workflow stopped here. For compounds
with MS/MS fragments, the software automatically searched the five main fragments from the
library in the All-Ions scans (CE 10, 20, 40). If one or more library fragments were present and
co-eluting with the precursor mass, the compound was automatically flagged as qualified. All
automatically detected compounds listed as qualified with intensities more than 10 times the
blank sample value were considered as tentative detections.
Suspect Screening with RT Locked Method on GC-QTOF-MS
Suspect screening for GC-EI-QTOF-MS employed Agilent MassHunter Qualitative Analysis
software using a Find by Formula workflow similar to the LC-QTOF-MS workflow. The Agilent
GC/Q-TOF – Pesticide PCDL containing 750 pesticides with exact mass fragments and retention
times was used. In contrast to the LC-QTOF-MS workflow, the molecular ion was set as optional,
a retention time tolerance of ± 0.2 min was included and the minimum number of qualified
fragments was two.
12

3 RESULTS
3.1 Target Compound Analysis
Limits of quantification for the target compounds on the samples collected in this study ranged
from 1-25 ng/L for most pyrethroids; exceptions were permethrin (≤125 ng/L) phenothrin (≤500
ng/L), and tetramethrin (≤1250 ng/L). Early in the study LC samples were injected without solid
phase extraction for some sampling events (June) resulting in relatively high LOQ values (0.25
25 µg/L) for LC compounds (propoxur, pyriproxyfen, novaluron, and imidacloprid). From July
onwards the method was adjusted to concentrate samples by at least 100 times, resulting in LOQ
values from 1 to 100 ng/L for the LC target compounds. The frequency of detections for the
target compounds in samples taken at various points in the sewer system (laterals), the
wastewater treatment plant influent, and the wastewater effluent over the course of the study are
summarized in Figure 2-1. Twelve target compounds were above the limits of quantitation in
influent/lateral samples in over half of the samples analyzed; six compounds were never above
quantitation limits and the remainder were detected in 1-50% of the samples. Among the 12
compounds most frequently detected, half were synthetic pyrethroids (permethrin, deltamethrin,
cypermethrin, cyhalothrin, cyfluthrin, and bifenthrin), one is a neonicitinoid (imidacloprid), and
the remainder were fipronil and four of its degradation products (fipronil amide, fipronil-sulfide,
fipronil-sulfone, and fipronil-desulfinyl). Fipronil-sulfide, fipronil-desulfinyl, and fipronil
desulfinyl amide were all detected more frequently in wastewater effluent samples than they
were in influent samples.
13
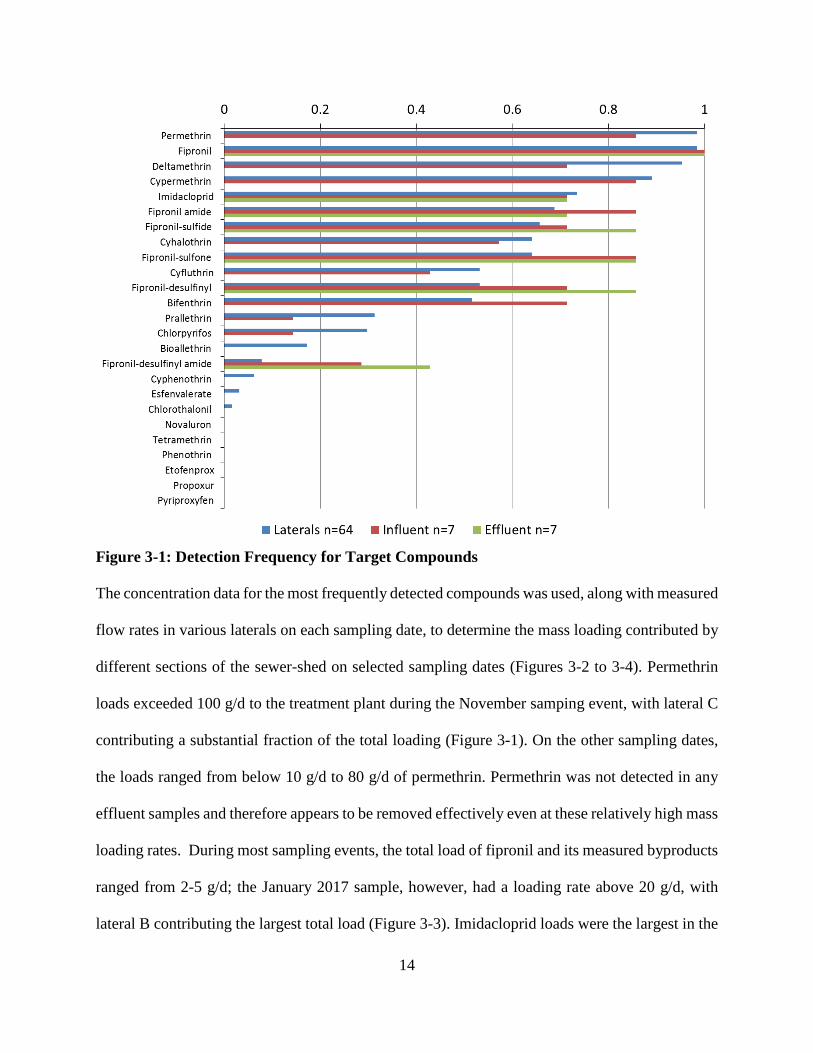
Figure 3-1: Detection Frequency for Target Compounds
The concentration data for the most frequently detected compounds was used, along with measured
flow rates in various laterals on each sampling date, to determine the mass loading contributed by
different sections of the sewer-shed on selected sampling dates (Figures 3-2 to 3-4). Permethrin
loads exceeded 100 g/d to the treatment plant during the November samping event, with lateral C
contributing a substantial fraction of the total loading (Figure 3-1). On the other sampling dates,
the loads ranged from below 10 g/d to 80 g/d of permethrin. Permethrin was not detected in any
effluent samples and therefore appears to be removed effectively even at these relatively high mass
loading rates. During most sampling events, the total load of fipronil and its measured byproducts
ranged from 2-5 g/d; the January 2017 sample, however, had a loading rate above 20 g/d, with
lateral B contributing the largest total load (Figure 3-3). Imidacloprid loads were the largest in the
14

May and June 2016 samples (~7-10 g/d) with the highest loads contributed by laterals D and E;
loads were generally less than 4 g/d the remainder of the year, with far lower loads in November
and January (Figure 3-4).
Figure 3-2 Spatial and temporal changes in Permethrin mass loads across different sewer laterals
Figure 3-3 Spatial and temporal changes in the mass load of Fipronil and its measured byproducts across different sewer laterals
15
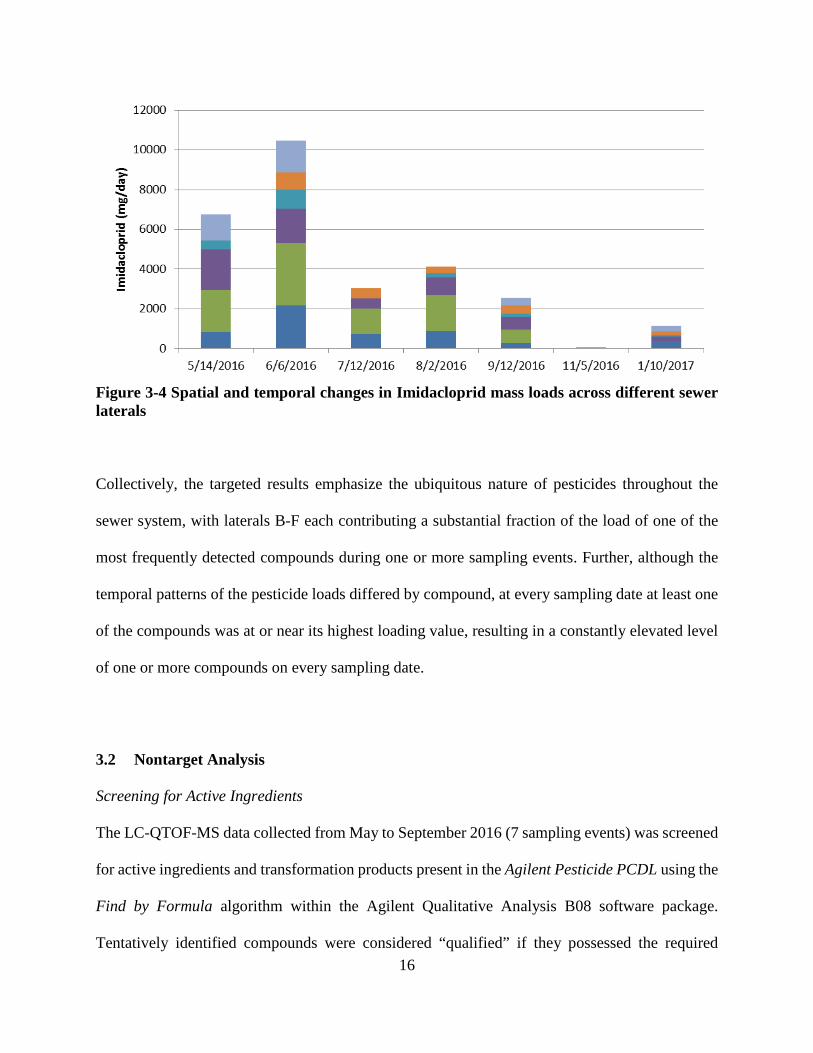
Figure 3-4 Spatial and temporal changes in Imidacloprid mass loads across different sewer laterals
Collectively, the targeted results emphasize the ubiquitous nature of pesticides throughout the
sewer system, with laterals B-F each contributing a substantial fraction of the load of one of the
most frequently detected compounds during one or more sampling events. Further, although the
temporal patterns of the pesticide loads differed by compound, at every sampling date at least one
of the compounds was at or near its highest loading value, resulting in a constantly elevated level
of one or more compounds on every sampling date.
3.2 Nontarget Analysis
Screening for Active Ingredients
The LC-QTOF-MS data collected from May to September 2016 (7 sampling events) was screened
for active ingredients and transformation products present in the Agilent Pesticide PCDL using the
Find by Formula algorithm within the Agilent Qualitative Analysis B08 software package.
Tentatively identified compounds were considered “qualified” if they possessed the required 16
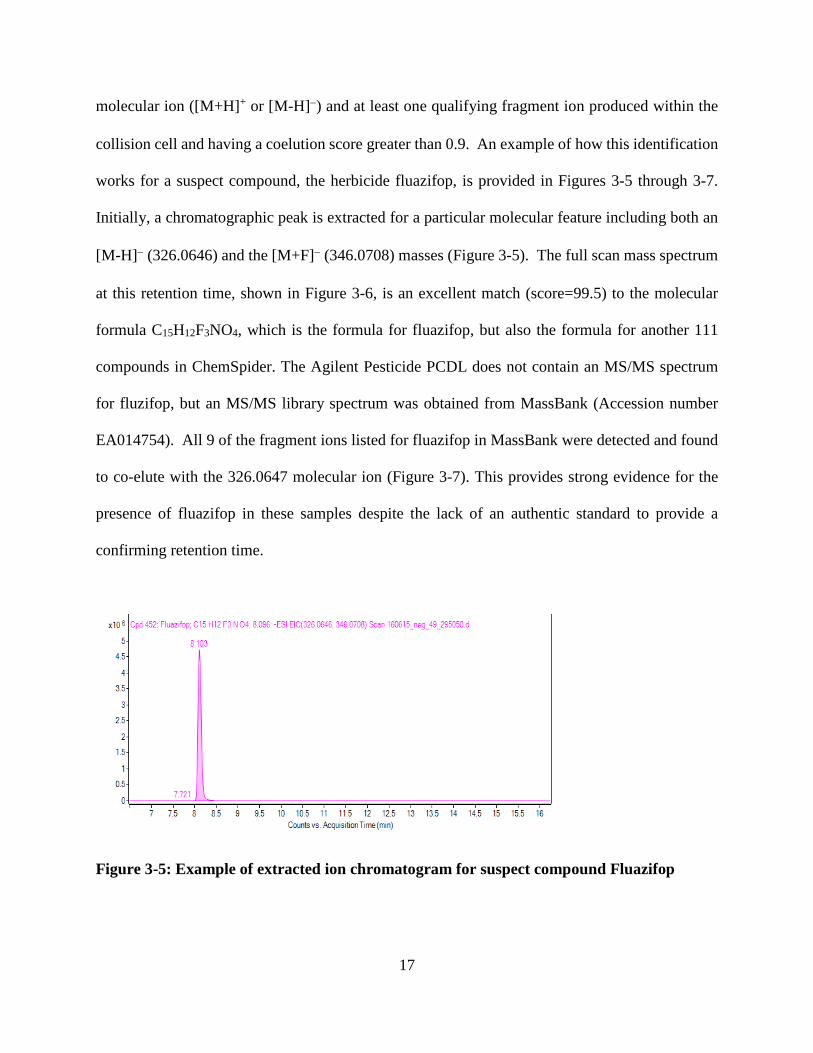
molecular ion ([M+H]+ or [M-H]−) and at least one qualifying fragment ion produced within the
collision cell and having a coelution score greater than 0.9. An example of how this identification
works for a suspect compound, the herbicide fluazifop, is provided in Figures 3-5 through 3-7.
Initially, a chromatographic peak is extracted for a particular molecular feature including both an
[M-H]− (326.0646) and the [M+F]− (346.0708) masses (Figure 3-5). The full scan mass spectrum
at this retention time, shown in Figure 3-6, is an excellent match (score=99.5) to the molecular
formula C15H12F3NO4, which is the formula for fluazifop, but also the formula for another 111
compounds in ChemSpider. The Agilent Pesticide PCDL does not contain an MS/MS spectrum
for fluzifop, but an MS/MS library spectrum was obtained from MassBank (Accession number
EA014754). All 9 of the fragment ions listed for fluazifop in MassBank were detected and found
to co-elute with the 326.0647 molecular ion (Figure 3-7). This provides strong evidence for the
presence of fluazifop in these samples despite the lack of an authentic standard to provide a
confirming retention time.
Figure 3-5: Example of extracted ion chromatogram for suspect compound Fluazifop
17

Figure 3-6: Isotope pattern for suspected compound fluazifop
Figure 3-7: Coelution of MS/MS fragments from Fluazifop
Similar screening approaches were applied across all of the ESI+ and ESI- LC-QTOF-MS data
collected from May-September, and a summary of the findings related to detection frequencies is
provided in Figure 3-8. The most commonly detected compounds were pharmaceuticals such as
gemfibrozil, diclofenac and sulfamethoxazole. Some of the compounds identified using the
suspect screening workflow were also among the target compounds. Both fipronil and
imidacloprid were qualified as detections via suspect screening, but in both cases the detection
frequency is lower than in the targeted analysis of the same data. This is an expected finding
18
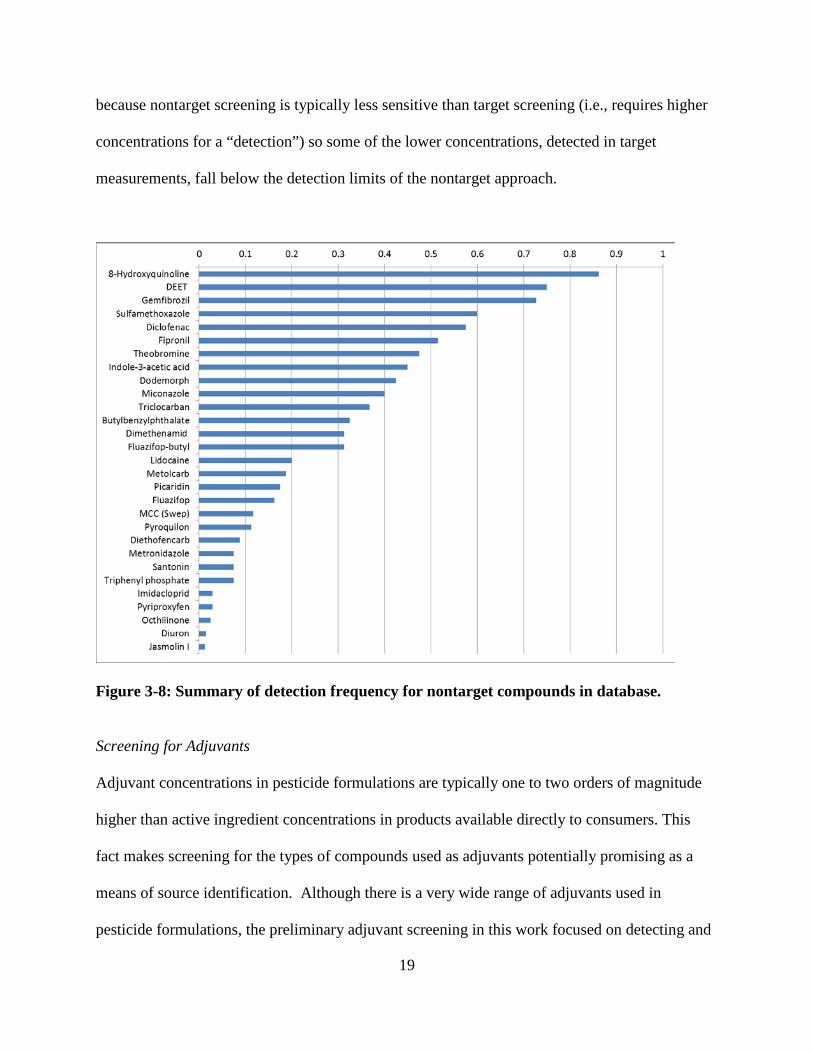
because nontarget screening is typically less sensitive than target screening (i.e., requires higher
concentrations for a “detection”) so some of the lower concentrations, detected in target
measurements, fall below the detection limits of the nontarget approach.
Figure 3-8: Summary of detection frequency for nontarget compounds in database.
Screening for Adjuvants
Adjuvant concentrations in pesticide formulations are typically one to two orders of magnitude
higher than active ingredient concentrations in products available directly to consumers. This
fact makes screening for the types of compounds used as adjuvants potentially promising as a
means of source identification. Although there is a very wide range of adjuvants used in
pesticide formulations, the preliminary adjuvant screening in this work focused on detecting and
19
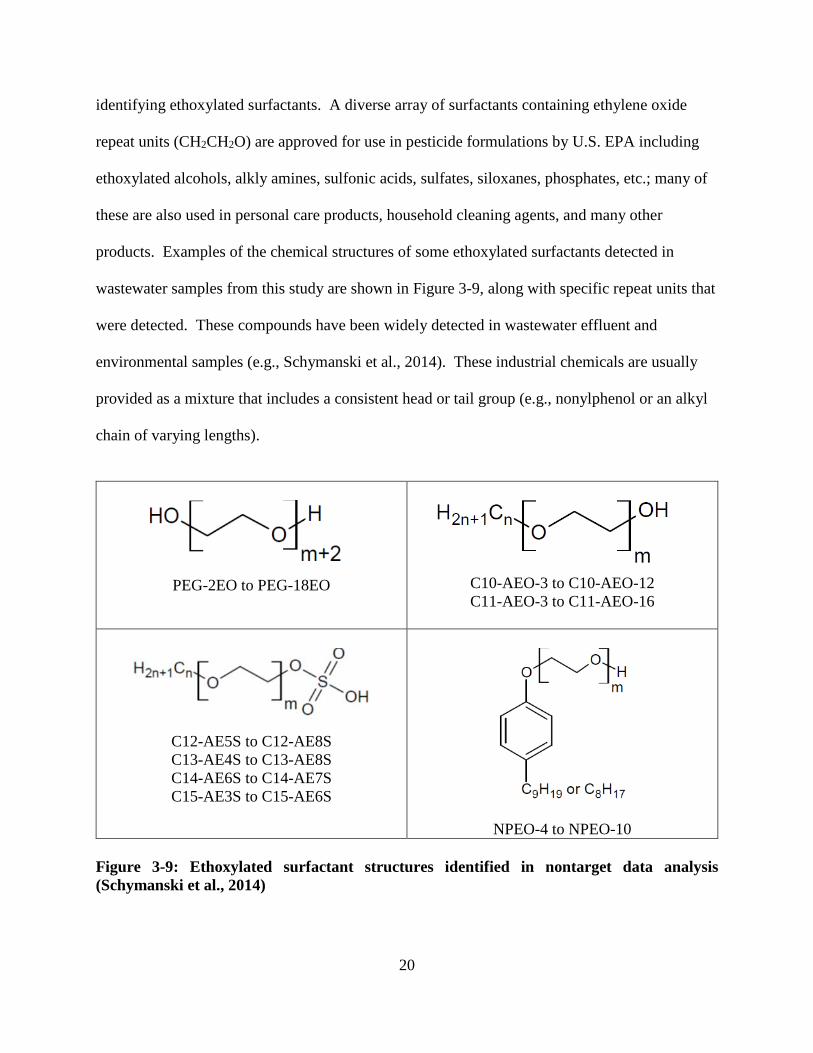
identifying ethoxylated surfactants. A diverse array of surfactants containing ethylene oxide
repeat units (CH2CH2O) are approved for use in pesticide formulations by U.S. EPA including
ethoxylated alcohols, alkly amines, sulfonic acids, sulfates, siloxanes, phosphates, etc.; many of
these are also used in personal care products, household cleaning agents, and many other
products. Examples of the chemical structures of some ethoxylated surfactants detected in
wastewater samples from this study are shown in Figure 3-9, along with specific repeat units that
were detected. These compounds have been widely detected in wastewater effluent and
environmental samples (e.g., Schymanski et al., 2014). These industrial chemicals are usually
provided as a mixture that includes a consistent head or tail group (e.g., nonylphenol or an alkyl
chain of varying lengths).
PEG-2EO to PEG-18EO C10-AEO-3 to C10-AEO-12 C11-AEO-3 to C11-AEO-16
C12-AE5S to C12-AE8S C13-AE4S to C13-AE8S C14-AE6S to C14-AE7S C15-AE3S to C15-AE6S
NPEO-4 to NPEO-10
Figure 3-9: Ethoxylated surfactant structures identified in nontarget data analysis (Schymanski et al., 2014)
20

The characteristic signature of ethoxylated surfactants in LC-QTOF-MS data is the appearance
of compounds with a regularly spaced difference in mass of 44.0252 amu and a consistent
pattern of difference in retention time as the chain length increases. An online version of the
software EnviHomolog (http://www.envihomolog.eawag.ch/index.php) was used to screen
wastewater influent data for the presence of homologous series with mass differences of between
44.0247 and 44.0257 amu and retention time differences of 20-120 seconds. Results of these
analyses are shown in Figure 3-10 and 3-11 for ESI- and ESI+, respectively. Each gray symbol
in the figure represents a molecular structure detected in the sample that is not part of an
ethoxylated series, while all symbols in colors other than gray represent potential ethoxylated
series. The compounds listed in Figure 3-9 represent only 8 of the 1777 of homologous series
detected in ESI- mode and the 1909 homologous series detected in ESI+ mode. Further efforts
would reduce the number of unidentified surfactants, but even in the absence of definitive
molecular identification, these patterns in these surfactant “fingerprints” offer one potential
means of obtaining information about pesticide sources.
21

Molecular mass (amu)
Figure 3-10: Ethoxylated surfactant analysis, ESI- data.
Molecular mass (amu)
Figure 3-11: Ethoxylated surfactant analysis, ESI+ data.
22
4 REFERENCES
Markle, J.C. van Buuren, B.H., Moran, K. and Barefoot, A.C. “Pyrethroid Pesticides in Municipal
Wastewater: A Baseline Survey of Publicly Owned Treatment Works Facilities in California in
2013,” in Jones et al.; Describing the Behavior and Effects of Pesticides in Urban and
Agricultural Settings, ACS Symposium Series; American Chemical Society: Washington, DC,
2014.
Moschet, C.; Lew, B.M.; Hasenbein, S.; Anumol, T.: Young, T.M. “LC- and GC-QTOF-MS as
Complementary Tools for a Comprehensive Micropollutant Analysis in Aquatic Systems,”
Environmental Science and Technology, 2017, 51: 1553-1561.
Parry, E. and Young, T.M. “Distribution of pyrethroid insecticides in secondary wastewater effluent,”
Environmental Toxicology and Chemistry, 2013, 32: 2686-2694.
Schymanski, E.L., Singer, H.P. Longrée, P., Loos, M., Ruff, M., Stravs, M.A., Vidal, C.R., and
Hollender, J. “Strategies to Characterize Polar Organic Contamination in Wastewater: Exploring
the Capability of High Resolution Mass Spectrometry,” Environmental Science and
Technology, 2014, 48: 1811−1818.
Weston, D.P. and Lydy, M.J. “Urban and Agricultural Sources of Pyrethroid Insecticides to
the Sacramento-San Joaquin Delta of California,” Environmental Science and
Technology, 2010, 44: 1833–1840.
23
Top Related