


Languages
Pages
Legal

Analysis of the HIV Epidemic in the Highest Burden Countries
Debbi Birx, MD Director, Division of Global HIV/AIDS
Center for Global Health US Centers for Disease Control & Prevention
1

State of the Epidemic Remembering how far we have come, celebrating success & being guided by the data
2
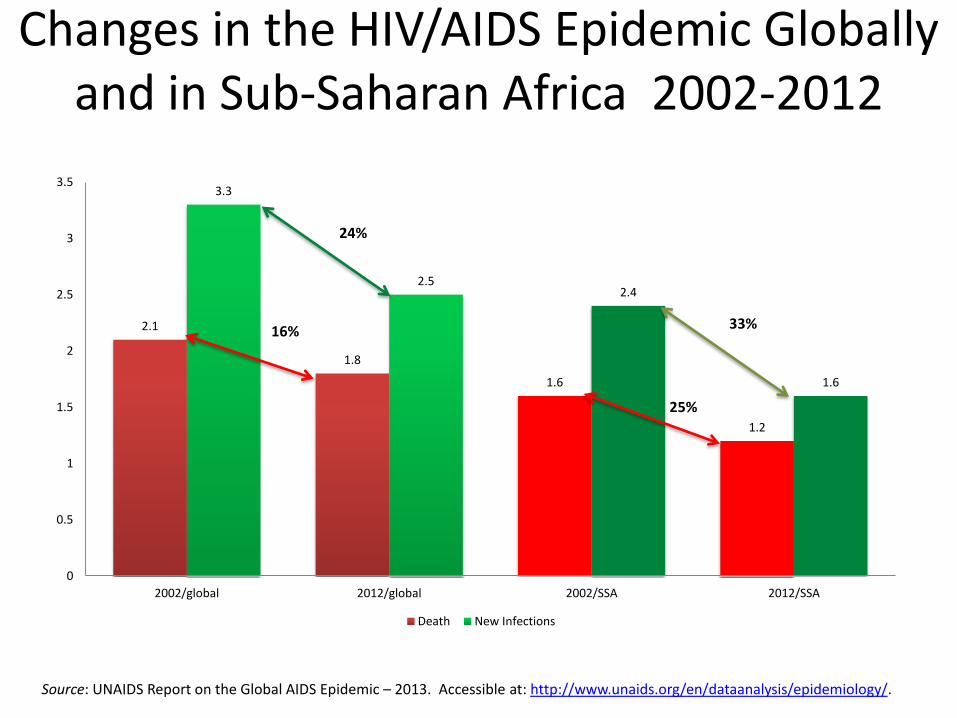
Changes in the HIV/AIDS Epidemic Globally and in Sub-Saharan Africa 2002-2012
2.1
1.8
1.6
1.2
3.3
2.5 2.4
1.6
0
0.5
1
1.5
2
2.5
3
3.5
2002/global 2012/global 2002/SSA 2012/SSA
Death New Infections
24%
33% 16%
25%
Source: UNAIDS Report on the Global AIDS Epidemic – 2013. Accessible at: http://www.unaids.org/en/dataanalysis/epidemiology/.
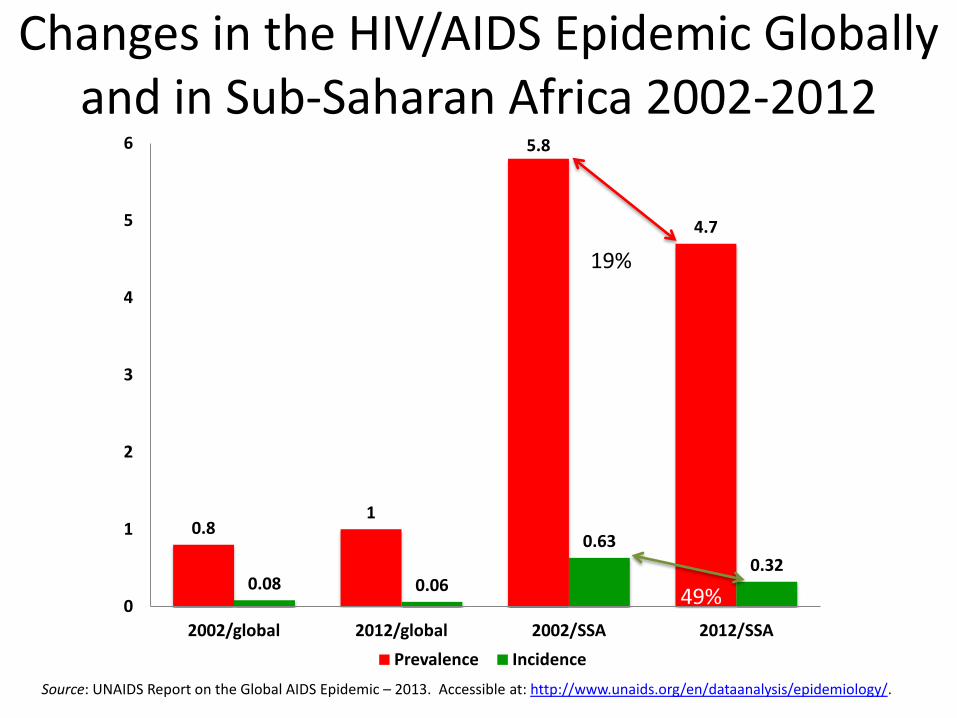
0.8 1
5.8
4.7
0.08 0.06
0.63
0.32
0
1
2
3
4
5
6
2002/global 2012/global 2002/SSA 2012/SSA
Prevalence Incidence
Changes in the HIV/AIDS Epidemic Globally and in Sub-Saharan Africa 2002-2012
19%
49%
Source: UNAIDS Report on the Global AIDS Epidemic – 2013. Accessible at: http://www.unaids.org/en/dataanalysis/epidemiology/.
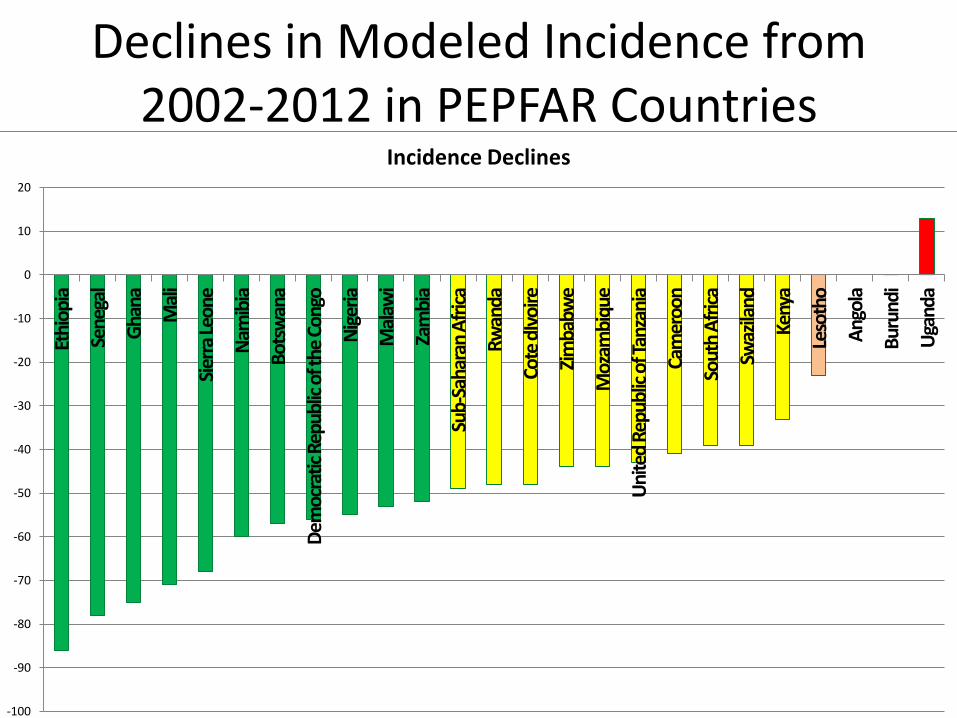
Declines in Modeled Incidence from 2002-2012 in PEPFAR Countries
-100
-90
-80
-70
-60
-50
-40
-30
-20
-10
0
10
20
Ethi
opia
Sene
gal
Gha
na
Mal
i
Sier
ra L
eone
Nam
ibia
Bot
swan
a
Dem
ocra
tic R
epub
lic o
f the
Con
go
Nig
eria
Mal
awi
Zam
bia
Sub-
Saha
ran
Afr
ica
Rwan
da
Cote
dIv
oire
Zim
babw
e
Moz
ambi
que
Uni
ted
Repu
blic
of T
anza
nia
Cam
eroo
n
Sout
h A
fric
a
Swaz
iland
Keny
a
Leso
tho
Ang
ola
Bur
undi
Uga
nda
Incidence Declines

A Country Comparisons Southern Africa : High Prevalence HIV-1 C Epidemics
6

Source: UNAIDS Report on the Global AIDS Epidemic – 2013. Accessible at: http://www.unaids.org/en/dataanalysis/epidemiology/.
0
20,000
40,000
60,000
80,000
100,000
120,000
140,000
160,000
180,000
19
90
19
91
19
92
1
99
3
19
94
1
99
5
19
96
19
97
19
98
19
99
20
00
20
01
20
02
20
03
20
04
20
05
20
06
20
07
20
08
20
09
20
10
20
11
20
12
Mozambique Estimated Annual New HIV Infections & AIDS Deaths
0
20,000
40,000
60,000
80,000
100,000
120,000
140,000
160,000
180,000
1990 1992 1994 1996 1998 2000 2002 2004 2006 2008 2010 2012
Malawi Estimated Annual New HIV Infections & AIDS Deaths
AIDS Deaths
New Infections
7

B Country Comparisons
East Africa : Moderate Prevalence HIV-1 A,C,D subtypes and Unique Recombinants
8
0
40,000
80,000
120,000
160,000
200,000
240,000
280,000
320,000
19
90
19
91
19
92
19
93
19
94
19
95
19
96
19
97
19
98
19
99
20
00
20
01
20
02
20
03
20
04
20
05
20
06
20
07
20
08
20
09
20
10
20
11
20
12
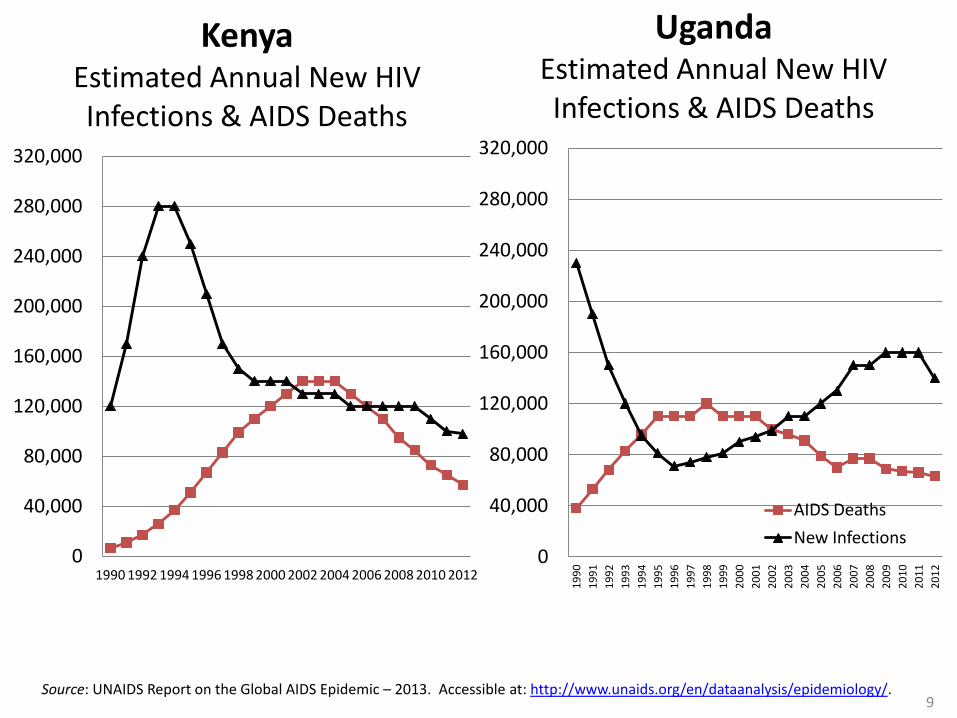
Uganda Estimated Annual New HIV Infections & AIDS Deaths
AIDS Deaths
New Infections
Source: UNAIDS Report on the Global AIDS Epidemic – 2013. Accessible at: http://www.unaids.org/en/dataanalysis/epidemiology/.
0
40,000
80,000
120,000
160,000
200,000
240,000
280,000
320,000
1990 1992 1994 1996 1998 2000 2002 2004 2006 2008 2010 2012
Kenya Estimated Annual New HIV Infections & AIDS Deaths
9
c Epidemiologic Impact of Services Comparing service scale-up in West & West Central, Eastern, & Southern Africa with HIV incidence
10
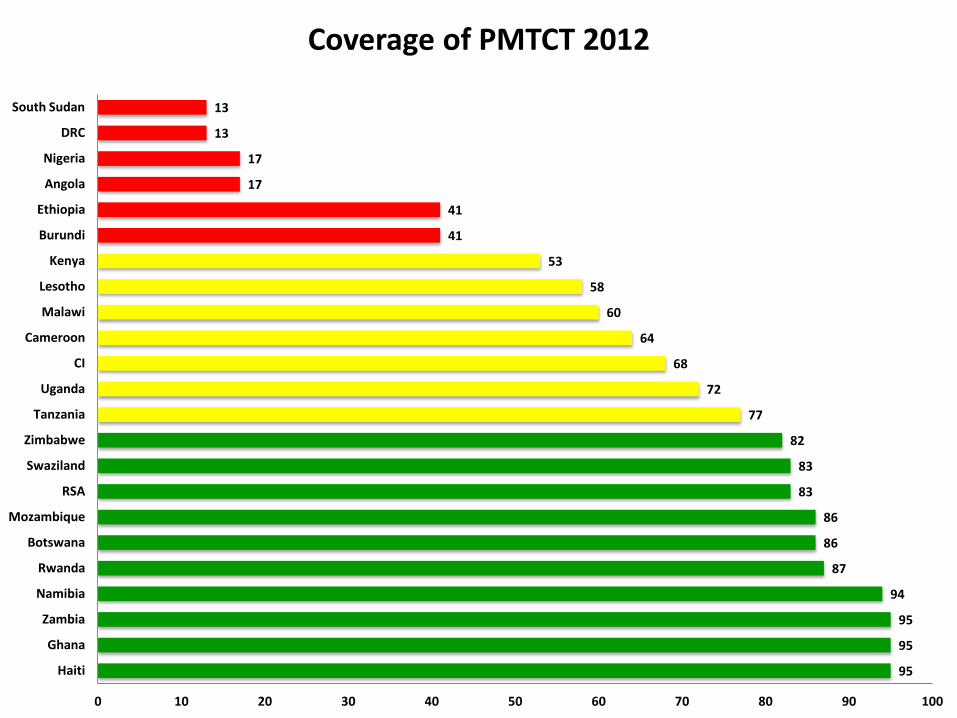
Coverage of PMTCT 2012
95
95
95
94
87
86
86
83
83
82
77
72
68
64
60
58
53
41
41
17
17
13
13
0 10 20 30 40 50 60 70 80 90 100
Haiti
Ghana
Zambia
Namibia
Rwanda
Botswana
Mozambique
RSA
Swaziland
Zimbabwe
Tanzania
Uganda
CI
Cameroon
Malawi
Lesotho
Kenya
Burundi
Ethiopia
Angola
Nigeria
DRC
South Sudan
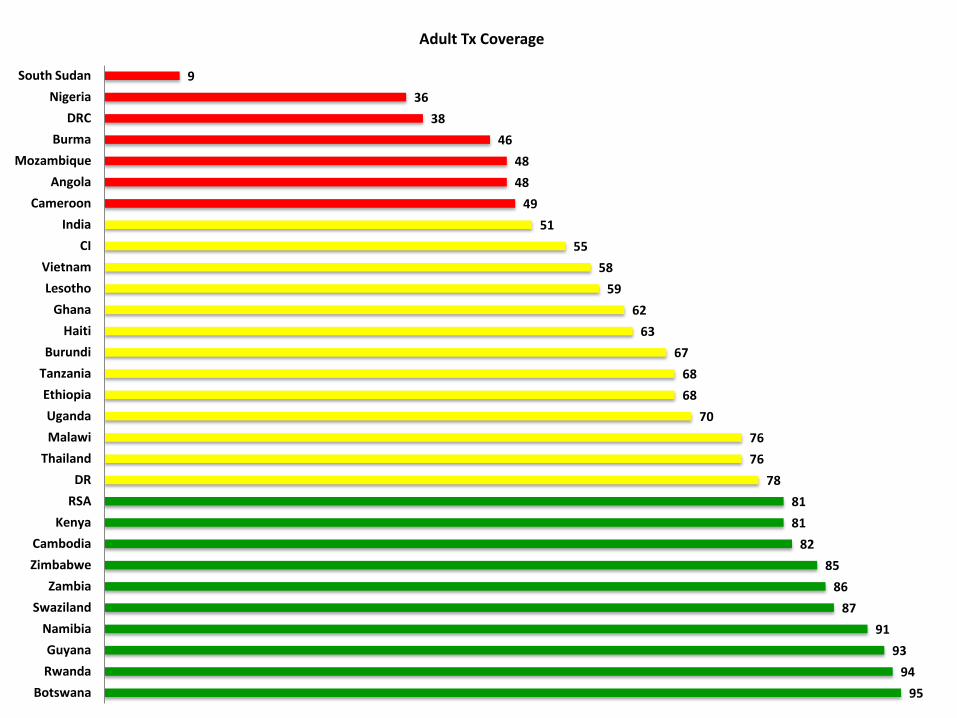
95
94
93
91
87
86
85
82
81
81
78
76
76
70
68
68
67
63
62
59
58
55
51
49
48
48
46
38
36
9
Botswana
Rwanda
Guyana
Namibia
Swaziland
Zambia
Zimbabwe
Cambodia
Kenya
RSA
DR
Thailand
Malawi
Uganda
Ethiopia
Tanzania
Burundi
Haiti
Ghana
Lesotho
Vietnam
CI
India
Cameroon
Angola
Mozambique
Burma
DRC
Nigeria
South Sudan
Adult Tx Coverage

Implementing for Impact – Programmatic and Epidemiologic
13
Botswana HIV Epidemic Data
Declining New Infections & Mortality
14

1990 1991 1992 1993 1994 1995 1996 1997 1998 1999 2000 2001 2002 2003 2004 2005 2006 2007 2008 2009 2010 2011
AIDS Deaths 900 1000 2000 3000 4000 6000 8000 10000 12000 14000 16000 18000 20000 20000 18000 15000 12000 10000 9000 7000 5000 4000
New Infections 15000 19000 23000 28000 31000 33000 34000 34000 33000 31000 29000 27000 25000 22000 19000 16000 14000 13000 12000 10000 9000 9000
0
5000
10000
15000
20000
25000
30000
35000
40000
Botswana Estimated Annual New HIV Infections & AIDS Deaths
Source: UNAIDS Report on the Global AIDS Epidemic – 2012. Accessible at: http://www.unaids.org/en/dataanalysis/epidemiology/. 15
16
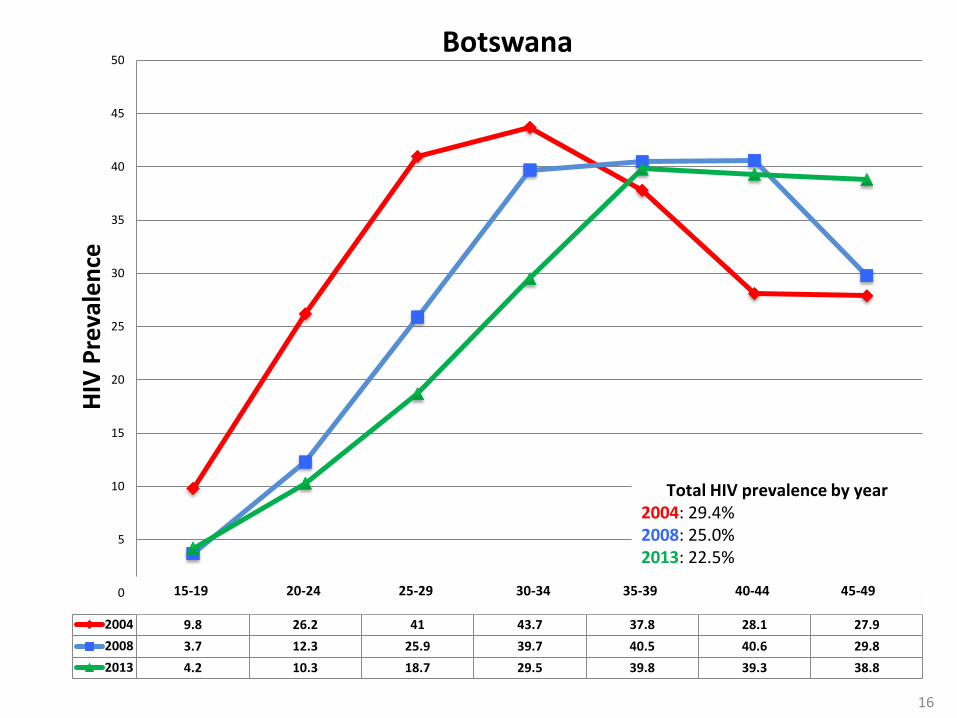
1 2 3 4 5 6 7
2004 9.8 26.2 41 43.7 37.8 28.1 27.9
2008 3.7 12.3 25.9 39.7 40.5 40.6 29.8
2013 4.2 10.3 18.7 29.5 39.8 39.3 38.8
0
5
10
15
20
25
30
35
40
45
50
HIV
Pre
vale
nce
Botswana
Total HIV prevalence by year 2004: 29.4% 2008: 25.0% 2013: 22.5%
15-19 20-24 25-29 30-34 35-39 40-44 45-49
Kenya HIV Epidemic Data
Declining New Infections and Decreasing Mortality
17
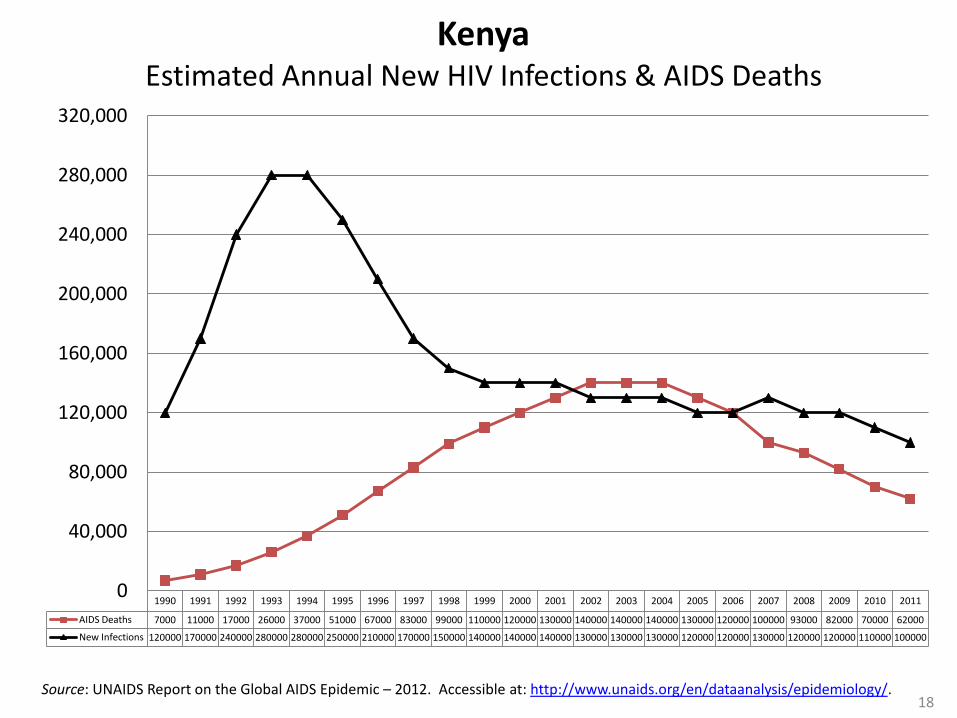
1990 1991 1992 1993 1994 1995 1996 1997 1998 1999 2000 2001 2002 2003 2004 2005 2006 2007 2008 2009 2010 2011
AIDS Deaths 7000 11000 17000 26000 37000 51000 67000 83000 99000 110000 120000 130000 140000 140000 140000 130000 120000 100000 93000 82000 70000 62000
New Infections 120000 170000 240000 280000 280000 250000 210000 170000 150000 140000 140000 140000 130000 130000 130000 120000 120000 130000 120000 120000 110000 100000
0
40,000
80,000
120,000
160,000
200,000
240,000
280,000
320,000
Kenya Estimated Annual New HIV Infections & AIDS Deaths
Source: UNAIDS Report on the Global AIDS Epidemic – 2012. Accessible at: http://www.unaids.org/en/dataanalysis/epidemiology/. 18

KAIS 2012 Preliminary Report Key Findings
19
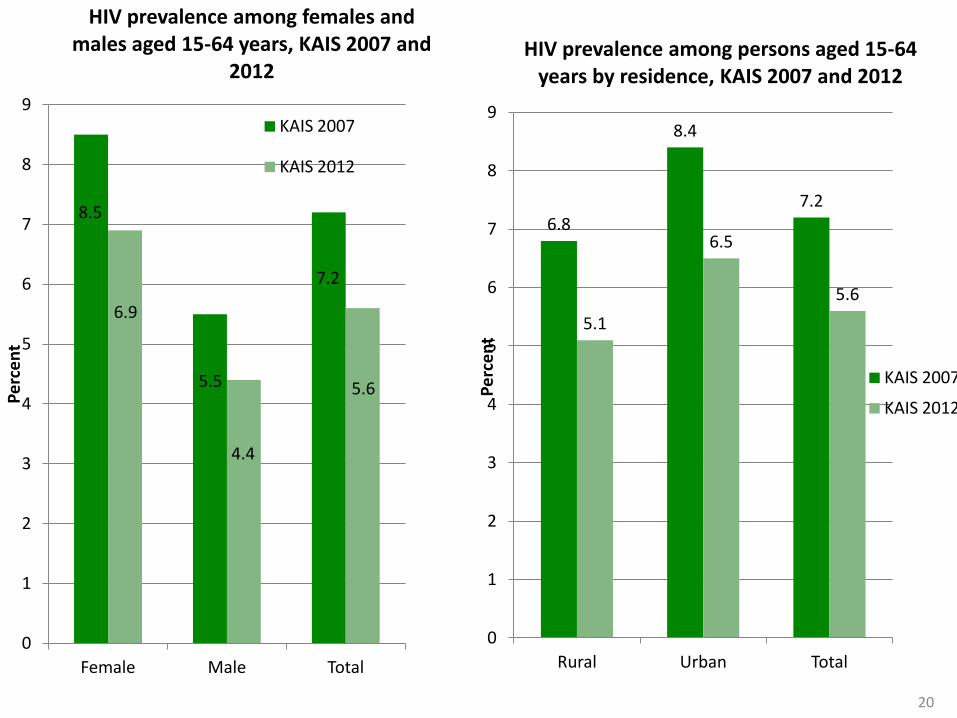
8.5
5.5
7.2
6.9
4.4
5.6
0
1
2
3
4
5
6
7
8
9
Female Male Total
Pe
rce
nt
HIV prevalence among females and males aged 15-64 years, KAIS 2007 and
2012
KAIS 2007
KAIS 2012
20
6.8
8.4
7.2
5.1
6.5
5.6
0
1
2
3
4
5
6
7
8
9
Rural Urban Total
Pe
rce
nt
HIV prevalence among persons aged 15-64 years by residence, KAIS 2007 and 2012
KAIS 2007
KAIS 2012
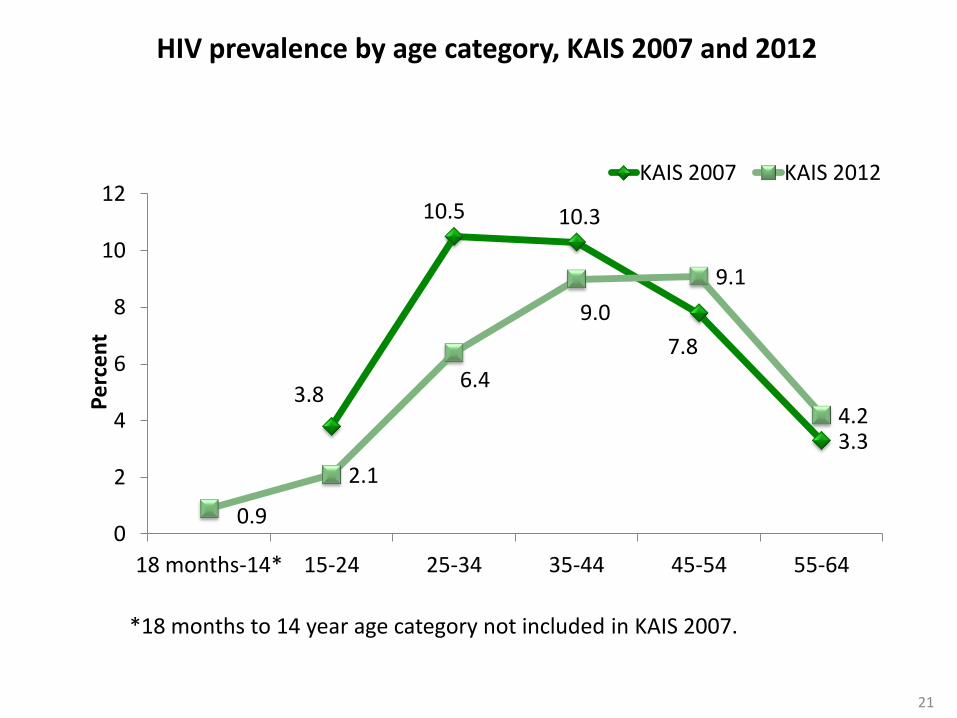
3.8
10.5 10.3
7.8
3.3
0.9
2.1
6.4
9.0
9.1
4.2
0
2
4
6
8
10
12
18 months-14* 15-24 25-34 35-44 45-54 55-64
Pe
rce
nt
KAIS 2007 KAIS 2012
*18 months to 14 year age category not included in KAIS 2007.
HIV prevalence by age category, KAIS 2007 and 2012
21
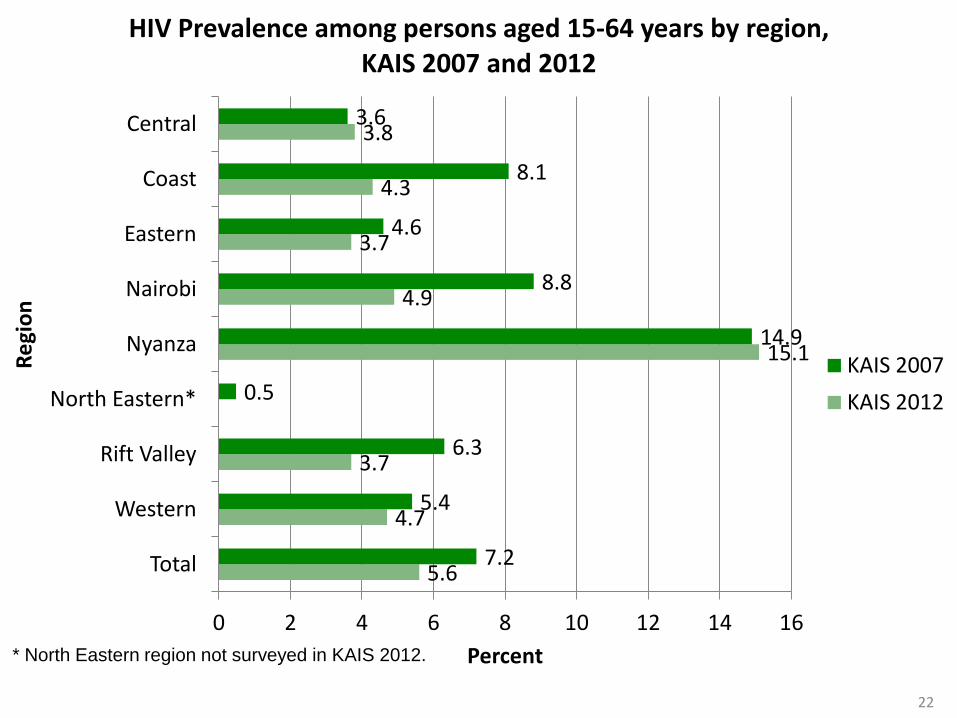
5.6
4.7
3.7
15.1
4.9
3.7
4.3
3.8
7.2
5.4
6.3
0.5
14.9
8.8
4.6
8.1
3.6
0 2 4 6 8 10 12 14 16
Total
Western
Rift Valley
North Eastern*
Nyanza
Nairobi
Eastern
Coast
Central
Percent
Re
gio
n
HIV Prevalence among persons aged 15-64 years by region, KAIS 2007 and 2012
KAIS 2007
KAIS 2012
* North Eastern region not surveyed in KAIS 2012.
22
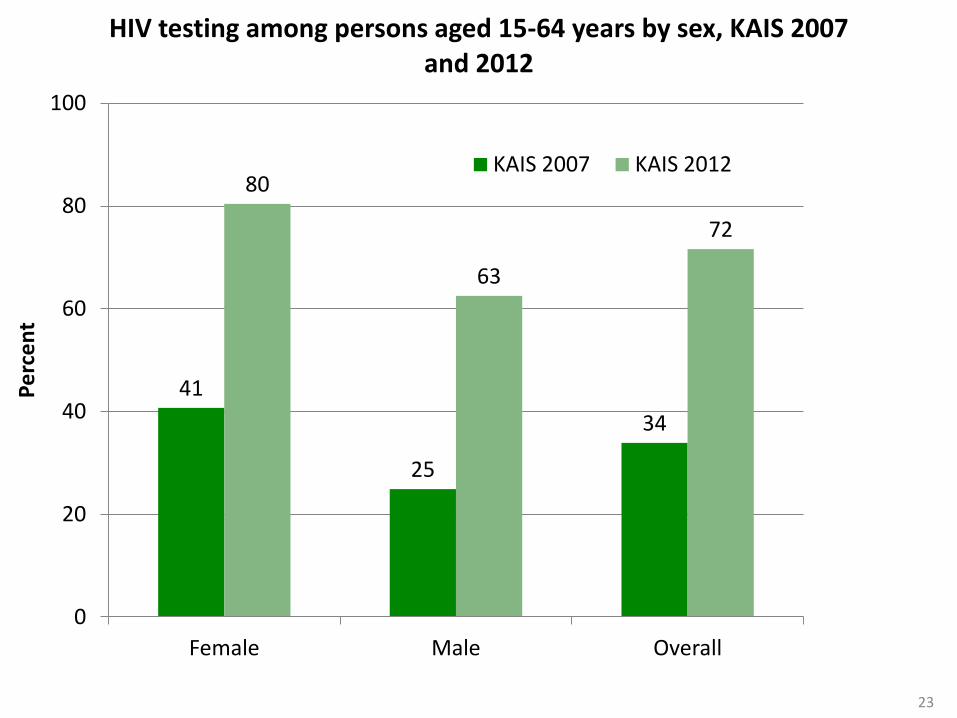
41
25
34
80
63
72
0
20
40
60
80
100
Female Male Overall
Pe
rce
nt
HIV testing among persons aged 15-64 years by sex, KAIS 2007 and 2012
KAIS 2007 KAIS 2012
23

3.9 3.1
13.2
16.9
0
5
10
15
20
KAIS 2007 KAIS 2012
Pe
rce
nt
HIV prevalence among men aged 15-64 years by male circumcision status, KAIS 2007 and 2012
Circumcised Uncircumcised
24
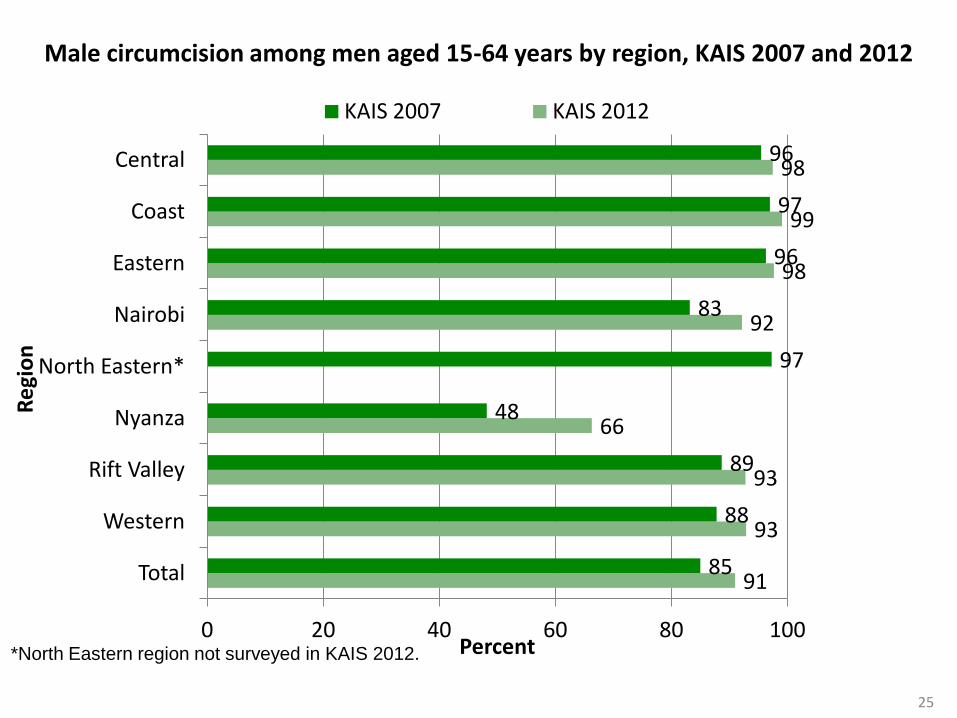
91
93
93
66
92
98
99
98
85
88
89
48
97
83
96
97
96
0 20 40 60 80 100
Total
Western
Rift Valley
Nyanza
North Eastern*
Nairobi
Eastern
Coast
Central
Percent
Re
gio
n
KAIS 2007 KAIS 2012
*North Eastern region not surveyed in KAIS 2012.
Male circumcision among men aged 15-64 years by region, KAIS 2007 and 2012
25
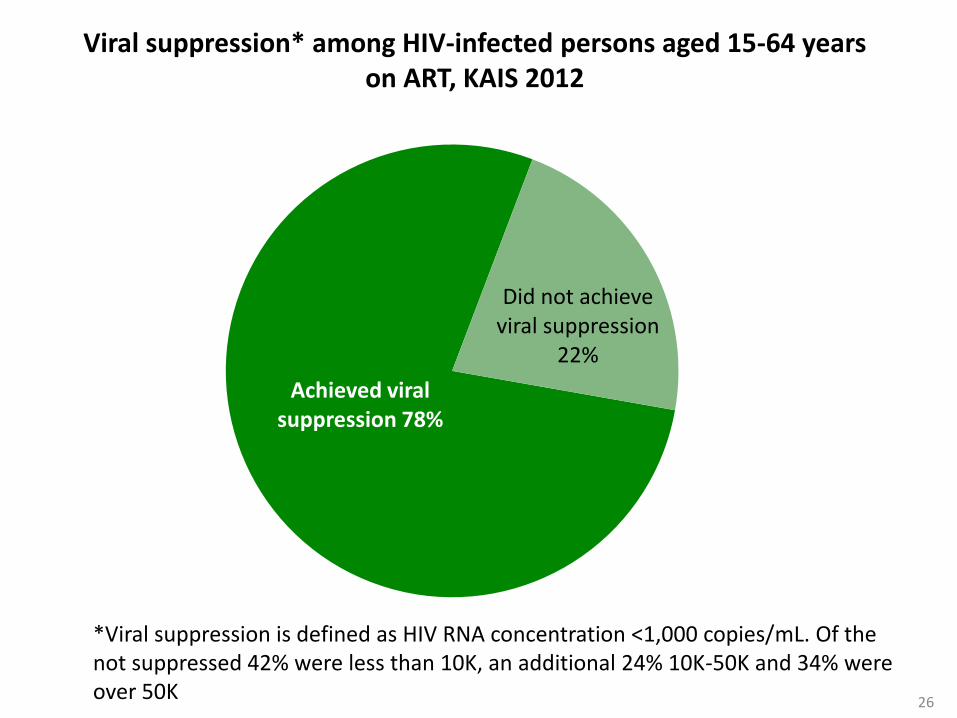
Viral suppression* among HIV-infected persons aged 15-64 years on ART, KAIS 2012
Achieved viral suppression 78%
Did not achieve viral suppression
22%
*Viral suppression is defined as HIV RNA concentration <1,000 copies/mL. Of the not suppressed 42% were less than 10K, an additional 24% 10K-50K and 34% were over 50K
26
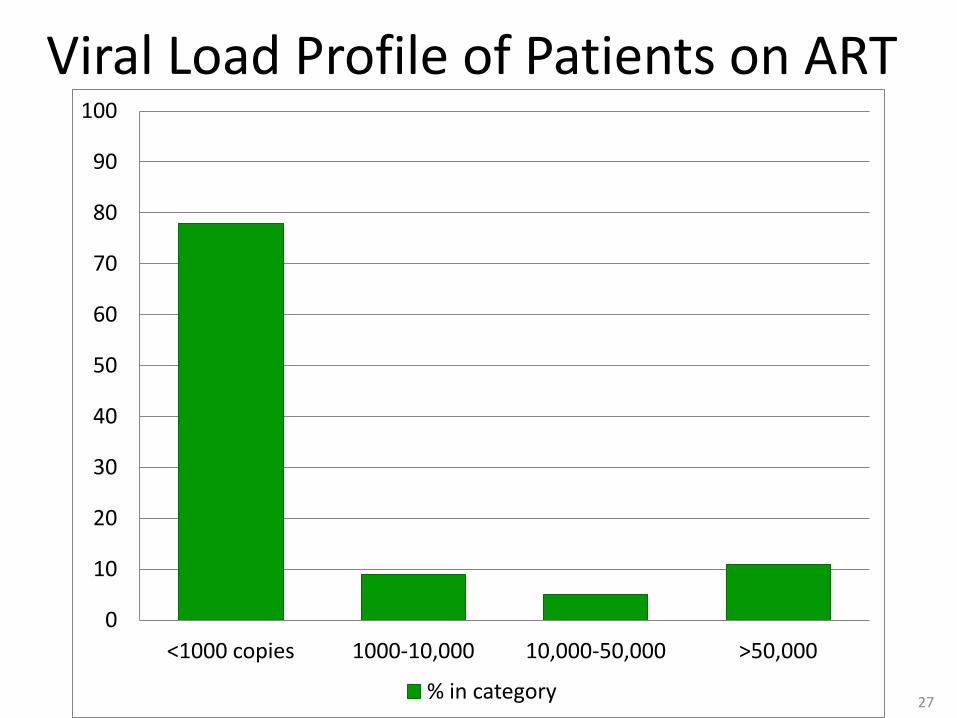
Viral Load Profile of Patients on ART
27
0
10
20
30
40
50
60
70
80
90
100
<1000 copies 1000-10,000 10,000-50,000 >50,000
% in category

2000 2001 2002 2003 2004 2005 2006 2007 2008 2009 2010 2011 2012
With ART 0.52 0.52 0.51 0.5 0.49 0.46 0.42 0.37 0.34 0.3 0.26 0.22 0.19
Without ART 0.52 0.52 0.51 0.5 0.49 0.48 0.46 0.44 0.42 0.41 0.39 0.37 0.36
0
0.1
0.2
0.3
0.4
0.5
0.6
With ART Without ART
Kenya Goals model estimate of adult (15-49) incidence with and without
ART
“This suggests that ART has reduced incidence by almost half in 2012 and that about half of the estimated incidence decline since 2004 has been due to the scale up of ART programs.” Stover et al
28

0
20,000
40,000
60,000
80,000
100,000
120,000
2000 2001 2002 2003 2004 2005 2006 2007 2008 2009 2010 2011 2012
With ART Without ART
Kenya Number of new HIV infections with and without the ART program
29

Progress is not equal and disease burden must be addressed
30
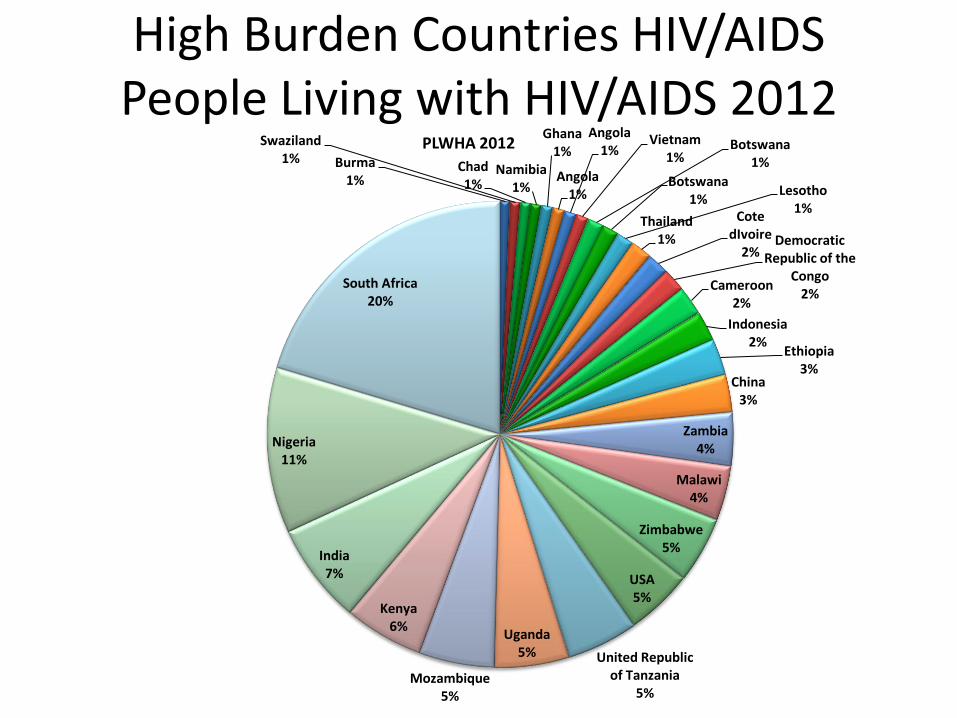
High Burden Countries HIV/AIDS People Living with HIV/AIDS 2012
Burma 1%
Swaziland 1%
Chad 1%
Namibia 1%
Ghana 1%
Angola 1%
Angola 1%
Vietnam 1%
Botswana 1%
Botswana 1%
Lesotho 1%
Thailand 1%
Cote dIvoire
2% Democratic
Republic of the Congo
2% Cameroon
2%
Indonesia 2%
Ethiopia 3%
China 3%
Zambia 4%
Malawi 4%
Zimbabwe 5%
USA 5%
United Republic of Tanzania
5%
Uganda 5%
Mozambique 5%
Kenya 6%
India 7%
Nigeria 11%
South Africa 20%
PLWHA 2012
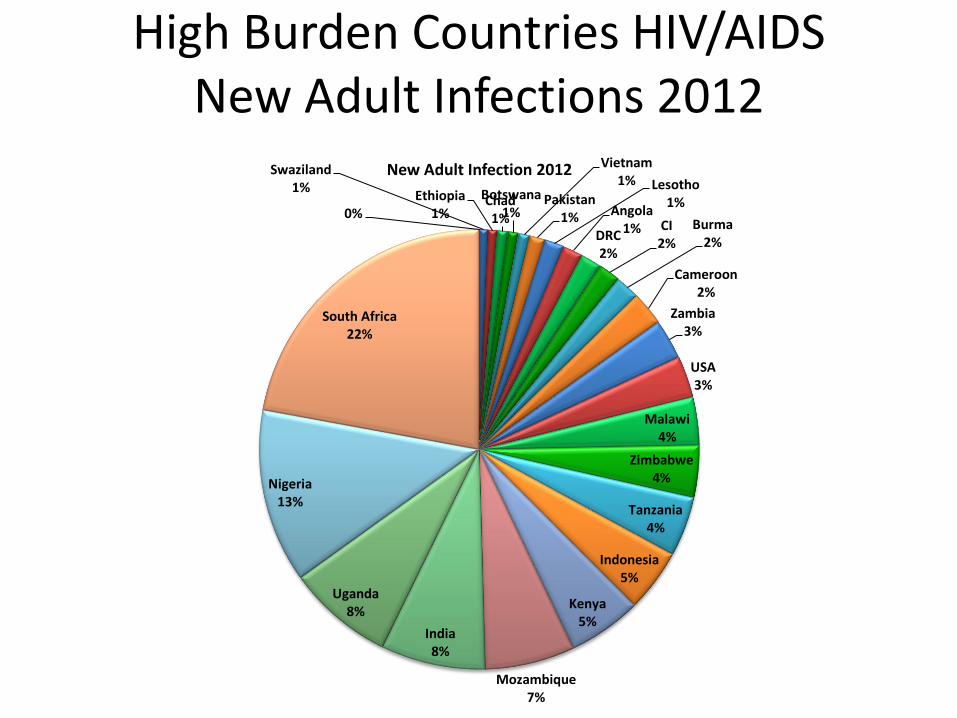
High Burden Countries HIV/AIDS New Adult Infections 2012
Swaziland 1%
Ethiopia 1%
Chad 1%
Botswana 1%
Vietnam 1%
Pakistan 1%
Lesotho 1%
Angola 1% DRC
2%
CI 2%
Burma 2%
Cameroon 2%
Zambia 3%
USA 3%
Malawi 4%
Zimbabwe 4%
Tanzania 4%
Indonesia 5%
Kenya 5%
Mozambique 7%
India 8%
Uganda 8%
Nigeria 13%
South Africa 22%
0%
New Adult Infection 2012
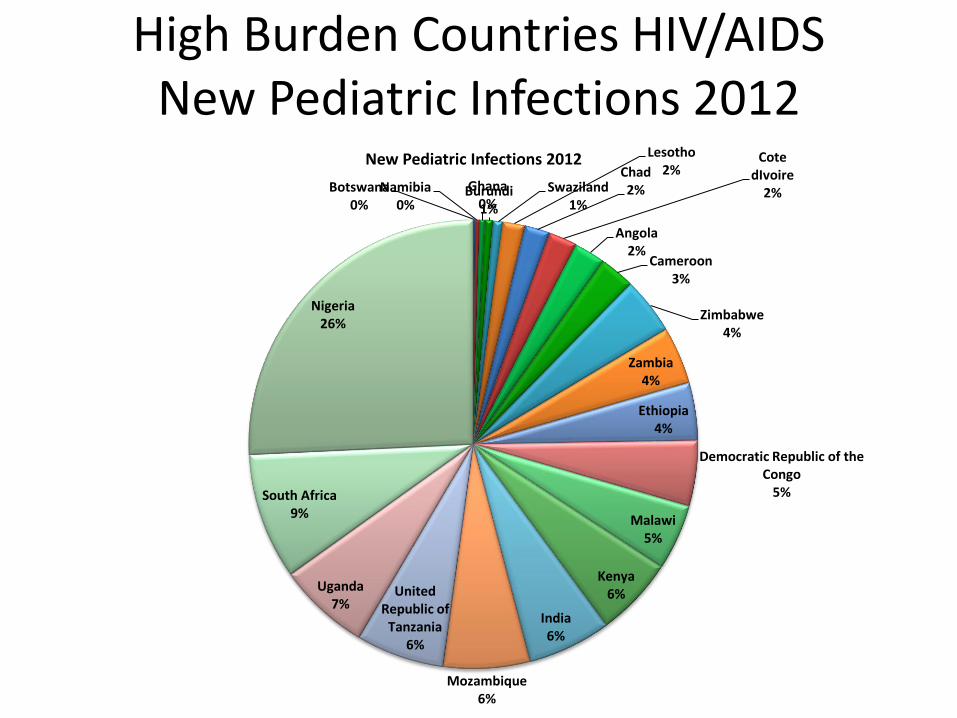
High Burden Countries HIV/AIDS New Pediatric Infections 2012
Botswana 0%
Namibia 0%
Ghana 0%
Burundi 1%
Swaziland 1%
Lesotho 2% Chad
2%
Cote dIvoire
2%
Angola 2%
Cameroon 3%
Zimbabwe 4%
Zambia 4%
Ethiopia 4%
Democratic Republic of the Congo
5%
Malawi 5%
Kenya 6%
India 6%
Mozambique 6%
United Republic of
Tanzania 6%
Uganda 7%
South Africa 9%
Nigeria 26%
New Pediatric Infections 2012

High Burden Countries HIV/AIDS HIV/AIDS Deaths 2012
Ghana 1%
Vietnam 1% Burma
1% Ghana
1%
0%
Angola 1%
South Sudan 1%
Chad 1%
Lesotho 1%
USA 1%
Ukraine 1%
Thailand 1% Indonesia
2% Cote
d'Ivoire 2% DRC
2% Cameroon 2%
Malawi 3%
Ethiopia 3%
Kenya 4%
Uganda 4%
Zambia 4%
Mozambique 5%
Tanzania 5% India
8%
India 9%
Zimbabwe 9%
South Africa 14%
Nigeria 15%
AIDS Deaths 2012

Summary
Comprehensive package of prevention package appropriate for the risk groups, country, epidemic Must be country specific
Provide depth and breadth of messages to ensure all clients can make informed decisions – continuous dialogue – complete dialogue Lessons learned from
• VMMC
• MAT
• B+
ART initiation – importance of VL and long term potential of inflammation in areas of other endemic infectious diseases
Barriers to access – fluid and maybe community specific
Dialogue with MoF, MoH, CBOs, NGOs and individuals – again complete dialogue Clarity in epidemic
Words matter and “hot spot” can be very stigmatizing
Top Related