


Languages
Pages
Legal

Analysis of tandem mass spectra - I
Prof. William Stafford NobleGENOME 541
Intro to Computational Molecular Biology

Outline
• Tandem mass spectrometry overview• Peptide identification
– De novo– Peptide database search– Spectrum database search
• Score calibration• Statistical confidence estimation
Mass spectrometry background

EAMPK
GDIFYPGYCPDVK
LPLENENQGK
ASVYNSFVSNGVK
YVMTFK
ENQGVVNR

Peptide fragmentation

Peptide fragmentation spectrum
m/z
Intensity
VVVTGLGMLSPVGNTVESTWK +2
1304.4+1
888.14+1


EAMPK
EAMPK
EAMPK EAMPK
EAMPKEAMPK
EAMPK
EAMPK
EAMPK?
Our first goal is to identify each spectrum

Peptide identification
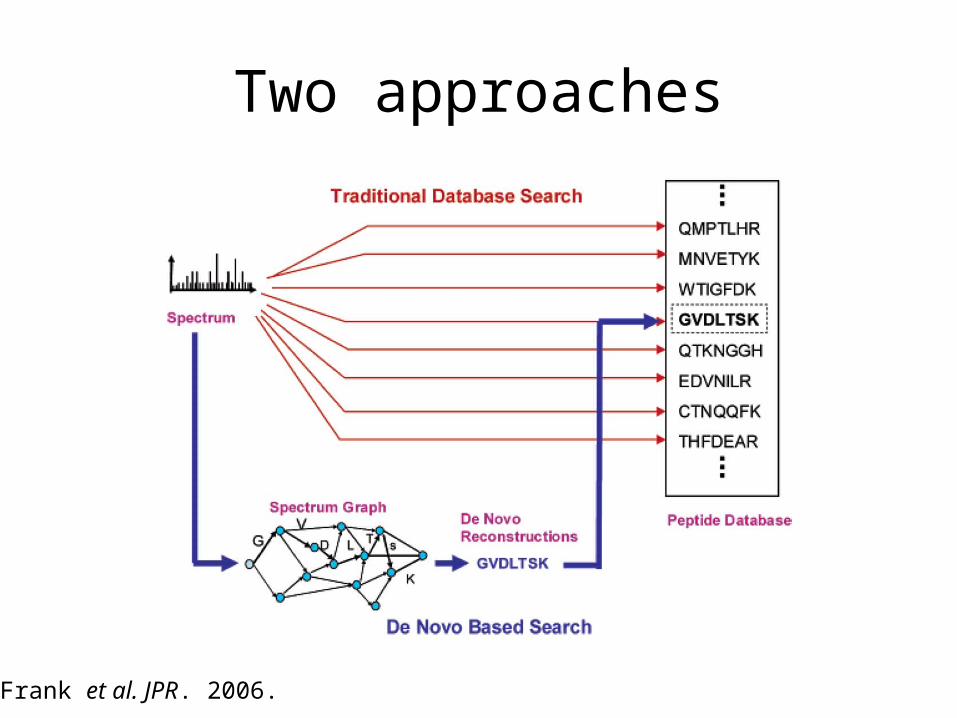
Two approaches
Frank et al. JPR. 2006.

The peptide can be inferred using pairs of nearby peaks
IYEVEGMR

The spectrum graph considers all possible peptides
Frank et al. JPR. 2006.

What are the pros and cons of the de novo approach?
+ Dynamic programming can quickly find peptides that fit a given spectrum graph.
- Many real spectra don’t yield a very good spectrum graph.+ It is possible to match against a noisy spectrum by allowing missing
peaks.- If you allow lots of missing peaks, then the DP is slow and leads to
many false positive matches.- If instead you search a database, you limit the number of possible
false positives.- In practice, the de novo approach does not identify many spectra.+ The de novo approach is the only one that can find previously
unknown peptides.
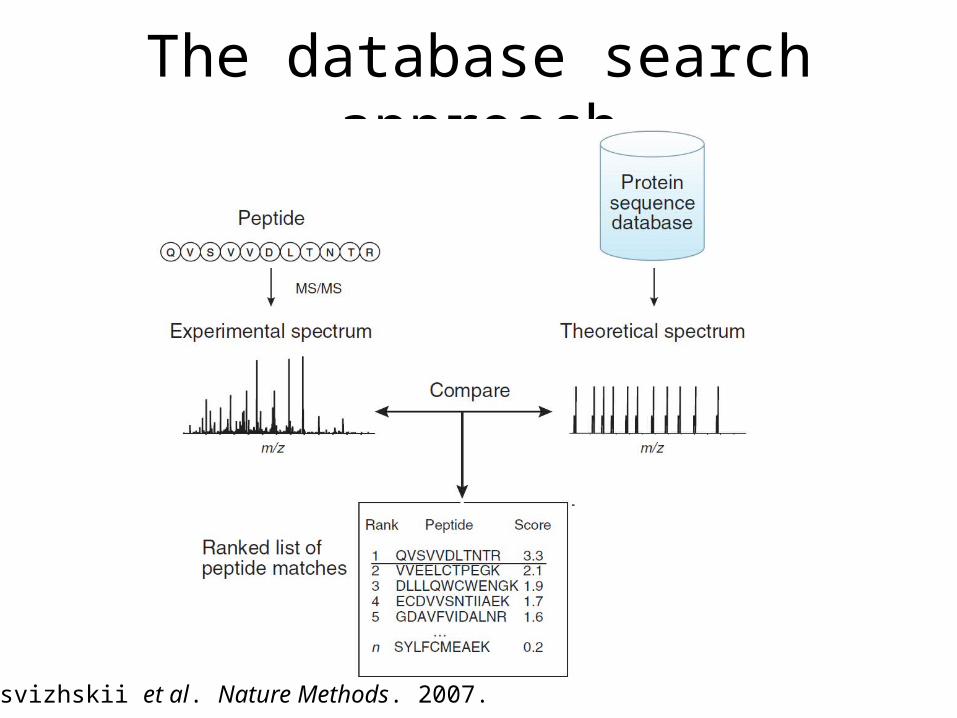
The database search approach
Nesvizhskii et al. Nature Methods. 2007.

0
10
20
30
40
50
60
SEQUEST theoretical spectrum
y-ion, charge 1 b-ion, charge 2
flanks
H2O lossNH3 loss
a-ion

16-60
-40
-20
0
20
40
60Theoretical Peaks
Observed Peaks

SEQUEST cross-correlation score
• Define Ri as the scalar product of the two spectra, with one offset by i.
• The score, called XCorr, is R0 minus the average Ri for i in -75, …, 75.
75
750
1
151
1
ii
n
jijji
RRX
yxR
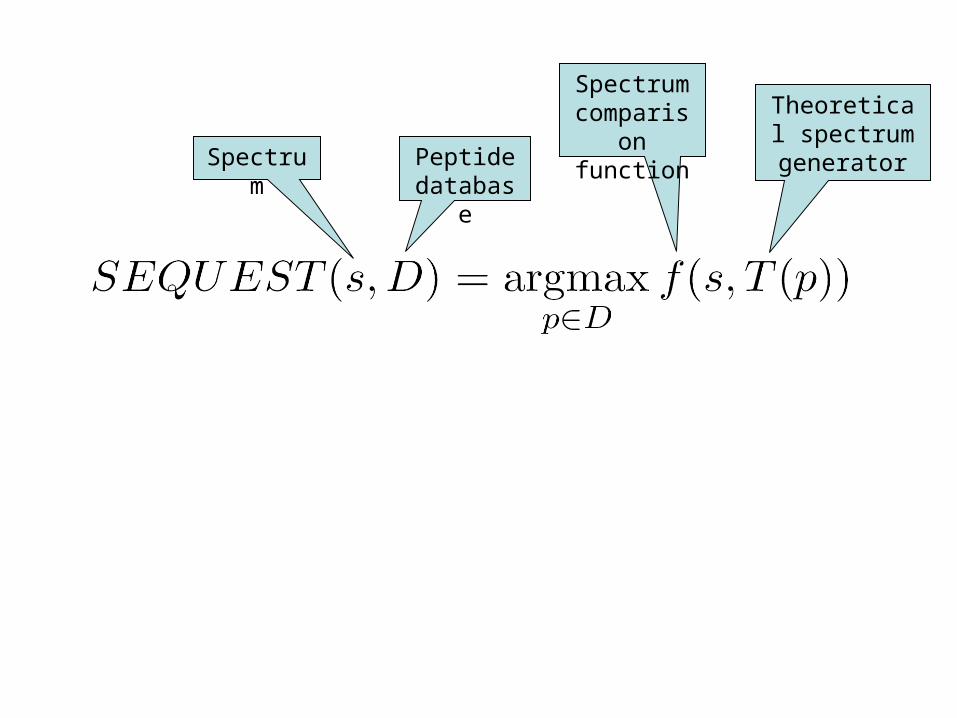
Spectrum Peptide database
Spectrum comparison
function
Theoretical spectrum generator

The X!Tandem hyperscore
Number of matched b-ions
Number of matched y-ions Boolean: Is the peak at
m/z value i a b- or y-ion?
Intensity of the peak at m/z value i
n
iiiyb PINNHyperscore
0
!!

A third approach to identifying spectra
1. De novo identification
2. Search against a database of theoretical spectra
3. Search against a database of previously observed, identified spectra

Spectrum Identification
Database: fasta file
…
SEQUESTPeptide ID list
Ab
un
da
nce
m/z
Ab
un
da
nce
m/z
Ab
un
da
nce
m/z
>MEKK1 (kinase)MDRILARMKKSTRRGGDKNITPVRRLERR…
>ATMKK5 (kinase kinase)MKPIQSPSGVASPMKNRLRKRPDLSPPLPHRDVALAVLP…
MS/MS query spectra
ID proteins from
peptides…
Scan1 0.7 EGSSDEEVP…Scan1 0.3 TFAEILNPI…Scan1 0.2 ARFDLNNHD…-------------------Scan2 0.5 EDEESIRAV…Scan2 0.2 WLGDDCFMV…Scan2 0.1 IDRAAWKAV…-------------------Scan3 0.2 EITTRDMGN…Scan3 0.1 GRNMCTAKL…
BiblioSpec
Ab
un
da
nce
m/z
Ab
un
da
nce
m/z
Ab
un
da
nce
m/z
3 NGISLTIVR
3 QWDKEPPR
2 FMACSDEK
Ab
un
da
nce
m/z
Ab
un
da
nce
m/z
1 CGCCLYNT
2 GDTIENFK
Library of identified spectra

Spectrum Identification
SEQUESTPeptide ID list
Ab
un
da
nce
m/z
Ab
un
da
nce
m/z
Ab
un
da
nce
m/z
MS/MS query spectra
Scan1 0.7 EGSSDEEVP…Scan1 0.3 TFAEILNPI…Scan1 0.2 ARFDLNNHD…-------------------Scan2 0.5 EDEESIRAV…Scan2 0.2 WLGDDCFMV…Scan2 0.1 IDRAAWKAV…-------------------Scan3 0.2 EITTRDMGN…Scan3 0.1 GRNMCTAKL…
BiblioSpec
Ab
un
da
nce
m/z
Ab
un
da
nce
m/z
Ab
un
da
nce
m/z
3 NGISLTIVR
3 QWDKEPPR
2 FMACSDEK
Ab
un
da
nce
m/z
Ab
un
da
nce
m/z
1 CGCCLYNT
2 GDTIENFK
Library of identified spectra765.1
940.4
593.9
300.4
522.3
m/z 594.2
score = 0.2
What are the pros and cons of library searching?
+ Because the spectrum library contains peak intensity information, matching can be done accurately.
+ Library searching is faster than database searching.
J Library searching can only identify peptides that have been previously identified.
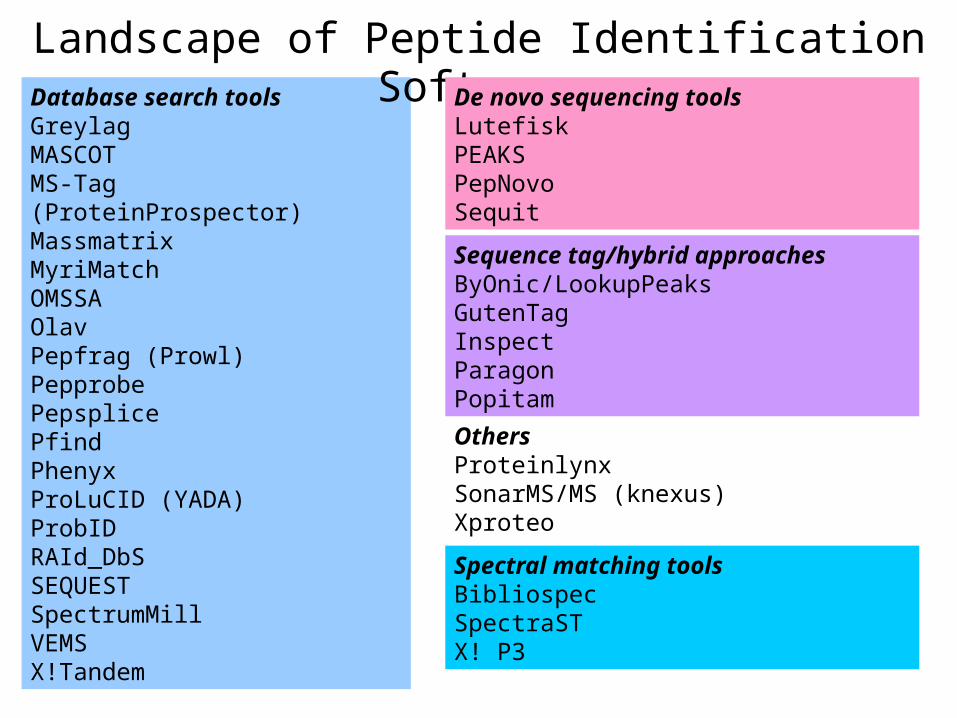
Database search toolsGreylagMASCOTMS-Tag (ProteinProspector)MassmatrixMyriMatchOMSSAOlavPepfrag (Prowl)PepprobePepsplicePfindPhenyxProLuCID (YADA)ProbIDRAId_DbSSEQUESTSpectrumMillVEMSX!Tandem
Landscape of Peptide Identification Software
Spectral matching toolsBibliospecSpectraSTX! P3
De novo sequencing toolsLutefiskPEAKSPepNovoSequit
Sequence tag/hybrid approachesByOnic/LookupPeaksGutenTagInspectParagonPopitam
OthersProteinlynxSonarMS/MS (knexus)Xproteo

Score calibration

Searching many spectra yields a set of peptide-spectrum matches
PSMs
Spectra
Pep
tides
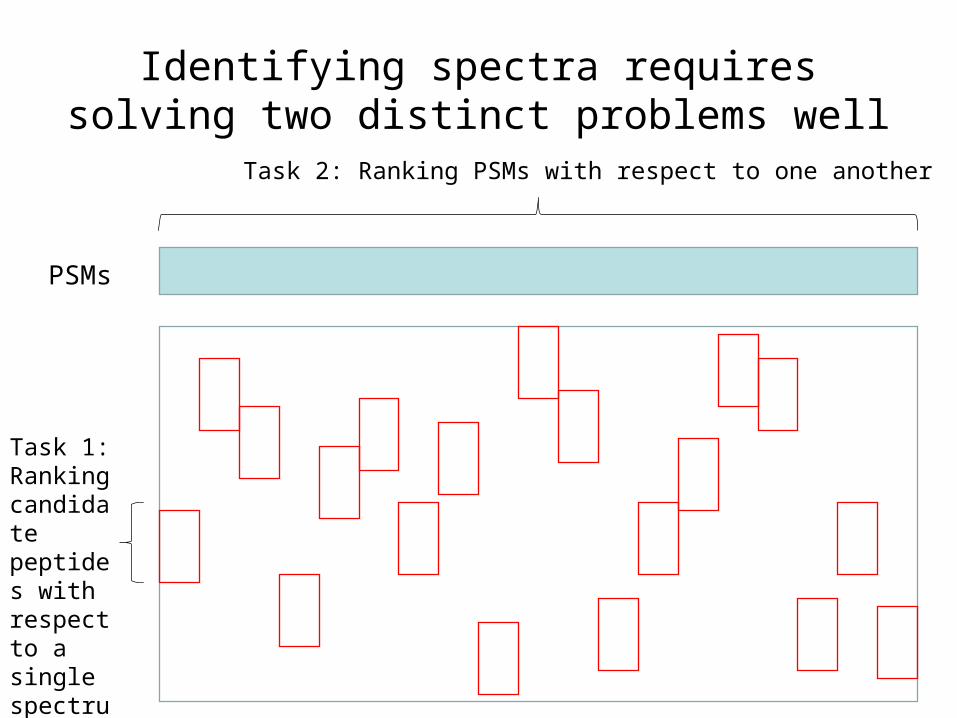
Identifying spectra requires solving two distinct problems well
PSMs
Task 1: Ranking candidate peptides with respect to a single spectrum
Task 2: Ranking PSMs with respect to one another
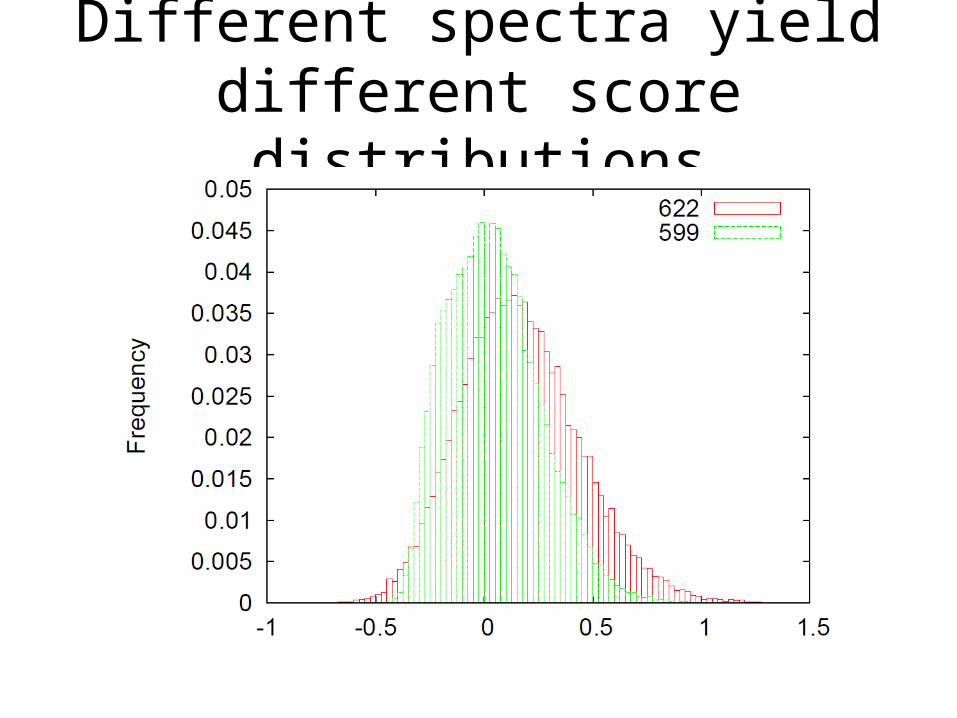
Different spectra yield different score distributions
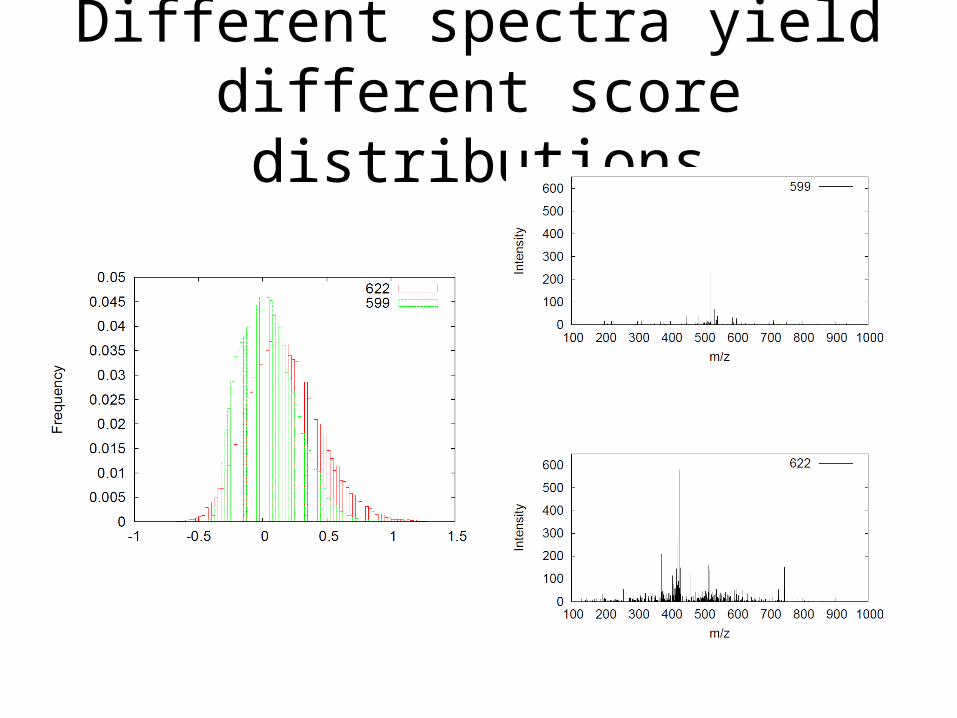
Different spectra yield different score distributions
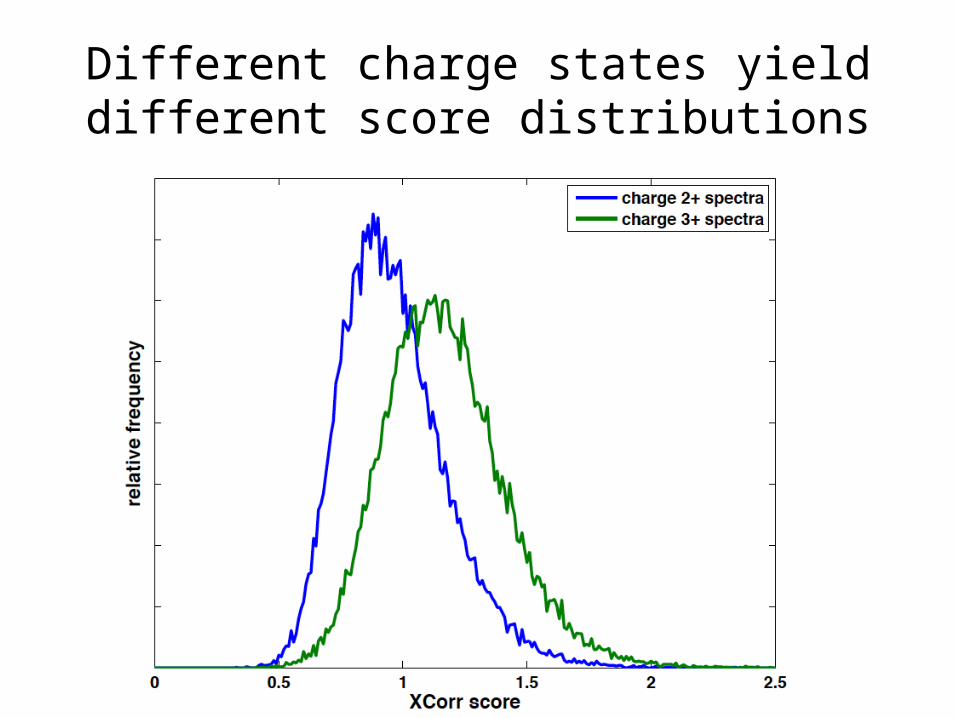
Different charge states yield different score distributions

Estimating a p-value can improve calibration
• The probability of observing a score >4 is the area under the curve to the right of 4.
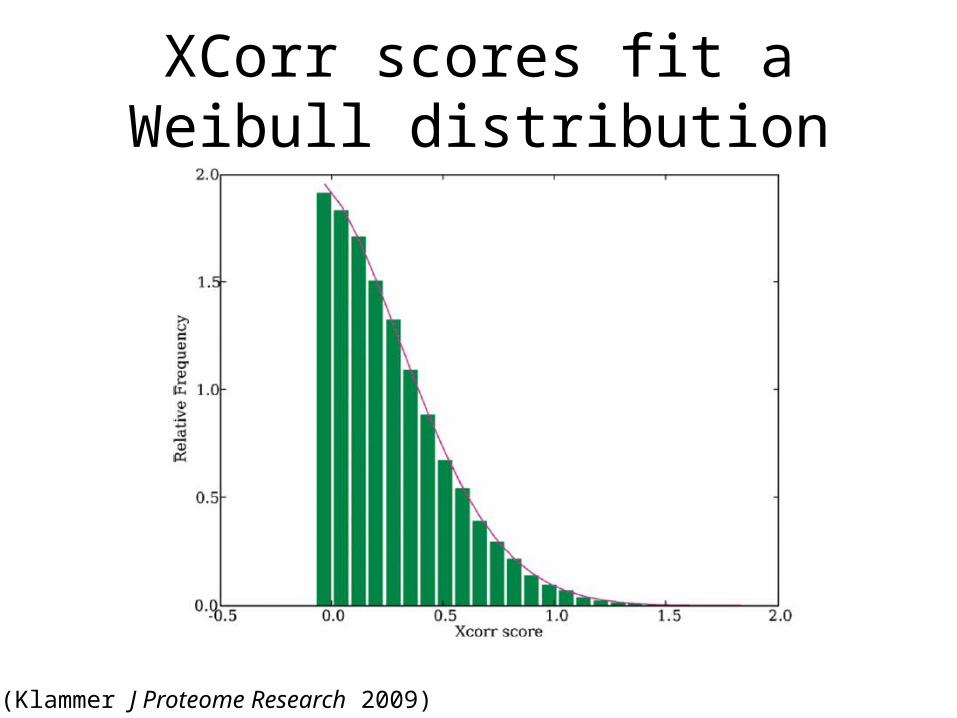
XCorr scores fit a Weibull distribution
(Klammer J Proteome Research 2009)

X!Tandem and Comet use a log linear fit
XCorr
log(
coun
t)
XCorr of 5 corresponds to
count of 10-5
(Eng J Proteome Research 2009)
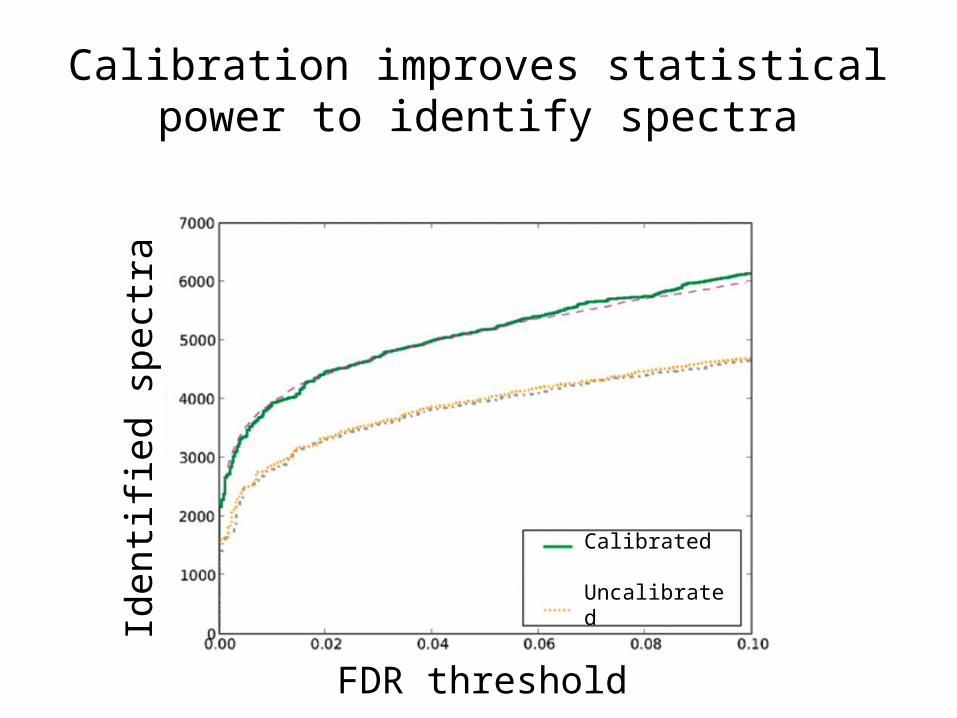
Calibration improves statistical power to identify spectra
Calibrated
Uncalibrated
FDR threshold
Iden
tifie
d sp
ectr
a

Statistical confidence estimation
Elias & Gygi Nat Biotech 2007
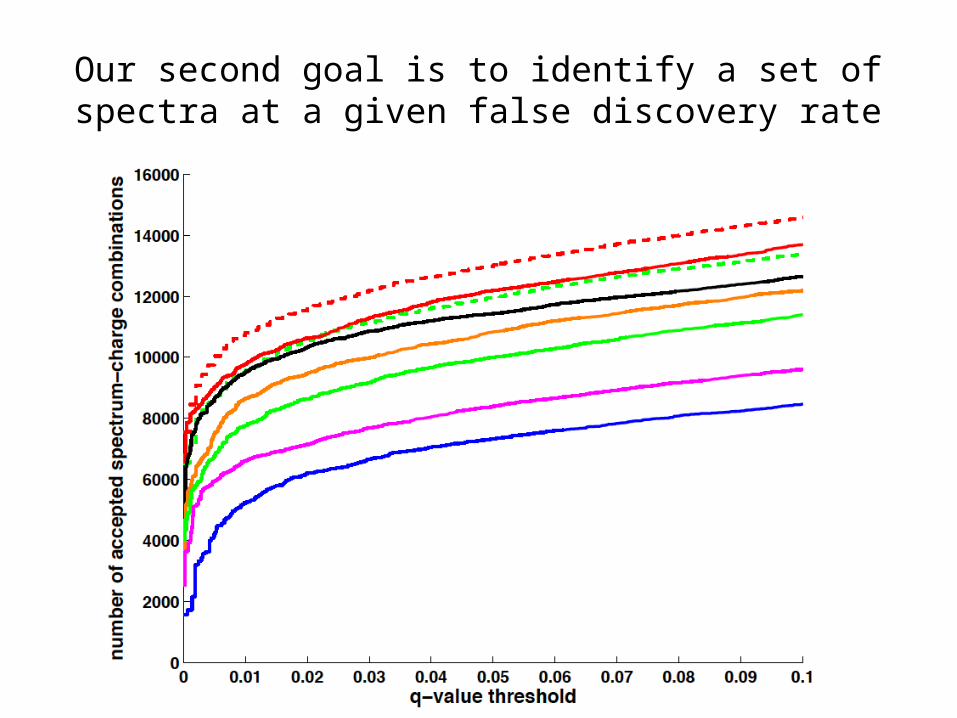
Our second goal is to identify a set of spectra at a given false discovery rate

Spectrum identification must account for two types of multiple testing
MSEDEIER
VDPSSWFNN
CSSSTEAEQR
CIVGLTK
QFIDFSTVFQP
ISLSGK
ALNDVGK
Minimump-value
Falsediscoveryrate

Decoy peptides can be used to estimate FDR.
MSEDEIER
ISLSGK
CSSSTEAEQR
CIVGLTK
ALNDVGK
Search
DecoyTarget
MSEDEIER 2.2
ISLSGK 1.6
CSSSTEAEQR 1.9
CIVGLTK 2.8
ALNDVGK 2.7
VDPSSWFNN 1.2
QFIDFSTVFQP 1.7 FDR = 1/4 = 25%
Elias & Gygi Nat Biotech 2007

stage 1 square root
XCorr can be calculated as a dot product between two spectra
Observed spectrum
stage 2 normalize regions
stage 3 cross-correlation pre-processing
Theoretical spectrum
VNIQEELGK
for each peptide bond: b iony ionneutral losses
dot product
XCorr score(Eng J Proteome Research 2008)

XCorr can be refactored to make the theoretical spectrum binary
stage 3
observed spectrum theoretical spectrum
fingerprint of b / y / neutral lossescentered at mi = 347
vector of cleavage evidence
sum of evidence forcleavage at mi = 347
VNIQEELGK
binary markers of backbone cleavage
dot product
refactored Xcorr score(Howbert Molecular & Cellular Proteomics 2014)

The refactored XCorr is very similar to the original XCorr
ρ=0.995

Aa mmEsms
i iamCC ,,
amam mEmmEs CC 110,62,
30mE
30s
Distribution of XCorr scores can be computed using dynamic programming
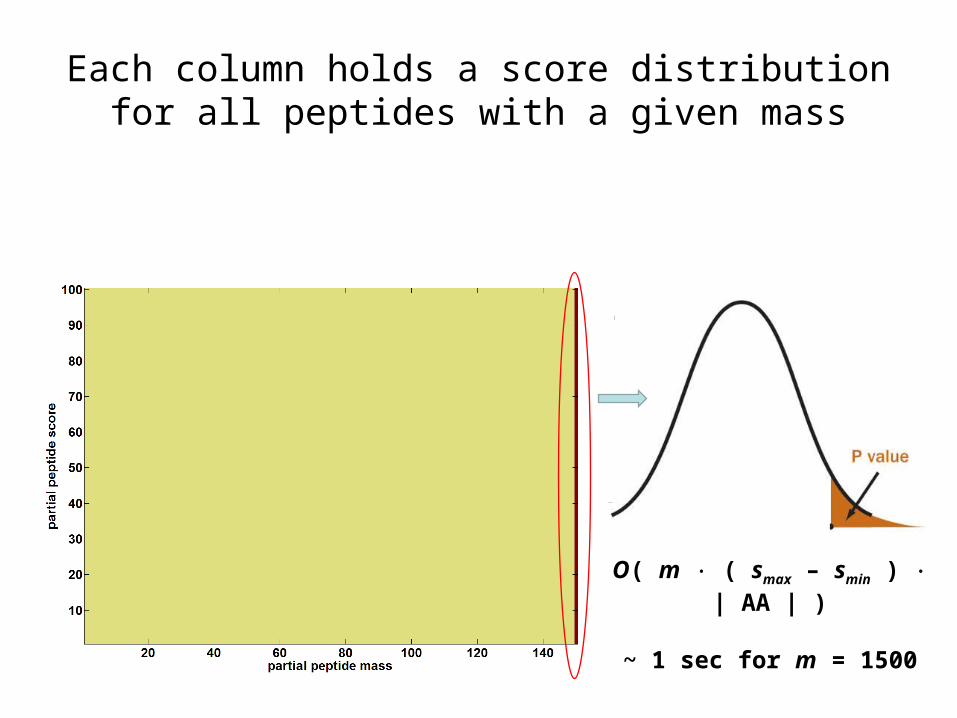
Each column holds a score distribution for all peptides with a given mass
O( m ( smax – smin ) | AA | )
~ 1 sec for m = 1500
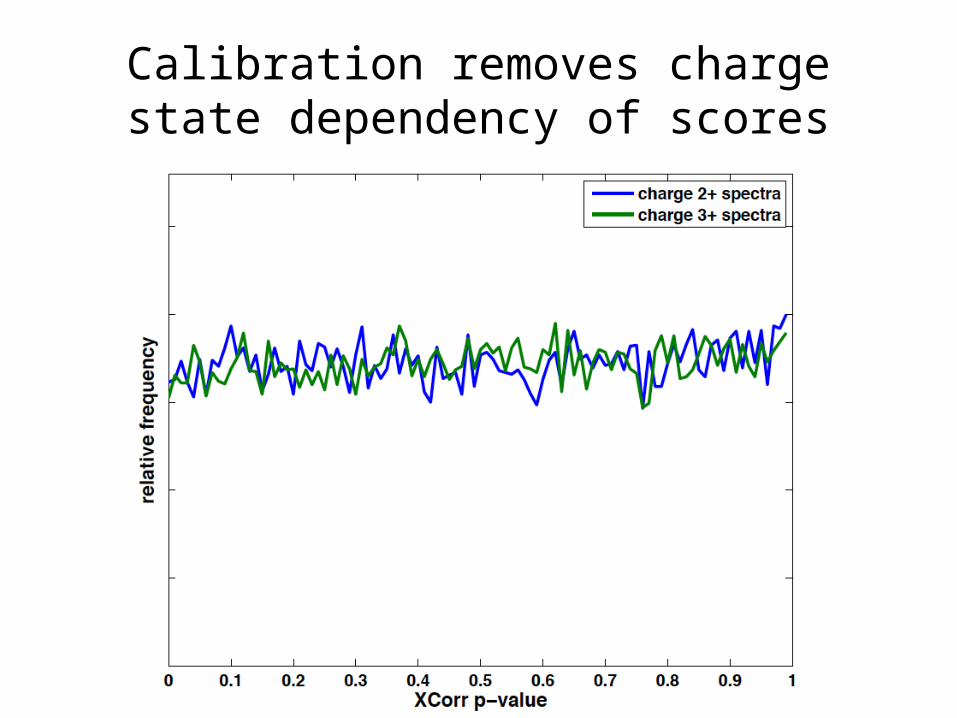
Calibration removes charge state dependency of scores

XCorr p-values must be corrected for multiple testing
• Sidak correction is similar to Bonferroni
• Accounts for fact that database search considers many peptides for each spectrum
)())(1(1)( xnpxpxp nSidak
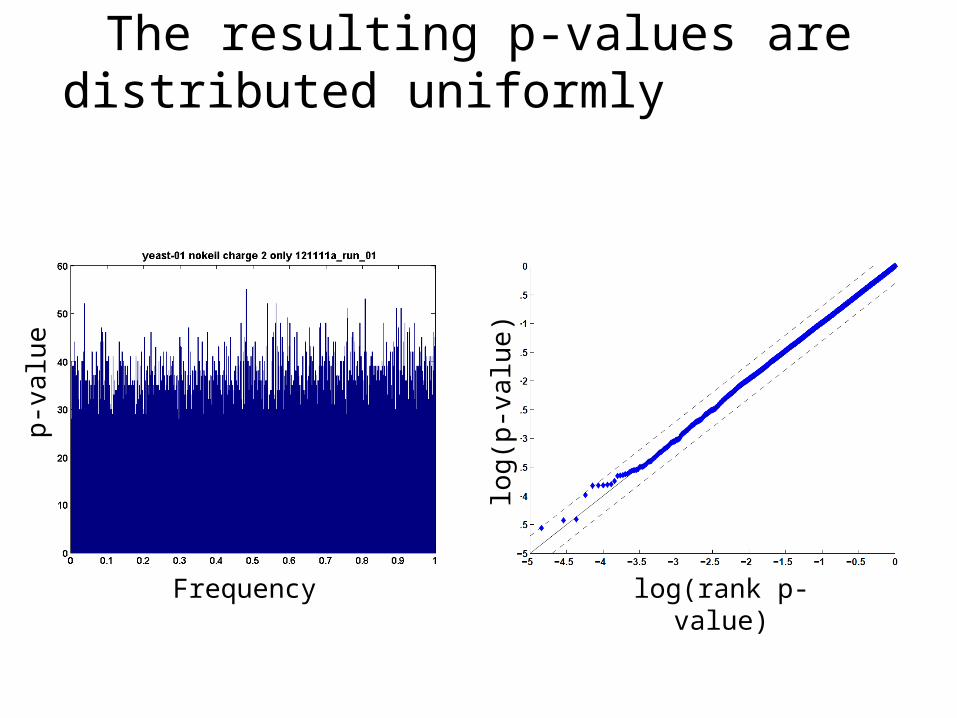
The resulting p-values are distributed uniformly
log(rank p-value)
log
(p-v
alu
e)
p-v
alu
e
Frequency
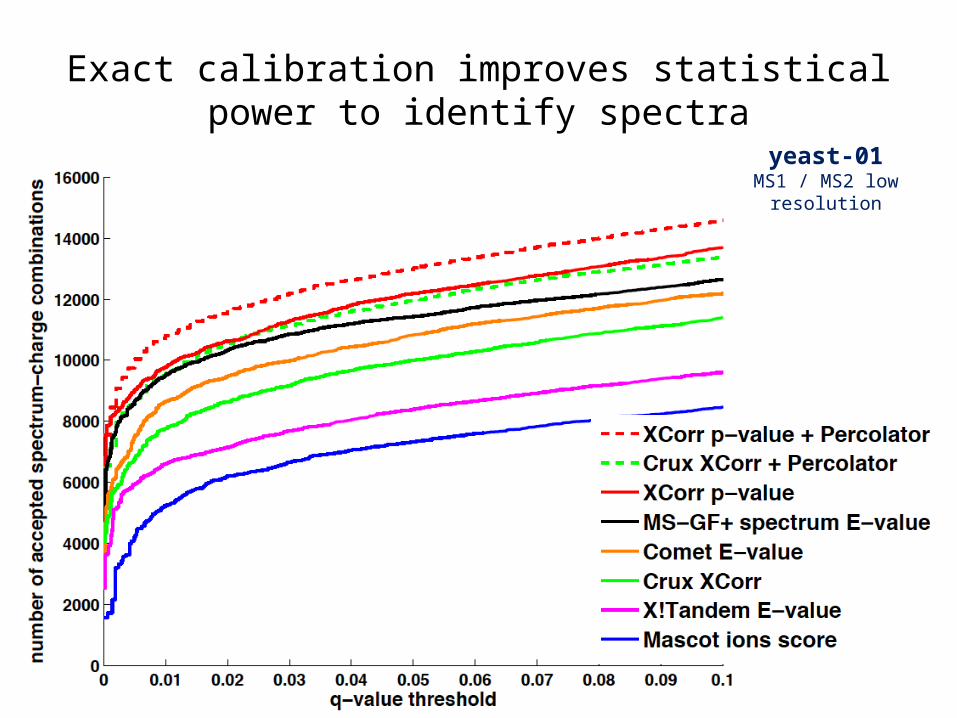
Exact calibration improves statistical power to identify spectra
yeast-01MS1 / MS2 low resolution
Top Related