


Languages
Pages
Legal


Client Name: International Council on Clean Transportation (ICCT) Project No.: C000908 Archive: RD.12/96201.2 Client Confidential
www.ricardo.com
Prepared for: International Council on Clean Transportation (ICCT) 1225 I Street NW Suite 900 Washington DC 20005 Project: C000908 Archive: RD.12/96201.2 Date: 13 April 2012 Client Confidential Author(s): John J. Kasab Subbarao Velliyiur Contributor(s): Daniel Shepard Anrico Casadei Henry Huang Felipe Brandao
Technical Approval: ________Reviewed by [John J. Kasab]_________ John J. Kasab, Ph.D., P.E. Chief Engineer / Innovations
Project Report Analysis of Greenhouse Gas Emission Reduction
Potential of Light Duty Vehicle Technologies in the European Union for 2020–2025
Ricardo Inc.
40000 Ricardo Drive Van Buren Twp., MI 48111-1641
TEL: (734) 397-6666 FAX: (734) 397-6677

Client Name: International Council on Clean Transportation (ICCT) Project No.: C000908 Archive: RD.12/96201.2 Client Confidential
13 April 2012 Page 1
PROJECT REPORT ANALYSIS OF FUTURE GREENHOUSE GAS EMISSION REDUCTION POTENTIAL OF LIGHT
DUTY VEHICLE TECHNOLOGIES IN THE EUROPEAN UNION FOR 2020–2025
EXECUTIVE SUMMARY Ricardo, Inc. was contracted by International Council on Clean Transportation (ICCT), to assess the effectiveness of future light duty vehicle (LDV) technologies on future vehicle performance and greenhouse gas (GHG) emissions in the 2020–2025 timeframe. ICCT in partnership with US Environmental Protection Agency (EPA) had funded an earlier study, "Computer Simulation of Light Duty Vehicle Technologies for Greenhouse Gas Emission Reduction in the 2020–2025 Timeframe", focused on the US Market that was conducted by Ricardo and SRA (2011). In this project ICCT is interested in extending the earlier study and evaluating the potential benefits of technologies on GHG emissions in the European Union (EU) in the 2020–2025 timeframe. This program was performed between August 2011 and January 2012. The scope of the project was to develop and execute an objective, independent analytical study of LDV technologies likely to be available in the 2020–2025 timeframe. This study builds on the previous one conducted for EPA and ICCT by focusing on vehicles sold in Europe. Thus, the study included a new vehicle class for this study, the C Class, a high-selling segment in the EU, and a new advanced European diesel engine model for all vehicle classes. In addition, this study builds on the previous study by evaluating GHG emissions over the New European Driving Cycle (NEDC) and a similar mixed-cycle for Japan, the JC08. The study described here covers several LDV classes typical for the European market, including the B Class, C Class, D Class, Small Crossover Utility Vehicle (CUV), Small N1 light commercial, and Large N1 light commercial vehicle segments. For each vehicle class, several combinations of powertrain architectures, engines, and transmissions were defined and studied. The powertrain architectures included conventional (with stop-start functionality), P2 Hybrid, and Powersplit Hybrid. The engines studied include several advanced concepts, including spark-ignited engines with direct injection and turbocharging; advanced European diesels; and Atkinson cycle engines for hybrids. The transmissions studied include advanced automatic transmissions and dual-clutch transmissions, plus the types used with the two hybrid architectures. For each combination of discrete factors—vehicle class, architecture, engine, and transmission—several continuous input factors were defined along with parametric ranges. Together, these discrete and continuous input factors define the future design space for LDV in the EU. This future design space was sampled to assess the effects on GHG emissions and vehicle performance using design of experiments (DoE) methodology. The DoE method allows an efficient survey of a design space for a limited number of experiments or, as in this study, simulations. Even so, over 350,000 different vehicle performance simulation cases were evaluated for the study to assess the future GHG emissions and performance of LDV. To permit a more effective assessment of the simulation results, they were fit to response surface models (RSM) that define functions that relate results to values of the discrete and continuous input factors. These RSM were incorporated into a Data Visualization Tool to allow users to evaluate the effectiveness of LDV technology packages in their potential to reduce GHG emissions. Because the Data Visualization Tool has a simpler representation of LDV performance than hundreds of thousands of simulations results, it allows a user to assess quickly and efficiently

Client Name: International Council on Clean Transportation (ICCT) Project No.: C000908 Archive: RD.12/96201.2 Client Confidential
13 April 2012 Page 2
the interactions between technologies in ways that would not be easily identified in individual simulations. Table ES-1 below shows selected results for the C Class vehicle drawn from the Data Visualization Tool. The baseline results are for a C Class vehicle with contemporary engine and six-speed automatic transmission and stop-start functionality. Note that the C Class vehicle mass is based on the EPA Test Car List data, and is therefore somewhat heavier than the typical European test mass for such a vehicle. The advanced C Class vehicles compare several combinations of engine and powertrain with varying levels of vehicle mass, rolling resistance, and aerodynamic drag compared to the baseline value. The conventional vehicles have stop-start functionality implemented, and the P2 Hybrid uses the same eight-speed dual clutch transmission (DCT) as the conventional vehicles. The cases with 100% of baseline vehicle mass, rolling resistance and aerodynamic drag all have equivalent performance, as measured by 0–60 mph acceleration times. Engine power was not adjusted as the vehicle mass and other parameters were reduced, so the acceleration times are slightly shorter. The values in Table ES-1 are generated from the response surface models that are implemented in the Data Visualization Tool, and therefore these results differ slightly from the Nominal Results presented in Appendix 4, which come directly from vehicle performance simulation. Also, more precisely matching the 0–60 mph (0–97 km/h) acceleration times can improve GHG emissions by up to 5% for the first step to 85% nominal weight and 90% of nominal rolling resistance and aerodynamic drag, and up to 10% for the second step. The largest improvements are seen with the Powersplit hybrid with the Atkinson engine with cam profile switching and the Advanced European Diesel used with the eight-speed DCT; otherwise, the results are within 1% and 2.5%, respectively. As this relatively simple example illustrates, the results of this study incorporated in the Data Visualization Tool can be used to evaluate the potential GHG emissions and performance benefits or trade-offs for European LDV in the 2020–2025 timeframe. The full project report documents the work done to analyze future GHG emissions reduction potential of several LDV technologies, details the elements of the study that are new to this project, and provides representative results from the Data Visualization Tool.

Client Name: International Council on Clean Transportation (ICCT) Project No.: C000908 Archive: RD.12/96201.2 Client Confidential
13 April 2012 Page 3
Table ES-1: Selected C Class Vehicle results, showing benefit of decreasing road loads.
Baseline with SI engine 1474 100% 100% 165 10.0Baseline with Diesel engine 1474 100% 100% 124 10.0
1474 100% 100% 107 10.21253 90% 90% 93 8.81032 80% 80% 80 7.41474 100% 100% 105 10.21253 90% 90% 90 8.71032 80% 80% 77 7.41474 100% 100% 102 10.21253 90% 90% 89 8.81032 80% 80% 77 7.41474 100% 100% 104 10.21253 90% 90% 93 8.81032 80% 80% 83 7.41474 100% 100% 96 9.61253 90% 90% 86 8.21032 80% 80% 77 6.91474 100% 100% 93 10.21253 90% 90% 81 9.01032 80% 80% 72 7.6
g CO2/km
on NEDCC Class Vehicle ConfigurationAero. Drag
Vehicle Mass (kg)
Rolling Resist.
Stoich DI Turbo + 8-spd DCT
Lean-Stoich DI Turbo + 8-spd DCT
Adv EU Diesel + 8-spd DCT
Atkinson (CPS) P2 Hybrid
Atkinson (CPS) Powersplit Hybrid
EGR DI Turbo + 8-spd DCT
0-60 mph Accel time (s)

Client Name: International Council on Clean Transportation (ICCT) Project No.: C000908 Archive: RD.12/96201.2 Client Confidential
13 April 2012 Page 4
1. INTRODUCTION ........................................................................................................................ 5 2. OBJECTIVES ............................................................................................................................. 5 3. BACKGROUND ......................................................................................................................... 5
3.1 Study Background ............................................................................................................... 5 3.2 Ground Rules for Study ...................................................................................................... 7 3.3 Technology Package Selection Process ............................................................................. 7 3.4 Complex Systems Modeling Approach ............................................................................... 8 3.5 Data Visualization Tool ....................................................................................................... 9
4. TECHNICAL APPROACH ........................................................................................................ 10 4.1 Engine Technologies ........................................................................................................ 10 4.2 Engine Configurations ....................................................................................................... 10 4.3 Hybrid Technologies ......................................................................................................... 11 4.4 Transmission Technologies .............................................................................................. 12 4.5 Vehicle Technologies ........................................................................................................ 13
5. TECHNOLOGY BUNDLES AND SIMULATION MATRICES ................................................... 13 5.1 Technology Options Considered ....................................................................................... 13 5.2 Vehicle configurations and technology combinations ....................................................... 14
6. VEHICLE MODEL .................................................................................................................... 16 6.1 Validation and Baseline Vehicle Models ........................................................................... 16 6.2 Baseline Hybrid Vehicle Models ....................................................................................... 18 6.3 Engine Models .................................................................................................................. 18 6.4 Transmission Models ........................................................................................................ 22 6.5 Torque Converter Models ................................................................................................. 23 6.6 Final Drive Differential Model ............................................................................................ 24 6.7 Driver Model ...................................................................................................................... 24 6.8 Hybrid Models ................................................................................................................... 24
7. MODEL RESULTS ................................................................................................................... 28 7.1 Validation Vehicle Models and Baseline Models .............................................................. 28 7.2 Nominal Runs ................................................................................................................... 29 7.3 Manual Transmission vs. DCT .......................................................................................... 30
8. COMPLEX SYSTEMS MODELING ......................................................................................... 31 8.1 Evaluation of Design Space .............................................................................................. 31 8.2 Response Surface Modeling ............................................................................................. 32
9. RESULTS ................................................................................................................................. 33 9.1 Basic Results of Simulation .............................................................................................. 33 9.2 Design Space Query ......................................................................................................... 33 9.3 Exploration of the Design Space ....................................................................................... 34 9.4 Identification and Use of the Efficient Frontier .................................................................. 40
10. CONCLUSIONS ................................................................................................................... 41 11. REFERENCES ..................................................................................................................... 42 12. APPENDICES ...................................................................................................................... 44
12.1 Appendix 1, Abbreviations ................................................................................................ 44 12.2 Appendix 2, Output Factors for Study ............................................................................... 46 12.3 Appendix 3, Input Factors and Baseline Run Results ....................................................... 47 12.4 Appendix 4, Nominal Run Results .................................................................................... 49 12.5 Appendix 5, Assumptions Underpinning the Models ........................................................ 53 12.6 Appendix 6, Drive Cycles .................................................................................................. 54

Client Name: International Council on Clean Transportation (ICCT) Project No.: C000908 Archive: RD.12/96201.2 Client Confidential
13 April 2012 Page 5
1. INTRODUCTION
Ricardo was contracted by the International Council on Clean Transportation (ICCT) to assess the effectiveness of future light duty vehicle (LDV) technologies on future vehicle performance and greenhouse gas (GHG) emissions in the 2020–2025 timeframe. GHG emissions are a globally important issue, and ICCT wants to understand the potential to reduce GHG emissions in LDVs, including passenger cars and light-duty trucks. Ricardo, Inc., is the US division of Ricardo plc., a global engineering consultancy with nearly 100 years of specialized engineering expertise and technical experience in engines, transmissions, and automotive vehicle research and development. This program was performed between August 2011 and January 2012. The scope of the program was to execute an independent and objective analytical study of LDV technologies likely to be available for volume production in the 2020–2025 timeframe for the European Union, and to develop a Data Visualization Tool to allow users to evaluate the effectiveness of LDV technology packages for their potential to reduce GHG emissions. This program report describes the technologies included in the study, the complex systems methodology, and the Data Visualization Tool.
2. OBJECTIVES The goal of this technical program has been to objectively evaluate the effectiveness and performance of a large LDV design space for the European Union with powertrain technologies likely to be available in the 2020–2025 timeframe, and thereby assess the potential for GHG emissions reduction in these future vehicles while also understanding the effects of these technologies on vehicle performance.
3. BACKGROUND 3.1 Study Background ICCT has an interest in improving the environmental performance and efficiency of cars, trucks, buses, and transportation systems to protect and improve public health, the environment, and quality of life. Additionally, reduction of GHG emissions—emphasizing carbon dioxide (CO2)—is an increasing priority of national governments and other policymakers worldwide. The purpose of the present study is to assess potential technologies for the European market (EU) over the European test cycle (NEDC) and with vehicle configurations like those expected in the EU in the 2020–2025 timeframe. For this program, a large design space was comprehensively examined so that broader conclusions could be drawn about how these technologies could improve GHG emissions. Ricardo recognized that other design considerations, such as vehicle drivability, are not captured well by the tools employed in the study, which tempered the drive for minimum GHG emissions at the expense of these other factors. This study builds on the work done earlier by Ricardo under subcontract to SRA in 2009–2011 (Ricardo and SRA, 2011) to assess the potential of GHG-reducing technologies in the 2020–2025 timeframe for the U.S. Environmental Protection Agency (EPA). The earlier program was funded in

Client Name: International Council on Clean Transportation (ICCT) Project No.: C000908 Archive: RD.12/96201.2 Client Confidential
13 April 2012 Page 6
part by ICCT and looked at a large design space covering seven LDV classes, three powertrain architectures, seven engines, and five different transmissions. The evaluation of the design space allowed the program team to assess the effects of the technology packages and combinations thereof included in the design space on GHG emissions, fuel consumption, and vehicle performance. The emphasis of the earlier program was on the U.S. market, and included the following vehicle classes, with European equivalents given as available:
Small Car (B Class) Standard Car (D Class) Small Multi-Purpose Vehicle (M-segment) Full Size Car (E Class) Large Multi-Purpose Vehicle (M-segment) Light-Duty (Pickup) Truck Light Heavy-Duty (Pickup) Truck (Light Commercial Vehicle)
The vehicle classes considered in this study are described in Section 3.2. The set of powertrain architectures, engines, and transmissions used in this study are carried over from the EPA program, with the exception of an advanced European diesel replacing the advanced U.S. diesel used earlier. These technologies are described in Section 4, "Technical Approach", in this report and in detail in Chapter 4, "Technology Review", and Attachment A of Ricardo and SRA (2011). In addition, a comparison was made of GHG emissions from a vehicle with an advanced manual transmission performance and the advanced DCT, which is presented in Section 7.3. The earlier program involved identifying a large set of future technologies that could improve LDV GHG emissions, and assessing these technologies for their potential benefit and ability to be commercialized by the 2020–2025 timeframe. Ricardo and SRA (2011) list out the initial technologies considered, and Attachment A (ibid.) provides the initial assessments. Where possible, the technologies used in the earlier program were used again here. In this study, Ricardo performed the following activities:
Identified a C-Class baseline vehicle with a spark-ignited (SI) engine and developed a vehicle performance model to assess performance over NEDC and JC08 test cycles.
Identified a Small N1 class baseline vehicle with a spark-ignited (SI) engine and developed a vehicle performance model to assess performance over NEDC and JC08 test cycles.
Estimated the GHG emissions and performance of diesel-powered baseline vehicles for all LDV classes in the study: B-class, C-Class, D-Class, Small Crossover, Small N1, and Large N1.
Created model inputs for an advanced European diesel engine for the 2020–2025 timeframe.
Defined a large design space for future EU LDV, including a range of LDV classes, powertrain architectures, engine designs, and transmission designs, as well as parameters describing these configurations, such as engine displacement, final drive ratio, and vehicle rolling resistance.
Used a Design of Experiments (DoE) approach to efficiently explore the design space through vehicle performance simulation over key drive cycles, including the NEDC.
Exercised the vehicle models in DoE-based simulation over the NEDC, JC08. US FTP, HWFET, and US06 drive cycles.
Interpolated the DoE simulation results using a functional representation of the responses, a response surface model (RSM), to the varied model input factors.
Incorporated the response surface models into a Data Visualization Tool to allow easy exploration of the design space.

Client Name: International Council on Clean Transportation (ICCT) Project No.: C000908 Archive: RD.12/96201.2 Client Confidential
13 April 2012 Page 7
Conducted a side study comparing the GHG emissions performance of a vehicle with an advanced manual transmission to that of the advanced dual clutch transmission (DCT).
3.2 Ground Rules for Study Several ground rules for the study were agreed at the beginning of the program to bound the design space considered. The ground rules identified content that should be included in the study, as well as content that should be excluded. Some examples of the ground rules include the following items for the technology assessment:
Six vehicle classes will be included, as described below. LDV technologies must have the potential to be commercially deployed in 2020–2025. Vehicle sizes, particularly footprint and interior space, for each class will be largely
unchanged from 2010 to 2020–2025. Hybrid vehicles will use an advanced hybrid control strategy, focusing on battery state of
charge (SOC) management, but not at the expense of drivability. Vehicles will use fuels that are equivalent to either 87 AKI pump gasoline or 40 cetane
pump diesel with fuel sulfur levels comparable to 2010 regulated levels. 2020–2025 spark-ignited engines will meet future California LEV III requirements for criteria
pollutants. 2020–2025 diesel engines will meet future EU requirements for criteria pollutants. Ricardo will be allowed to use Ricardo proprietary data and expertise to assess
technologies and develop the models, as this allows the technologies to be assessed more comprehensively than if only publicly available data were used.
Due to the multiple designs that manufacturers may realize for any given advanced technology, the effect of technologies on overall vehicle mass is not incorporated directly in the vehicle performance models. Instead, the model makes the overt simplifying assumption that all technologies are mass-neutral. The end-user has the flexibility to incorporate their own assumptions about mass reduction from advanced technologies when exploring the design space with the Data Visualization Tool.
Similarly, other road load reductions such as aerodynamic drag and rolling resistance reduction were addressed as input factors for the DoE simulations.
The six vehicle classes considered in this study are the following, with a currently available example vehicle given for each class:
1. B-class Car, such as the Toyota Yaris 2. C-class Car, such as VW Golf 3. D-class Car, such as the Ford Mondeo 4. Small Crossover Utility Vehicle (CUV), such as the Opel/Vauxhall Antara 5. Large N1-class Vehicle, such as the Ford Transit 6. Small N1-class Vehicle, such as the Ford Transit Connect
3.3 Technology Package Selection Process The program team used the process shown in Figure 3.1 to identify the technology options considered in the earlier program for EPA. Ricardo and SRA (2011) provide a more complete description of the process, the technologies considered for the US market (ibid., Appendix 2), and the Subject Matter Expert assessments (ibid., Attachment A).

Client Name: International Council on Clean Transportation (ICCT) Project No.: C000908 Archive: RD.12/96201.2 Client Confidential
13 April 2012 Page 8
Figure 3.1: Technology package selection process.
The program team first developed a comprehensive list of potential technologies that could be in use on vehicles in the study timeframe, 2020–2025. These technologies were grouped by subject area, such as transmission, engine, or vehicle, and given to Ricardo subject matter experts (SMEs) for assessment and evaluation. These SME assessments of the technologies considered in the EPA program were then reviewed with ICCT, EPA, and California Air Resources Board (ARB). Together, the program team determined which technologies would be included once they were evaluated qualitatively against the following criteria for further consideration:
Potential of the technology to improve GHG emissions on a tank to wheels basis State of development and commercialization of the technology in the 2020–2025 timeframe Current (2010) maturity of the technology
The technology options selected were then put together into technology packages for use in the vehicle performance simulations. An additional consideration was how the inclusion of the technology would affect simulation matrices presented in Section 5.2Error! Reference source not found., particularly the effect on the overall number of simulations needed. For this study, the technology options were evaluated in light of application in the EU. For the most part the technologies from the EPA program are expected to apply to European LDV as well, with the exception of diesel engine technology; therefore, Ricardo made a new evaluation of diesel engine technologies with the objective of developing model parameters that would be suitable for European LDV. This process is described in Section 4.2. In addition, a side study was conducted to compare the GHG emissions from a vehicle with an advanced manual transmission to that with an advanced DCT. These results are described in Section 7.3. 3.4 Complex Systems Modeling Approach Complex systems modeling (CSM) is an objective, scientific approach that supports high-level decision making when there are a large number of factors to consider that influence the outcome, as with LDV development for vehicle performance and GHG emissions reduction. In this program, many combinations of technologies were used to generate detailed results that were abstracted and made accessible through a Data Visualization Tool described in Section 3.5. To be objective, performance metrics for this study were identified by ICCT and Ricardo; these metrics were outputs of the vehicle performance simulation effort and characterize key vehicle attributes. To be scientific, the performance simulations use a physics-based modeling approach for detailed simulation of the vehicle.
Technology Identification
Ricardo Subject Matter Expert
Assessment
Review & Technology Discussion
Technology Package Selection

Client Name: International Council on Clean Transportation (ICCT) Project No.: C000908 Archive: RD.12/96201.2 Client Confidential
13 April 2012 Page 9
As the CSM methodology is designed to support decision-making over a large design space, it is important to have an efficient and effective means of evaluating the configurations considered in that design space. The design of experiments (DoE) approach surveys a design space in a way that extracts the maximum information given a limited budget of simulation runs. A simulation matrix was developed to identify appropriate combinations of discrete input factors, such as LDV class or engine. This DoE simulation matrix supported efficient exploration of the comprehensive design space considered for LDVs in the 2020–2025 timeframe. A simulation matrix defining the combinations of discrete choices, such as engine or vehicle class, and the ranges of continuous parameters is described in Section 5.2. The simulations were used to generate values for the output factors defined in Appendix 2, such as fuel consumption and acceleration times. A statistical analysis was used to correlate variations in the input factors to variations in the output factors. Because of the complex nature of the LDV configurations and constituent technology packages, a neural network approach was used to quantify the relationships between input and output factors over the design space explored in the simulations. The result of this analysis was a set of response surface models (RSM) that represent in simplified form the complex relationships between the input and output factors in the design space. These RSM can then be used to provide estimates of the output factors for a given set of input factors over the complete design space, thereby leveraging the inherently limited set of simulations that comprised the DoE. 3.5 Data Visualization Tool The Data Visualization Tool allows the user to efficiently assess the effects of various combinations of future technologies on GHG emissions and other vehicle performance metrics. The tool allows the user to query the RSM described in Section 3.4 and investigate options leading to equivalent GHG emissions levels. Vehicle configurations with unacceptable performance, such as combined fuel economy below a certain threshold or acceleration times longer than some benchmark value, can be excluded from further study. The Data Visualization Tool uses the RSM set generated by the Complex Systems approach to represent the vehicle performance simulation results over the design space. These simulations cover multiple variations of vehicle configuration, including several combinations of advanced powertrain and vehicle technologies in the LDV classes considered. The tool samples vehicle configurations from a selected subset of the design space by using Monte Carlo type capabilities to pick continuous input parameter values from a uniform distribution. Defining selected portions of the design space and plotting the results visualizes the effects of these parameters on vehicle fuel consumption, GHG emissions, and performance, allowing trade off analysis via constraints setting to be performed over a wide design space representing the 2020–2025 technologies as applied. For this study, baseline values for both gasoline and diesel engine powered versions of the LDV studied were incorporated into the Data Visualization Tool to provide a comparison between the advanced LDV configurations and a consistent reference. The method for developing these baseline values is described in Section 6.1.

Client Name: International Council on Clean Transportation (ICCT) Project No.: C000908 Archive: RD.12/96201.2 Client Confidential
13 April 2012 Page 10
4. TECHNICAL APPROACH Following the process outlined above in Section 3.3, Technology Package Selection Process, a broad list of potential technologies was identified for consideration in the study and then narrowed to a subset for inclusion in the study. The technologies in this subset are described in this chapter. In the study timeframe of 2020–2025, spark-ignited (SI) engines and compression ignition (CI, or diesel) engines are expected to be widely available for the EU LDV market. The efficiency of SI engines is expected to approach the efficiency of diesel engines at the required 2020–2025 emissions levels. Hybrid powertrains are also included, as they are expected to play a role in GHG emissions reduction in the EU. Several advanced engine technologies with the primary goal of reducing GHG emissions were considered including optimized components, highly efficient downsizing and different engine configurations. 4.1 Engine Technologies Several constituent engine technologies were considered for inclusion in the models, including Advanced Valvetrains
o Cam-Profile Switching (CPS) Valvetrain o Digital Valve Actuation (DVA) Valvetrain
Direct Injection Fuel Systems Advanced Boosting System These key engine technologies are described in detail in Section 4.1 of Ricardo and SRA (2011). Other assumptions included a blanket 3.5% improvement in fuel consumption coming from a combination of friction improvements in these future engines. 4.2 Engine Configurations The engine technologies listed above in Section 4.1 were used to define engine technology packages. The engines considered for the 2020–2025 timeframe were developed using two main methods. The first method, used with the boosted SI engines, was to review the reported performance of current research engines, and assume that these current research engines would closely resemble the production engines of the 2020–2025 timeframe. This method takes current research engines and refines them to meet production standards, including manufacturability, cost, and durability. The second method, used with the Atkinson cycle SI and the diesel engines, was to start from current production engines and then determine a pathway of technology improvements over the next 10–15 years that would lead to an appropriate engine configuration for the 2020–2025 timeframe. With both methods, current trends in engine design and development were extrapolated to obtain an advanced concept performance for the 2020–2025 timeframe that should be achievable in production volumes. The engine fueling maps developed for this study all account for the effects of future criteria pollutant standards on fueling rate. One engine developed new for this study is an Advanced European Diesel engine. The torque curve and fueling maps for the Advanced European Diesel engine were developed for the 2020–2025 timeframe by starting with existing production engines and identifying technology advances that would lead to further improvements in fuel consumption. Most of the technologies discussed in

Client Name: International Council on Clean Transportation (ICCT) Project No.: C000908 Archive: RD.12/96201.2 Client Confidential
13 April 2012 Page 11
Section 4.1, Engine Technologies, are applicable to advanced diesels. The Advanced European Diesel included in this study incorporated series-sequential, two-stage turbocharging; enhanced EGR and charge air cooling; and CPS. Here, enhanced EGR is assumed to include a low pressure EGR circuit for increased EGR flow rate in conjunction with separate low temperature cooling circuit to cool EGR and provide additional charge air cooling. Charge air cooling is assumed to continue to use an air to air heat exchanger. The composite effects of these technologies were synthesized into a torque curve and fueling map for the advanced engine. A modest fuel consumption penalty was applied to account for the additional fuel required for particulate filter regeneration and lean NOx aftertreatment. The other engine types used in this study were previously developed for the EPA program, as described in Section 4.2 of Ricardo and SRA (2011), and include the following: Stoichiometric DI Turbo SI Engine Lean-Stoichiometric DI Turbo SI Engine EGR DI Turbo SI Engine Atkinson Cycle SI Engine
o With CPS o With DVA
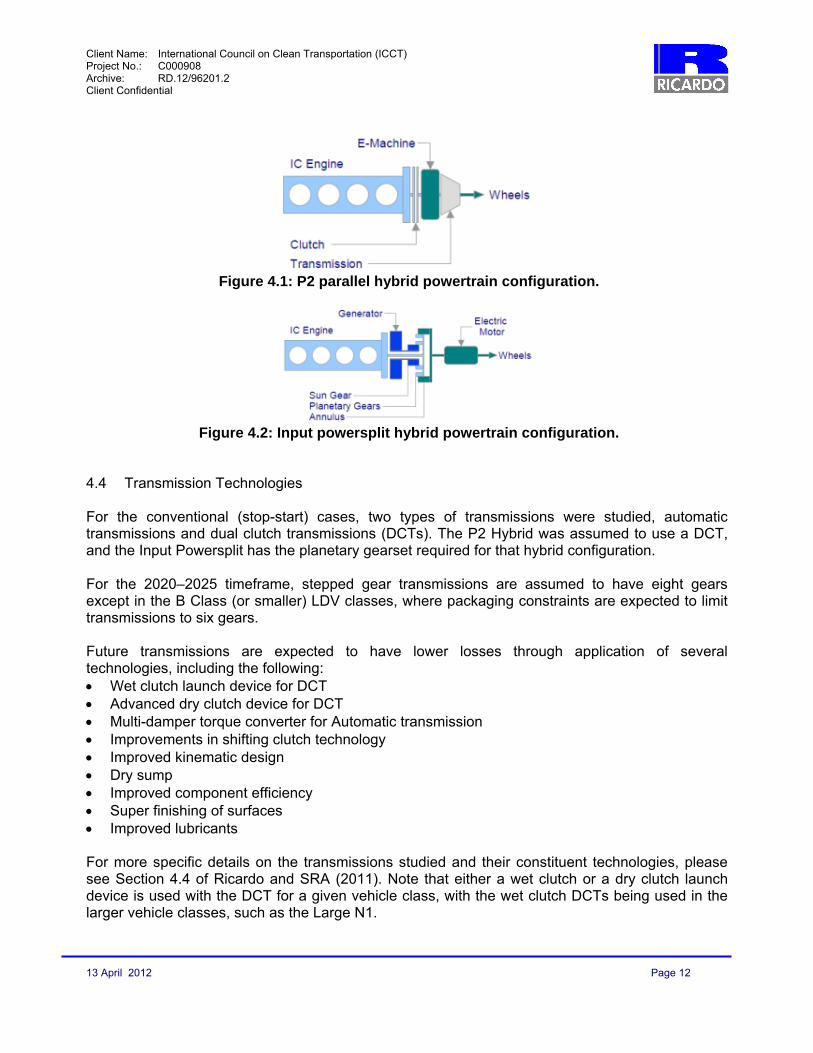
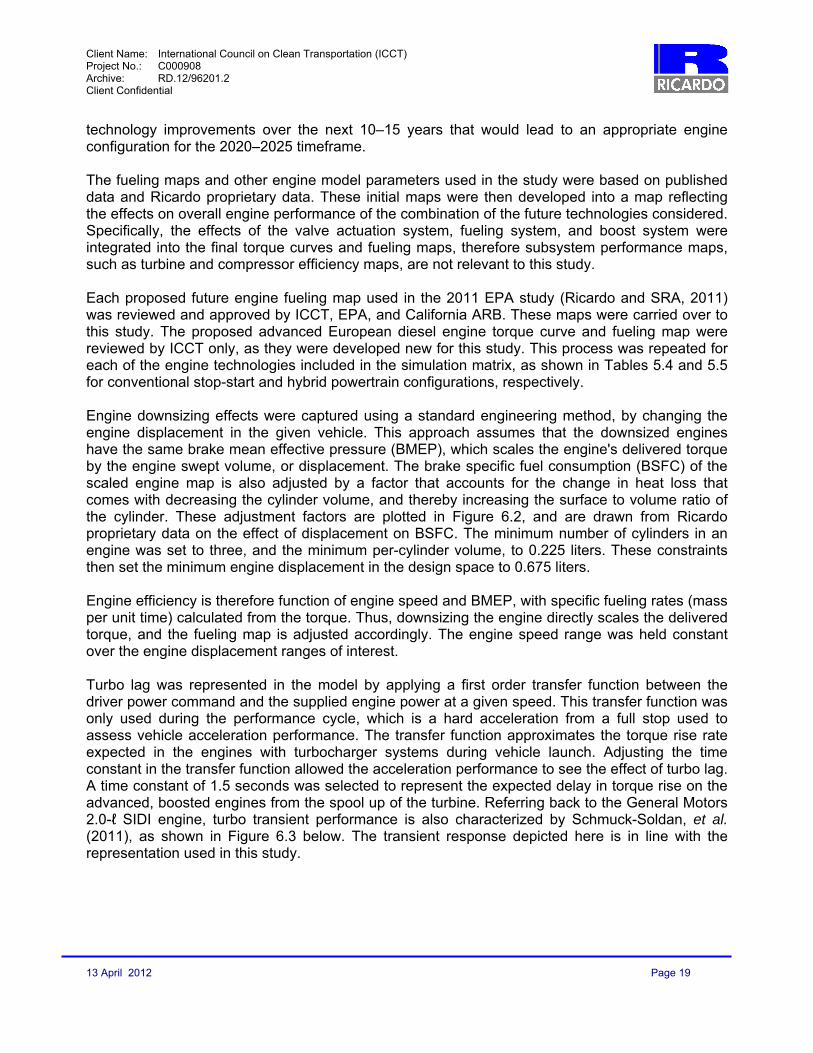
4.3 Hybrid Technologies Many hybrid technologies were studied with trade-offs between fuel consumption benefit and system complexity and cost. For this study, the design space was created such that the range of electric machine sizes would be able to capture at least 90% of the mechanical braking energy over an aggressive highway driving schedule, the US06 cycle. The conventional vehicle architectures used a stop-start system, or micro hybrid. For this system, the alternator was assumed to be able to recover a modest amount of energy that would help offset accessory loads. Two strong hybrid configurations were considered, P2 parallel hybrid and Input Powersplit hybrid. These hybrid powertrains are described below. The P2 Parallel Hybrid powertrain, shown in Figure 4.1, places an electric machine on the transmission input, downstream of the engine clutch. This system allows stop-start, electrical launch, launch assist, and regenerative braking functionality. The clutch also allows the engine to be decoupled from the rear of the driveline, allowing pure electric propulsion, or electric vehicle (EV) mode operation. This wide application of electrical power in a variety of vehicle operating conditions facilitates downsizing the engine from that in the comparable conventional vehicle. The P2 Hybrid in this study was assumed to use a dual clutch transmission (DCT). The Input Powersplit hybrid configuration, however, replaces the vehicle’s transmission with a single planetary gearset that has two electrical machines connected, as shown in Figure 4.2. The planetary gearset splits engine power between the mechanical path and the electrical path to achieve a continuously variable transmission. In some Input Powersplit configurations, a second planetary gearset is used to speed up one of the electrical machines while retaining the continuously variable transmission (CVT) functionality.
Client Name: International Council on Clean Transportation (ICCT) Project No.: C000908 Archive: RD.12/96201.2 Client Confidential
13 April 2012 Page 12
Figure 4.1: P2 parallel hybrid powertrain configuration.
Figure 4.2: Input powersplit hybrid powertrain configuration.
4.4 Transmission Technologies For the conventional (stop-start) cases, two types of transmissions were studied, automatic transmissions and dual clutch transmissions (DCTs). The P2 Hybrid was assumed to use a DCT, and the Input Powersplit has the planetary gearset required for that hybrid configuration. For the 2020–2025 timeframe, stepped gear transmissions are assumed to have eight gears except in the B Class (or smaller) LDV classes, where packaging constraints are expected to limit transmissions to six gears. Future transmissions are expected to have lower losses through application of several technologies, including the following: Wet clutch launch device for DCT Advanced dry clutch device for DCT Multi-damper torque converter for Automatic transmission Improvements in shifting clutch technology Improved kinematic design Dry sump Improved component efficiency Super finishing of surfaces Improved lubricants For more specific details on the transmissions studied and their constituent technologies, please see Section 4.4 of Ricardo and SRA (2011). Note that either a wet clutch or a dry clutch launch device is used with the DCT for a given vehicle class, with the wet clutch DCTs being used in the larger vehicle classes, such as the Large N1.

Client Name: International Council on Clean Transportation (ICCT) Project No.: C000908 Archive: RD.12/96201.2 Client Confidential
13 April 2012 Page 13
In addition, the final drive ratio (FDR) was a variable input factor to the DoE simulations. It was therefore swept over a range around the nominal value for each LDV class, as shown in Tables 5.4 and 5.5. 4.5 Vehicle Technologies Several vehicle technologies were also considered for the study to the extent that they help support future ranges of vehicle mass, aerodynamic drag, and rolling resistance for each of the vehicle classes in the study. The potential levels of improvement for these "road load reduction" technologies were not explicitly quantified; rather, they were included as independent input variables within the complex systems modeling approach. Tables 5.4 and 5.5 show the ranges used around the nominal values in the DoE simulations; the nominal values themselves are tabulated in Appendix 4. In addition to adjusting the road loads, the study considered electrification of accessory systems to reduce the power requirements resulting in lower fuel consumption and, consequently, GHG emissions. Two technologies in particular were adopted for the LDV classes considered in this study, Intelligent cooling systems Electric power assisted steering Comprehensive description of each of these major sub-system components is described in detail in Ricardo and SRA (2011).
5. TECHNOLOGY BUNDLES AND SIMULATION MATRICES Of the LDV classes described in Section 2.2, Ground Rules for Study, the C Class and Small N1 LDV were developed new for this study, whereas the other four—the B Class, D Class, Small CUV, and Large N1 Class—were carried over from the EPA study (Ricardo and SRA, 2011). These vehicle classes were combined with the technology packages described in Sections 4.2–4.5 for evaluation over the design space. In this study, ICCT and Ricardo defined the technology packages that would be used, given the applicability to the European LDV market, although most were identical to those used in the EPA program. 5.1 Technology Options Considered Definitions of the hybrid powertrain, engine, and transmission technology packages are presented in Tables 5.1–5.3. The engine technologies are defined in Table 5.1; hybrids, in Table 5.2; and transmissions, in Table 5.3. Many of the engines in Table 5.1 use some measure of internal EGR, but for this table "Yes" means significant EGR flow through an external EGR system. Note that there two versions of the Atkinson engine were developed: one with CPS and one with DVA. All of the advanced transmissions in Table 5.3 include the effects of the transmission technologies described in Section 4.4, including dry sump, improved component efficiency, improved kinematic design, super finish, and advanced driveline lubricants.

Client Name: International Council on Clean Transportation (ICCT) Project No.: C000908 Archive: RD.12/96201.2 Client Confidential
13 April 2012 Page 14
Table 5.1: Engine technology package definition.
Table 5.2: Hybrid technology package definition.
Powertrain Configuration Function 2010 Baseline Stop-Start P2 Parallel Powersplit
Engine idle-off Yes Yes Yes Yes Launch assist No No Yes Yes Regeneration Accessories Accessories Yes Yes EV mode No No Yes Yes CVT (Electronic) No No No Yes
Power steering Belt Electrical Electrical Electrical Engine coolant pump Belt Belt Electrical Electrical Air conditioning Belt Belt Electrical Electrical Brake Standard Standard Blended Blended
Table 5.3: Transmission technology package definition.
Transmission Launch Device Clutch Baseline Automatic Torque Converter Hydraulic Advanced Automatic Multidamper Control Hydraulic Dry clutch DCT None Advanced Dry Wet clutch DCT None Advanced Damp
5.2 Vehicle configurations and technology combinations Vehicles were assessed using three basic powertrain configurations: conventional stop-start, P2 hybrid, and Input Powersplit hybrid. Each vehicle class considered in the study was modeled with a set of technology options, as shown in Table 5.4 for the baseline and conventional powertrains and Table 5.5 for the hybrid powertrains. Each of the advanced engines marked for a given vehicle class in Table 5.4 was paired with each of the advanced transmissions marked for the same vehicle class. Tables 5.4 and 5.5 also show the ranges of the continuous parameters—expressed as a percentage of the nominal value—used in the DoE study for the conventional and hybrid powertrains, respectively. The ranges were kept purposely broad, to cover the entire span of practical powertrain design options, with some added margin to allow a full analysis of parametric trends.
CPS DVA
2010 Baseline NA PFI No No NoStoich DI Turbo Boost DI No Yes NoLean-Stoich DI Turbo Boost DI No Yes NoEGR DI Turbo Boost DI Yes Yes NoAtkinson with CPS NA DI No Yes NoAtkinson with DVA NA DI No No YesDiesel Boost DI Yes Yes No
Air System
Fuel Injection EGR
ValvetrainEngine

Client Name: International Council on Clean Transportation (ICCT) Project No.: C000908 Archive: RD.12/96201.2 Client Confidential
13 April 2012 Page 15
The 100% value for engine displacement for each advanced engine is determined using the equivalent 0–60 mph acceleration time to the baseline exemplar vehicle for each class. The other parameters are based on the exemplar vehicle for each class. These parameters are tabulated in Appendix 3. The 100% value for engine displacement for each advanced engine in the hybrid is determined using 80% of the displacement from the corresponding advanced engine in the conventional stop/start powertrain. The 100% value of the electric machine size is determined by matching the 0–60 mph acceleration time to that of the exemplar vehicle for each class. The other parameters are based on the exemplar vehicle for each class.
Table 5.4: Baseline and Conventional Stop-Start vehicle simulation matrix.
Advanced Engines Advanced Transmission
Vehicle Class Bas
elin
e E
ng
ine
wit
h 2
010
6-sp
eed
Au
tom
atic
Tra
ns.
2010
Die
sel w
ith
201
0 6-
spee
d A
uto
mat
ic T
ran
s.
Sto
ich
DI T
urb
o
Lea
n D
I Tu
rbo
EG
R D
I Tu
rbo
2020
Die
sel
6-sp
eed
Au
tom
atic
6-sp
eed
Dry
DC
T
8-sp
eed
Au
tom
atic
8-sp
eed
Dry
DC
T
8-sp
eed
Wet
DC
T
B Class X X X X X X X XC Class X X X X X X X X XD Class X X X X X X X X XSmall CUV X X X X X X X X XN1 (Small) X X X X X X X X XN1 (Large) X X X X X X X X X
ParameterEngine Displacement 50 125Final Drive Ratio 75 125Rolling Resistance 70 100Aerodynamic Drag 70 100Mass 60 120
DoE Range (%)

Client Name: International Council on Clean Transportation (ICCT) Project No.: C000908 Archive: RD.12/96201.2 Client Confidential
13 April 2012 Page 16
Table 5.5: P2 and Input Powersplit hybrid simulation matrix.
6. VEHICLE MODEL Vehicle models were developed to explore the complete design space defined by the technologies, vehicle classes, and powertrain architectures included for the 2020–2025 timeframe. The modeling process started by developing validation models to compare against data for current (2010) vehicles, as described in Section 6.1, Validation and Baseline Vehicle Models. Specific subsystems were also implemented into the simulation package for the study, and these modeling activities are described in Sections 6.3–6.8. 6.1 Validation and Baseline Vehicle Models For each of the LDV classes considered in this project, validation models were developed and correlated to a corresponding 2007–2010 exemplar for each LDV class for the purposes of establishing a comparison against known vehicle data. A detailed comparison between validation model results and vehicle test data was used to validate the models. These validation models were then modified to form the 2010 baseline models by converting all of them to use a 2010-level six-speed automatic transmission and stop-start systems. These baseline models, while representing an advance from current production vehicles, provide a better basis for comparison with the advanced LDVs for the 2020–2025 timeframe.
Vehicle Class P2
Hyb
rid
wit
h
2020
DC
T
Inp
ut
Po
wer
split
Sto
ich
DI T
urb
o
Lea
n D
I Tu
rbo
EG
R D
I Tu
rbo
Atk
inso
n
wit
h C
PS
Atk
inso
n
wit
h D
VA
B Class X X X X X X XC Class X X X X X X XD Class X X X X X X XSmall CUV X X X X X X XN1 (Small) X X X X X X XN1 (Large) X X X X X X X
Hybrid Architecture Advanced Engines
Engine Displacement 50 150 50 125Final Drive Ratio 75 125 75 125Rolling Resistance 70 100 70 100Aerodynamic Drag 70 100 70 100Mass 60 120 60 120Electric Machine Size 50 300 50 150
PowersplitP2 HybridDoE Range (%)
Parameter

Client Name: International Council on Clean Transportation (ICCT) Project No.: C000908 Archive: RD.12/96201.2 Client Confidential
13 April 2012 Page 17
The starting point for the validation vehicle models was to use the existing road-load coefficients from the EPA Test Car List, which are represented as the target terms for the chassis dynamometer. Known as target A-B-C terms, the coefficients were used to derive the physical properties of rolling resistance, linear losses, and aerodynamic drag. These properties were then used in the simulation to provide the appropriate load on the vehicle at any given speed. A complete, physics-based vehicle and powertrain system model such as the one shown in Figure 6.1 was developed and implemented in MSC.Easy5™. MSC.Easy5™ is a commercially available software package widely used in industry for vehicle system analysis, which models the physics in the vehicle powertrain during a drive cycle. Torque reactions are simulated from the engine through the transmission and driveline to the wheels. The model reacts to simulated driver inputs to the accelerator or brake pedals, thus enabling the actual vehicle acceleration to be determined based on a realistic control strategy. The model is divided into a number of subsystem models. Within each subsystem the model determines key component outputs such as torque, speeds, and heat rejection, and from these outputs, appropriate subsystem efficiencies can be calculated or reviewed as part of a quality audit of the model and its results. The LDV classes considered in this study are shown in Table 6.1, along with the exemplar vehicles for each class and the corresponding US vehicle class used in Ricardo and SRA (2011). The exemplar vehicles shown were the ones used for the validation models, and their characteristics form the basis for the baseline and nominal conditions. Each of the validation models had vehicle-specific vehicle, engine, and transmission model parameters. The models were exercised over the FTP75 and HWFET fuel economy drive cycles, and the results compared with the EPA Vehicle Certification Database (Test Car List) fuel economy data for each of the validation vehicles. Then all the vehicles were exercised over NEDC and JC08 drive cycles. For the C Class vehicle, the validation engine chosen was the 2.0-ℓ SI engine with 132 N·m peak torque and 62 kW peak power that is used in VW products in the US, as this engine is found in the EPA Test Car List. By comparison, VW's main engine in the EU is a 1.4- ℓ SIDI, turbocharged engine with 236 N·m peak torque and 117 kW peak power.
Table 6.1: Vehicle classes and exemplar vehicles. EU Vehicle Class US Vehicle Class Exemplar
B Class Small Car Toyota Yaris C Class [new to this study] VW Golf / VW Jetta D Class Standard Car Toyota Camry Small CUV Small MPV Saturn Vue N1 (Large) Large MPV Dodge Grand Caravan N1 (Small) [new to this study] Ford Transit Connect
Given the current prevalence of diesel engines in European LDVs, Ricardo also developed baseline fueling maps and torque curves for diesel engines that are typical of each of the LDV classes shown in Table 6.1. The baseline diesel fueling maps were only exercised in baseline models, not in validation models. These baseline diesel fueling maps reflect the fuel consumption effects of their compliance with Euro 5 emissions levels.

Client Name: International Council on Clean Transportation (ICCT) Project No.: C000908 Archive: RD.12/96201.2 Client Confidential
13 April 2012 Page 18
Figure 6.1: MSC.Easy5 conventional vehicle model.
6.2 Baseline Hybrid Vehicle Models For each hybrid technology, Ricardo developed a base model to calibrate the hybrid control strategy and vehicle, engine, and driveline parameters. As with the conventional vehicles described in Section 6.1, a full physical model of each baseline hybrid vehicle was developed and implemented in MSC.Easy5™. The hybrid control algorithms are also implemented in the respective MSC.Easy5™ models. The hybrid vehicles were modeled using published information from various sources and Ricardo proprietary data. Validation models of the hybrid vehicles were not developed, as hybrid vehicle controls are very specifically tailored to the vehicle, and the intent of this study was to develop a robust control algorithm that would be applicable across the complete design space considered. 6.3 Engine Models The engines considered in the design space are defined by their torque curve, fueling map, and other input parameters. For the 2010 baseline vehicles, the engine fueling maps and related parameters were developed for each specific baseline exemplar vehicle. For the engines used in the 2020–2025 vehicles, reference engine models were developed, which were then scaled to each of the LDV classes. The program team used two methods to develop the engine models for the 2020–2025 timeframe. The first was to look at the reported performance of current research engines, and translate these to the production engines of the 2020–2025 timeframe. With this method, current research engines would be refined to meet production standards, including manufacturability, cost, and durability. The second method was to start from current production engines and then determine a pathway of
Client Name: International Council on Clean Transportation (ICCT) Project No.: C000908 Archive: RD.12/96201.2 Client Confidential
13 April 2012 Page 19
technology improvements over the next 10–15 years that would lead to an appropriate engine configuration for the 2020–2025 timeframe. The fueling maps and other engine model parameters used in the study were based on published data and Ricardo proprietary data. These initial maps were then developed into a map reflecting the effects on overall engine performance of the combination of the future technologies considered. Specifically, the effects of the valve actuation system, fueling system, and boost system were integrated into the final torque curves and fueling maps, therefore subsystem performance maps, such as turbine and compressor efficiency maps, are not relevant to this study. Each proposed future engine fueling map used in the 2011 EPA study (Ricardo and SRA, 2011) was reviewed and approved by ICCT, EPA, and California ARB. These maps were carried over to this study. The proposed advanced European diesel engine torque curve and fueling map were reviewed by ICCT only, as they were developed new for this study. This process was repeated for each of the engine technologies included in the simulation matrix, as shown in Tables 5.4 and 5.5 for conventional stop-start and hybrid powertrain configurations, respectively. Engine downsizing effects were captured using a standard engineering method, by changing the engine displacement in the given vehicle. This approach assumes that the downsized engines have the same brake mean effective pressure (BMEP), which scales the engine's delivered torque by the engine swept volume, or displacement. The brake specific fuel consumption (BSFC) of the scaled engine map is also adjusted by a factor that accounts for the change in heat loss that comes with decreasing the cylinder volume, and thereby increasing the surface to volume ratio of the cylinder. These adjustment factors are plotted in Figure 6.2, and are drawn from Ricardo proprietary data on the effect of displacement on BSFC. The minimum number of cylinders in an engine was set to three, and the minimum per-cylinder volume, to 0.225 liters. These constraints then set the minimum engine displacement in the design space to 0.675 liters. Engine efficiency is therefore function of engine speed and BMEP, with specific fueling rates (mass per unit time) calculated from the torque. Thus, downsizing the engine directly scales the delivered torque, and the fueling map is adjusted accordingly. The engine speed range was held constant over the engine displacement ranges of interest. Turbo lag was represented in the model by applying a first order transfer function between the driver power command and the supplied engine power at a given speed. This transfer function was only used during the performance cycle, which is a hard acceleration from a full stop used to assess vehicle acceleration performance. The transfer function approximates the torque rise rate expected in the engines with turbocharger systems during vehicle launch. Adjusting the time constant in the transfer function allowed the acceleration performance to see the effect of turbo lag. A time constant of 1.5 seconds was selected to represent the expected delay in torque rise on the advanced, boosted engines from the spool up of the turbine. Referring back to the General Motors 2.0-ℓ SIDI engine, turbo transient performance is also characterized by Schmuck-Soldan, et al. (2011), as shown in Figure 6.3 below. The transient response depicted here is in line with the representation used in this study.

Client Name: International Council on Clean Transportation (ICCT) Project No.: C000908 Archive: RD.12/96201.2 Client Confidential
13 April 2012 Page 20
Figure 6.2: Change in BSFC resulting from cylinder heat loss.
Figure 6.3: General Motors two-stage turbo transient performance.
(Schmuck-Soldan, et al., 2011)
250 300 350 400 450 500 550 600 650
BS
FC
ch
an
ge
(%
)
Volume per cylinder
SI Engine
CI Engine
0

Client Name: International Council on Clean Transportation (ICCT) Project No.: C000908 Archive: RD.12/96201.2 Client Confidential
13 April 2012 Page 21
6.3.1 Warm-up Methodology A consistent warm-up modeling methodology was developed for the study to account for the benefits of an electrical water pump and of warm restart for the advanced vehicles. To account for engine warm-up effects, Ricardo used company proprietary data to develop an engine warm-up profile. This engine warm-up profile is used to increase the fueling requirements during the cold start portion of the NEDC, JC08, and FTP75 drive cycles. This correction factor for increased fueling requirements is applied to the fuel flow calculated during the warm-up period in these three drive cycles, as the vehicles start from ambient temperature. The FTP75 cycle consists of three "bags" on the conventional vehicles and an additional bag 4 on hybrid vehicles. A ten minute engine-off soak is performed between Bags 2 and 3 (after 1372 seconds of testing). A Bag 1 correction factor is applied to the simulated "hot" fuel economy result of the vehicles to approximate warm-up conditions of increased friction and sub-optimal combustion. The correction factor reduces the fuel economy results of the FTP75 Bag 1 portion of the drive cycle by 20% on the current baseline vehicles and 10% on 2020–2025 vehicles that take advantage of fast warm-up technologies. For the NEDC and JC08 cycles, Ricardo determined that the engine should be completely warmed up after the first 390 seconds, given the target velocity trace and Ricardo's experience with these cycles. For these two cycles, then, the warm-up correction factor increased the fuel consumption of the advanced vehicles by 11% over the first 390 seconds in the advanced vehicles and by 22% in the baseline vehicles. The NEDC and JC08 drive cycles are shown in Appendix 6. 6.3.2 Accessories Models Parasitic loads from the alternator were assumed constant over the drive cycles and were included in the engine model. Alternator efficiency was assumed to be 55% for the validation models. Ricardo used a 70% efficient alternator in all of the baseline vehicle and advanced technology package simulations to represent future alternator design improvements. The hybrid vehicle configurations are modeled using the high-voltage bus to power the accessories, as this further improves the energy conversion efficiency. Power-assisted steering (PAS) systems—full electric or electric hydraulic—were modeled as being independent of engine speed and were included in the engine model for each baseline vehicle. The EPAS systems assumed contributed no engine parasitic loads on any of the fuel consumption drive cycles and acceleration performance cycles, as they require no steering input. All advanced package simulations included the benefit of full electric EPAS, as electric hydraulic PAS is expected to be used on LDV classes larger than those considered in the study for ICCT. The vehicles modeled were assumed to have electric radiator fans, with the load being drive cycle dependent and added to the vehicle’s base electrical load. Current production cars have begun incorporating advanced alternator control to capture braking energy through electrical power generation. This is done by running the alternator near or at full capacity to apply more load on the engine when the driver demands vehicle deceleration. It is believed that this feature will be widespread in the near future and, hence, the study captures it by incorporating this function into the Conventional Stop-Start model. For the 2020–2025 vehicle configurations, the alternator efficiency was increased to 70% to reflect an improved efficiency design. In addition, the advanced alternator control strategy monitors vehicle brake events and

Client Name: International Council on Clean Transportation (ICCT) Project No.: C000908 Archive: RD.12/96201.2 Client Confidential
13 April 2012 Page 22
captures braking energy when available. The control strategy also limits the maximum power capture to 2800 Watts based on the assumption that the advanced alternator is limited to 200 Amps at 14 Volts charging. By integrating power, energy is accumulated from every brake event and when there is available "stored" brake energy, the control strategy switches the parasitic draw from the engine to the battery until the accrued energy is consumed, at which point the load switches back to the engine. For the LDV classes studied, both the fan and base electrical loads are included in the advanced charging system as electric fans are employed. 6.4 Transmission Models The transmission models use a simplified efficiency curve, where the gearbox efficiency is a function of gear ratio. Efficiencies for each gear ratio were calculated based on data from several transmission and final drive gear tests, were averaged over the expected speed and load ranges for the transmission in a given gear, and incorporate hydraulic pumping losses. Transmission efficiencies were calculated to represent the average of the leading edge for today’s industry and not one particular manufacturer’s design. Different efficiency curves were mapped for planetary, automatics, and dual-clutch, with the DCT efficiency modified depending on whether a dry or wet clutch is used. Advanced automatic transmission designs are projected to reduce losses by 20–33% from current automatic transmissions. In addition, the advanced automatic transmissions use advanced torque converters, described below in Section 6.5. Wet clutch DCT efficiencies are also projected to approach current dry clutch DCT efficiencies. The gear ratios chosen for the six and eight speed advanced transmission, shown below in Table 6.2, are taken from current production values for gear ratios. . Moreover, transmission inertias were adapted from Ricardo proprietary data on contemporary transmissions and reflect the effects of the technologies described in Sections 4.4.6–4.4.11 of Ricardo and SRA (2011).
Table 6.2: Transmission gear ratios for six-speed and eight-speed transmissions.
In anticipation of future technology packages, it is expected that some advanced level of transmission shift optimization will be implemented in year 2020–2025 vehicles. For the 2020–2025 Conventional Stop-Start architecture, an advanced transmission controller was implemented to determine the most favorable gear for a given driver input and vehicle road load. This approach takes the place of predefined calibration shift maps based on throttle and vehicle speed, and requires recalibration for each pairing of engine and transmission. Currently these strategies cause
Eight speed Six speed1 4.700 4.1482 3.130 2.3703 2.100 1.5564 1.670 1.1555 1.290 0.8596 1.000 0.6867 0.840 —8 0.970 —
Gear
Ratio

Client Name: International Council on Clean Transportation (ICCT) Project No.: C000908 Archive: RD.12/96201.2 Client Confidential
13 April 2012 Page 23
significant implications for drivability and hence affect consumer acceptability. Nevertheless, it was assumed that by 2020, manufacturers will develop a means of yielding the fuel economy benefit without adversely affecting driver acceptability. The advanced transmission shift optimization strategy tries to keep the engine operating near its most efficient point for a given power demand. In this way, the new shift controller emulates a traditional CVT by selecting the best gear ratio for fuel economy at a given required vehicle power level. In conjunction, gear efficiency of the desired gear is also taken into account. More often than not, the optimal gear ratio will be in between two of the fixed ratios, and the shift optimizer will then decide when to shift up or down based on a tunable shift setting. This will enable the shift optimizer to make proper shift decisions based on the type of vehicle and the desired aggressiveness of the shift pattern. To protect against operating conditions out of normal range, several key parameters were identified, such as maximum engine speed, minimum lugging speed, and minimum delay between shifts. For automatic transmissions, the torque converter is also controlled by the shift optimizer, with full lockup only achievable when the transmission is not in first gear. Shift time for all transmissions was kept constant at 0.7 second duration as the sensitivity of this parameter was not enough to alter fuel economy predictions over the NEDC and JC08 drive cycles. Furthermore, torque interrupt during shift is handled automatically by the MSC.Easy5™ model component. During development of this strategy, it was noted that fuel economy benefits of up to 5% can be obtained when compared to traditional shift maps. Figure 6.4 compares the desired gear ratio from a CVT and the comparable DCT fixed gear ratio selected by the shift optimizer strategy.
Figure 6.4: Comparison of CVT and optimized DCT gear ratios over transient drive cycle.
6.5 Torque Converter Models Torque converter characteristics curves for torque ratio and K-factor were generated using typical industry standards for efficiency. Each vehicle’s torque converter characteristics for torque ratio
CVT DCT (shift optimizer)

Client Name: International Council on Clean Transportation (ICCT) Project No.: C000908 Archive: RD.12/96201.2 Client Confidential
13 April 2012 Page 24
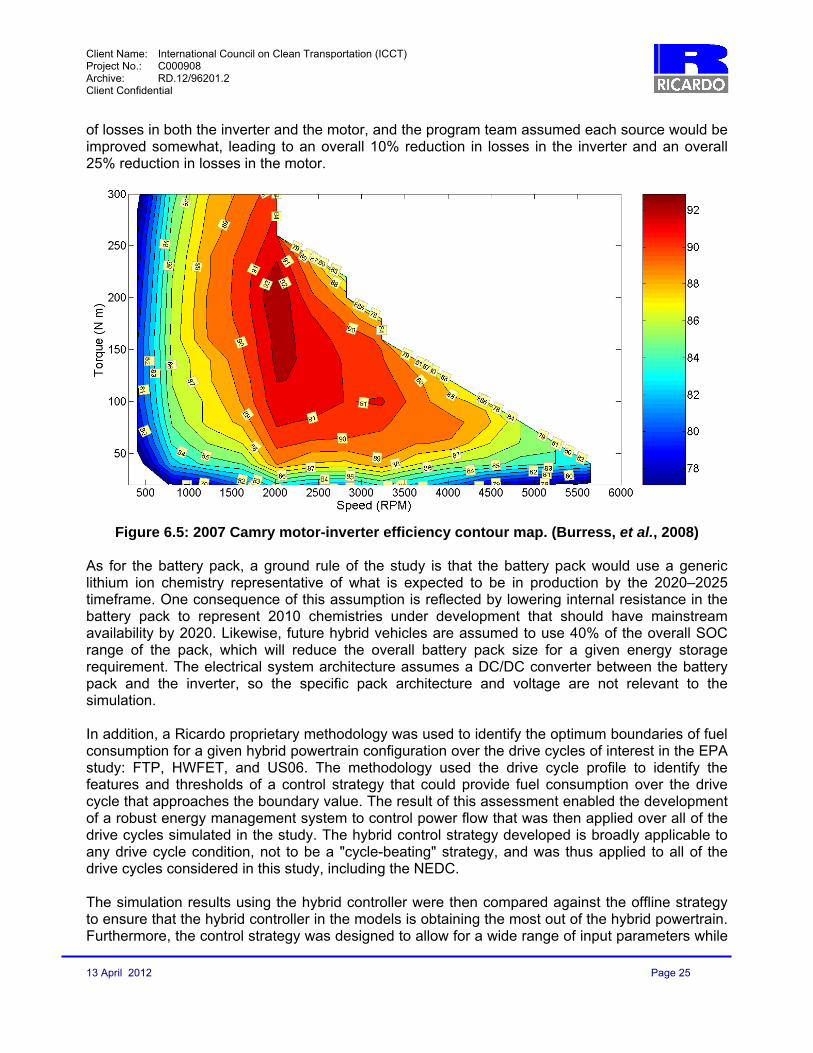
and K-factor were tailored for the application based on Ricardo experience with production systems. Impeller and turbine rotational inertias are also inputs to the model and were estimated based upon Ricardo experience and benchmarking data. Vehicle simulations with advanced automatic transmissions include a slight improvement in torque converter efficiency. A lockup clutch model was used with all torque converters and was of sufficient capacity to prevent clutch slip during all simulation conditions. For the baseline models with six-speed automatics, lockup was allowed in fourth, fifth, and sixth gears. During light throttle conditions a minimum engine operating speed of 1400 rpm for I3 engines, 1300 rpm for I4 engines, 1200 rpm for V6 engines, and 1100 rpm for V8 engines with the converter clutch locked was considered in developing the baseline lock/unlock maps. The advanced automatic transmission applications allow torque converter lockup in any gear except first gear, up to sixth for the Small Car or eighth for the other LDV classes. This aggressive lockup strategy minimizes losses in the torque converter. 6.6 Final Drive Differential Model Baseline final drive ratios were taken from published information and driveline efficiencies and spin losses were estimated based upon Ricardo experience for typical industry differentials. The final drive ratio was varied as a continuous parameter in the design space for the DoE simulations. 6.7 Driver Model The vehicle model is forward facing and has a model for the driver. The driver model contains the drive cycle time–velocity trace, controls the throttle and brake functions, and maintains vehicle speed to the desired set point. The driver model applies the throttle or brake pedal as needed to meet the required speed defined by the vehicle drive cycle within the allowed legislative error. This allows the modeling of the actual vehicle response to meet the target drive cycle. Vehicle simulations for fuel consumption were conducted over the EPA FTP75, HWFET, and US06 drive cycles as well as the NEDC and JC08 cycles. The FTP75 cycle consists of three "bags" for a total of 11.041 miles on the conventional vehicles and an additional bag 4 on hybrid vehicles for a total of 14.9 miles. A ten minute engine-off soak is performed between Bags 2 and 3 (after 1372 seconds of testing). 6.8 Hybrid Models The hybrid models include all of the conventional vehicle components with the addition or replacement of components for electric motor-generators, high voltage battery, high voltage battery controller/bus, transmission, regenerative braking and hybrid supervisory controller. Of these, the critical systems for the model were the electric machines (motor-generators), power electronics, and high-voltage battery system. For each of these systems, current, state of the art technologies such as those described in Staunton, et al. (2006) or Burress, et al. (2008) were adapted to an advanced, 2020–2025 version of the system. Technology improvements applied included decreasing losses in the electric machine and power electronics to represent continued improvements in technology and implementation, so that a contemporary motor-inverter efficiency map such as that shown in Figure 6.5 would end up with higher peak efficiency and a broader island of good efficiency. There are several potential sources
Client Name: International Council on Clean Transportation (ICCT) Project No.: C000908 Archive: RD.12/96201.2 Client Confidential
13 April 2012 Page 25
of losses in both the inverter and the motor, and the program team assumed each source would be improved somewhat, leading to an overall 10% reduction in losses in the inverter and an overall 25% reduction in losses in the motor.
Figure 6.5: 2007 Camry motor-inverter efficiency contour map. (Burress, et al., 2008)
As for the battery pack, a ground rule of the study is that the battery pack would use a generic lithium ion chemistry representative of what is expected to be in production by the 2020–2025 timeframe. One consequence of this assumption is reflected by lowering internal resistance in the battery pack to represent 2010 chemistries under development that should have mainstream availability by 2020. Likewise, future hybrid vehicles are assumed to use 40% of the overall SOC range of the pack, which will reduce the overall battery pack size for a given energy storage requirement. The electrical system architecture assumes a DC/DC converter between the battery pack and the inverter, so the specific pack architecture and voltage are not relevant to the simulation. In addition, a Ricardo proprietary methodology was used to identify the optimum boundaries of fuel consumption for a given hybrid powertrain configuration over the drive cycles of interest in the EPA study: FTP, HWFET, and US06. The methodology used the drive cycle profile to identify the features and thresholds of a control strategy that could provide fuel consumption over the drive cycle that approaches the boundary value. The result of this assessment enabled the development of a robust energy management system to control power flow that was then applied over all of the drive cycles simulated in the study. The hybrid control strategy developed is broadly applicable to any drive cycle condition, not to be a "cycle-beating" strategy, and was thus applied to all of the drive cycles considered in this study, including the NEDC. The simulation results using the hybrid controller were then compared against the offline strategy to ensure that the hybrid controller in the models is obtaining the most out of the hybrid powertrain. Furthermore, the control strategy was designed to allow for a wide range of input parameters while

Client Name: International Council on Clean Transportation (ICCT) Project No.: C000908 Archive: RD.12/96201.2 Client Confidential
13 April 2012 Page 26
striving for the most efficient operation modes. Figure 6.6 illustrates the state flow diagram for the hybrid control strategy used as the baseline for the hybrid control algorithm implemented in MSC.Easy5™, as well as the state variables, driver inputs and system parameters that were used to define the state transitions. There are six main operation state modes, Idle engine off mode: This mode will shut the engine off and set the throttle command to zero. Electric vehicle mode: This mode will leave the engine off and use the throttle command from
the driver to determine the torque command for the electrical machine. Engine-Vehicle synch mode: This mode will start the engine. Normal driving model: This mode determines the ratio of electrical machine and engine power
that will be transmitted to the wheel to achieve the desired demand. Idle mode: This mode starts the countdown for idle engine off mode. Regen mode: This mode determines if regenerative braking is possible and how much of the
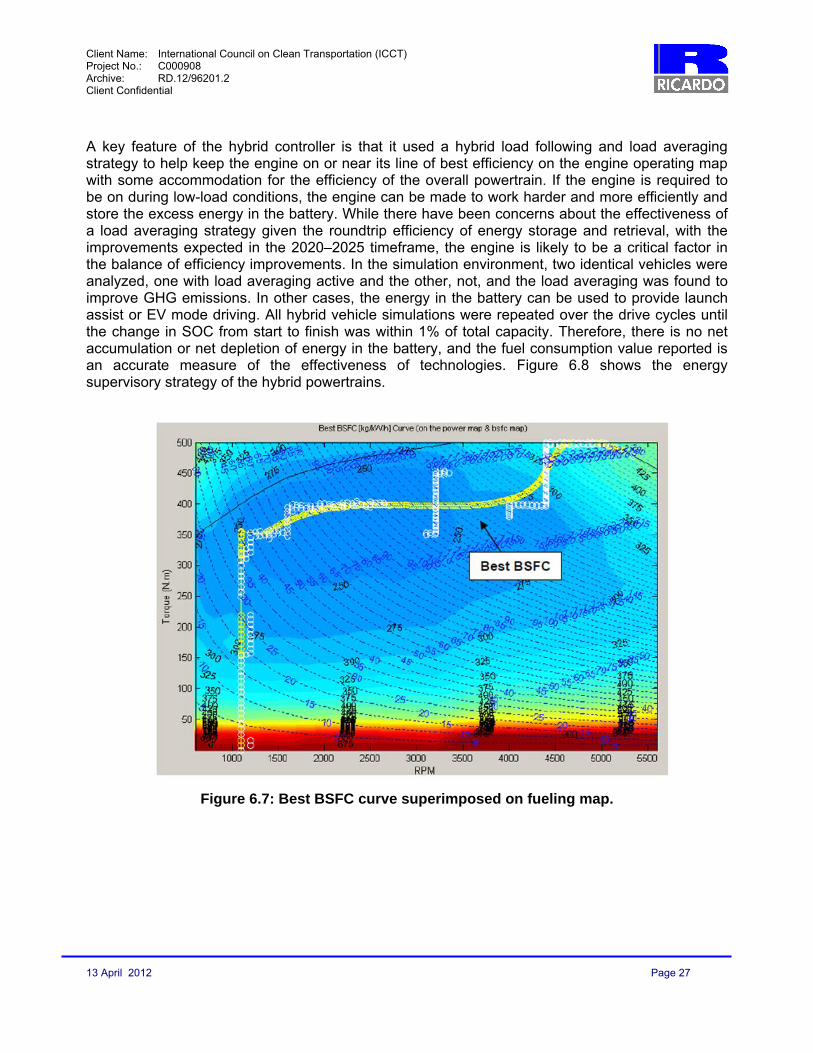
requested brake torque will be assigned to foundation brakes and to the electrical machine. The following inputs and variables or states should be defined and available within the controller in order to full define the state transitions, Driver inputs: throttle and brake pedals Battery State of Charge (SOC) Vehicle speed Engine: power and speed Motor: max power, max torque, speed, and torque/power. Because the design space encompasses a large range of engine displacement and motor sizes, the input parameters were normalized to take into account these changes and automatically adjust the controller thresholds to meet the new demands. Figure 6.7 depicts the engine demand curve that targets high efficiency operation.
Figure 6.6: High level state flow diagram for the hybrid control strategy.
Client Name: International Council on Clean Transportation (ICCT) Project No.: C000908 Archive: RD.12/96201.2 Client Confidential
13 April 2012 Page 27
A key feature of the hybrid controller is that it used a hybrid load following and load averaging strategy to help keep the engine on or near its line of best efficiency on the engine operating map with some accommodation for the efficiency of the overall powertrain. If the engine is required to be on during low-load conditions, the engine can be made to work harder and more efficiently and store the excess energy in the battery. While there have been concerns about the effectiveness of a load averaging strategy given the roundtrip efficiency of energy storage and retrieval, with the improvements expected in the 2020–2025 timeframe, the engine is likely to be a critical factor in the balance of efficiency improvements. In the simulation environment, two identical vehicles were analyzed, one with load averaging active and the other, not, and the load averaging was found to improve GHG emissions. In other cases, the energy in the battery can be used to provide launch assist or EV mode driving. All hybrid vehicle simulations were repeated over the drive cycles until the change in SOC from start to finish was within 1% of total capacity. Therefore, there is no net accumulation or net depletion of energy in the battery, and the fuel consumption value reported is an accurate measure of the effectiveness of technologies. Figure 6.8 shows the energy supervisory strategy of the hybrid powertrains.
Figure 6.7: Best BSFC curve superimposed on fueling map.

Client Name: International Council on Clean Transportation (ICCT) Project No.: C000908 Archive: RD.12/96201.2 Client Confidential
13 April 2012 Page 28
Figure 6.8: Hybrid powertrain energy supervisory strategy.
7. MODEL RESULTS
7.1 Validation Vehicle Models and Baseline Models Vehicle models were developed for a 2010 validation case for each LDV class. Each LDV class was assigned a representative vehicle for the purposes of establishing a baseline against known vehicle data. In this way, the models of the future vehicles can be traced back to a model that provided results matching published fuel consumption and performance results. Ricardo built new validation models for the C Class and Small N1 LDV and leveraged the peer-reviewed validation models from its 2011 study with EPA (Ricardo and SRA, 2011) for the remaining LDV classes from B Class through N1 (Large) to provide the 2010 validation case for the European market. Validation models for versions of the LDV classes equipped with Diesel engines were also developed. For the C Class, the VW Jetta was chosen as the gasoline engine exemplar and the VW Golf, as the diesel engine exemplar. For the Small N1, the Ford Transit Connect was chosen as the exemplar vehicle for both the gasoline and diesel engine versions. Validation results are presented for the C Class and Small N1 vehicles in Table 7.1, along with the validation results for the other LDV classes. Validation results were not generated using the diesel baseline fueling maps.
Client Name: International Council on Clean Transportation (ICCT) Project No.: C000908 Archive: RD.12/96201.2 Client Confidential
13 April 2012 Page 29
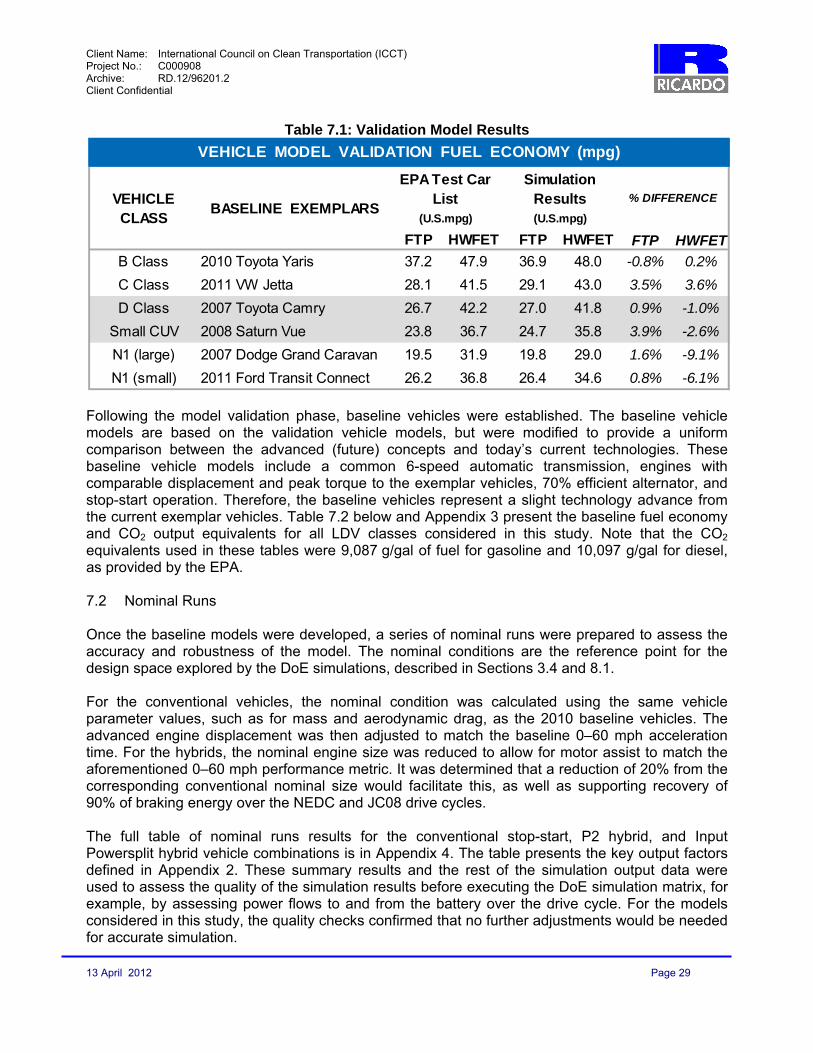
Table 7.1: Validation Model Results
Following the model validation phase, baseline vehicles were established. The baseline vehicle models are based on the validation vehicle models, but were modified to provide a uniform comparison between the advanced (future) concepts and today’s current technologies. These baseline vehicle models include a common 6-speed automatic transmission, engines with comparable displacement and peak torque to the exemplar vehicles, 70% efficient alternator, and stop-start operation. Therefore, the baseline vehicles represent a slight technology advance from the current exemplar vehicles. Table 7.2 below and Appendix 3 present the baseline fuel economy and CO2 output equivalents for all LDV classes considered in this study. Note that the CO2 equivalents used in these tables were 9,087 g/gal of fuel for gasoline and 10,097 g/gal for diesel, as provided by the EPA. 7.2 Nominal Runs Once the baseline models were developed, a series of nominal runs were prepared to assess the accuracy and robustness of the model. The nominal conditions are the reference point for the design space explored by the DoE simulations, described in Sections 3.4 and 8.1. For the conventional vehicles, the nominal condition was calculated using the same vehicle parameter values, such as for mass and aerodynamic drag, as the 2010 baseline vehicles. The advanced engine displacement was then adjusted to match the baseline 0–60 mph acceleration time. For the hybrids, the nominal engine size was reduced to allow for motor assist to match the aforementioned 0–60 mph performance metric. It was determined that a reduction of 20% from the corresponding conventional nominal size would facilitate this, as well as supporting recovery of 90% of braking energy over the NEDC and JC08 drive cycles. The full table of nominal runs results for the conventional stop-start, P2 hybrid, and Input Powersplit hybrid vehicle combinations is in Appendix 4. The table presents the key output factors defined in Appendix 2. These summary results and the rest of the simulation output data were used to assess the quality of the simulation results before executing the DoE simulation matrix, for example, by assessing power flows to and from the battery over the drive cycle. For the models considered in this study, the quality checks confirmed that no further adjustments would be needed for accurate simulation.
FTP HWFET FTP HWFET FTP HWFET
B Class 2010 Toyota Yaris 37.2 47.9 36.9 48.0 -0.8% 0.2%
C Class 2011 VW Jetta 28.1 41.5 29.1 43.0 3.5% 3.6%
D Class 2007 Toyota Camry 26.7 42.2 27.0 41.8 0.9% -1.0%
Small CUV 2008 Saturn Vue 23.8 36.7 24.7 35.8 3.9% -2.6%
N1 (large) 2007 Dodge Grand Caravan 19.5 31.9 19.8 29.0 1.6% -9.1%
N1 (small) 2011 Ford Transit Connect 26.2 36.8 26.4 34.6 0.8% -6.1%
(U.S.mpg)
VEHICLE MODEL VALIDATION FUEL ECONOMY (mpg)
VEHICLE CLASS
BASELINE EXEMPLARS
EPA Test Car List
Simulation Results % DIFFERENCE
(U.S.mpg)

Client Name: International Council on Clean Transportation (ICCT) Project No.: C000908 Archive: RD.12/96201.2 Client Confidential
13 April 2012 Page 30
Table 7.2: Baseline Vehicle Performance
7.3 Manual Transmission vs. DCT Given that manual transmissions are widely used in the European LDV market, and that they are generally considered to be the most efficient type of transmission available, Ricardo conducted a side study for this project to compare the fuel consumption and GHG emissions differences between the advanced dry-clutch DCT and a manual transmission. The vehicle was simulated over the NEDC to determine GHG emissions and fuel consumption. For this study, the C Class vehicle using the Stoichiometric DI Turbocharged engine was used with the various transmissions. A six-speed manual transmission with gear ratios based on that in the VW Golf was used, and compared to both a six-speed and eight-speed advanced DCT. The efficiency of the manual transmission was assumed to be 0.5% better than that of the DCT, where the efficiency is a function of gear ratio. Stop/start functionality was active in all of the vehicles simulated. The baseline shift schedule for the manual transmission vehicles is legislated for official fuel consumption testing on the NEDC. Variations of this shift schedule, with shift speeds adjusted by ±4% and ±8%, were also simulated to determine their effect on fuel consumption. The DCT simulations use the shift optimizer described in Section 6.4. The final results are presented in Table 7.3. The two sets of data reflect the adjustment to FDR to better match 0–60 mph acceleration times for the VW Golf with six-speed manual transmission and six-speed automatic transmission. The DCTs provide a benefit in GHG emissions, ranging from 3.5% to 11%, which suggests that the benefits of the shift optimizer strategy used in the advanced vehicles outweigh the slightly lower mechanical efficiency of the transmission. Adjusting the shift speeds up or down increased or decreased the GHG emissions, respectively, as shown in Table 7.4.
Vehicle
EPA Weight Class (lbs)
Mass (kg)
Displ. (L)
Peak Torq. (Nm)
Peak Power (kW)
Trans Spd-Type
Final Drive Ratio
EPA FTP
EPA HWY
EPA US06
NEDC JC08 FTP HWY US06 NEDC JC080-10 mph (sec)
0-30 mph (sec)
0-50 mph (sec)
0-60 mph (sec)
0-70 mph (sec)
30-50 mph (sec)
50-70 mph (sec)
Speed on 5%
Grd (mph)
Speed on
10% Grd
(mph)
B Class 2625 1191 1.5 145 82 6-AT 4.00 40.3 48.6 30.2 44.0 44.8 140 116 187 128 126 1.4 4.0 7.4 9.9 13.0 3.4 5.6 94.6 82.2
C Class 3250 1474 2.0 170 86 6-AT 3.68 31.4 43.8 29.4 34.3 32.9 180 129 192 165 172 1.0 3.3 7.2 10.0 13.5 3.9 6.3 92.3 73.6
D Class 3625 1644 2.4 218 118 6-AT 3.23 30.5 43.5 29.0 34.0 32.3 185 130 195 166 175 1.0 3.1 6.3 8.3 11.4 3.2 5.1 110.4 86.7
Small CUV 4000 1814 2.4 218 128 6-AT 3.50 27.4 36.0 24.1 30.3 29.7 206 157 235 186 190 1.1 3.4 6.8 9.0 12.6 3.4 5.8 97.9 85.1
N1 (large) 4500 2041 3.8 319 154 6-AT 3.17 22.3 30.6 21.0 24.5 23.9 253 184 269 231 236 1.1 2.9 6.1 8.6 11.5 3.2 5.4 95.7 82.2
N1 (small) 3625 1644 2.0 174 101 6-AT 3.1 30.2 36.8 23.7 31.1 32.9 187 153 238 181 172 1.0 3.7 7.5 10.2 14.4 3.8 6.9 83.02 76.88
Vehicle
EPA Weight Class (lbs)
Mass (kg)
Displ. (L)
Peak Torq. (Nm)
Peak Power (kW)
Trans Spd-Type
Final Drive Ratio
EPA FTP
EPA HWY
EPA US06
NEDC JC08 FTP HWY US06 NEDC JC080-10 mph (sec)
0-30 mph (sec)
0-50 mph (sec)
0-60 mph (sec)
0-70 mph (sec)
30-50 mph (sec)
50-70 mph (sec)
Speed on 5%
Grd (mph)
Speed on
10% Grd
(mph)
B Class 2625 1191 1.2 193 59 6-AT 3.45 53.3 60.9 40.4 57.9 59.6 118 103 155 108 105 1.4 4.1 8.7 12.2 17.0 4.6 8.3 82.0 65.9
C Class 3250 1474 1.6 241 75 6-AT 3.40 47.2 58.7 39.9 50.5 51.6 133 107 157 124 122 1.0 3.3 7.2 10.0 13.5 3.9 6.3 92.3 73.6
D Class 3625 1644 2.0 360 122 6-AT 3.30 44.0 56.4 36.4 47.3 47.6 143 111 173 133 132 1.0 2.9 5.6 7.6 10.0 2.7 4.4 112.1 89.3
Small CUV 4000 1814 2.2 408 131 6-AT 3.65 39.2 47.0 31.9 41.2 43.8 160 134 196 152 143 1.1 3.0 5.9 8.1 10.8 2.9 4.8 102.6 86.1
N1 (large) 4500 2041 2.2 350 103 6-AT 3.65 36.0 42.9 28.8 37.8 39.7 174 146 218 166 158 1.0 3.1 7.2 10.3 14.4 4.2 7.2 89.6 70.4
N1 (small) 3625 1644 1.8 235 66 6-AT 3.55 40.9 45.7 31.1 43.0 45.8 154 137 202 146 137 1.0 3.7 9.3 13.7 20.0 5.6 10.7 74.1 56.5
BASELINE GASOLINE FUEL ECONOMY (mpg) CO2 (g/km) PERFORMANCE
BASELINE DIESEL FUEL ECONOMY (mpg) CO2 (g/km) PERFORMANCE
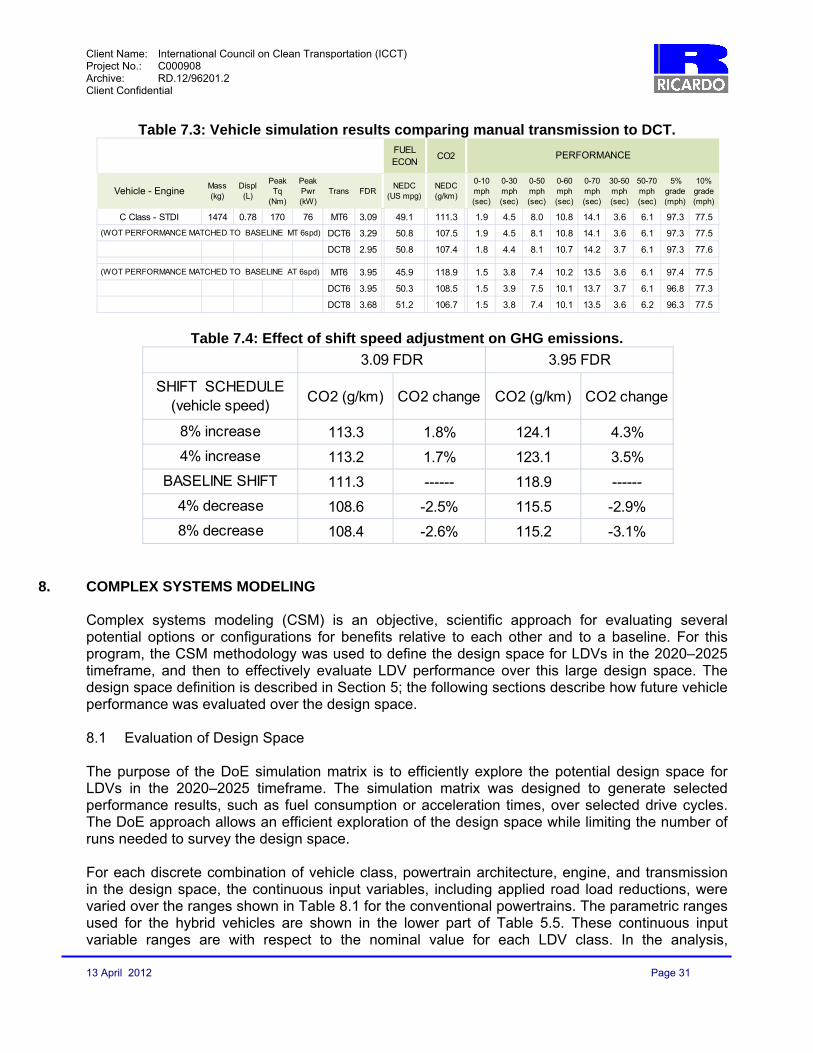
Client Name: International Council on Clean Transportation (ICCT) Project No.: C000908 Archive: RD.12/96201.2 Client Confidential
13 April 2012 Page 31
Table 7.3: Vehicle simulation results comparing manual transmission to DCT.
Table 7.4: Effect of shift speed adjustment on GHG emissions.
8. COMPLEX SYSTEMS MODELING Complex systems modeling (CSM) is an objective, scientific approach for evaluating several potential options or configurations for benefits relative to each other and to a baseline. For this program, the CSM methodology was used to define the design space for LDVs in the 2020–2025 timeframe, and then to effectively evaluate LDV performance over this large design space. The design space definition is described in Section 5; the following sections describe how future vehicle performance was evaluated over the design space. 8.1 Evaluation of Design Space The purpose of the DoE simulation matrix is to efficiently explore the potential design space for LDVs in the 2020–2025 timeframe. The simulation matrix was designed to generate selected performance results, such as fuel consumption or acceleration times, over selected drive cycles. The DoE approach allows an efficient exploration of the design space while limiting the number of runs needed to survey the design space. For each discrete combination of vehicle class, powertrain architecture, engine, and transmission in the design space, the continuous input variables, including applied road load reductions, were varied over the ranges shown in Table 8.1 for the conventional powertrains. The parametric ranges used for the hybrid vehicles are shown in the lower part of Table 5.5. These continuous input variable ranges are with respect to the nominal value for each LDV class. In the analysis,
Vehicle - EngineMass (kg)
Displ (L)
Peak Tq
(Nm)
Peak Pwr (kW)
Trans FDRNEDC
(US mpg)NEDC (g/km)
0-10 mph (sec)
0-30 mph (sec)
0-50 mph (sec)
0-60 mph (sec)
0-70 mph (sec)
30-50 mph (sec)
50-70 mph (sec)
5% grade (mph)
10% grade (mph)
C Class - STDI 1474 0.78 170 76 MT6 3.09 49.1 111.3 1.9 4.5 8.0 10.8 14.1 3.6 6.1 97.3 77.5
DCT6 3.29 50.8 107.5 1.9 4.5 8.1 10.8 14.1 3.6 6.1 97.3 77.5
DCT8 2.95 50.8 107.4 1.8 4.4 8.1 10.7 14.2 3.7 6.1 97.3 77.6
MT6 3.95 45.9 118.9 1.5 3.8 7.4 10.2 13.5 3.6 6.1 97.4 77.5
DCT6 3.95 50.3 108.5 1.5 3.9 7.5 10.1 13.7 3.7 6.1 96.8 77.3
DCT8 3.68 51.2 106.7 1.5 3.8 7.4 10.1 13.5 3.6 6.2 96.3 77.5
PERFORMANCE
(WOT PERFORMANCE MATCHED TO BASELINE MT 6spd)
(WOT PERFORMANCE MATCHED TO BASELINE AT 6spd)
FUEL ECON
CO2
CO2 (g/km) CO2 change CO2 (g/km) CO2 change
113.3 1.8% 124.1 4.3%
113.2 1.7% 123.1 3.5%
111.3 ------ 118.9 ------
108.6 -2.5% 115.5 -2.9%
108.4 -2.6% 115.2 -3.1%
BASELINE SHIFT
4% decrease
8% decrease
3.09 FDR 3.95 FDR
SHIFT SCHEDULE (vehicle speed)
8% increase
4% increase

Client Name: International Council on Clean Transportation (ICCT) Project No.: C000908 Archive: RD.12/96201.2 Client Confidential
13 April 2012 Page 32
continuous input variables are evaluated using a combination of the design corner points in a two-level full factorial design and design points within the space based on a Latin hypercube sampling methodology. Note that vehicle mass is considered independently of the combination of discrete technologies; for example, switching from an automatic transmission to a DCT does not automatically adjust the vehicle mass in the simulation.
Table 8.1: Continuous input parameter sweep ranges with conventional and hybrid powertrains.
Latin hypercube sampling is a statistical method originally developed by McKay et al. (1979), used to generate a set of parameter values over a multidimensional parameter space. The method randomly samples the multidimensional parameter space in a way that provides comprehensive and relatively sparse coverage for best efficiency. It also allows one to efficiently continue to fill the multidimensional parameter space by further random sampling. It provides more flexibility than traditional multi-level factorial designs for assessing a large parametric space with an efficient number of experiments. The vehicle simulations were run in batches and the results were collected and processed. Vehicle fuel economy and performance metrics were recorded as well as diagnostic variables such as the total number of gear shifts and the distance traveled during the drive cycle. The data were reviewed using a data mining tool and outliers were analyzed, and, as necessary, debugged and re-run. This approach allowed issues to be detected and diagnosed very quickly within a large amount of data. Once the data were reviewed and approved, response surface models were generated. 8.2 Response Surface Modeling Response surface models (RSM) were generated in the form of neural networks. The goal was to achieve low residuals while not over-fitting the data. Initially, 66% of the data were used for fitting the model while the remainder was used to validate the response surface model’s prediction performance. Once a good fit was found, all the data were used to populate the RSM. Each neural network fit contains all of the continuous and discrete variables used in the study for a given transmission. One neural network fit per transmission was generated to improve the quality of the parametric fits.
ParameterEngine Displacement 50 125Final Drive Ratio 75 125Rolling Resistance 70 100Aerodynamic Drag 70 100Mass 60 120
DoE Range (%)
Engine Displacement 50 150 50 125Final Drive Ratio 75 125 75 125Rolling Resistance 70 100 70 100Aerodynamic Drag 70 100 70 100Mass 60 120 60 120Electric Machine Size 50 300 50 150
PowersplitP2 HybridDoE Range (%)
Parameter

Client Name: International Council on Clean Transportation (ICCT) Project No.: C000908 Archive: RD.12/96201.2 Client Confidential
13 April 2012 Page 33
9. RESULTS 9.1 Basic Results of Simulation Each of the simulation cases generated data at 10 Hz which allowed evaluation of the performance of a specific vehicle configuration in the design space over each of the drive cycles. These results include parameters such as vehicle speed, calculated engine power, and instantaneous fueling rate. The detailed data from each simulation run were then distilled into the main output factors of interest, such as acceleration time and fuel economy, that were then used in the parametric fit of the RSM. For this study, the main output factors include raw fuel economy and GHG emissions over each of the drive cycles studied and also performance metrics, such as 0–60 mph acceleration times. The complete list of output factors is listed in Appendix 2. 9.2 Design Space Query The Design Space Query within the Data Visualization Tool allows the user to assess a specific vehicle configuration in the design space by selecting a platform, engine, and transmission and then setting the continuous variables within the design space range. The generated performance results are then reported in a table that is exportable to Excel. The user can assess multiple vehicle configurations and compare them in Excel. The tool table also allows the user to apply spreadsheet formulas for quick, on-the-side computation. An example of the Design Space Query is shown in Figure 9.1. Results from the Design Space Query showing the effect of powertrain configuration and road loads on greenhouse gas emissions from a C Class vehicle are presented in Table 9.1. As described above in Section 7.1, the baseline results are for a C Class vehicle with contemporary engine and six-speed automatic transmission and stop-start functionality. Note that the C Class vehicle mass is based on the EPA Test Car List data, and is therefore somewhat heavier than the typical European test mass for such a vehicle. The advanced C Class vehicles compare several combinations of engine and powertrain with varying levels of vehicle mass, rolling resistance, and aerodynamic drag compared to the nominal value. The conventional vehicles have stop-start functionality implemented, and the P2 Hybrid uses the same eight-speed dual clutch transmission (DCT) as the conventional vehicles. The cases with 100% of baseline vehicle mass, rolling resistance and aerodynamic drag all have equivalent performance, as measured by 0–60 mph acceleration times. Engine power was not adjusted as the vehicle mass was reduced, so the acceleration times decrease with decreasing vehicle mass, meaning that the performance improves slightly. The values in Table 9.1 are generated from the RSM fit to the DoE simulation results that are implemented in the DVT, and therefore the results differ slightly from the Nominal Results presented in Appendix 4, which come directly from the vehicle performance simulations. Also, more precisely matching the 0–60 mph (0–97 km/h) acceleration times can improve GHG emissions by up to 5% for the first step to 85% nominal weight and 90% of nominal rolling resistance and aerodynamic drag, and up to 10% for the second step. The largest improvements are seen with the Powersplit hybrid with the Atkinson engine with cam profile switching and the Advanced European Diesel used with the eight-speed DCT; otherwise, the results are within 1% and 2.5%, respectively.

Client Name: International Council on Clean Transportation (ICCT) Project No.: C000908 Archive: RD.12/96201.2 Client Confidential
13 April 2012 Page 34
9.3 Exploration of the Design Space A more comprehensive survey of the design space can be conducted using the Design Space Analysis in the Data Visualization Tool, which allows the user to assess the performance of multiple vehicle configurations from a significant portion of the design space simultaneously. Each design is generated by selecting a vehicle platform, engine, and transmission, and then by selecting ranges for the continuous input variables. Figure 9.2 shows the screen where the design space analysis is set up. For each of the continuous variables, values are generated using a Monte Carlo analysis from a uniform distribution over the range selected.
Table 9.1: Selected C Class Vehicle results, showing benefit of varying road loads.
Once generated, the results at the design points are stored and may be plotted to visualize the effects of varying vehicle parameters over the design space. By carefully building a design and varying the parameters, the user can gain an understanding of the effect of each technology and the interactions between technologies. Figures 9.3–9.5 show examples of plots that compare three design space analyses using a C Class vehicle. In these cases, the black point shows the 2010 SI baseline performance. The dark blue points are for a future conventional vehicle with stoichiometric DI turbo engine and eight-speed dry-clutch DCT; the light blue points are for a P2 Hybrid with Atkinson (CPS) engine; and the orange points are for a Powersplit hybrid with Atkinson (DVA) engine. For these examples, the engine displacement was varied from 50% to 125% of nominal, and the vehicle mass, from 60% to 110% of nominal test weight, or 885 to 1620 kg. In addition, the rolling resistance and aerodynamic drag factors were each reduced to 90% of their nominal values. For the hybrids, the electric machine sizes were swept from 50%–150% of nominal size for the
Baseline with SI engine 1474 100% 100% 165 10.0Baseline with Diesel engine 1474 100% 100% 124 10.0
1474 100% 100% 107 10.21253 90% 90% 93 8.81032 80% 80% 80 7.41474 100% 100% 105 10.21253 90% 90% 90 8.71032 80% 80% 77 7.41474 100% 100% 102 10.21253 90% 90% 89 8.81032 80% 80% 77 7.41474 100% 100% 104 10.21253 90% 90% 93 8.81032 80% 80% 83 7.41474 100% 100% 96 9.61253 90% 90% 86 8.21032 80% 80% 77 6.91474 100% 100% 93 10.21253 90% 90% 81 9.01032 80% 80% 72 7.6
g CO2/km
on NEDCC Class Vehicle ConfigurationAero. Drag
Vehicle Mass (kg)
Rolling Resist.
Stoich DI Turbo + 8-spd DCT
Lean-Stoich DI Turbo + 8-spd DCT
Adv EU Diesel + 8-spd DCT
Atkinson (CPS) P2 Hybrid
Atkinson (CPS) Powersplit Hybrid
EGR DI Turbo + 8-spd DCT
0-60 mph Accel time (s)

Client Name: International Council on Clean Transportation (ICCT) Project No.: C000908 Archive: RD.12/96201.2 Client Confidential
13 April 2012 Page 35
Powersplit or 50%–250% for the P2 Hybrid. Performance neutrality was not enforced for these results, as is clearly shown in Figure 9.5. The example in Figure 9.6 compares GHG emissions performance across all five LDV classes. In this example, each LDV class used a lean-stoichiometric DI turbo engine with DCT. The vehicle mass and final drive ratio were varied from the minimum to the maximum allowed for each vehicle class; the engine displacement was varied from 70% to 100% of nominal; and the rolling resistance and aerodynamic drag factors were set to 85% of nominal for each vehicle class. The three passenger cars cluster together, as do the CUV and two N1 vehicles, which are a function of road loads in the two groups.
Figure 9.1: ICCT Design Space Query screen in Data Visualization Tool.
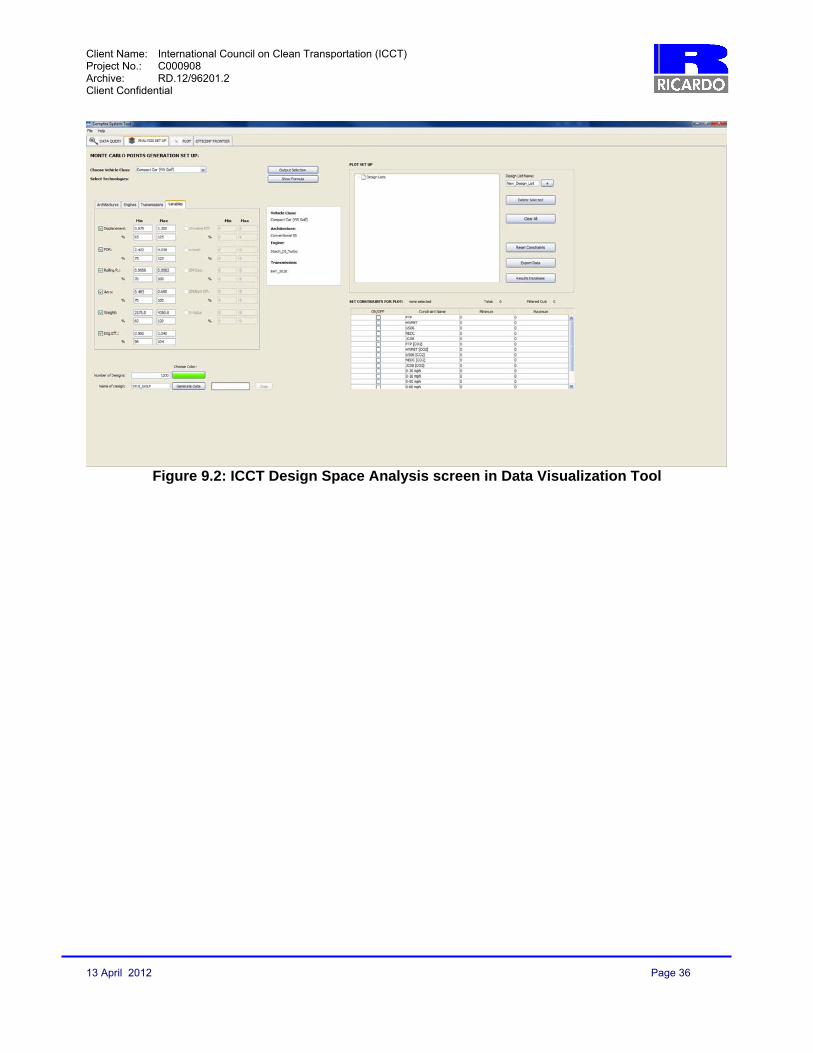
Client Name: International Council on Clean Transportation (ICCT) Project No.: C000908 Archive: RD.12/96201.2 Client Confidential
13 April 2012 Page 36
Figure 9.2: ICCT Design Space Analysis screen in Data Visualization Tool

Client Name: International Council on Clean Transportation (ICCT) Project No.: C000908 Archive: RD.12/96201.2 Client Confidential
13 April 2012 Page 37
Figure 9.3: C Class vehicle Design Space Analysis example varying engine displacement
and vehicle mass with conventional powertrain, P2 hybrid, or powersplit hybrid.
BaselineSDIT & DCTP2 (Atk. CPS)Powersplit (Atk.DVA)
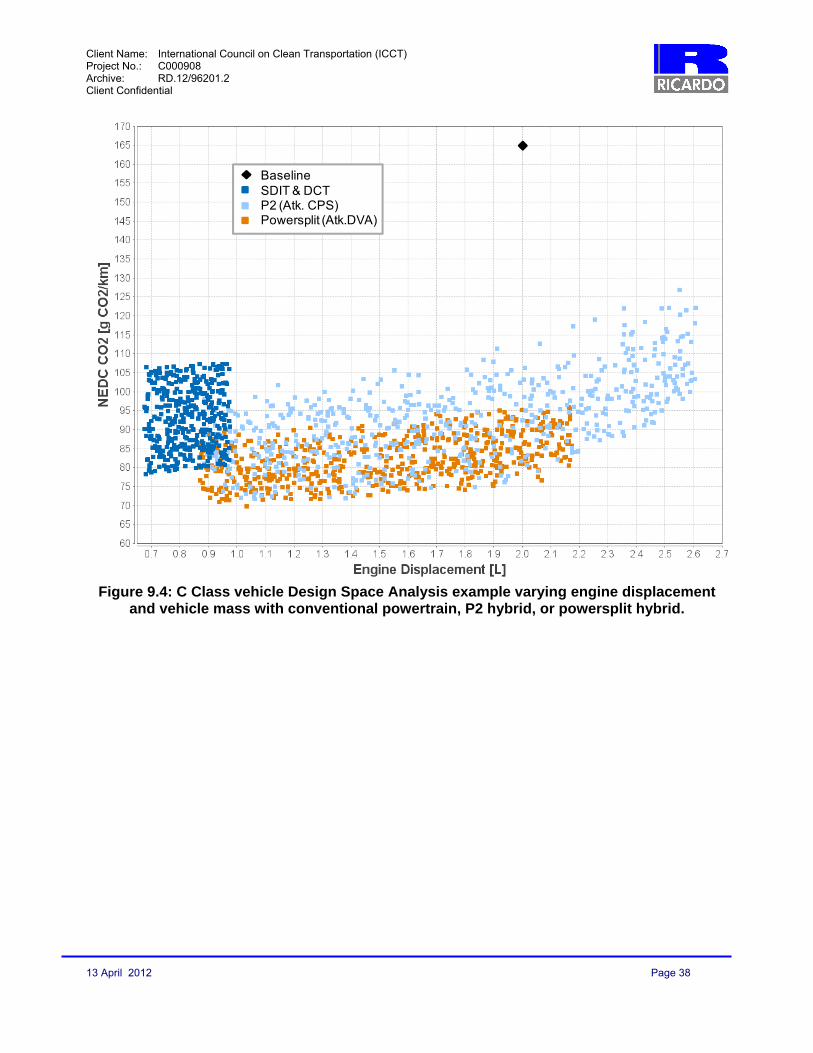
Client Name: International Council on Clean Transportation (ICCT) Project No.: C000908 Archive: RD.12/96201.2 Client Confidential
13 April 2012 Page 38
Figure 9.4: C Class vehicle Design Space Analysis example varying engine displacement
and vehicle mass with conventional powertrain, P2 hybrid, or powersplit hybrid.
BaselineSDIT & DCTP2 (Atk. CPS)Powersplit (Atk.DVA)

Client Name: International Council on Clean Transportation (ICCT) Project No.: C000908 Archive: RD.12/96201.2 Client Confidential
13 April 2012 Page 39
Figure 9.5: C Class vehicle Design Space Analysis example varying engine displacement
and vehicle mass with conventional powertrain, P2 hybrid, or powersplit hybrid.
BaselineSDIT & DCTP2 (Atk. CPS)Powersplit (Atk.DVA)

Client Name: International Council on Clean Transportation (ICCT) Project No.: C000908 Archive: RD.12/96201.2 Client Confidential
13 April 2012 Page 40
Figure 9.6: Design Space Analysis example comparing greenhouse gas emissions across vehicle classes with respect to vehicle weight. Engine displacement and final drive ratio
were also varied. 9.4 Identification and Use of the Efficient Frontier Part of assessing the selected regions of the design space is to find configurations that balance efficiency and performance. The Data Visualization Tool identifies an Efficient Frontier, which is the bound of the sampled design space that has the most desirable performance. The user must first define a dataset using the Design Space Query, described above in Section 9.2, and then select the Efficient Frontier tab in the Data Visualization Tool. An example of the Efficient Frontier screen is shown in Figure 9.7. The Efficient Frontier is marked out in red, and the user can click on the data points along the frontier to discover the vehicle configurations that lie on the frontier. In this example, the Efficient Frontier is marking out the best combination of NEDC CO2 emissions and 0-60 mph acceleration times for a C Class P2 Hybrid with Atkinson (CPS) engine, where the rolling resistance and aerodynamic drag have been reduced 10% and the vehicle mass and engine displacement are being swept.
Large N1Small N1Small CUVD ClassC ClassB Class

Client Name: International Council on Clean Transportation (ICCT) Project No.: C000908 Archive: RD.12/96201.2 Client Confidential
13 April 2012 Page 41
Figure 9.7: Efficient Frontier screen of Data Visualization Tool with example plot.
10. CONCLUSIONS
The following conclusions are supported by this program's results: An independent, objective, and robust analytical study of the effectiveness of selected LDV
technologies expected to be prevalent in the 2020–2025 timeframe, and their effects on vehicle performance has been completed.
A comprehensive review process was completed to identify technologies likely to be available in the 2020–2025 timeframe and to estimate their future performance given current trends and expected developments.
The vehicle performance models were based upon the underlying physics of the technologies and have been validated with good result to available test data. Quality assurance checks have been made throughout the study to ensure accuracy of the trends in the results.
The Data Visualization Tool allows ICCT and other stakeholders to efficiently examine the design space developed through the program's complex systems modeling approach and to assess trade-offs between various vehicle configurations and their performance. The tool provides the necessary functionality to assess specific vehicle designs or more comprehensively explore the design space.

Client Name: International Council on Clean Transportation (ICCT) Project No.: C000908 Archive: RD.12/96201.2 Client Confidential
13 April 2012 Page 42
11. REFERENCES Beazley, R., 2010, "EBDI® – Application of a high BMEP downsized spark ignited engine". Presented at 2010 DEER Conference, Detroit, Mich. Burress, T.A., C.L. Coomer, S.L. Campbell, L.E. Seiber, R.H. Staunton, and J.P. Cunningham, 2008, "Evaluation of the 2007 Toyota Camry Hybrid Synergy Drive System." ORNL technical report TM-2007/190. Coltman, D., J.W.G. Turner, R. Curtis, D. Blake, B. Holland, R.J. Pearson, A. Arden, and H. Nuglisch, 2008, "Project Sabre: A close-spaced direct injection 3-cylinder engine with synergistic technologies to achieve low CO2 output." SAE Technical Paper 2008-01-0138. Cruff, L., M. Kaiser, S. Krause, R. Harris, U. Krueger, M. Williams, 2010, "EBDI® – Application of a fully flexible high BMEP downsized spark ignited engine." SAE Technical Paper 2010-01-0587. Environmental Protection Agency, 2010, "Test Car List Data Files", available from www.epa.gov/oms/tcldata.htm. Fiat Powertrain Technologies, S.p.A., 2009, "MultiAir: The ultimate air management strategy". http://www.fptmultiair.com/flash_multiair_eng/home.htm Hellenbroich, G., and V. Rosenburg, 2009, "FEV's new parallel hybrid transmission with single dry clutch and electric torque support." Aachener Koloquium Fahrzeug- und Motorentechnik 2009 18:1209–1222. Hohenner, H., 2010, "Current trends on powertrain development – Downsizing and downspeeding." 4th CTI Symposium on Automotive Transmissions and Drivetrains – North America, Jun 2010. Honda Motor Company, 2011, "The VTEC breakthrough: Solving a century-old dilemma". http://world.honda.com/automobile-technology/VTEC/ Lumsden, G., D. OudeNijeweme, N. Fraser, and H. Blaxill, 2009, "Development of a turbocharged direct injection downsizing demonstrator engine". SAE Technical Paper 2009-01-1503. McKay, M.D., R.J. Beckman, and W.J. Conover, 1979, "A comparison of three methods for selecting values of input variables in the analysis of output from a computer code." Technometrics 21(2): 239–245. “MSC Easy5 Advanced Controls Simulation”, downloaded from http://www.mscsoftware.com/Products/CAE-Tools/Easy5.aspx. Last accessed 12 Aug 2011 Muta, K., Y. Makoto, and J. Tokieda, 2004, "Development of new-generation hybrid system THS II – Drastic improvement of power performance and fuel economy." SAE Technical Paper 2004-01-0064. Ricardo and PQA, 2008, A Study of Potential Effectiveness of Carbon Dioxide Reducing Vehicle Technologies. EPA Report 420-R-08-004a.

Client Name: International Council on Clean Transportation (ICCT) Project No.: C000908 Archive: RD.12/96201.2 Client Confidential
13 April 2012 Page 43
Ricardo and SRA, 2011, Computer Simulation of Light-Duty Vehicle Technologies for Greenhouse Gas Emission Reduction in the 2020–2025 Timeframe. EPA Report EPA-420-R-11-020. [Available from http://www.epa.gov/otaq/climate/publications.htm#vehicletechnologies] Schaeffler Group, 2010, "Important Facts About UniAir/MultiAir". http://www.ina.de/content.ina.de/en/press/press-releases/press-details.jsp?id=3429505 Schmuck-Soldan, S., A. Königstein, and F. Westin, 2011, “Two-Stage Boosting of Spark Ignition Engines.” Internationales Wiener Motorensymposium 2011 Europe S.r.l., Torino. Shaw, J.R., 2009, “Testimony to Joint EPA/NHTSA Hearing on Proposed Rulemaking to Establish Light Duty Vehicle Greenhouse Gas Emissions Standards and Corporate Average Fuel Economy Standards”. Downloaded from www.autosteel.org last accessed 27 Oct 2009 Staunton, R.H., C.W. Ayers, L.D. Marlino, J.N. Chiasson, T.A., Burress, 2006, "Evaluation of 2004 Toyota Prius Hybrid Electric Drive System". ORNL technical report TM-2006/423. Turner, J.W.G., R.J. Pearson, R. Curtis, and B. Holland, 2009, "Sabre: A cost-effective engine technology combination for high efficiency, high performance and low CO2 emissions." Low Carbon Vehicles 2009: Institution of Mechanical Engineers (IMechE) conference proceedings. Weissier, P., 2011, "Engine stop-start deployment in U.S. faces challenge from loss of A/C." AEI, 5 July 2011, pp. 10–12.

Client Name: International Council on Clean Transportation (ICCT) Project No.: C000908 Archive: RD.12/96201.2 Client Confidential
13 April 2012 Page 44
12. APPENDICES 12.1 Appendix 1, Abbreviations AMT Automated manual transmission ARB California Air Resources Board BEV Battery electric vehicle BMEP Brake mean effective pressure BSFC Brake specific fuel consumption CI Compression ignition CPS Cam profile switching CSM Complex systems modeling CVT Continuously variable transmission DCT Dual clutch transmission DI Direct injection DoE Design of experiments DVA Digital valve actuation EGR Exhaust gas recirculation EPA United States Environmental Protection Agency EPAS Electric power assisted steering EV Electric vehicle FCEV Fuel cell electric vehicle FEAD Front end accessory drive FIE Fuel injection equipment FMEP Friction mean effective pressure GHG Greenhouse gas ICCT International Council on Clean Transportation ICE Internal combustion engine IMEP Indicated mean effective pressure KERS Kinetic energy recovery system LDT Light-duty truck LDV Light-duty vehicle LEV Low emissions vehicle LHDT Light heavy-duty truck LNT Lean NOx trap MPV Multi-purpose vehicle NA Naturally aspirated NEDC New European Driving Cycle NMEP Net mean effective pressure NOx Nitrogen oxides NVH Noise, vibration, and harshness OEM Original equipment manufacturer ORNL Oak Ridge National Laboratory OTAQ Office of Transportation and Air Quality PAS Power assisted steering PFI Port fuel injection PHEV Plug-in hybrid electric vehicle PMEP Pumping mean effective pressure PQA Perrin Quarles Associates

Client Name: International Council on Clean Transportation (ICCT) Project No.: C000908 Archive: RD.12/96201.2 Client Confidential
13 April 2012 Page 45
RSM Response surface model SCR Selective catalytic reduction SI Spark ignited SME Subject matter expert SOC State of charge SRA Systems Research and Applications Corporation SULEV Super ultra low emissions vehicle V2I Vehicle to infrastructure V2V Vehicle to vehicle VA Valve actuation

Client Name: International Council on Clean Transportation (ICCT) Project No.: C000908 Archive: RD.12/96201.2 Client Confidential
13 April 2012 Page 46
12.2 Appendix 2, Output Factors for Study Raw fuel consumption in liters per 100 km and GHG emissions in grams of CO2 per km over the following drive cycles:
NEDC JC08 FTP75 HWFET US06 HWFET and FTP combined
Acceleration performance metrics, including
0–10 mph acceleration time 0–30 mph acceleration time 0–50 mph acceleration time 0–60 mph acceleration time 0–70 mph acceleration time 30–50 mph acceleration time 50–70 mph acceleration time Top speed at 5% grade Top speed at 10% grade Velocity at 1.3 sec Velocity at 3.0 sec Distance at 1.3 sec Distance at 3.0 sec Maximum grade at 70 mph at GCW Maximum grade at 60 mph at GCVW (LDT and LHDT only)

Client Name: International Council on Clean Transportation (ICCT) Project No.: C000908 Archive: RD.12/96201.2 Client Confidential
13 April 2012 Page 47
12.3 Appendix 3, Input Factors and Baseline Run Results The following table contains the baseline values for the key input parameters for the vehicle performance models, by vehicle class. Vehicle mass is taken from the EPA Test Car List data; the final drive ratio comes from published information; rolling resistance and aerodynamic drag (Cd·A) are fit using the coastdown parameters; and the electric machine sizes are determined by matching 0–60 mph acceleration times.
The table on the next page contains the Baseline results simulated with the original vehicle engine maps (gasoline and diesel) and original vehicle parameters (aero, weight, tires) as shown above. The baseline model includes start-stop functionality.
Vehicle Class EP
A T
est
Wt
(lb
)
EP
A T
est
Wt
(kg
)
Fin
al D
rive
Rat
io
Tir
e R
olli
ng
R
esis
tan
ce C
oef
f.
(N∙s
)
Aer
od
ynam
ic D
rag
Cd∙A
(m
2)
No
min
al P
2 E
lect
ric
Mac
hin
e S
ize
(kW
)
No
min
al
Po
wer
split
EM
S
ize
(kW
)
B Class 2625 1189 4.00 0.0094 0.736 14 40C Class 3250 1472 3.69 0.0083 0.650 20 40D Class 3625 1642 3.23 0.0082 0.690 24 80Small CUV 4000 1812 3.50 0.0069 0.925 20 70N1 (Small) 3629 1644 3.39 0.0083 1.040 22 85N1 (Large) 4500 2039 3.17 0.0072 0.952 25 90
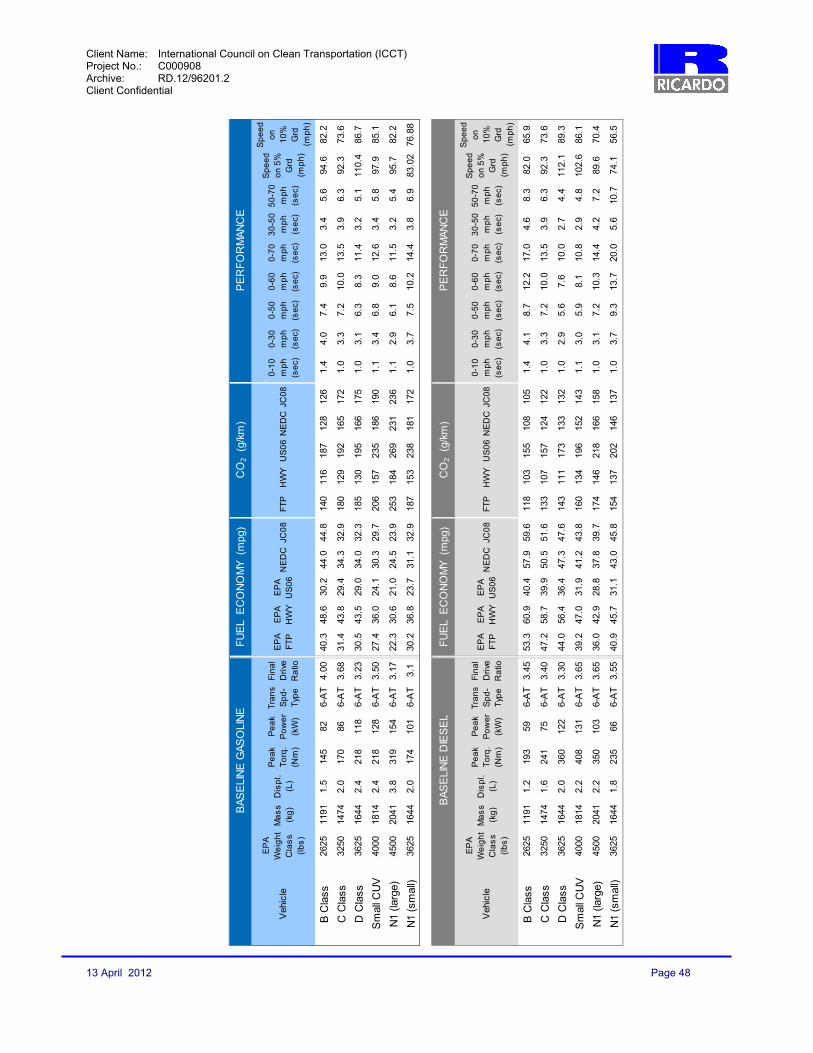
Client Name: International Council on Clean Transportation (ICCT) Project No.: C000908 Archive: RD.12/96201.2 Client Confidential
13 April 2012 Page 48
Veh
icle
EP
A
We
igh
t C
las
s
(lb
s)
Ma
ss
(k
g)
Dis
pl.
(L)
Pe
ak
To
rq.
(Nm
)
Pe
ak
Po
we
r (k
W)
Tra
ns
S
pd
-T
ype
Fin
al
Dri
ve
Ra
tio
EP
A
FT
PE
PA
H
WY
EP
A
US
06
NE
DC
JC0
8F
TP
HW
YU
S0
6N
ED
CJC
08
0-1
0
mp
h
(se
c)
0-3
0
mp
h
(se
c)
0-5
0
mp
h
(se
c)
0-6
0
mp
h
(se
c)
0-7
0
mp
h
(se
c)
30
-50
m
ph
(s
ec)
50
-70
m
ph
(s
ec)
Sp
ee
d
on
5%
G
rd
(mp
h)
Sp
ee
d
on
1
0%
G
rd
(mp
h)
B C
lass
2625
1191
1.5
145
826-
AT
4.00
40.3
48.6
30.2
44.0
44.8
140
116
187
128
126
1.4
4.0
7.4
9.9
13.0
3.4
5.6
94.6
82.2
C C
lass
3250
1474
2.0
170
866-
AT
3.68
31.4
43.8
29.4
34.3
32.9
180
129
192
165
172
1.0
3.3
7.2
10.0
13.5
3.9
6.3
92.3
73.6
D C
lass
3625
1644
2.4
218
118
6-A
T3.
2330
.543
.529
.034
.032
.318
513
019
516
617
51.
03.
16.
38.
311
.43.
25.
111
0.4
86.7
Sm
all C
UV
4000
1814
2.4
218
128
6-A
T3.
5027
.436
.024
.130
.329
.720
615
723
518
619
01.
13.
46.
89.
012
.63.
45.
897
.985
.1
N1
(larg
e)45
0020
413.
831
915
46-
AT
3.17
22.3
30.6
21.0
24.5
23.9
253
184
269
231
236
1.1
2.9
6.1
8.6
11.5
3.2
5.4
95.7
82.2
N1
(sm
all)
3625
1644
2.0
174
101
6-A
T3.
130
.236
.823
.731
.132
.918
715
323
818
117
21.
03.
77.
510
.214
.43.
86.
983
.02
76.8
8
Veh
icle
EP
A
We
igh
t C
las
s
(lb
s)
Ma
ss
(k
g)
Dis
pl.
(L)
Pe
ak
To
rq.
(Nm
)
Pe
ak
Po
we
r (k
W)
Tra
ns
S
pd
-T
ype
Fin
al
Dri
ve
Ra
tio
EP
A
FT
PE
PA
H
WY
EP
A
US
06
NE
DC
JC0
8F
TP
HW
YU
S0
6N
ED
CJC
08
0-1
0
mp
h
(se
c)
0-3
0
mp
h
(se
c)
0-5
0
mp
h
(se
c)
0-6
0
mp
h
(se
c)
0-7
0
mp
h
(se
c)
30
-50
m
ph
(s
ec)
50
-70
m
ph
(s
ec)
Sp
ee
d
on
5%
G
rd
(mp
h)
Sp
ee
d
on
1
0%
G
rd
(mp
h)
B C
lass
2625
1191
1.2
193
596-
AT
3.45
53.3
60.9
40.4
57.9
59.6
118
103
155
108
105
1.4
4.1
8.7
12.2
17.0
4.6
8.3
82.0
65.9
C C
lass
3250
1474
1.6
241
756-
AT
3.40
47.2
58.7
39.9
50.5
51.6
133
107
157
124
122
1.0
3.3
7.2
10.0
13.5
3.9
6.3
92.3
73.6
D C
lass
3625
1644
2.0
360
122
6-A
T3.
3044
.056
.436
.447
.347
.614
311
117
313
313
21.
02.
95.
67.
610
.02.
74.
411
2.1
89.3
Sm
all C
UV
4000
1814
2.2
408
131
6-A
T3.
6539
.247
.031
.941
.243
.816
013
419
615
214
31.
13.
05.
98.
110
.82.
94.
810
2.6
86.1
N1
(larg
e)45
0020
412.
235
010
36-
AT
3.65
36.0
42.9
28.8
37.8
39.7
174
146
218
166
158
1.0
3.1
7.2
10.3
14.4
4.2
7.2
89.6
70.4
N1
(sm
all)
3625
1644
1.8
235
666-
AT
3.55
40.9
45.7
31.1
43.0
45.8
154
137
202
146
137
1.0
3.7
9.3
13.7
20.0
5.6
10.7
74.1
56.5
BA
SE
LIN
E G
AS
OLI
NE
FU
EL
EC
ON
OM
Y (
mpg
)C
O2 (
g/km
)P
ER
FO
RM
AN
CE
BA
SE
LIN
E D
IES
EL
FU
EL
EC
ON
OM
Y (
mpg
)C
O2 (
g/km
)P
ER
FO
RM
AN
CE

Client Name: International Council on Clean Transportation (ICCT) Project No.: C000908 Archive: RD.12/96201.2 Client Confidential
13 April 2012 Page 49
12.4 Appendix 4, Nominal Run Results Nominal Run results simulated with advanced engine map, but baseline vehicle parameters (aero, weight, tires, FDR). See Section 7.2 for full details on the Nominal Runs.
Veh
icle
- E
ngin
e
EP
A
We
igh
t C
las
s
(lb
s)
Ma
ss
(k
g)
Dis
pl.
(L)
Pe
ak
To
rq.
(Nm
)
Pe
ak
Po
we
r (k
W)
Tra
ns
S
pd
-T
ype
Fin
al
Dri
ve
Ra
tio
EP
A
FT
PE
PA
H
WY
EP
A
US
06
NE
DC
JC0
8E
PA
F
TP
EP
A
HW
YE
PA
U
S0
6N
ED
CJC
08
0-1
0
mp
h
(se
c)
0-3
0
mp
h
(se
c)
0-5
0
mp
h
(se
c)
0-6
0
mp
h
(se
c)
0-7
0
mp
h
(se
c)
30
-50
m
ph
(s
ec)
50
-70
m
ph
(s
ec)
Sp
ee
d
on
5%
G
rd
(mp
h)
Sp
ee
d
on
1
0%
G
rd
(mp
h)
B C
lass
- S
TDI
2625
1191
0.74
157
72A
T64.
0053
.255
.132
.453
.158
.610
610
217
410
696
1.5
4.0
7.4
10.0
13.1
3.4
5.7
96.2
79.3
B C
lass
- L
BD
I26
2511
910.
7415
772
AT6
4.00
55.1
56.0
32.6
55.1
61.2
102
101
173
102
921.
54.
07.
410
.013
.13.
45.
796
.279
.3
B C
lass
- E
GR
B26
2511
910.
7415
772
AT6
4.00
55.1
57.4
33.9
55.3
60.6
102
9816
710
293
1.5
4.0
7.4
10.0
13.1
3.4
5.7
96.2
79.3
B C
lass
- 2
020
Die
sel
2625
1191
1.13
204
69A
T64.
0061
.671
.046
.664
.768
.310
288
135
9792
1.3
3.7
7.4
10.0
13.6
3.7
6.2
92.4
75.9
C C
lass
- S
TDI
3250
1474
0.78
170
76A
T83.
6845
.955
.132
.950
.152
.112
310
217
211
310
81.
03.
37.
210
.013
.53.
86.
495
.476
.4
C C
lass
- L
BD
I32
5014
740.
7817
076
AT8
3.68
47.3
55.9
33.1
51.9
53.8
119
101
171
109
105
1.0
3.4
7.2
10.0
13.5
3.8
6.3
95.4
76.4
C C
lass
- E
GR
B32
5014
740.
7817
076
AT8
3.68
48.1
57.6
34.5
52.5
54.5
117
9816
410
810
41.
03.
37.
210
.013
.53.
86.
495
.476
.4
C C
lass
- 2
020
Die
sel
3250
1474
1.27
229
77A
T83.
6855
.470
.246
.460
.760
.111
389
135
103
104
1.2
3.4
7.3
10.1
13.7
3.9
6.4
94.7
75.7
D C
lass
- S
TDI
3625
1644
1.04
220
101
AT8
3.23
44.8
54.5
32.5
47.2
48.3
126
104
174
120
117
1.0
3.1
6.2
8.5
11.4
3.1
5.2
107.
786
.2
D C
lass
- L
BD
I36
2516
441.
0422
010
1A
T83.
2346
.655
.532
.849
.450
.512
110
217
211
411
21.
03.
16.
28.
511
.43.
15.
210
7.7
86.2
D C
lass
- E
GR
B36
2516
441.
0422
010
1A
T83.
2346
.456
.734
.048
.750
.012
210
016
611
611
31.
03.
16.
28.
511
.43.
15.
210
7.7
86.2
D C
lass
- 2
020
Die
sel
3625
1644
1.73
309
105
AT8
3.23
49.0
65.4
43.4
54.0
52.3
128
9614
511
612
01.
12.
96.
08.
311
.03.
15.
010
8.0
88.1
Sm
all C
UV
- S
TDI
4000
1814
1.13
239
110
AT8
3.50
38.8
42.6
25.7
39.6
42.7
146
133
220
143
132
1.2
3.3
6.5
8.9
12.0
3.2
5.5
99.8
81.2
Sm
all C
UV
- L
BD
I40
0018
141.
1323
911
0A
T83.
5040
.343
.125
.941
.244
.414
013
121
813
712
71.
23.
36.
58.
912
.03.
25.
599
.881
.2
Sm
all C
UV
- E
GR
B40
0018
141.
1323
911
0A
T83.
5040
.344
.427
.041
.044
.114
012
720
913
812
81.
23.
36.
58.
912
.03.
25.
599
.881
.2
Sm
all C
UV
- 2
020
Die
sel
4000
1814
1.78
321
109
AT8
3.50
43.5
52.3
35.0
46.5
47.3
144
120
179
135
133
1.1
3.1
6.5
9.1
12.2
3.4
5.7
95.9
76.1
N1
(larg
e) -
STD
I45
0020
411.
3127
713
1A
T83.
1734
.839
.223
.735
.938
.116
214
423
815
714
81.
13.
26.
48.
611
.53.
25.
110
3.7
84.5
N1
(larg
e) -
LB
DI
4500
2041
1.31
277
131
AT8
3.17
36.0
39.8
23.9
37.3
39.7
157
142
236
151
142
1.1
3.2
6.4
8.6
11.5
3.2
5.1
103.
784
.5
N1
(larg
e) -
EG
RB
4500
2041
1.31
277
131
AT8
3.17
36.2
40.9
24.9
37.3
39.7
156
138
227
151
142
1.1
3.2
6.4
8.6
11.5
3.2
5.1
103.
784
.5
N1
(larg
e) -
202
0 D
iese
l45
0020
412.
0436
812
4A
T83.
1739
.949
.032
.942
.543
.215
712
819
114
714
51.
02.
96.
28.
611
.73.
35.
599
.979
.9
N1
(sm
all)
- S
TDI
3625
1644
0.89
186.
789
AT8
3.39
37.9
40.7
24.9
39.8
43.7
149
139
227
142
129
1.1
3.5
7.2
10.2
14.0
3.8
6.8
88.6
71.9
N1
(sm
all)
- LB
DI
3625
1644
0.89
186.
789
AT8
3.39
38.7
41.0
24.9
41.0
45.7
146
138
227
138
124
1.1
3.5
7.2
10.2
14.0
3.8
6.8
88.6
71.9
N1
(sm
all)
- E
GR
B36
2516
440.
8918
6.7
89A
T83.
3939
.842
.626
.041
.846
.114
213
221
713
512
21.
13.
57.
210
.214
.03.
86.
888
.671
.9
N1
(sm
all)
- 20
20 D
iese
l36
2516
441.
1019
667
AT8
3.39
47.4
53.3
34.9
50.1
53.1
132
118
180
125
118
1.7
4.5
9.6
13.7
19.6
5.1
9.9
76.7
56.2
PE
RF
OR
MA
NC
EA
dvan
ced
Aut
omat
ic T
rans
mis
sion
FU
EL
EC
ON
OM
Y (
mpg
)C
O2 (
g/km
)
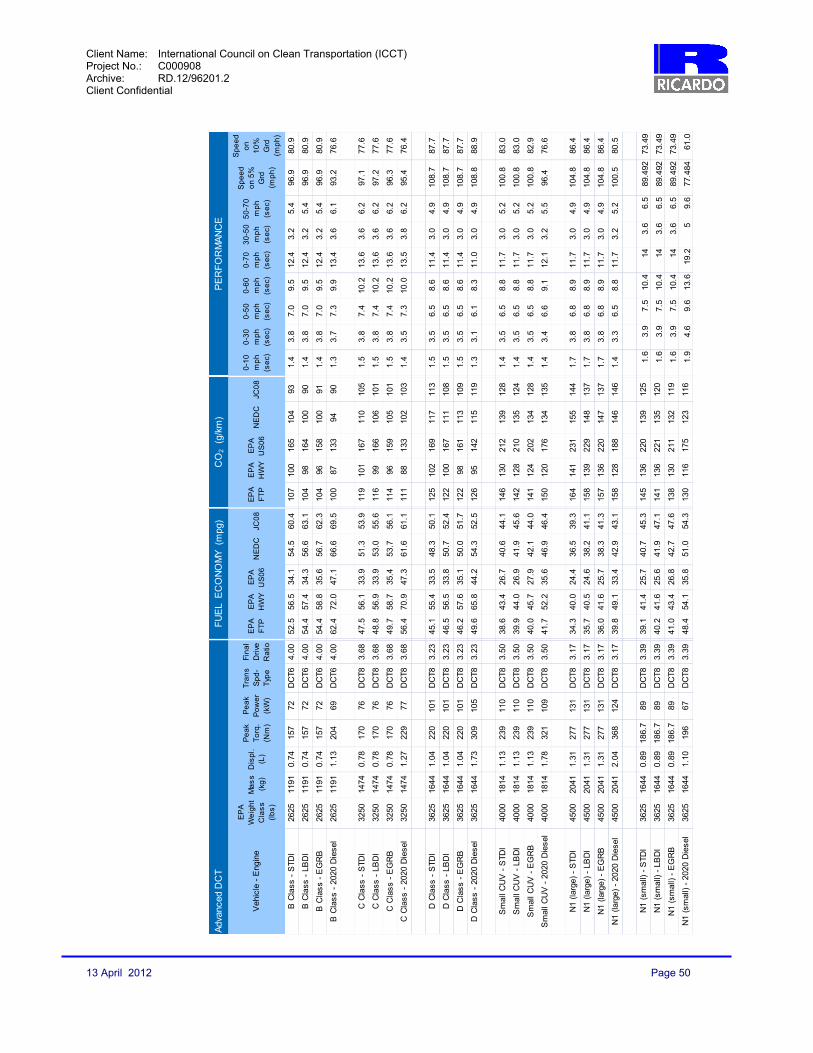
Client Name: International Council on Clean Transportation (ICCT) Project No.: C000908 Archive: RD.12/96201.2 Client Confidential
13 April 2012 Page 50
Veh
icle
- E
ngin
e
EP
A
We
igh
t C
las
s
(lb
s)
Ma
ss
(k
g)
Dis
pl.
(L)
Pe
ak
To
rq.
(Nm
)
Pe
ak
Po
we
r (k
W)
Tra
ns
S
pd
-T
ype
Fin
al
Dri
ve
Ra
tio
EP
A
FT
PE
PA
H
WY
EP
A
US
06
NE
DC
JC0
8E
PA
F
TP
EP
A
HW
YE
PA
U
S0
6N
ED
CJC
08
0-1
0
mp
h
(se
c)
0-3
0
mp
h
(se
c)
0-5
0
mp
h
(se
c)
0-6
0
mp
h
(se
c)
0-7
0
mp
h
(se
c)
30
-50
m
ph
(s
ec)
50
-70
m
ph
(s
ec)
Sp
ee
d
on
5%
G
rd
(mp
h)
Sp
ee
d
on
1
0%
G
rd
(mp
h)
B C
lass
- S
TDI
2625
1191
0.74
157
72D
CT6
4.00
52.5
56.5
34.1
54.5
60.4
107
100
165
104
931.
43.
87.
09.
512
.43.
25.
496
.980
.9
B C
lass
- L
BD
I26
2511
910.
7415
772
DC
T64.
0054
.457
.434
.356
.663
.110
498
164
100
901.
43.
87.
09.
512
.43.
25.
496
.980
.9
B C
lass
- E
GR
B26
2511
910.
7415
772
DC
T64.
0054
.458
.835
.656
.762
.310
496
158
100
911.
43.
87.
09.
512
.43.
25.
496
.980
.9
B C
lass
- 2
020
Die
sel
2625
1191
1.13
204
69D
CT6
4.00
62.4
72.0
47.1
66.6
69.5
100
8713
394
901.
33.
77.
39.
913
.43.
66.
193
.276
.6
C C
lass
- S
TDI
3250
1474
0.78
170
76D
CT8
3.68
47.5
56.1
33.9
51.3
53.9
119
101
167
110
105
1.5
3.8
7.4
10.2
13.6
3.6
6.2
97.1
77.6
C C
lass
- L
BD
I32
5014
740.
7817
076
DC
T83.
6848
.856
.933
.953
.055
.611
699
166
106
101
1.5
3.8
7.4
10.2
13.6
3.6
6.2
97.2
77.6
C C
lass
- E
GR
B32
5014
740.
7817
076
DC
T83.
6849
.758
.735
.453
.756
.111
496
159
105
101
1.5
3.8
7.4
10.2
13.6
3.6
6.2
96.3
77.6
C C
lass
- 2
020
Die
sel
3250
1474
1.27
229
77D
CT8
3.68
56.4
70.9
47.3
61.6
61.1
111
8813
310
210
31.
43.
57.
310
.013
.53.
86.
295
.476
.4
D C
lass
- S
TDI
3625
1644
1.04
220
101
DC
T83.
2345
.155
.433
.548
.350
.112
510
216
911
711
31.
53.
56.
58.
611
.43.
04.
910
8.7
87.7
D C
lass
- L
BD
I36
2516
441.
0422
010
1D
CT8
3.23
46.5
56.5
33.8
50.7
52.4
122
100
167
111
108
1.5
3.5
6.5
8.6
11.4
3.0
4.9
108.
787
.7
D C
lass
- E
GR
B36
2516
441.
0422
010
1D
CT8
3.23
46.2
57.6
35.1
50.0
51.7
122
9816
111
310
91.
53.
56.
58.
611
.43.
04.
910
8.7
87.7
D C
lass
- 2
020
Die
sel
3625
1644
1.73
309
105
DC
T83.
2349
.665
.844
.254
.352
.512
695
142
115
119
1.3
3.1
6.1
8.3
11.0
3.0
4.9
108.
888
.9
Sm
all C
UV
- S
TDI
4000
1814
1.13
239
110
DC
T83.
5038
.643
.426
.740
.644
.114
613
021
213
912
81.
43.
56.
58.
811
.73.
05.
210
0.8
83.0
Sm
all C
UV
- L
BD
I40
0018
141.
1323
911
0D
CT8
3.50
39.9
44.0
26.9
41.9
45.6
142
128
210
135
124
1.4
3.5
6.5
8.8
11.7
3.0
5.2
100.
883
.0
Sm
all C
UV
- E
GR
B40
0018
141.
1323
911
0D
CT8
3.50
40.0
45.7
27.9
42.1
44.0
141
124
202
134
128
1.4
3.5
6.5
8.8
11.7
3.0
5.2
100.
882
.9
Sm
all C
UV
- 2
020
Die
sel
4000
1814
1.78
321
109
DC
T83.
5041
.752
.235
.646
.946
.415
012
017
613
413
51.
43.
46.
69.
112
.13.
25.
596
.476
.6
N1
(larg
e) -
STD
I45
0020
411.
3127
713
1D
CT8
3.17
34.3
40.0
24.4
36.5
39.3
164
141
231
155
144
1.7
3.8
6.8
8.9
11.7
3.0
4.9
104.
886
.4
N1
(larg
e) -
LB
DI
4500
2041
1.31
277
131
DC
T83.
1735
.740
.524
.638
.241
.115
813
922
914
813
71.
73.
86.
88.
911
.73.
04.
910
4.8
86.4
N1
(larg
e) -
EG
RB
4500
2041
1.31
277
131
DC
T83.
1736
.041
.625
.738
.341
.315
713
622
014
713
71.
73.
86.
88.
911
.73.
04.
910
4.8
86.4
N1
(larg
e) -
202
0 D
iese
l45
0020
412.
0436
812
4D
CT8
3.17
39.8
49.1
33.4
42.9
43.1
158
128
188
146
146
1.4
3.3
6.5
8.8
11.7
3.2
5.2
100.
580
.5
N1
(sm
all)
- S
TDI
3625
1644
0.89
186.
789
DC
T83.
3939
.141
.425
.740
.745
.314
513
622
013
912
51.
63.
97.
510
.414
3.6
6.5
89.4
9273
.49
N1
(sm
all)
- LB
DI
3625
1644
0.89
186.
789
DC
T83.
3940
.241
.625
.641
.947
.114
113
622
113
512
01.
63.
97.
510
.414
3.6
6.5
89.4
9273
.49
N1
(sm
all)
- E
GR
B36
2516
440.
8918
6.7
89D
CT8
3.39
41.0
43.4
26.8
42.7
47.6
138
130
211
132
119
1.6
3.9
7.5
10.4
143.
66.
589
.492
73.4
9
N1
(sm
all)
- 20
20 D
iese
l36
2516
441.
1019
667
DC
T83.
3948
.454
.135
.851
.054
.313
011
617
512
311
61.
94.
69.
613
.619
.25
9.6
77.4
8461
.0
FU
EL
EC
ON
OM
Y (
mpg
)C
O2 (
g/km
)P
ER
FO
RM
AN
CE
Adv
ance
d D
CT

Client Name: International Council on Clean Transportation (ICCT) Project No.: C000908 Archive: RD.12/96201.2 Client Confidential
13 April 2012 Page 51
Veh
icle
- E
ngin
eE
PA
W
eig
ht
Cla
ss
Ma
ss
(k
g)
Dis
pl.
(L)
Pe
ak
To
rq.
(Nm
)
Pe
ak
Po
we
r (k
W)
Tra
ns
S
pd
-T
ype
Fin
al
Dri
ve
Ra
tio
EP
A
FT
PE
PA
H
WY
EP
A
US
06
NE
DC
JC0
8E
PA
F
TP
EP
A
HW
YE
PA
U
S0
6N
ED
CJC
08
0-1
0
mp
h
(se
c)
0-3
0
mp
h
(se
c)
0-5
0
mp
h
(se
c)
0-6
0
mp
h
(se
c)
0-7
0
mp
h
(se
c)
30
-50
m
ph
(s
ec)
50
-70
m
ph
(s
ec)
Sp
ee
d
on
5%
G
rd
(mp
h)
Sp
ee
d
on
1
0%
G
rd
(mp
h)
B C
lass
- S
TDI
2625
1191
0.59
124
59D
CT6
4.00
68.2
57.3
37.0
60.6
73.6
8399
153
9377
1.4
3.8
7.2
9.6
12.6
3.4
5.4
87.4
70.6
B C
lass
- L
BD
I26
2511
910.
5912
459
DC
T64.
0068
.457
.737
.361
.474
.982
9815
192
751.
43.
87.
29.
612
.63.
45.
487
.470
.6
B C
lass
- E
GR
B26
2511
910.
5912
459
DC
T64.
0070
.259
.938
.863
.576
.280
9414
689
741.
43.
87.
29.
612
.63.
45.
487
.470
.6
B C
lass
- A
tkin
son
CP
S26
2511
911.
6613
865
DC
T64.
0070
.859
.038
.162
.674
.880
9614
890
751.
43.
77.
510
.013
.63.
86.
185
.462
.1
B C
lass
- A
tkin
son
DV
A26
2511
911.
6613
865
DC
T64.
0071
.760
.539
.264
.278
.479
9314
488
721.
43.
77.
510
.013
.63.
86.
185
.462
.1
C C
lass
- S
TDI
3250
1474
0.62
131.
662
.4D
CT8
3.68
60.3
57.0
35.1
59.1
66.5
9499
161
9685
1.4
3.9
7.5
10.0
13.4
3.6
5.9
87.3
67.3
C C
lass
- L
BD
I32
5014
740.
6213
1.6
62.4
DC
T83.
6861
.858
.435
.360
.268
.191
9716
094
831.
43.
97.
510
.013
.43.
65.
987
.367
.3
C C
lass
- E
GR
B32
5014
740.
6213
1.6
62.4
DC
T83.
6862
.659
.636
.661
.768
.890
9515
492
821.
43.
97.
510
.013
.43.
65.
987
.367
.3
C C
lass
- A
tkin
son
CP
S32
5014
741.
7414
568
DC
T83.
6864
.060
.339
.263
.071
.388
9414
490
791.
43.
77.
510
.313
.83.
86.
385
.566
.2
C C
lass
- A
tkin
son
DV
A32
5014
741.
7414
568
DC
T83.
6865
.061
.239
.763
.972
.387
9214
288
781.
43.
77.
510
.313
.83.
86.
385
.566
.2
D C
lass
- S
TDI
3625
1644
0.83
175.
583
DC
T83.
2361
.957
.236
.959
.064
.691
9915
396
871.
33.
66.
58.
611
.32.
94.
898
.077
.3
D C
lass
- L
BD
I36
2516
440.
8317
5.5
83D
CT8
3.23
62.9
58.0
36.7
59.9
66.7
9097
154
9485
1.3
3.6
6.5
8.6
11.3
2.9
4.8
98.0
77.3
D C
lass
- E
GR
B36
2516
440.
8317
5.5
83D
CT8
3.23
65.1
59.7
38.4
61.7
67.0
8795
147
9284
1.3
3.6
6.5
8.6
11.3
2.9
4.8
98.0
77.3
D C
lass
- A
tkin
son
CP
S36
2516
442.
4020
0.2
94D
CT8
3.23
64.6
59.7
39.8
61.5
66.0
8795
142
9286
1.2
3.4
6.5
8.6
11.4
3.1
4.9
101.
378
.4
D C
lass
- A
tkin
son
DV
A36
2516
442.
4020
0.2
94D
CT8
3.23
65.9
61.0
40.5
62.7
67.8
8693
139
9083
1.2
3.4
6.5
8.6
11.4
3.1
4.9
101.
378
.4
Sm
all C
UV
- S
TDI
4000
1814
0.90
189.
890
DC
T83.
5050
.144
.228
.547
.956
.411
312
819
811
810
01.
53.
97.
09.
412
.33.
15.
390
.572
.6
Sm
all C
UV
- L
BD
I40
0018
140.
9018
9.8
90D
CT8
3.50
50.8
44.5
28.5
48.1
57.3
111
127
198
118
991.
53.
97.
09.
412
.33.
15.
390
.572
.6
Sm
all C
UV
- E
GR
B40
0018
140.
9018
9.8
90D
CT8
3.50
52.0
46.1
29.8
49.5
58.7
109
123
189
114
961.
53.
97.
09.
412
.33.
15.
390
.572
.6
Sm
all C
UV
- A
tkin
son
CP
S40
0018
142.
6021
710
2D
CT8
3.50
52.9
45.5
29.6
50.0
57.1
107
124
191
113
991.
43.
77.
19.
312
.63.
45.
591
.176
.7
Sm
all C
UV
- A
tkin
son
DV
A40
0018
142.
6021
710
2D
CT8
3.50
54.1
46.8
30.3
50.9
58.5
104
121
187
111
971.
43.
77.
19.
312
.63.
45.
591
.176
.7
N1
(larg
e) -
STD
I45
0020
411.
0522
110
5D
CT8
3.17
47.7
42.2
26.2
44.7
52.1
118
134
216
126
108
1.5
3.8
6.9
9.1
11.9
3.1
5.0
94.3
75.5
N1
(larg
e) -
LB
DI
4500
2041
1.05
221
105
DC
T83.
1747
.442
.626
.845
.252
.711
913
221
112
510
71.
53.
86.
99.
111
.93.
15.
094
.375
.5
N1
(larg
e) -
EG
RB
4500
2041
1.05
221
105
DC
T83.
1747
.643
.027
.646
.053
.211
913
120
512
310
61.
53.
86.
99.
111
.93.
15.
094
.375
.5
N1
(larg
e) -
Atk
inso
n C
PS
4500
2041
3.15
263
124
DC
T83.
1748
.342
.427
.545
.951
.011
713
320
512
311
11.
43.
66.
78.
811
.63.
14.
995
.482
.3
N1
(larg
e) -
Atk
inso
n D
VA
4500
2041
3.15
263
124
DC
T83.
1748
.843
.527
.746
.952
.611
613
020
412
010
71.
43.
66.
78.
811
.63.
14.
995
.482
.3
N1
(sm
all)
- S
TDI
3625
1644
0.71
149.
371
DC
T83.
3951
.942
.427
46.9
356
109
133
209
120
101
1.4
3.9
7.4
10.1
13.4
3.5
680
.363
.7
N1
(sm
all)
- LB
DI
3625
1644
0.71
149.
371
DC
T83.
3952
.542
.627
.347
.258
56.7
108
133
207
119
991.
43.
97.
410
.113
.43.
56
80.3
63.7
N1
(sm
all)
- E
GR
B36
2516
440.
7114
9.3
71D
CT8
3.39
53.3
43.5
27.6
47.9
7958
.210
613
020
511
897
1.4
3.9
7.4
10.1
13.4
3.5
680
.363
.7
N1
(sm
all)
- A
tkin
son
CP
S36
2516
442.
0614
9.3
80D
CT8
3.39
54.8
43.9
28.1
48.7
7758
.710
312
820
111
696
1.4
3.8
7.3
9.9
13.1
3.5
5.8
81.5
64.9
N1
(sm
all)
- A
tkin
son
DV
A36
2516
442.
0614
9.3
80D
CT8
3.39
55.3
46.2
32.4
51.4
1459
.810
212
217
411
094
1.4
3.8
7.3
9.9
13.1
3.5
5.8
81.5
64.9
P2
Hyb
ridF
UE
L E
CO
NO
MY
(m
pg)
PE
RF
OR
MA
NC
EC
O2 (
g/km
)

Client Name: International Council on Clean Transportation (ICCT) Project No.: C000908 Archive: RD.12/96201.2 Client Confidential
13 April 2012 Page 52
Veh
icle
- E
ngin
eE
PA
W
eig
ht
Cla
ss
Ma
ss
(k
g)
Dis
pl.
(L)
Pe
ak
To
rq.
(Nm
)
Pe
ak
Po
we
r (k
W)
Tra
ns
S
pd
-T
ype
Fin
al
Dri
ve
Ra
tio
EP
A
FT
PE
PA
H
WY
EP
A
US
06
NE
DC
JC0
8E
PA
F
TP
EP
A
HW
YE
PA
U
S0
6N
ED
CJC
08
0-1
0
mp
h
(se
c)
0-3
0
mp
h
(se
c)
0-5
0
mp
h
(se
c)
0-6
0
mp
h
(se
c)
0-7
0
mp
h
(se
c)
30
-50
m
ph
(s
ec)
50
-70
m
ph
(s
ec)
Sp
ee
d
on
5%
G
rd
(mp
h)
Sp
ee
d
on
1
0%
G
rd
(mp
h)
B C
lass
- S
TDI
2625
1191
0.59
124
59P
S4.
0064
.757
.235
.263
.572
.987
9916
089
771.
94.
88.
210
.413
.13.
44.
989
.571
.3
B C
lass
- L
BD
I26
2511
910.
5912
459
PS
4.00
65.8
57.4
35.2
63.9
73.9
8698
161
8876
1.9
4.8
8.2
10.4
13.1
3.4
4.9
89.1
71.3
B C
lass
- E
GR
B26
2511
910.
5912
459
PS
4.00
67.7
60.1
36.7
66.0
74.9
8394
154
8675
1.9
4.8
8.2
10.4
13.1
3.4
4.9
89.1
71.3
B C
lass
- A
tkin
son
CP
S26
2511
911.
6613
865
PS
4.00
64.2
59.5
38.0
64.1
71.1
8895
149
8879
1.8
4.7
7.9
9.8
12.2
3.2
4.3
93.5
77.4
B C
lass
- A
tkin
son
DV
A26
2511
911.
6613
865
PS
4.00
67.3
60.0
39.0
66.5
75.1
8494
145
8575
1.8
4.7
7.9
9.8
12.1
3.2
4.2
93.5
77.9
C C
lass
- S
TDI
3250
1474
0.62
132
62P
S3.
6859
.757
.136
.659
.066
.395
9915
496
851.
74.
37.
610
.113
.23.
35.
688
.866
.9
C C
lass
- L
BD
I32
5014
740.
6213
262
PS
3.68
60.8
55.4
36.6
59.1
68.1
9310
215
495
831.
74.
37.
610
.013
.23.
35.
688
.866
.9
C C
lass
- E
GR
B32
5014
740.
6213
262
PS
3.68
62.3
57.9
38.4
61.1
69.0
9198
147
9282
1.7
4.3
7.6
10.1
13.2
3.3
5.6
88.8
66.9
C C
lass
- A
tkin
son
CP
S32
5014
741.
7414
568
PS
3.68
59.8
55.8
37.7
58.6
64.9
9410
115
096
871.
74.
37.
39.
612
.63.
05.
392
.272
.2
C C
lass
- A
tkin
son
DV
A32
5014
741.
7414
568
PS
3.68
62.6
58.3
41.2
62.2
68.4
9097
137
9183
1.7
4.3
7.3
9.6
12.5
3.0
5.2
92.9
73.0
D C
lass
- S
TDI
3625
1644
0.83
176
83P
S3.
2355
.651
.735
.456
.463
.310
210
915
910
089
1.5
3.7
6.6
8.7
11.3
2.9
4.7
99.0
78.1
D C
lass
- L
BD
I36
2516
440.
8317
683
PS
3.23
57.9
53.5
36.0
57.7
64.4
9810
515
798
881.
53.
76.
68.
711
.32.
94.
799
.078
.1
D C
lass
- E
GR
B36
2516
440.
8317
683
PS
3.23
58.0
54.8
37.1
58.9
65.6
9710
315
296
861.
53.
76.
68.
711
.32.
94.
799
.078
.1
D C
lass
- A
tkin
son
CP
S36
2516
442.
4020
094
PS
3.23
53.3
51.7
36.8
55.4
59.2
106
109
154
102
951.
43.
66.
28.
010
.22.
64.
010
5.2
85.5
D C
lass
- A
tkin
son
DV
A36
2516
442.
4020
094
PS
3.23
56.4
53.3
37.6
57.7
62.8
100
106
150
9890
1.4
3.6
6.2
8.0
10.2
2.6
4.0
105.
285
.8
Sm
all C
UV
- S
TDI
4000
1814
0.90
190
90P
S3.
5049
.142
.227
.446
.955
.211
513
420
612
010
21.
94.
78.
010
.313
.13.
35.
192
.273
.3
Sm
all C
UV
- L
BD
I40
0018
140.
9019
090
PS
3.50
50.8
42.7
27.3
47.1
56.2
111
132
206
120
100
1.9
4.7
8.0
10.3
13.2
3.3
5.2
92.2
73.3
Sm
all C
UV
- E
GR
B40
0018
140.
9019
090
PS
3.50
51.3
44.9
28.8
48.7
57.3
110
126
196
116
981.
94.
78.
010
.313
.23.
35.
292
.273
.3
Sm
all C
UV
- A
tkin
son
CP
S40
0018
142.
6021
710
2P
S3.
5044
.339
.625
.142
.548
.612
814
222
513
311
61.
94.
67.
49.
111
.12.
83.
798
.381
.4
Sm
all C
UV
- A
tkin
son
DV
A40
0018
142.
6021
710
2P
S3.
5049
.342
.328
.648
.353
.811
413
419
711
710
51.
94.
67.
49.
111
.12.
83.
798
.381
.6
N1
(larg
e) -
STD
I45
0020
411.
0522
110
5P
S3.
1744
.839
.325
.842
.849
.612
614
421
913
211
41.
84.
37.
59.
712
.53.
25.
010
0.2
76.5
N1
(larg
e) -
LB
DI
4500
2041
1.05
221
105
PS
3.17
45.7
40.6
25.7
43.4
50.4
124
139
220
130
112
1.8
4.3
7.5
9.7
12.5
3.2
5.0
100.
876
.5
N1
(larg
e) -
EG
RB
4500
2041
1.05
221
105
PS
3.17
47.0
41.5
27.3
45.0
52.0
120
136
207
125
109
1.8
4.3
7.5
9.7
12.5
3.2
5.0
100.
876
.5
N1
(larg
e) -
Atk
inso
n C
PS
4500
2041
3.15
263
124
PS
3.17
41.7
38.6
26.5
40.5
44.8
135
146
213
139
126
1.8
4.2
7.0
8.8
11.1
2.8
4.1
103.
486
.0
N1
(larg
e) -
Atk
inso
n D
VA
4500
2041
3.15
263
124
PS
3.17
44.3
39.6
27.0
42.3
47.5
127
143
209
134
119
1.8
4.2
7.0
8.8
11.1
2.8
4.1
103.
486
.5
N1
(sm
all)
- S
TDI
3625
1644
0.71
149.
371
PS
3.39
48.7
4125
43.9
4553
.811
613
822
612
810
51.
64
7.6
10.3
13.9
3.6
6.3
81.1
0763
.73
N1
(sm
all)
- LB
DI
3625
1644
0.71
149.
371
PS
3.39
49.5
41.1
25.1
44.6
9355
.611
413
722
512
610
11.
64
7.6
10.3
13.9
3.6
6.3
81.1
0763
.73
N1
(sm
all)
- E
GR
B36
2516
440.
7114
9.3
71P
S3.
3950
.943
.326
.446
.364
56.5
111
130
214
122
100
1.6
47.
610
.313
.93.
66.
381
.107
63.7
3
N1
(sm
all)
- A
tkin
son
CP
S36
2516
442.
0614
9.3
80P
S3.
3949
.842
.927
.346
.211
54.3
113
132
207
122
104
1.6
47.
19.
612
.63.
15.
587
.919
71.3
N1
(sm
all)
- A
tkin
son
DV
A36
2516
442.
0614
9.3
80P
S3.
3952
44.1
28.5
48.4
56.9
109
128
198
117
991.
64
7.1
9.6
12.6
3.1
5.5
87.9
271
.3
CO
2 (
g/km
)P
ER
FO
RM
AN
CE
FU
EL
EC
ON
OM
Y (
mpg
)P
ower
Spl
it H
ybrid

Client Name: International Council on Clean Transportation (ICCT) Project No.: C000908 Archive: RD.12/96201.2 Client Confidential
13 April 2012 Page 53
12.5 Appendix 5, Assumptions Underpinning the Models The following assumptions are incorporated into the models:
LDV technologies must have the potential to be commercially deployed in 2020–2025. Vehicle sizes, particularly footprint and interior space, for each class will be largely
unchanged from 2010 to 2020–2025. Hybrid vehicles will use an advanced hybrid control strategy, focusing on battery state of
charge (SOC) management, but not at the expense of drivability. LDV with conventional powertrains, including the Baseline vehicles, have a stop-start
functionality implemented that allows energy recovery only to offset accessory loads. Vehicles will use fuels that are equivalent to either 87 AKI pump gasoline or 40 cetane
pump diesel with fuel sulfur levels comparable to 2010 regulated levels. 2020–2025 spark-ignited engines will meet future California LEV III requirements for criteria
pollutants. 2020–2025 diesel engines will meet future EU requirements for criteria pollutants. 2020–2025 engines use dual overhead cams (DOHC) Baseline European diesel engines are Euro 5 compliant with suitable aftertreatment,
including diesel oxidation catalyst and diesel particulate filter. Lean NOx aftertreatment may be part of this solution, but is uncommon in Euro 5 vehicles.
The advanced European diesels are expected to use the I3 configuration, except for the Large N1, which is expected to have an I4 configuration.
Ricardo will be allowed to use Ricardo proprietary data and expertise to assess technologies and develop the models, as this allows the technologies to be assessed more comprehensively than if only publicly available data were used.
Due to the multiple designs that manufacturers may realize for any given advanced technology, the effect of technologies on overall vehicle mass is not incorporated directly in the vehicle performance models. Instead, the model makes the overt simplifying assumption that all technologies are mass-neutral. The end-user has the flexibility to incorporate their own assumptions about mass reduction from advanced technologies when exploring the design space with the Data Visualization Tool.
Similarly, other road load reductions such as aerodynamic drag and rolling resistance reduction were addressed as input factors for the DoE simulations.
Spark-ignited (SI) engines and compression ignition (CI, or diesel) engines are expected to be widely available for the EU LDV market All LDV with conventional powertrain architectures, including the Baseline vehicles, have stop-start functionality implemented.
The effect of a blanket 3.5% improvement in fuel consumption coming from a combination of friction improvements in future engines was included.
Stepped gear transmissions are assumed to have eight gears except in the B Class (or smaller) LDV classes, where packaging constraints are expected to limit transmissions to six gears.
All LDV are assumed to have electrified accessory systems.
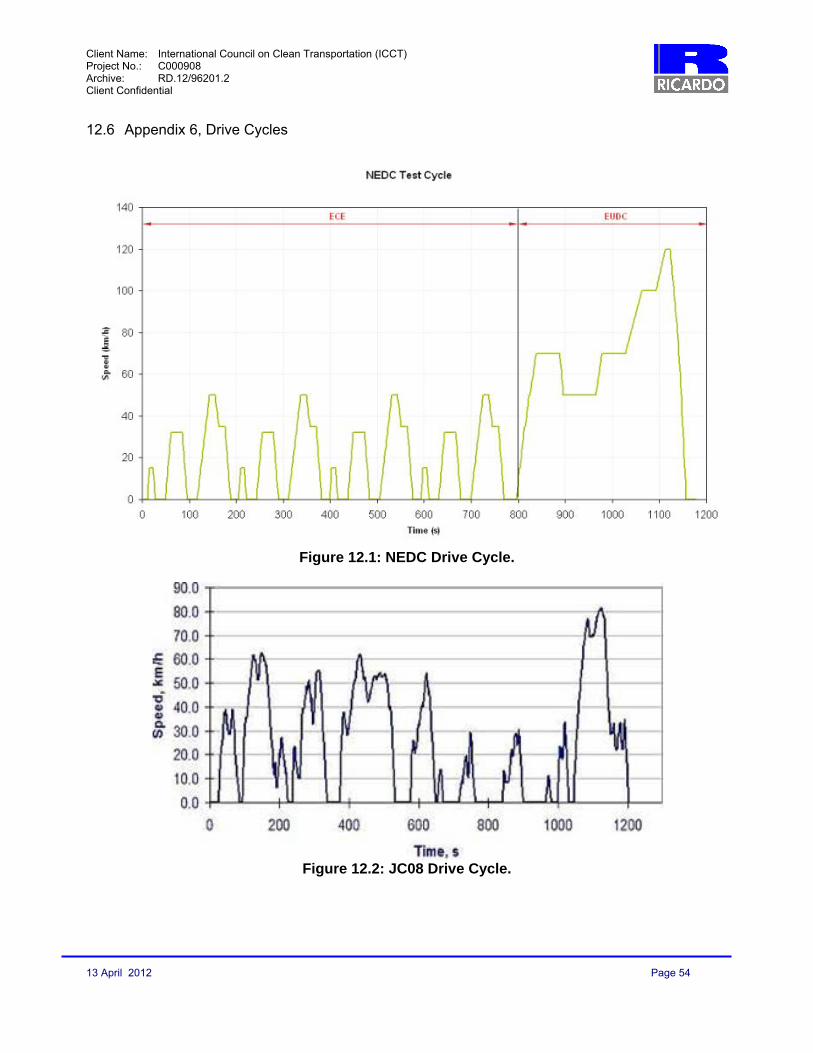
Client Name: International Council on Clean Transportation (ICCT) Project No.: C000908 Archive: RD.12/96201.2 Client Confidential
13 April 2012 Page 54
12.6 Appendix 6, Drive Cycles
Figure 12.1: NEDC Drive Cycle.
Figure 12.2: JC08 Drive Cycle.

Client Name: International Council on Clean Transportation (ICCT) Project No.: C000908 Archive: RD.12/96201.2 Client Confidential
13 April 2012 Page 55
GRAPHS, FIGURES AND TABLES LIST OF FIGURES
Figure 3.1: Technology package selection process. ......................................................................... 8 Figure 4.1: P2 parallel hybrid powertrain configuration. .................................................................. 12 Figure 4.2: Input powersplit hybrid powertrain configuration. .......................................................... 12 Figure 6.1: MSC.Easy5 conventional vehicle model. ...................................................................... 18 Figure 6.2: Change in BSFC resulting from cylinder heat loss. ....................................................... 20 Figure 6.3: General Motors two-stage turbo transient performance ................................................ 20 Figure 6.4: Comparison of CVT and optimized DCT gear ratios over transient drive cycle. ........... 23 Figure 6.5: 2007 Camry motor-inverter efficiency contour map ...................................................... 25 Figure 6.6: High level state flow diagram for the hybrid control strategy. ........................................ 26 Figure 6.7: Best BSFC curve superimposed on fueling map. ......................................................... 27 Figure 6.8: Hybrid powertrain energy supervisory strategy. ............................................................ 28 Figure 9.1: ICCT Design Space Query screen in Data Visualization Tool. ..................................... 35 Figure 9.2: ICCT Design Space Analysis screen in Data Visualization Tool ................................... 36 Figure 9.3: C Class vehicle Design Space Analysis example varying engine displacement and vehicle mass with conventional powertrain, P2 hybrid, or powersplit hybrid. .................................. 37 Figure 9.4: C Class vehicle Design Space Analysis example varying engine displacement and vehicle mass with conventional powertrain, P2 hybrid, or powersplit hybrid. .................................. 38 Figure 9.5: C Class vehicle Design Space Analysis example varying engine displacement and vehicle mass with conventional powertrain, P2 hybrid, or powersplit hybrid. .................................. 39 Figure 9.6: Design Space Analysis example comparing greenhouse gas emissions across vehicle classes with respect to vehicle weight ............................................................................................. 40 Figure 9.7: Efficient Frontier screen of Data Visualization Tool with example plot. ......................... 41 Figure 12.1: NEDC Drive Cycle. ...................................................................................................... 54 Figure 12.2: JC08 Drive Cycle. ....................................................................................................... 54
LIST OF TABLES Table ES-1: Selected C Class Vehicle results, showing benefit of decreasing road loads. .............. 3 Table 5.1: Engine technology package definition. ........................................................................... 14 Table 5.2: Hybrid technology package definition. ............................................................................ 14 Table 5.3: Transmission technology package definition. ................................................................. 14 Table 5.4: Baseline and Conventional Stop-Start vehicle simulation matrix. .................................. 15 Table 5.5: P2 and Input Powersplit hybrid simulation matrix. .......................................................... 16 Table 6.1: Vehicle classes and exemplar vehicles. ......................................................................... 17 Table 6.2: Transmission gear ratios for six-speed and eight-speed transmissions. ........................ 22 Table 7.1: Validation Model Results ................................................................................................ 29 Table 7.2: Baseline Vehicle Performance ....................................................................................... 30 Table 7.3: Vehicle simulation results comparing manual transmission to DCT. .............................. 31 Table 7.4: Effect of shift speed adjustment on GHG emissions. ..................................................... 31 Table 8.1: Continuous input parameter sweep ranges with conventional and hybrid powertrains. . 32 Table 9.1: Selected C Class Vehicle results, showing benefit of varying road loads. ..................... 34

Client Name: International Council on Clean Transportation (ICCT) Project No.: C000908 Archive: RD.12/96201.2 Client Confidential
13 April 2012 Page 56
DISCLAIMER Ricardo Inc. has taken all reasonable care in compiling the analyses and recommendations provided in this report. However, the information contained in this report is based on information and assumptions provided by the client or otherwise available to Ricardo which, in all the circumstances, is deemed correct on the date of writing. Ricardo does not assume any liability, provide any warranty or make any representation in respect of the accuracy of the information, assumptions, and consequently the analyses and recommendations contained in this report. The report has been compiled solely for the client's use.
Client Name: International Council on Clean Transportation (ICCT) Project No.: C000908 Archive: RD.12/220901.1 Client Confidential
www.ricardo.com
Prepared for: International Council on Clean Transportation (ICCT) 1225 I Street NW Suite 900 Washington DC 20005 Project: C000908 Archive: RD.12/220901.1 Date: 17 May 2012 Client Confidential Author(s): John J. Kasab Contributor(s): Daniel Shepard Anrico Casadei Henry Huang Felipe Brandao
Technical Approval: ________Reviewed by [Thomas J. Gutwald]_________ Thomas Gutwald Manager / Innovations
Addendum to Project Report Analysis of Greenhouse Gas Emission Reduction
Potential of Light Duty Vehicle Technologies in the European Union for 2020–2025
Ricardo Inc.
40000 Ricardo Drive Van Buren Twp., MI 48111-1641
TEL: (734) 397-6666 FAX: (734) 397-6677

Client Name: International Council on Clean Transportation (ICCT) Project No.: C000908 Archive: RD.12/220901.1 Client Confidential
17 May 2012 Page 1
ADDENDUM TO PROJECT REPORT ANALYSIS OF FUTURE GREENHOUSE GAS EMISSION REDUCTION POTENTIAL OF LIGHT
DUTY VEHICLE TECHNOLOGIES IN THE EUROPEAN UNION FOR 2020–2025
EXECUTIVE SUMMARY This addendum to Ricardo Project Report RD.12/96201.2 describes additional work performed for the International Council on Clean Transportation (ICCT) to evaluate supplemental baseline cases for the C Class vehicle segment. The validation model and baseline model results completed in this supplemental study are presented, along with revised, tabulated results that complement those in the Project Report. The supplemental C Class vehicle parameters fall within the design space for the 2020–2025 C Class vehicles, thereby allowing comparisons between the supplemental C Class baseline results and various advanced vehicle configurations.
S-1. INTRODUCTION Ricardo performed an additional study for the International Council on Clean Transportation (ICCT) to assess supplemental baseline vehicle models for the C Class vehicle segment. The purpose of this work was to provide ICCT with a reference point that more closely matched a median point of the current European vehicle fleet than the C Class vehicle originally modeled. The C Class vehicle is an important market segment in the European Union (EU). The exemplar vehicles used to develop the C Class vehicle performance model in the original study were the VW Golf and VW Jetta. Ricardo’s methodology, including the technical details of the VW Golf and VW Jetta vehicle models, is fully described in Ricardo Project Report RD.12/96201.2 (“the Project Report”). As described in the Project Report, the method used vehicle parameters published in the US Environmental Protection Agency’s (EPA’s) Test Car List. The method ensured a standardized set of vehicle parameters across many vehicle classes. The method meant that model input parameters were based on the exemplar vehicle sold in the United States (US) which could differ from the version sold in the EU. European vehicle parameters similar to the EPA’s Test Car List are not readily available. In the original study, the exemplar US model VW vehicles used for the C Class have heavier vehicle test weights than in Europe and have a relatively large 2.0 liter (ℓ) displacement baseline spark-ignited engine where the valvetrain has two valves per cylinder actuated by a single overhead cam (SOHC). The resulting baseline C Class model was therefore farther from the EU median than desired, therefore a supplemental C Class study was completed.
S-2. SUPPLEMENTAL C CLASS VEHICLE MODEL METHODOLOGY The same methodology described in the Project Report was used for the supplemental C Class vehicle model. The supplemental validation model was developed based on a different vehicle than the original project. For the supplemental study, the MY2012 Ford Focus was selected, as the US and EU models are essentially the same. For more information on the methodology, please see the Project Report Section 6.1, Validation and Baseline Vehicle Models. The road load parameters for the Ford Focus-based supplemental C Class validation model were fit to the existing road-load coefficients from the EPA Test Car List, which are represented as the
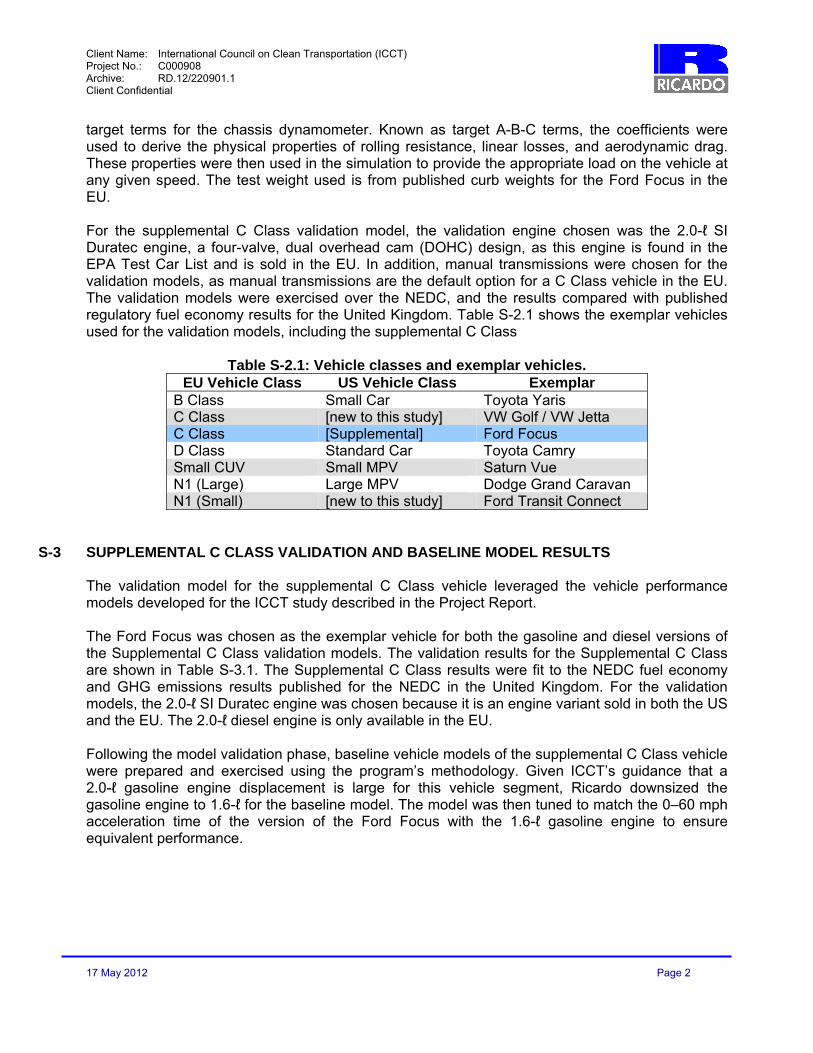
Client Name: International Council on Clean Transportation (ICCT) Project No.: C000908 Archive: RD.12/220901.1 Client Confidential
17 May 2012 Page 2
target terms for the chassis dynamometer. Known as target A-B-C terms, the coefficients were used to derive the physical properties of rolling resistance, linear losses, and aerodynamic drag. These properties were then used in the simulation to provide the appropriate load on the vehicle at any given speed. The test weight used is from published curb weights for the Ford Focus in the EU. For the supplemental C Class validation model, the validation engine chosen was the 2.0-ℓ SI Duratec engine, a four-valve, dual overhead cam (DOHC) design, as this engine is found in the EPA Test Car List and is sold in the EU. In addition, manual transmissions were chosen for the validation models, as manual transmissions are the default option for a C Class vehicle in the EU. The validation models were exercised over the NEDC, and the results compared with published regulatory fuel economy results for the United Kingdom. Table S-2.1 shows the exemplar vehicles used for the validation models, including the supplemental C Class
Table S-2.1: Vehicle classes and exemplar vehicles. EU Vehicle Class US Vehicle Class Exemplar
B Class Small Car Toyota Yaris C Class [new to this study] VW Golf / VW Jetta C Class [Supplemental] Ford Focus D Class Standard Car Toyota Camry Small CUV Small MPV Saturn Vue N1 (Large) Large MPV Dodge Grand Caravan N1 (Small) [new to this study] Ford Transit Connect
S-3 SUPPLEMENTAL C CLASS VALIDATION AND BASELINE MODEL RESULTS
The validation model for the supplemental C Class vehicle leveraged the vehicle performance models developed for the ICCT study described in the Project Report. The Ford Focus was chosen as the exemplar vehicle for both the gasoline and diesel versions of the Supplemental C Class validation models. The validation results for the Supplemental C Class are shown in Table S-3.1. The Supplemental C Class results were fit to the NEDC fuel economy and GHG emissions results published for the NEDC in the United Kingdom. For the validation models, the 2.0-ℓ SI Duratec engine was chosen because it is an engine variant sold in both the US and the EU. The 2.0-ℓ diesel engine is only available in the EU. Following the model validation phase, baseline vehicle models of the supplemental C Class vehicle were prepared and exercised using the program’s methodology. Given ICCT’s guidance that a 2.0-ℓ gasoline engine displacement is large for this vehicle segment, Ricardo downsized the gasoline engine to 1.6-ℓ for the baseline model. The model was then tuned to match the 0–60 mph acceleration time of the version of the Ford Focus with the 1.6-ℓ gasoline engine to ensure equivalent performance.

Client Name: International Council on Clean Transportation (ICCT) Project No.: C000908 Archive: RD.12/220901.1 Client Confidential
17 May 2012 Page 3
Table S-3.1: Supplemental C Class Validation Model Results
As with the other baseline models, the supplemental C Class vehicle has a six-speed transmission with the gear ratios shown in Table 6.2 in the Project Report, start-stop functionality, and the 70% efficient alternator. For the supplemental C Class, the gasoline and diesel baseline vehicles were exercised with a six-speed manual transmission using the legislated shift schedule for the NEDC. The gasoline C Class was also exercised using a six-speed automatic transmission to provide a more direct comparison to the earlier baseline results. The new baseline results are presented in Table S-3.2, along with the previous baseline results. (This table is also reproduced at a slightly larger size in Appendix S-1.) Note that the CO2 equivalents used in these tables were 9,087 g/gal of fuel for gasoline and 10,097 g/gal for diesel, as provided by the EPA. The Supplemental C Class (“C Class Focus”) gasoline results shown in Table S-3.2 fall more neatly between the B Class and D Class baseline gasoline results, as expected from the combination of lighter test weight and smaller, more efficient engine. The manual transmission provides some GHG emissions benefit, also, given that the baseline automatic transmission uses a fixed shift schedule. Likewise, because of the lighter test weight and use of manual transmission, the Supplemental C Class diesel results are also more evenly spaced between the B Class and D Class baseline diesel results. These Supplemental C Class results were also used as the basis for a revised version of Table 9.1 from the Project Report, which is shown below in Table S-3.3. The original C Class gasoline (SI) and Diesel results are followed by the new, Supplemental C Class results. The remaining cases are based on the Supplemental C Class test mass and the rolling resistance and aerodynamic drag of the original C Class and were calculated using the Data Visualization Tool (DVT) described in the Project Report. All other parameters were held at the Nominal Condition, with two exceptions to allow a better match of the acceleration times: the Powersplit’s Atkinson engine size was reduced to 1.53-ℓ from 1.74-ℓ, and the P2 Hybrid’s electric machine size was increased to 21.2 kW from 20.0 kW. As with the results in Table 9.1, the GHG emissions could be further improved by downsizing the engine to better match the acceleration time of 9.2 seconds, within the program’s limits on engine size.
VehicleETW (lb)
Mass (kg)
Displ. (L)
Peak Torq. (Nm)
Peak Power (kW)
Trans Spd-Type
Final Drive Ratio
EPA FTP
EPA HWY
EPA US06
NEDC JC08 FTP HWY US06 NEDC JC08
Focus C Class 2906 1318 2.0 190 110 6-MT 3.80 36.1 156
35.1 161
-2.7%
Focus C Class 2906 1318 2.0 360 122 6-MT 3.80 46.4 135
47.0 133
1.4%
CO2 (g/km)Validation C Class Focus FUEL ECONOMY (mpg)
2012 Ford Focus ---->
% difference (simulation model compared to EPA data base) ---->
2012 Ford Focus ---->
% difference (simulation model compared to EPA data base) ---->

Client Name: International Council on Clean Transportation (ICCT) Project No.: C000908 Archive: RD.12/220901.1 Client Confidential
17 May 2012 Page 4
Table S-3.2: Baseline Vehicle Performance, Including Supplemental C Class
Table S-3.3: Selected C Class Vehicle results, showing benefit of varying road loads.
Vehicle
EPA Weight Class (lbs)
Mass (kg)
Displ. (L)
Peak Torq. (Nm)
Peak Power (kW)
Trans Spd-Type
Final Drive Ratio
EPA FTP
EPA HWY
EPA US06
NEDC JC08 FTP HWY US06 NEDC JC080-10 mph (sec)
0-30 mph (sec)
0-50 mph (sec)
0-60 mph (sec)
0-70 mph (sec)
30-50 mph (sec)
50-70 mph (sec)
Speed on 5%
Grd (mph)
Speed on
10% Grd
(mph)
B Class 2625 1191 1.5 145 82 6-AT 4.00 40.3 48.6 30.2 44.0 44.8 140 116 187 128 126 1.4 4.0 7.4 9.9 13.0 3.4 5.6 94.6 82.2
C Class 3250 1474 2.0 170 86 6-AT 3.68 31.4 43.8 29.4 34.3 32.9 180 129 192 165 172 1.0 3.3 7.2 10.0 13.5 3.9 6.3 92.3 73.6
C Class Focus 1318 1.6 152 88 6-AT 3.8 38.3 147 1.0 3.2 6.6 9.4 12.6 3.4 6.0
C Class Focus 1318 1.6 152 88 6-MT 3.8 40.7 139 1.5 3.9 7.0 9.1 12.1 3.2 5.1 105.1 68.5
D Class 3625 1644 2.4 218 118 6-AT 3.23 30.5 43.5 29.0 34.0 32.3 185 130 195 166 175 1.0 3.1 6.3 8.3 11.4 3.2 5.1 110.4 86.7
Small CUV 4000 1814 2.4 218 128 6-AT 3.50 27.4 36.0 24.1 30.3 29.7 206 157 235 186 190 1.1 3.4 6.8 9.0 12.6 3.4 5.8 97.9 85.1
N1 (large) 4500 2041 3.8 319 154 6-AT 3.17 22.3 30.6 21.0 24.5 23.9 253 184 269 231 236 1.1 2.9 6.1 8.6 11.5 3.2 5.4 95.7 82.2
N1 (small) 3625 1644 2.0 174 101 6-AT 3.1 30.2 36.8 23.7 31.1 32.9 187 153 238 181 172 1.0 3.7 7.5 10.2 14.4 3.8 6.9 83.02 76.88
Vehicle
EPA Weight Class (lbs)
Mass (kg)
Displ. (L)
Peak Torq. (Nm)
Peak Power (kW)
Trans Spd-Type
Final Drive Ratio
EPA FTP
EPA HWY
EPA US06
NEDC JC08 FTP HWY US06 NEDC JC080-10 mph (sec)
0-30 mph (sec)
0-50 mph (sec)
0-60 mph (sec)
0-70 mph (sec)
30-50 mph (sec)
50-70 mph (sec)
Speed on 5%
Grd (mph)
Speed on
10% Grd
(mph)
B Class 2625 1191 1.2 193 59 6-AT 3.45 53.3 60.9 40.4 57.9 59.6 118 103 155 108 105 1.4 4.1 8.7 12.2 17.0 4.6 8.3 82.0 65.9
C Class 3250 1474 1.6 241 75 6-AT 3.40 47.2 58.7 39.9 50.5 51.6 133 107 157 124 122 1.0 3.3 7.2 10.0 13.5 3.9 6.3 92.3 73.6
C Class Focus 1318 1.6 288 97 6-MT 3.81 51.6 122
D Class 3625 1644 2.0 360 122 6-AT 3.30 44.0 56.4 36.4 47.3 47.6 143 111 173 133 132 1.0 2.9 5.6 7.6 10.0 2.7 4.4 112.1 89.3
Small CUV 4000 1814 2.2 408 131 6-AT 3.65 39.2 47.0 31.9 41.2 43.8 160 134 196 152 143 1.1 3.0 5.9 8.1 10.8 2.9 4.8 102.6 86.1
N1 (large) 4500 2041 2.2 350 103 6-AT 3.65 36.0 42.9 28.8 37.8 39.7 174 146 218 166 158 1.0 3.1 7.2 10.3 14.4 4.2 7.2 89.6 70.4
N1 (small) 3625 1644 1.8 235 66 6-AT 3.55 40.9 45.7 31.1 43.0 45.8 154 137 202 146 137 1.0 3.7 9.3 13.7 20.0 5.6 10.7 74.1 56.5
BASELINE GASOLINE FUEL ECONOMY (mpg) CO2 (g/km) PERFORMANCE
BASELINE DIESEL FUEL ECONOMY (mpg) CO2 (g/km) PERFORMANCE
Baseline with SI engine 1474 100% 100% 165 10.0Baseline with Diesel engine 1474 100% 100% 124 10.0Supp. Baseline with SI engine 1318 95% 100% 147 9.4Supp. Baseline with SI engine (manual) 1318 95% 100% 139 9.1Supp. Baseline with Diesel (manual) 1318 95% 100% 122 —
1318 100% 100% 100 9.21120 90% 90% 87 7.8923 80% 80% 76 6.8
1318 100% 100% 98 9.21120 90% 90% 85 7.9923 80% 80% 73 6.8
1318 100% 100% 96 9.21120 90% 90% 84 7.9923 80% 80% 73 6.9
1318 100% 100% 98 9.21120 90% 90% 89 8.0923 80% 80% 80 6.9
1318 100% 100% 90 9.21120 90% 90% 81 7.9923 80% 80% 74 6.8
1318 100% 100% 88 9.21120 90% 90% 78 8.2923 80% 80% 70 7.0
Atkinson (CPS) Powersplit Hybrid
Atkinson (CPS) P2 Hybrid
0-60 mph Accel time (s)
Stoich DI Turbo + 8-spd DCT
Lean-Stoich DI Turbo + 8-spd DCT
EGR DI Turbo + 8-spd DCT
Adv EU Diesel + 8-spd DCT
C Class Vehicle ConfigurationVehicle
Mass (kg)Rolling Resist.
Aero. Drag
g CO2/km
on NEDC
Client Name: International Council on Clean Transportation (ICCT) Project No.: C000908 Archive: RD.12/220901.1 Client Confidential
17 May 2012 Page 5
S-4 CONCLUSIONS
The following conclusions are supported by these supplemental results: These supplemental C Class baseline results provide a better reference point for the cost-
benefit analysis performed by ICCT. The lighter test weight and more efficient baseline engine lead to significantly improved
baseline results for the C Class vehicle. The supplemental C Class vehicle parameters fall within the design space for the 2020–
2025 C Class vehicles, thereby allowing comparisons between the supplemental C Class baseline results and various advanced vehicle configurations.

Client Name: International Council on Clean Transportation (ICCT) Project No.: C000908 Archive: RD.12/220901.1 Client Confidential
17 May 2012 Page 6
APPENDICES Appendix S-1, Input Factors and Baseline Run Results The following table contains the baseline values for the key input parameters for the vehicle performance models, by vehicle class. Vehicle mass is taken from the EPA Test Car List data; the final drive ratio comes from published information; rolling resistance and aerodynamic drag (Cd·A) are fit using the coastdown parameters; and the electric machine sizes are determined by matching 0–60 mph acceleration times. For the Supplemental C Class, the road load parameters are taken from the EPA Test Car List data, but the test weight is based on European curb weights.
The table on the next page contains the Baseline results simulated with the original vehicle engine maps (gasoline and diesel) and original vehicle parameters (aero, weight, tires) as shown above. The baseline model includes start-stop functionality and an advanced alternator. The supplemental C Class baselines include a variant with a six-speed manual transmission (6-MT) as well as the six-speed automatic transmission used for the other baseline vehicles.
Vehicle Class EP
A T
est
Wt
(lb
)
EP
A T
est
Wt
(kg
)
Fin
al D
rive
Rat
io
Tir
e R
olli
ng
R
esis
tan
ce C
oef
f.
(N∙s
)
Aer
od
ynam
ic D
rag
Cd∙A
(m
2)
No
min
al P
2 E
lect
ric
Mac
hin
e S
ize
(kW
)
No
min
al
Po
wer
split
EM
S
ize
(kW
)
B Class 2625 1189 4.00 0.0094 0.736 14 40C Class 3250 1472 3.69 0.0083 0.650 20 40D Class 3625 1642 3.23 0.0082 0.690 24 80Small CUV 4000 1812 3.50 0.0069 0.925 20 70N1 (Small) 3629 1644 3.39 0.0083 1.040 22 85N1 (Large) 4500 2039 3.17 0.0072 0.952 25 90C Class (alt.) 2906 1318 3.82 0.0079 0.650 — —
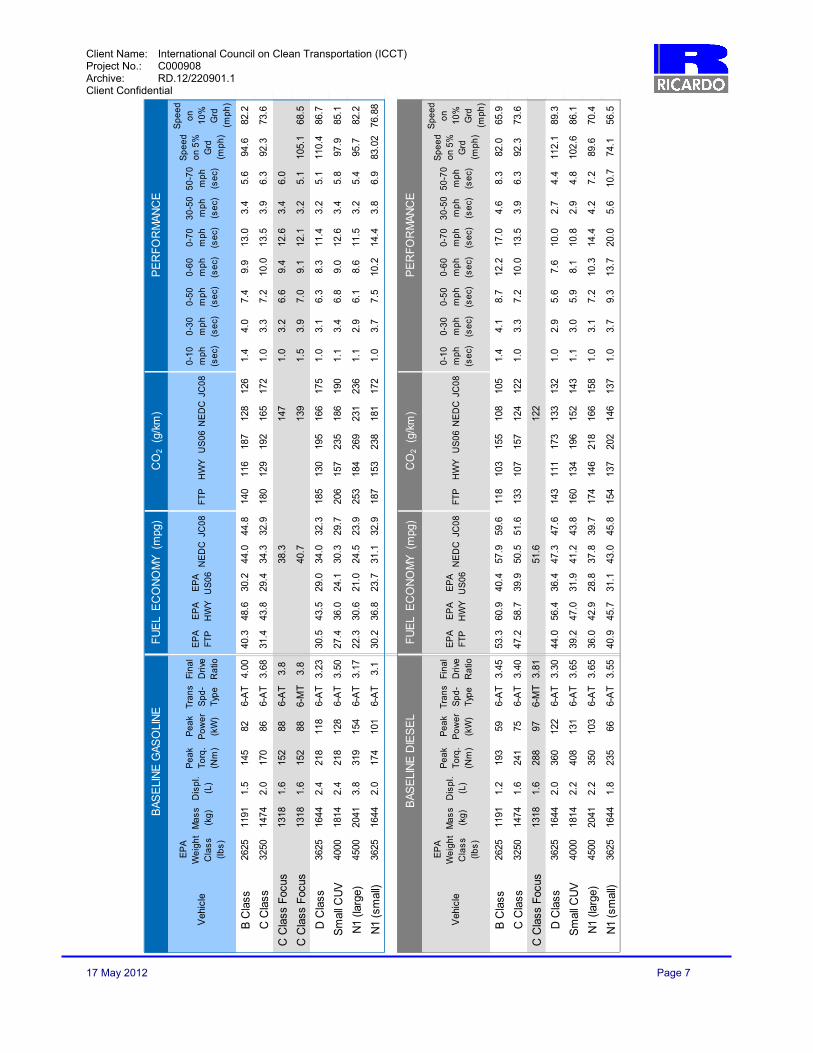
Client Name: International Council on Clean Transportation (ICCT) Project No.: C000908 Archive: RD.12/220901.1 Client Confidential
17 May 2012 Page 7
Veh
icle
EP
A
We
igh
t C
las
s
(lb
s)
Ma
ss
(k
g)
Dis
pl.
(L)
Pe
ak
To
rq.
(Nm
)
Pe
ak
Po
we
r (k
W)
Tra
ns
S
pd
-T
ype
Fin
al
Driv
e
Rat
io
EP
A
FT
PE
PA
H
WY
EP
A
US
06
NE
DC
JC0
8F
TP
HW
YU
S0
6N
ED
CJC
08
0-1
0
mp
h
(se
c)
0-3
0
mp
h
(se
c)
0-5
0
mp
h
(se
c)
0-6
0
mp
h
(se
c)
0-7
0
mp
h
(se
c)
30
-50
mp
h
(se
c)
50
-70
mp
h
(se
c)
Sp
ee
d
on
5%
G
rd
(mp
h)
Sp
eed
o
n
10
%
Grd
(m
ph
)
B C
lass
2625
1191
1.5
145
826-
AT
4.00
40.3
48.6
30.2
44.0
44.8
140
116
187
128
126
1.4
4.0
7.4
9.9
13.0
3.4
5.6
94.6
82.2
C C
lass
3250
1474
2.0
170
866-
AT
3.68
31.4
43.8
29.4
34.3
32.9
180
129
192
165
172
1.0
3.3
7.2
10.0
13.5
3.9
6.3
92.3
73.6
C C
lass
Foc
us13
181.
615
288
6-A
T3.
838
.314
71.
03.
26.
69.
412
.63.
46.
0
C C
lass
Foc
us13
181.
615
288
6-M
T3.
840
.713
91.
53.
97.
09.
112
.13.
25.
110
5.1
68.5
D C
lass
3625
1644
2.4
218
118
6-A
T3.
2330
.543
.529
.034
.032
.318
513
019
516
617
51.
03.
16.
38.
311
.43.
25.
111
0.4
86.7
Sm
all C
UV
4000
1814
2.4
218
128
6-A
T3.
5027
.436
.024
.130
.329
.720
615
723
518
619
01.
13.
46.
89.
012
.63.
45.
897
.985
.1
N1
(larg
e)45
0020
413.
831
915
46-
AT
3.17
22.3
30.6
21.0
24.5
23.9
253
184
269
231
236
1.1
2.9
6.1
8.6
11.5
3.2
5.4
95.7
82.2
N1
(sm
all)
3625
1644
2.0
174
101
6-A
T3.
130
.236
.823
.731
.132
.918
715
323
818
117
21.
03.
77.
510
.214
.43.
86.
983
.02
76.8
8
Veh
icle
EP
A
We
igh
t C
las
s
(lb
s)
Ma
ss
(k
g)
Dis
pl.
(L)
Pe
ak
To
rq.
(Nm
)
Pe
ak
Po
we
r (k
W)
Tra
ns
S
pd
-T
ype
Fin
al
Driv
e
Rat
io
EP
A
FT
PE
PA
H
WY
EP
A
US
06
NE
DC
JC0
8F
TP
HW
YU
S0
6N
ED
CJC
08
0-1
0
mp
h
(se
c)
0-3
0
mp
h
(se
c)
0-5
0
mp
h
(se
c)
0-6
0
mp
h
(se
c)
0-7
0
mp
h
(se
c)
30
-50
mp
h
(se
c)
50
-70
mp
h
(se
c)
Sp
ee
d
on
5%
G
rd
(mp
h)
Sp
eed
o
n
10
%
Grd
(m
ph
)
B C
lass
2625
1191
1.2
193
596-
AT
3.45
53.3
60.9
40.4
57.9
59.6
118
103
155
108
105
1.4
4.1
8.7
12.2
17.0
4.6
8.3
82.0
65.9
C C
lass
3250
1474
1.6
241
756-
AT
3.40
47.2
58.7
39.9
50.5
51.6
133
107
157
124
122
1.0
3.3
7.2
10.0
13.5
3.9
6.3
92.3
73.6
C C
lass
Foc
us13
181.
628
897
6-M
T3.
8151
.612
2
D C
lass
3625
1644
2.0
360
122
6-A
T3.
3044
.056
.436
.447
.347
.614
311
117
313
313
21.
02.
95.
67.
610
.02.
74.
411
2.1
89.3
Sm
all C
UV
4000
1814
2.2
408
131
6-A
T3.
6539
.247
.031
.941
.243
.816
013
419
615
214
31.
13.
05.
98.
110
.82.
94.
810
2.6
86.1
N1
(larg
e)45
0020
412.
235
010
36-
AT
3.65
36.0
42.9
28.8
37.8
39.7
174
146
218
166
158
1.0
3.1
7.2
10.3
14.4
4.2
7.2
89.6
70.4
N1
(sm
all)
3625
1644
1.8
235
666-
AT
3.55
40.9
45.7
31.1
43.0
45.8
154
137
202
146
137
1.0
3.7
9.3
13.7
20.0
5.6
10.7
74.1
56.5
BA
SE
LIN
E G
AS
OLI
NE
FU
EL
EC
ON
OM
Y (
mpg
)C
O2 (
g/km
)P
ER
FO
RM
AN
CE
BA
SE
LIN
E D
IES
EL
FU
EL
EC
ON
OM
Y (
mpg
)C
O2 (
g/km
)P
ER
FO
RM
AN
CE

Client Name: International Council on Clean Transportation (ICCT) Project No.: C000908 Archive: RD.12/220901.1 Client Confidential
17 May 2012 Page 8
DISCLAIMER Ricardo Inc. has taken all reasonable care in compiling the analyses and recommendations provided in this report. However, the information contained in this report is based on information and assumptions provided by the client or otherwise available to Ricardo which, in all the circumstances, is deemed correct on the date of writing. Ricardo does not assume any liability, provide any warranty or make any representation in respect of the accuracy of the information, assumptions, and consequently the analyses and recommendations contained in this report. The report has been compiled solely for the client's use.
Top Related