


Languages
Pages
Legal


ANALYSIS OF APPROACHES TO JOB
CREATION IN SOUTH AFRICAN
MUNICIPALIT IES
▪ Dr Hennie Labuschagne
Institute of Local Government Management (ILGM) - South-Africa
▪ Group Head Strategic Management Services - City of Johannesburg
▪ 20 October 2019

Introduction & Overview
• The current constrained economic conditions in South Africa do not
provide sufficient absorption capacity for employment in the Corporate or
SMME environments to alleviate unemployment in South Africa in the
short term.
• The normal agreed and accepted Local Economic Development
interventions and approaches of Municipalities are therefore
supplemented with Public Employment Programmes to support long term
job creation & employment opportunities
• The rationale, objectives and successes of these programmes are
reviewed & evaluated to consider its effectiveness for the future
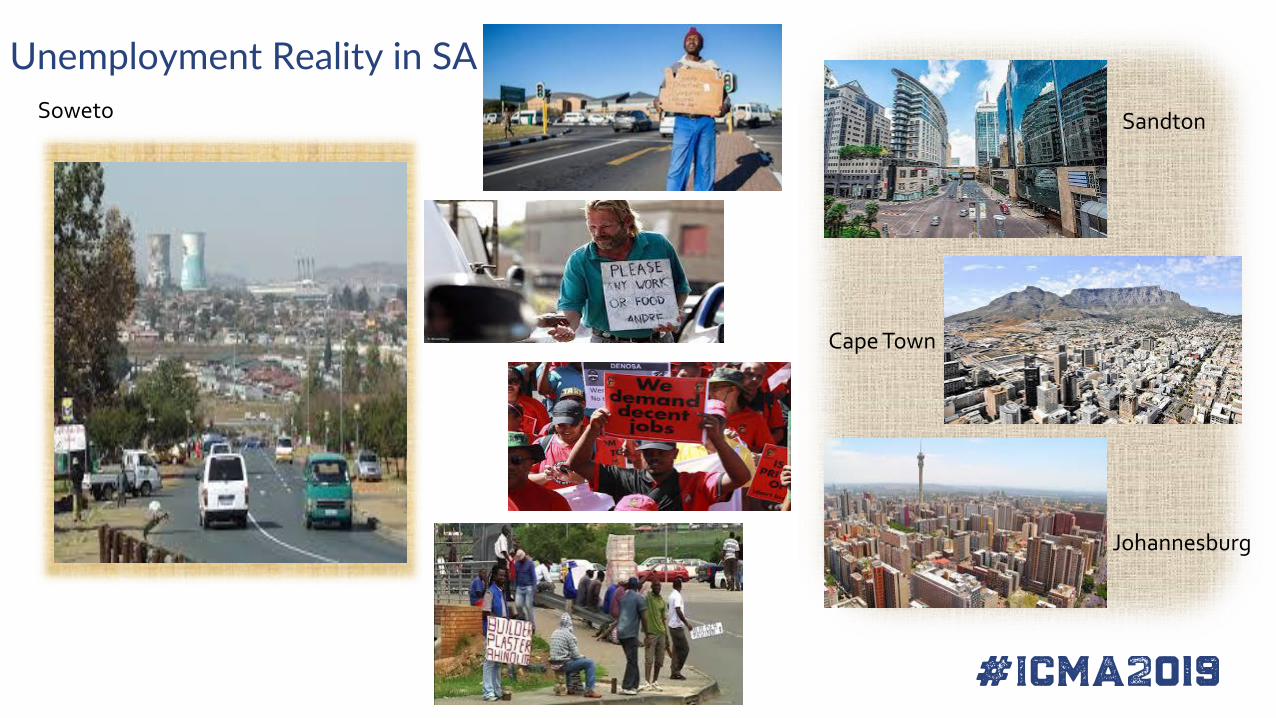
Johannesburg
Sandton
Cape Town
Soweto
Unemployment Reality in SA

One of the widely accepted premises for creating
employment is achieving economic growth. However,
estimates from the International Monetary Fund (IMF)
and the World Bank predict that the South African
economy will grow by less than 1% and the country is
at risk of losing its investment grade status from
ratings agencies
S O U T H - A F R I C A ’S C O N S T R A I N I N G
E C O N O M I C E N V I R O N M E N T
A N D U N E M P L O Y M E N T R A T E

Poverty distribution in SA
There are 278 municipalities in South Africa,
comprising of eight metropolitan, 44 district and
226 local municipalities.
These municipalities are focused on growing local
economies and providing infrastructure and
services.

SA Unemployment rate
The unemployment rate in South Africa increased to 29 percent in the second quarter of 2019from 27.6 in the previous period. It was the highest jobless rate since the first quarter of 2003,as the number of unemployed rose by 455 thousand to 6.65 million and employment rose by21 thousand to 16.31 million. A year earlier, the jobless rate was lower at 27.2 percent. TheUnemployment Rate in South Africa averaged 25.71 percent from 2000 until 2019, reaching anall time high of 31.20 percent in the first quarter of 2003 and a record low of 21.50 percent inthe fourth quarter of 2008 (Statistics SA, July 2019)
Since 2000, the total number of jobs created fell far short of the growing labour supply, withonly 2.8 million new, mainly service sector jobs created as the working age population grew.
In the same period, the World Bank report, ‘South Africa Economic Update: Focus on Jobs andSouth Africa’s Changing Demographics’, states that employment opportunities shrank inagriculture, mining and manufacturing, traditionally labour intensive sectors that employunskilled workers.
Together, these three industries now account for 19% of total employment, down from about30% in 2000, while the services sector now accounts for 72% of total employment.
(LG Seta, 2016/17 : National Enterprise and Cooperative Development Strategy)

SA Unemployment – Main Reasons
NEDLAC, Futures of Work in SA 2019
South Africa’s Economic
Performance
• Economic growth is lower than even the median of slow job creators.
• Inflation is higher than the median for slow jobs creators.
• The real effective exchange rate (REER) depreciated more than in most other countries, but average annual job growth was slower than the average for even slow job creators.
• Despite the more pronounced REER depreciation, South Africa’s current account balance was significantly weaker than most. In fact, at 29.7% of GDP, the country’s export-to-GDP ratio was lower than the median for slow job creators.
• The ratio of gross fixed capital formation to GDP was significantly lower than for most other countries.
Difference between fast and slow job creators
• Union density is 25% higher than the median for slow job creators.
• Hourly pay is 12% higher than the median for slow job creators.
• The ratio of minimum wage to average output is double the median for slow job creators.
• The minimum wage for young workers is almost four times higher than that of fast job creators.
• The cost for redundancy dismissal is significantly lower than in most other countries (fast job creators tend to have a higher severance package, reflecting the fact that firing costs have a larger marginal impact on firms’ propensity to fire than to hire).
• The share of public sector employment is considerably higher than in other countries.
South Africa’s performance
compares unfavourably in a number of respects
South Africa performs poor on
co-operative relationships
between employers and employees.

SA GOVERNMENT JOB CREATION RESPONSIBILITIES
The SA Government budget and programmes over the years reinforce its commitment to job
creation, by continuing to support employment growth through various direct interventions at
Central, Provincial and Local Government levels :-
❖ National Government: Coordination of public policies and investment programmes
including the National Development Plan (NDP) and a variety of supporting programmes
such as the Expanded Public Works (EPWP) and Community Work Programmes (CWP);
❖ Provincial Government: Coordination and building capacity of municipalities to undertake
LED and support them in its implementation;
❖ Local Government: Creation of an encouraging environment for business development and
SMMEs. Many municipalities also offer small business support under their local economic
development agencies, or dedicated small business and cooperative programmes within
their LED divisions and public-private partnership-based business-incubation centres.
❖ Various Government agencies support LED initiatives (e.g. NYDA, SETAs and SEDA, etc);
Despite extensive programmes of all Government spheres, South Africa struggles to generate
sufficient jobs to substantially lower its high levels of unemployment. The number of jobs
generated still falls short of what is needed to employ South Africa’s large existing number of
unemployed and the growing working-age population (LG Seta, 2016/17).

J O B C R E A T I O N I N T H E L O C A L
G O V E R N M E N T C O N T E X T I N S A
City-regions, cities and major towns are not only home to the majority of the population but are also the engine rooms of the South African economy – an estimated 57% of the formal economy is generated in the city-regions alone. South Africa’s cities play key roles as gateways to and/or anchors of
spatial networks – connecting people, places, freight, logistics, financial, service, learning and institutional networks
SA Cities Network 2016

PUBLIC EMPLOYMENT AS A DEVELOPMENTAL TOOL
Normally Municipalities strategic response to Job Creation talks of
seeking to support ‘economic opportunities’ – a phrasing which
falls some way short of committing specifically to job creation and
decent work.
Due to the challenges faced by National policy frameworks to
increase employment substantially and reduce unemployment -
attention is being focused, on municipal government’s role in
tackling persistent high levels of employment that goes beyond
the economic growth-oriented local economic development
strategies favoured by most of the larger city administrations.
The policy debate is about a greater commitment of resources and
targeting the needs of the poor that would help enhance the ‘pro-
poor’ orientation of municipalities – it is about whether local
government roles should focus on creating an enabling
environment for improved job creation led by the private sector,
or whether local government should make more direct
interventions in support of job creation.
(Robbins, G. 2010)
Impacts from Participation
in Work
Impacts from the Assets and Services
Delivered
Impacts from the Income
Earned
Its about more than the Incomes
All Public employment Programmes combine these three dimensions of the Development Impact
An Instrument Public Bodies can use to impact directly ….
(K Philips, 2018)

PUBLIC EMPLOYMENT PROGRAMMES (PEPs)• South Africa’s cities all face a crisis of unemployment, especially amongst youth. In developing countries, informal sector
strategies tend to assume that the informal economy has the potential to create work at scale and to shift towards
formalisation of work over time – which is not the case in SA
• While growth strategies matter, they mainly yield results in the medium term, yet job creation is urgent. This is where
public employment programmes can play a role, providing a safety net for the poor.
• South Africa’s Expanded Public Works Programme (EPWP) focuses on expanding labour-intensive ways of delivering
government services in infrastructure, environmental and social programmes through work opportunities. These temporary
work opportunities combine work experience with training and skills to assist participants’ ability to work or engage in
entrepreneurial activities once they leave the programme. EPWP beneficiaries can use the programme as stepping stone to
obtain a job or becoming self-employed.
• The Community Work Programme (CWP) is designed as a complementary approach to the existing EPWP and provides
regular, ongoing part-time work and predictable incomes, rather than full-time but short-term work opportunities. It
provides an employment safety net and sustained income to people with few employment alternatives.
• Co-operatives : The promotion of co-operatives, is a flagship project of the Department of Trade and Industry (the DTI)
that serves as an initiative to address the needs of the so-called 'second economy'. While South Africa has a highly-
developed co-operative sector, operating in the 'first economy', there are also co-operatives operating in the mainly
informal, marginalised and unskilled economy, the latter of which is populated by the unemployed and those unemployable
in the formal sector. Within this context, the Co-operatives Act of 2005, Cooperatives Amendment Act of 2013 and the
Co-operative Banks Act of 2007 provide the legislative framework for promoting and regulating co-operatives in the
country.
(Cities Network, 2016) (K Philips, 2018)

SA METROPOLITAN CITY PROFILES & PUBLIC EMPLOYMENT INITIATIVES
Although Cities are still confronted with pockets of deep deprivation -some 24% ofthe urban population is estimated to live in
poverty; employment rates – including youth employment and incomes are generally higher
in urban than in rural areas
The large cities in particular have much higher labour force participation rates than the
national average.
However, although cities provide the most jobs, the economic downturn has had a
severe effect on the urban labour market. Job losses during the recession and slow job
creation in the recovery period that followed reduced formal employment, raised informal
employment ratesand contributed to higher levels of
unemployment, particularly in the larger cities
Key City metrics
City Annual reports 2017/2018; South African Cities NetworkSA Cities Network 2011 & 2016
City Populationsize
Number of
Employees
Total budgetOpex and
Capex
Billion (Rand)
Johannesburg 4,949,347 27 379 53.800
Cape Town 4,005,016 26 225 47.702
eThekwini 3,702,231 25 802 41.600
Tshwane 3,275,152 19 660 32.600
Ekurhuleni 3,379,104 18 484 38.350
Nelson Mandela Bay 1,263,051 6 561 10. 900
Buffalo City 834,997 5 877 7. 830
Mangaung 787,803 3 771 7.200

Public Employment Initiatives of SA Metropolitan Cities The major cities in SA have taken considerable steps to strengthen economic capacity and took a
strengthened lead in city economic development.
• The City of Johannesburg
➢ City of Johannesburg, youth were contracted as ‘Digital Ambassadors’ to assist the public toaccess - free wifi in the city – with each new connection made triggering a payment.
➢ The Social Housing Company of the City (Joshco) created a total of 1 370 jobs for EPWPthrough the community development programme; and the cleaning project created 1 329jobs for tenants;
➢ Pikitup (Waste Management Entity) established 37 co-operatives and 1 362 jobs werecreated in the waste industry;
➢ Insourcing of Security and Cleaning Services – Terminating outsourced contracts andInsourcing approximately 4200 Security guards & 1 800 cleaners.
• The City of Cape Town
➢ Artisan pilot initiative, in which 110 EPWP semi-skilled workers received 18-month training and supervision from Water and Sanitation;
➢ Work placement initiative - Partnership between the City and formal employers in the hospitality industry resulted in placement of EPWP skills training graduates at various hospitality businesses for 18 months; and
➢ Facilities protection pilot initiative, which trained EPWP participants in facilities and asset protection as part of the auxiliary law enforcement officer programme
(City Annual reports 2017/18 & City Network, 2017/18)

Public Employment Initiatives of SA Metropolitan Cities (Continue)
• The City of Tshwane➢ Implemented Tshepo 10 000 - used youth to undertake tablet-based township economy surveys;➢ Job creation initiatives that aims to empower the youth of Tshwane with entrepreneurial skills and
focuses on infrastructure development and maintenance - 268 agricultural cooperatives were providedwith support in business & technical training skills training access to finance for equipment and workingcapital;
➢ Training of 1 661 beneficiaries in sector skills development programmes, implementing a number ofinterventions to empower and support small, medium and micro enterprises (SMMEs), that benefited396 SMMEs and supporting 248 youth-owned enterprises;
➢ Creating 16 114 Extended Public Works Programme (EPWP) job opportunities through theimplementation of capital and operational projects.
• eThekwini➢ The city prioritised and promoted EPWP principles in as many projects as possible, culminating in 112 projects
being reported.➢ The city has implemented EPWP projects across all sectors, especially in the infrastructure sector. Compared
to 2015/16 FTEs increased from 6376 to 8200 over the past year.
• City of Ekurhuleni➢ The City leveraged the DORA allocation of R44 million in respect of the EPWP to induce 1400 full-time
equivalent work opportunities through the departments of roads and storm water, health and socialdevelopment and environmental resources management.
➢Modelled Outsourced waste areas around the Development Contractor Approach.The City appointed six Development Contractors to create 54opportunities for community-based contractors (34) and co-operatives (14)
(City Annual reports 2017/18 & City Network, 2017/18)
2814
8,390 8,925 8,7387,279 8,576
2,747790
4,117
52,376
9223871 3482 3827 3074
10214
121 505 854
26870
0
10000
20000
30000
40000
50000
60000
Buffalo City City of CapeTown
City OfJohannesburg
City of Tswane Ekurhuleni eThekweini Mangaung Msunduzi Nelson MandelaBay
Total
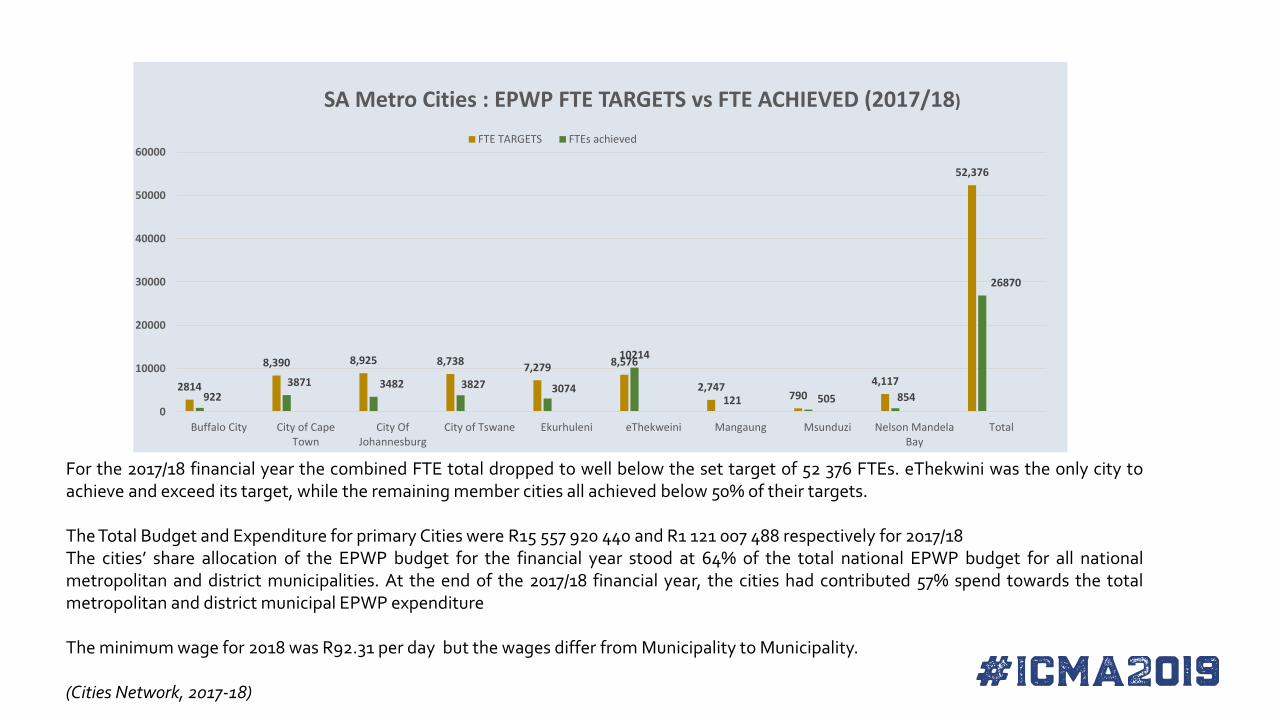
SA Metro Cities : EPWP FTE TARGETS vs FTE ACHIEVED (2017/18)
FTE TARGETS FTEs achieved
For the 2017/18 financial year the combined FTE total dropped to well below the set target of 52 376 FTEs. eThekwini was the only city toachieve and exceed its target, while the remaining member cities all achieved below 50% of their targets.
The Total Budget and Expenditure for primary Cities were R15 557 920 440 and R1 121 007 488 respectively for 2017/18The cities’ share allocation of the EPWP budget for the financial year stood at 64% of the total national EPWP budget for all nationalmetropolitan and district municipalities. At the end of the 2017/18 financial year, the cities had contributed 57% spend towards the totalmetropolitan and district municipal EPWP expenditure
The minimum wage for 2018 was R92.31 per day but the wages differ from Municipality to Municipality.
(Cities Network, 2017-18)
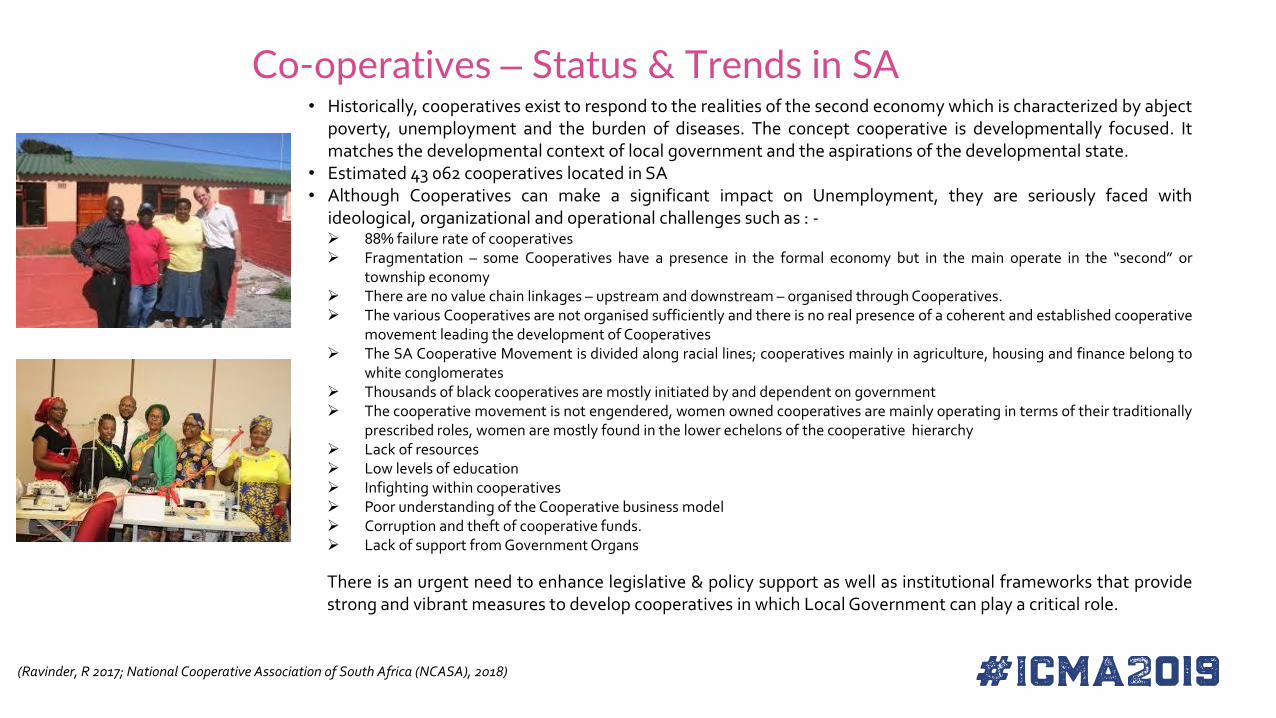
Co-operatives – Status & Trends in SA• Historically, cooperatives exist to respond to the realities of the second economy which is characterized by abject
poverty, unemployment and the burden of diseases. The concept cooperative is developmentally focused. Itmatches the developmental context of local government and the aspirations of the developmental state.
• Estimated 43 062 cooperatives located in SA• Although Cooperatives can make a significant impact on Unemployment, they are seriously faced with
ideological, organizational and operational challenges such as : -➢ 88% failure rate of cooperatives➢ Fragmentation – some Cooperatives have a presence in the formal economy but in the main operate in the “second” or
township economy➢ There are no value chain linkages – upstream and downstream – organised through Cooperatives.➢ The various Cooperatives are not organised sufficiently and there is no real presence of a coherent and established cooperative
movement leading the development of Cooperatives➢ The SA Cooperative Movement is divided along racial lines; cooperatives mainly in agriculture, housing and finance belong to
white conglomerates➢ Thousands of black cooperatives are mostly initiated by and dependent on government➢ The cooperative movement is not engendered, women owned cooperatives are mainly operating in terms of their traditionally
prescribed roles, women are mostly found in the lower echelons of the cooperative hierarchy➢ Lack of resources➢ Low levels of education➢ Infighting within cooperatives➢ Poor understanding of the Cooperative business model➢ Corruption and theft of cooperative funds.➢ Lack of support from Government Organs
There is an urgent need to enhance legislative & policy support as well as institutional frameworks that providestrong and vibrant measures to develop cooperatives in which Local Government can play a critical role.
(Ravinder, R 2017; National Cooperative Association of South Africa (NCASA), 2018)

Informal Sector – SA Local Government perspectivesTransition from the Informal to the Formal Economy - Key elements of International Labour Conference recommendation R204 related to
local authorities:-
• Preserving and improving livelihoods of informal workers during the transition to formalization.
• Providing rights, protections and incentives for informal workers, and recognises the need for a friendly legal and policy environment.
• Recognising public spaces as work places, and the need for regulated access by informal workers to public natural resources.
• Ensuring freedom of association and collective bargaining for informal workers.
• Including the membership-based organisations of informal workers in all tripartite negotiations and consultations on issues that affect them
• Promoting the preservation and expansion of formal jobs, with the informalisation of formal jobs to be prevented
• Providing social protection, including the extension of social insurance coverage, and occupational health and safety for informal workers.
• Ensuring gender-based equality and the elimination of all forms of discrimination and violence against informal workers, including gender-based violence.
• Extending labour inspection to protect informal workers.
• Collecting statistics on the informal workforce.
SALGA recognition of Local Government Informal Sector Challenges
• Local government struggles to integrate the informal economy
• Local government has an obligation to enable ‘the right to the city’
• Local government is obliged to integrate foreign nationals in the informal sector
• Local government is obliged to engage meaningfully with informal workers and economic units & regulate industry
Salga : Local Government Engagement with the Informal Economy - 2018

PUBLIC EMPLOYMENT PROGRAMMES : -KEY CHALLENGES, RISK & OPTIONS
(Robbins, G. 2010; ILO & IBSA, 2012; British Council, 2017; Cities Network, 2017; Nedlac, 2019;)
CHALLENGES ❖ Sustainability of mass employment generating programmes - Funding Challenges & Options – (Pro-employment macroeconomic policies; The Job
Fund; Unemployment Insurance Fund; Employment Creation Fund; Job Creation Trusts) ❖ Corruption – Irregular redirection of benefits❖ Maladministration❖ Coalition Government trends & implications ❖ Interventions to change the situation are not yielding the intended impact – on short term❖ Local Councils not financial viable and dependant on Grant funding❖ Short-term public employment programmes lack sustainability to really address poverty reduction
RISKS Expansion of Public Service & Local Government Employment Cost Culture of dependency & entitlement Vulnerability to Labour Union demands Labour Unrest Affordability
BENEFITS & OPTIONS➢ PEPs - Valuable policy instrument for initiation of employment opportunities to reduce the vulnerability of the poor and enable them to increase their
employability.➢ Substantial Resources available at Metropolitan Cities ➢ Extensive Government resources spent on supporting / enabling programmes – excluding formal education➢ Myriad of policies and programmes that have been put in place by government & Local Government ➢ Workplaces must create opportunities for those young people who are marginalised from the labour market➢ Expand the number of communities in which the Expanded Public Works Programme (EPWP) and the Community Works Programme (CWP) are
implemented ➢ Enhance support and Oversight over Cooperatives at Local Government Level➢ Partnering with Private Sector & Communities

1 2 3MAIN TRENDS
SLOW / LIMITED ECONOMIC GROWTH OVERSHADOWED BY INCREASE IN
UNEMPLOYMENT▪ Metropolitan Cities have considerable
human and financial resources available to utilise in response to major societal challenges – Slide 11
▪ All Metro key strategies reflect economic development & job creation as priorities but also acknowledge the inherent challenges
▪ General agreement that EconomicDevelopment-related programmes are expected to have the largest impact onemployment over the long term
▪ Short term solutions however limited -mainly directed to enabling support initiatives & temporary employment interventions
CURRENT PRIMARY DIRECT & INDIRECT EMPLOYMENT INITIATIVES & INTERVENTIONS
Direct employment interventions▪ EPWPs▪ CWPs▪ Insourcing of services
Other LED & Indirect supporting initiatives▪ Co-operatives – high mortality rate▪ Stimulate key sectors that promote economic growth (Trading
zones)▪ Entrepreneurial support – Opportunity Centres▪ Facilitate and promote investment▪ Informal Trade support, recognition & regulation▪ Leverage large Capital Infrastructure projects eg Housing / Roads
projects as job creation enablers▪ Leverage the potential across other core service delivery
programmes – Cleaning, Grass cutting & General Work ▪ Streamline Procurement & Supply Chain Management Processes as
enabling mechanism
Future Options & Considerations
Strengthen & Promote Hybrid approach – both long term LED and direct short term Public Employment Approach
▪ Co-operatives – Implement & Strengthen Formal Support structures at Municipal level
▪ EPWPs▪ CWPs▪ Public Private Partnerships▪ Insourcing of selected services
where sustainable
SUMMARY & CONCLUSION LED & Public Employment ProgrammesThe Conundrum
Top Related