


Languages
Pages
Legal

An Overview of theBrazilian Electricity Industry
Câmara de Comercialização de Energia Elétrica
Brazilian Market Operator
Roberto CastroAdministration Board
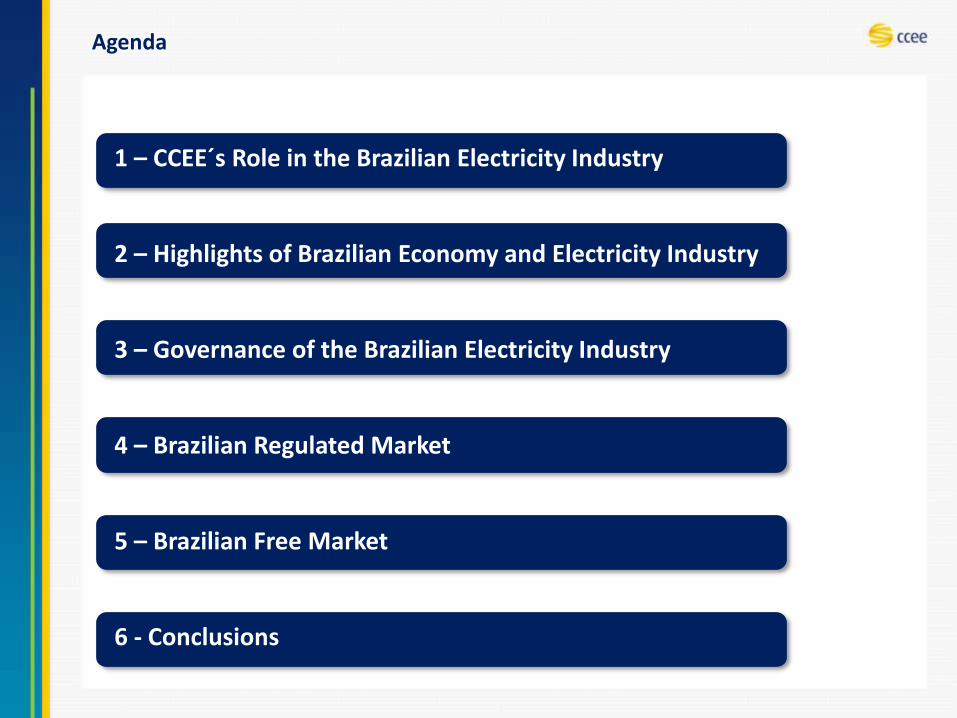
Agenda
1 – CCEE´s Role in the Brazilian Electricity Industry
2 – Highlights of Brazilian Economy and Electricity Industry
3 – Governance of the Brazilian Electricity Industry
4 – Brazilian Regulated Market
5 – Brazilian Free Market
6 - Conclusions
CCEE´s Role in the BrazilianElectricity Industry
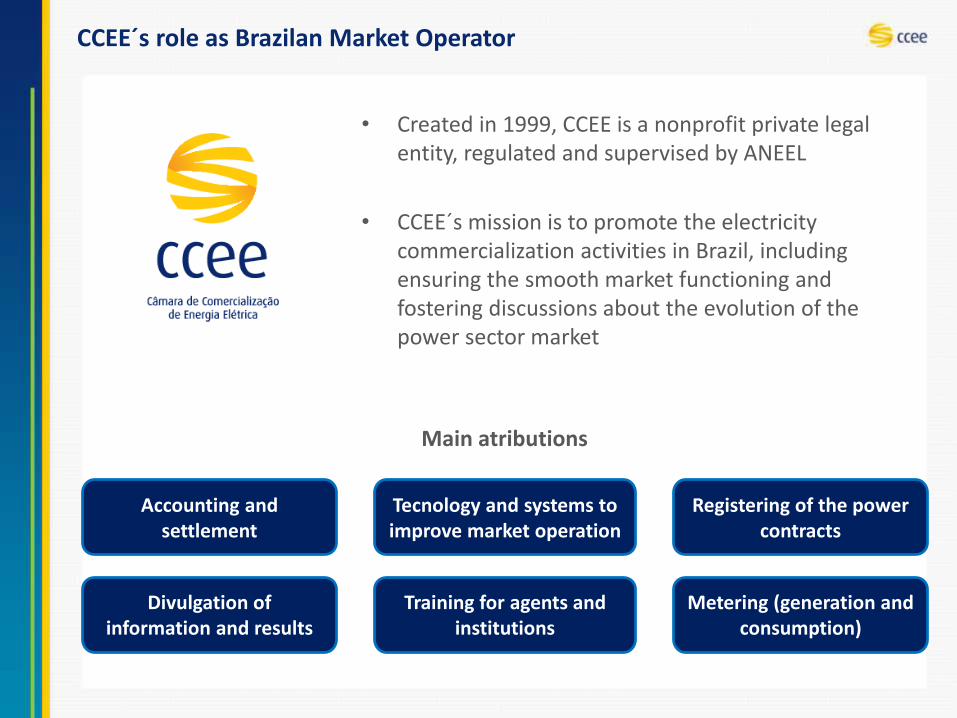
CCEE´s role as Brazilan Market Operator
• Created in 1999, CCEE is a nonprofit private legal entity, regulated and supervised by ANEEL
• CCEE´s mission is to promote the electricity commercialization activities in Brazil, including ensuring the smooth market functioning and fostering discussions about the evolution of the power sector market
Accounting andsettlement
Tecnology and systems to improve market operation
Divulgation ofinformation and results
Training for agents andinstitutions
Registering of the powercontracts
Metering (generation andconsumption)
Main atributions
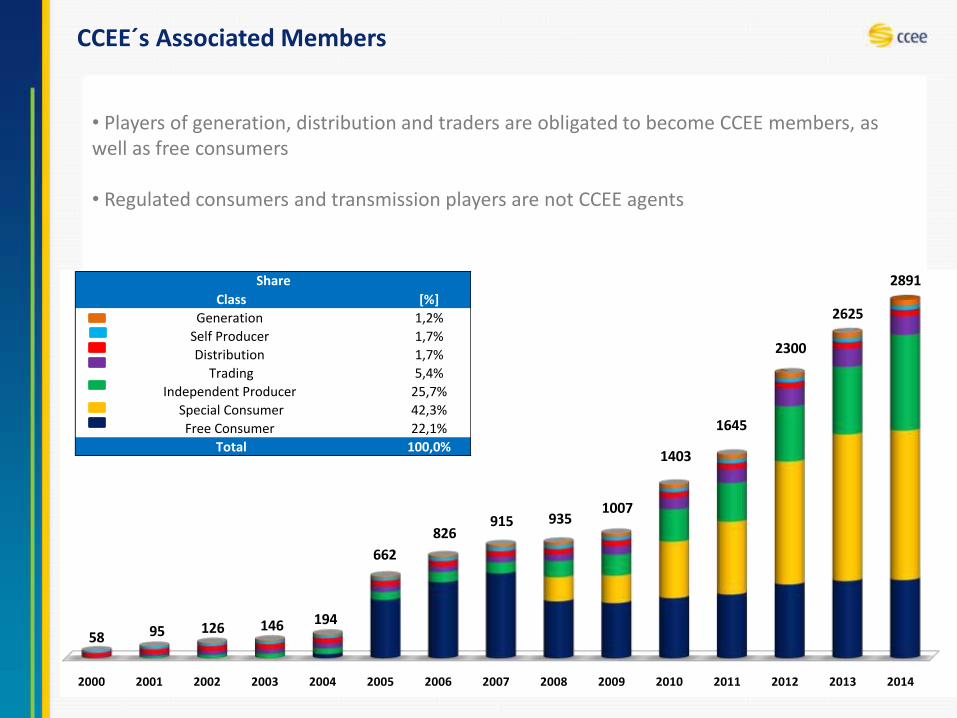
2000 2001 2002 2003 2004 2005 2006 2007 2008 2009 2010 2011 2012 2013 2014
58 95 126 146 194
662
826915 935
1007
1403
1645
2300
2625
2891Class [%]
Generation 1,2%
Self Producer 1,7%
Distribution 1,7%
Trading 5,4%
Independent Producer 25,7%
Special Consumer 42,3%
Free Consumer 22,1%
Total 100,0%
Share
CCEE´s Associated Members
• Players of generation, distribution and traders are obligated to become CCEE members, as well as free consumers
• Regulated consumers and transmission players are not CCEE agents
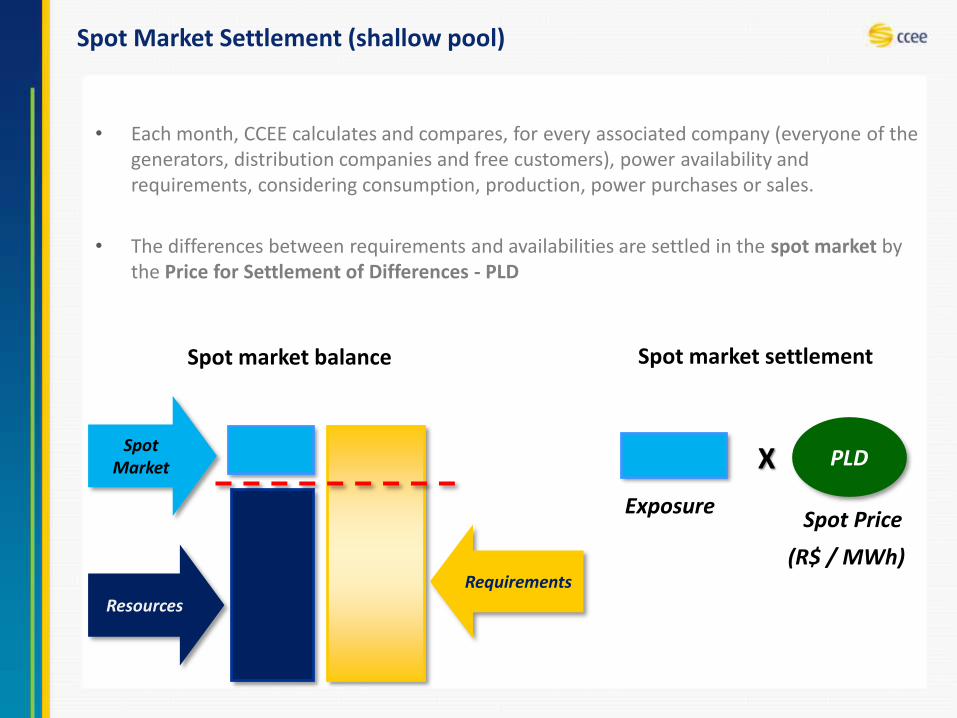
Spot Market Settlement (shallow pool)
Requirements
Resources
Spot Market
• Each month, CCEE calculates and compares, for every associated company (everyone of the generators, distribution companies and free customers), power availability and requirements, considering consumption, production, power purchases or sales.
• The differences between requirements and availabilities are settled in the spot market by the Price for Settlement of Differences - PLD
Spot market balance Spot market settlement
Exposure
X PLD
(R$ / MWh)
Spot Price
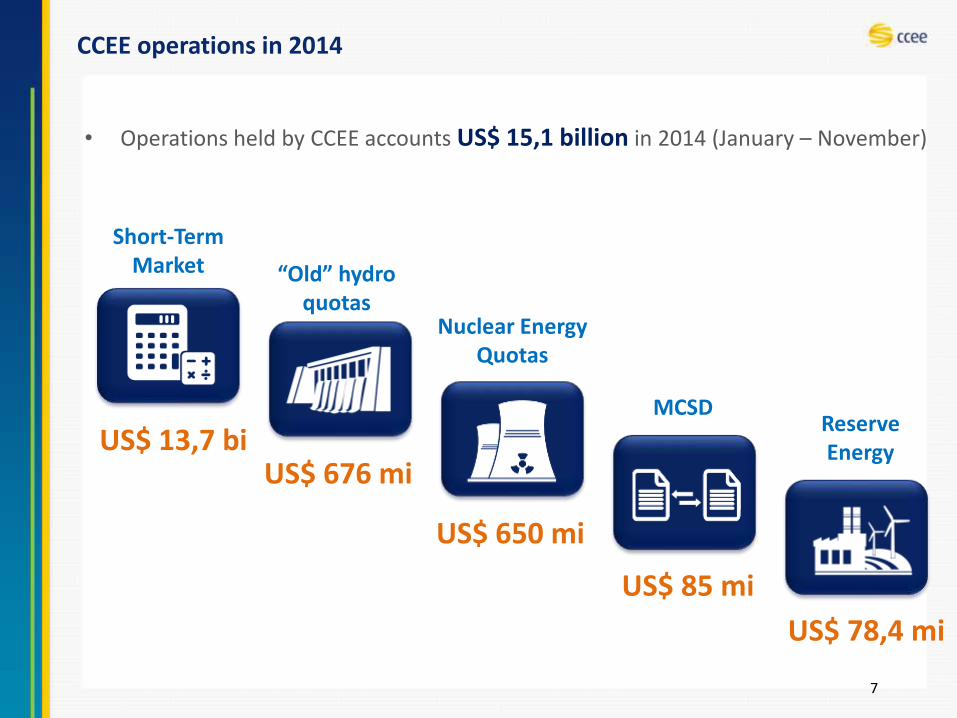
CCEE operations in 2014
7
• Operations held by CCEE accounts US$ 15,1 billion in 2014 (January – November)
US$ 13,7 biUS$ 676 mi
US$ 650 mi
US$ 78,4 mi
US$ 85 mi
Short-TermMarket “Old” hydro
quotasNuclear Energy
Quotas
MCSDReserve Energy
Highlights of Brazilian Economyand Electricity Industry
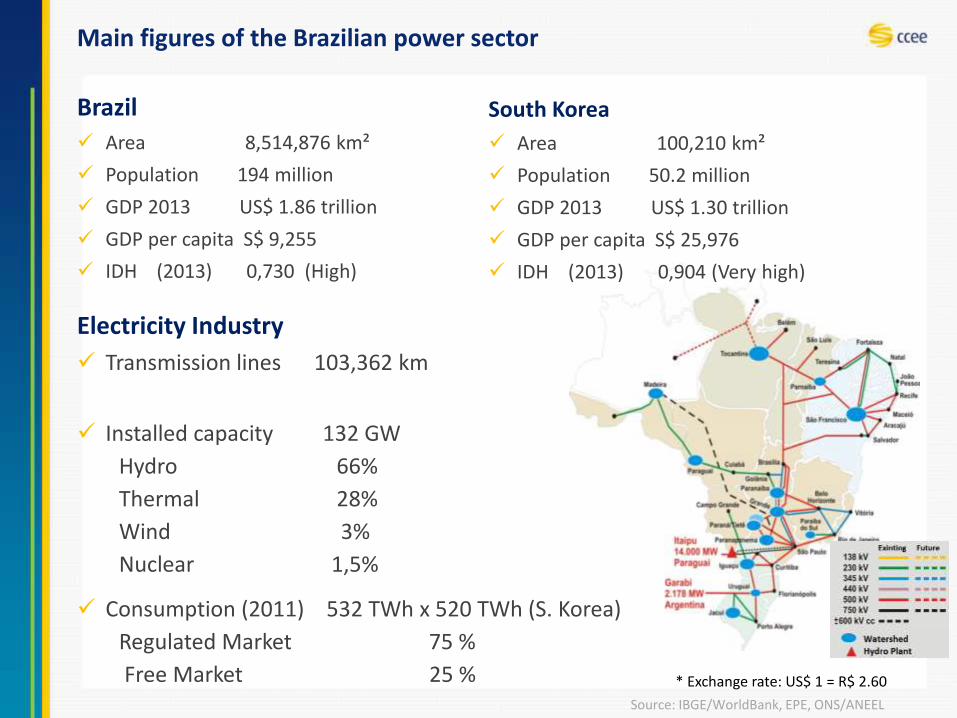
Main figures of the Brazilian power sector
Brazil
Area 8,514,876 km²
Population 194 million
GDP 2013 US$ 1.86 trillion
GDP per capita S$ 9,255
IDH (2013) 0,730 (High)
Electricity Industry
Transmission lines 103,362 km
Installed capacity 132 GW
Hydro 66%
Thermal 28%
Wind 3%
Nuclear 1,5%
Consumption (2011) 532 TWh x 520 TWh (S. Korea)
Regulated Market 75 %
Free Market 25 %Source: IBGE/WorldBank, EPE, ONS/ANEEL
* Exchange rate: US$ 1 = R$ 2.60
South Korea
Area 100,210 km²
Population 50.2 million
GDP 2013 US$ 1.30 trillion
GDP per capita S$ 25,976
IDH (2013) 0,904 (Very high)
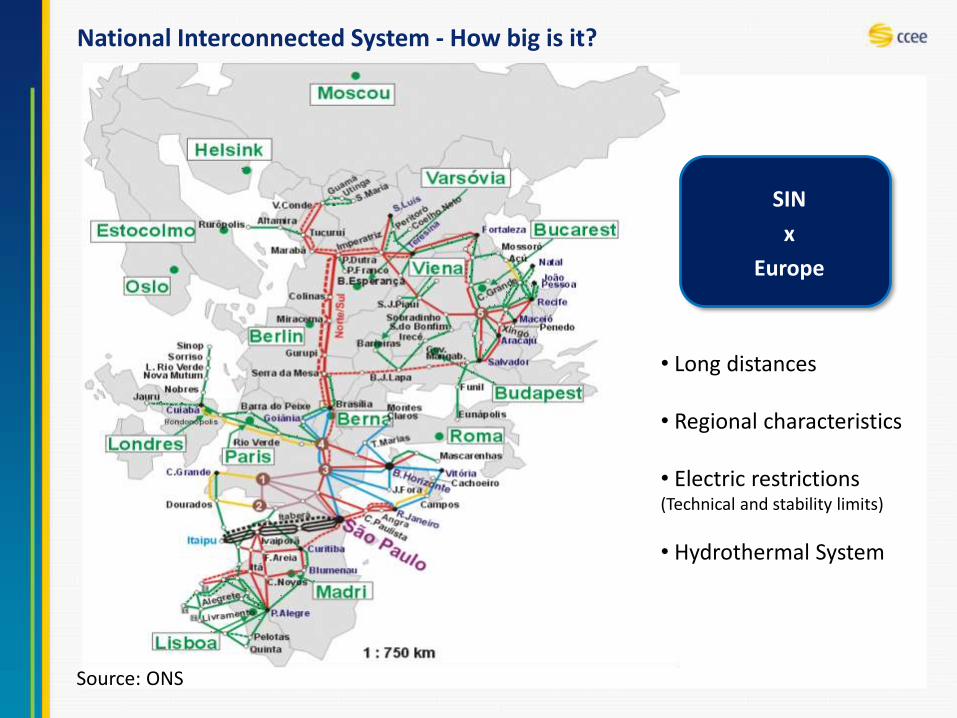
National Interconnected System - How big is it?
10
Source: ONS
SIN
x
Europe
• Long distances
• Regional characteristics
• Electric restrictions(Technical and stability limits)
• Hydrothermal System
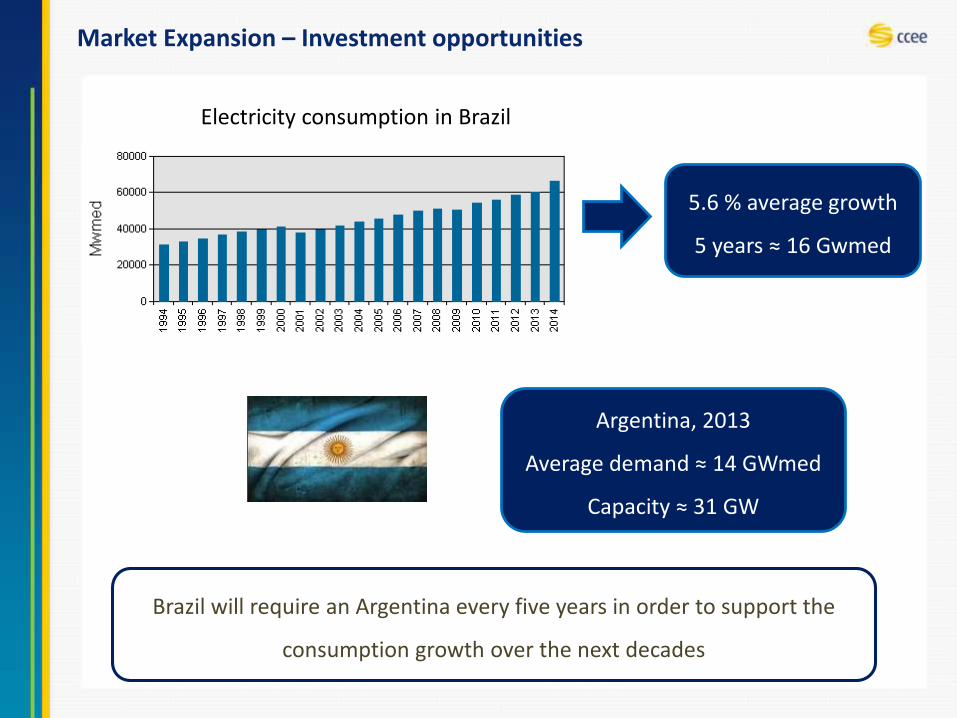
Market Expansion – Investment opportunities
Electricity consumption in Brazil
5.6 % average growth
5 years ≈ 16 Gwmed
Argentina, 2013
Average demand ≈ 14 GWmed
Capacity ≈ 31 GW
Brazil will require an Argentina every five years in order to support the
consumption growth over the next decades
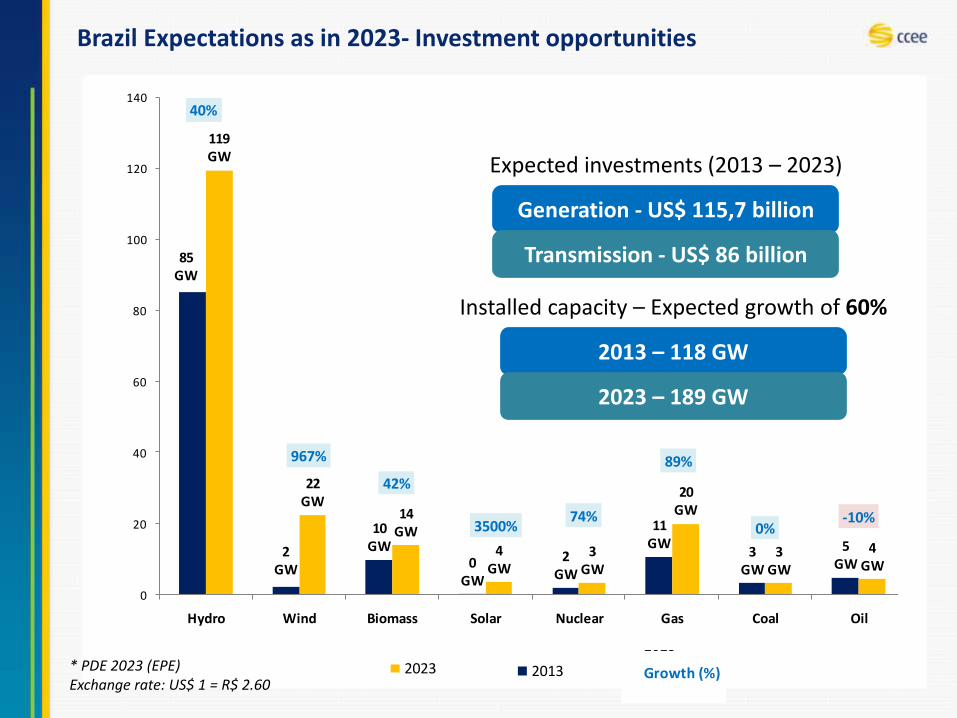
Brazil Expectations as in 2023- Investment opportunities
85 GW
2GW
10GW
0GW
2GW
11GW
3GW
5GW
119GW
22GW
14GW
4GW
3GW
20GW
3GW
4GW
40%
967%
42%
3500%74%
89%
0%-10%
-500
0
500
1000
1500
2000
2500
3000
3500
4000
0
20
40
60
80
100
120
140
Hydro Wind Biomass Solar Nuclear Gas Coal Oil
2013
2023
Growth (%)
85 GW
2GW
10GW
0GW
2GW
11GW
3GW
5GW
119GW
22GW
14GW
4GW
3GW
20GW
3GW
4GW
40%
967%
42%
3500%74%
89%
0%-10%
-500
0
500
1000
1500
2000
2500
3000
3500
4000
0
20
40
60
80
100
120
140
Hydro Wind Biomass Solar Nuclear Gas Coal Oil
2013
2023
Growth (%)
85 GW
2GW
10GW
0GW
2GW
11GW
3GW
5GW
119GW
22GW
14GW
4GW
3GW
20GW
3GW
4GW
40%
967%
42%
3500%74%
89%
0%-10%
-500
0
500
1000
1500
2000
2500
3000
3500
4000
0
20
40
60
80
100
120
140
Hydro Wind Biomass Solar Nuclear Gas Coal Oil
2013
2023
Growth (%)
85 GW
2GW
10GW
0GW
2GW
11GW
3GW
5GW
119GW
22GW
14GW
4GW
3GW
20GW
3GW
4GW
40%
967%
42%
3500%74%
89%
0%-10%
-500
0
500
1000
1500
2000
2500
3000
3500
4000
0
20
40
60
80
100
120
140
Hydro Wind Biomass Solar Nuclear Gas Coal Oil
2013
2023
Growth (%)
* PDE 2023 (EPE) Exchange rate: US$ 1 = R$ 2.60
Expected investments (2013 – 2023)
Generation - US$ 115,7 billion
Transmission - US$ 86 billion
Installed capacity – Expected growth of 60%
2013 – 118 GW
2023 – 189 GW
Governance of the BrazilianElectricity Industry
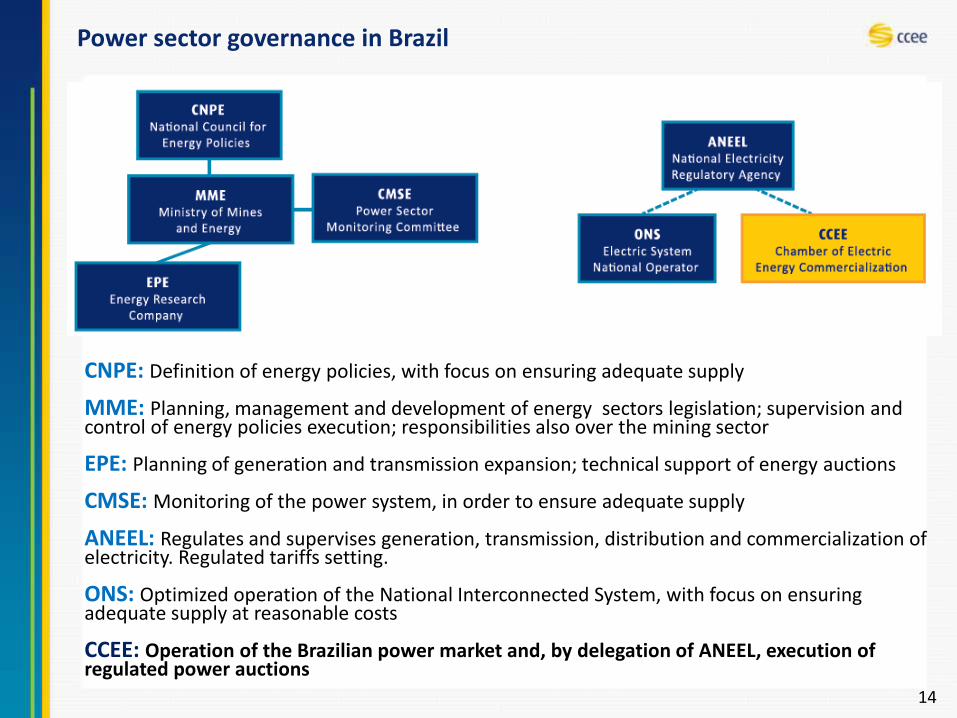
Power sector governance in Brazil
14
CNPE: Definition of energy policies, with focus on ensuring adequate supply
MME: Planning, management and development of energy sectors legislation; supervision and control of energy policies execution; responsibilities also over the mining sector
EPE: Planning of generation and transmission expansion; technical support of energy auctions
CMSE: Monitoring of the power system, in order to ensure adequate supply
ANEEL: Regulates and supervises generation, transmission, distribution and commercialization of electricity. Regulated tariffs setting.
ONS: Optimized operation of the National Interconnected System, with focus on ensuring adequate supply at reasonable costs
CCEE: Operation of the Brazilian power market and, by delegation of ANEEL, execution of regulated power auctions
Brazilian Regulated Market
Energy Auctions
16
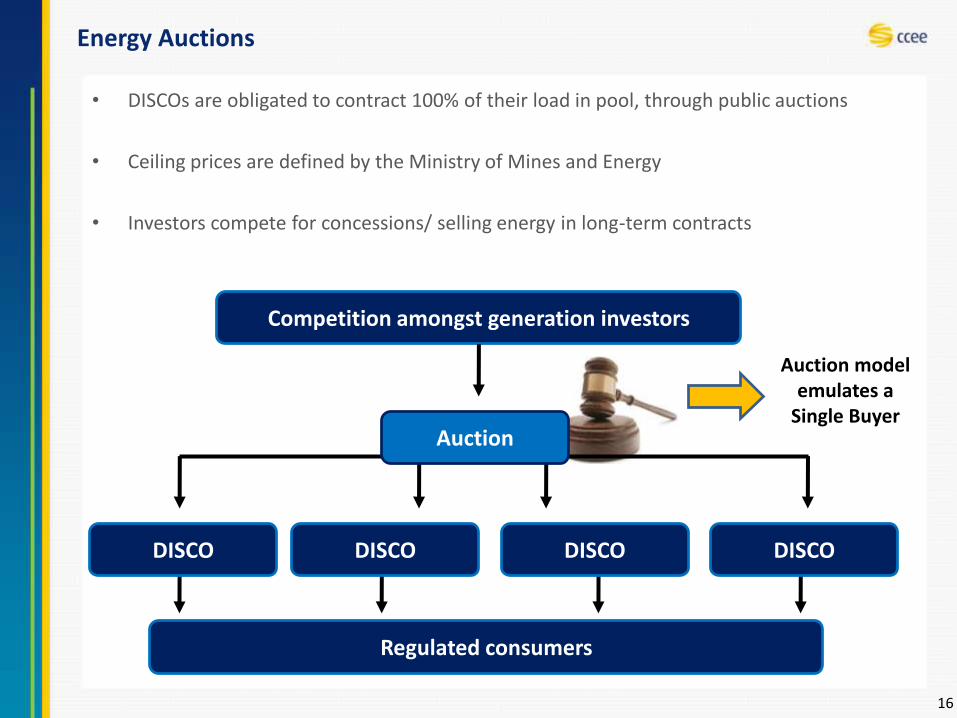
• DISCOs are obligated to contract 100% of their load in pool, through public auctions
• Ceiling prices are defined by the Ministry of Mines and Energy
• Investors compete for concessions/ selling energy in long-term contracts
Regulated consumers
Auction
Competition amongst generation investors
DISCO DISCO DISCO DISCO
Auction modelemulates a
Single Buyer
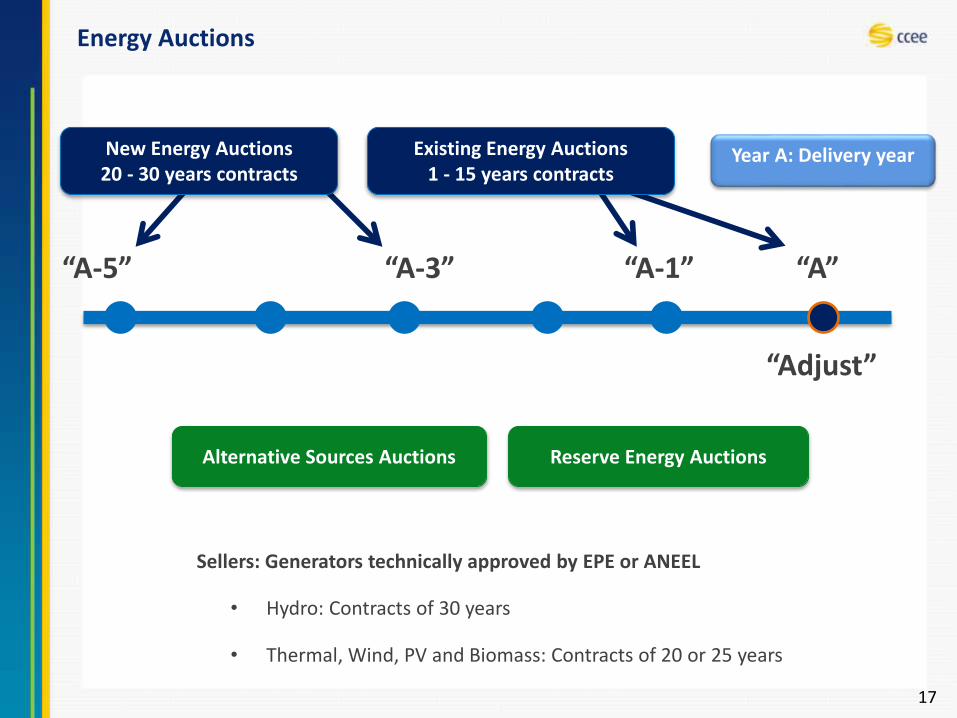
Energy Auctions
17
“A-1”“A-3”“A-5”
Existing Energy Auctions1 - 15 years contracts
New Energy Auctions20 - 30 years contracts
“A”
“Adjust”
Alternative Sources Auctions Reserve Energy Auctions
Year A: Delivery year
Sellers: Generators technically approved by EPE or ANEEL
• Hydro: Contracts of 30 years
• Thermal, Wind, PV and Biomass: Contracts of 20 or 25 years
Energy Auctions
18
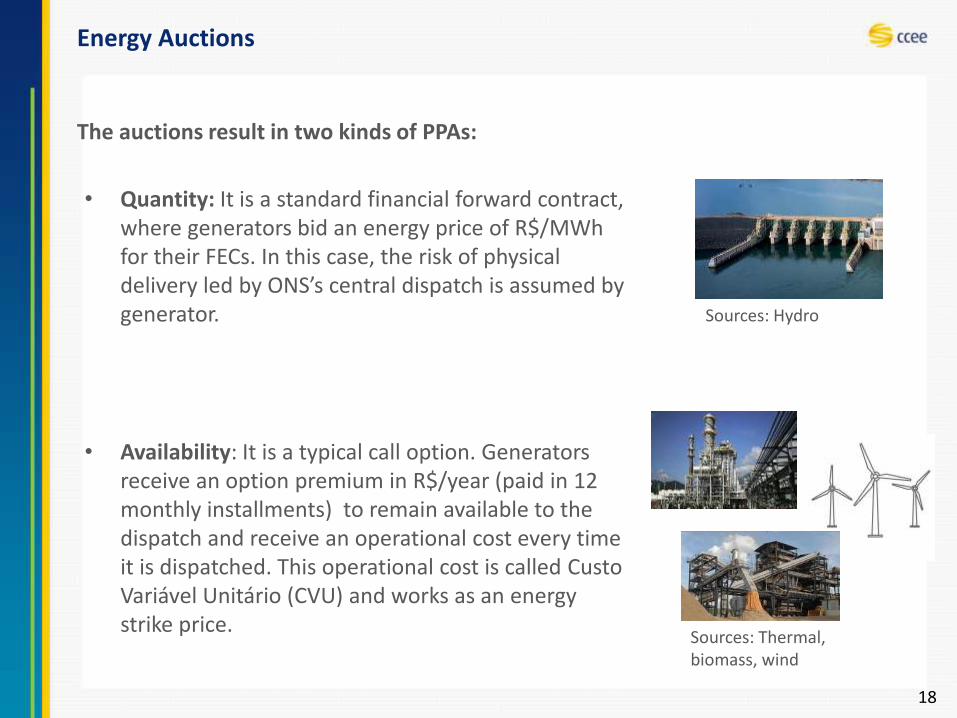
• Quantity: It is a standard financial forward contract, where generators bid an energy price of R$/MWhfor their FECs. In this case, the risk of physical delivery led by ONS’s central dispatch is assumed by generator.
• Availability: It is a typical call option. Generators receive an option premium in R$/year (paid in 12 monthly installments) to remain available to the dispatch and receive an operational cost every time it is dispatched. This operational cost is called CustoVariável Unitário (CVU) and works as an energy strike price.
The auctions result in two kinds of PPAs:
Sources: Hydro
Sources: Thermal, biomass, wind
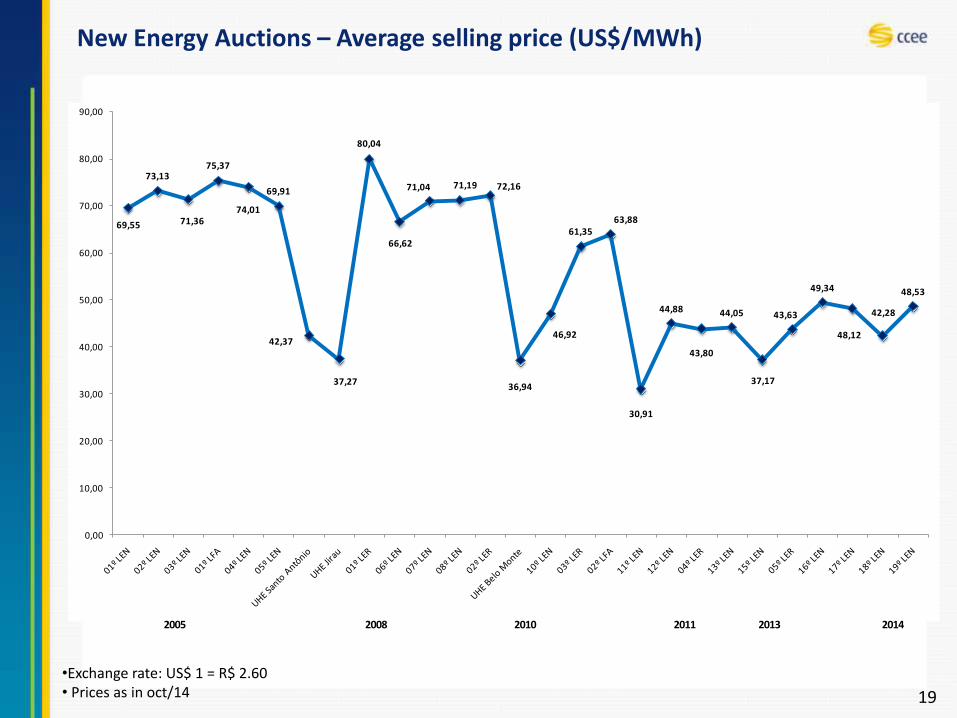
New Energy Auctions – Average selling price (US$/MWh)
19
69,55
73,13
71,36
75,37
74,01
69,91
42,37
37,27
80,04
66,62
71,04 71,19 72,16
36,94
46,92
61,3563,88
30,91
44,88
43,80
44,05
37,17
43,63
49,34
48,12
42,28
48,53
0,00
10,00
20,00
30,00
40,00
50,00
60,00
70,00
80,00
90,00
Preço médio por leilão (R$/MWh)
2005 2008 2010 2011 2013 2014
•Exchange rate: US$ 1 = R$ 2.60• Prices as in oct/14
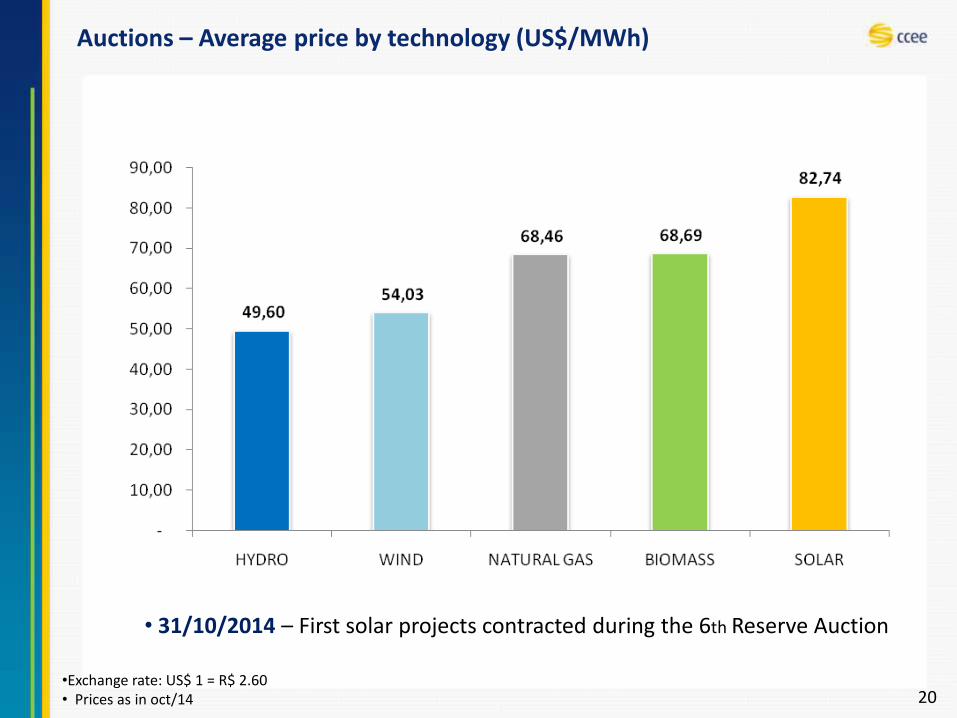
Auctions – Average price by technology (US$/MWh)
20
• 31/10/2014 – First solar projects contracted during the 6th Reserve Auction
•Exchange rate: US$ 1 = R$ 2.60• Prices as in oct/14
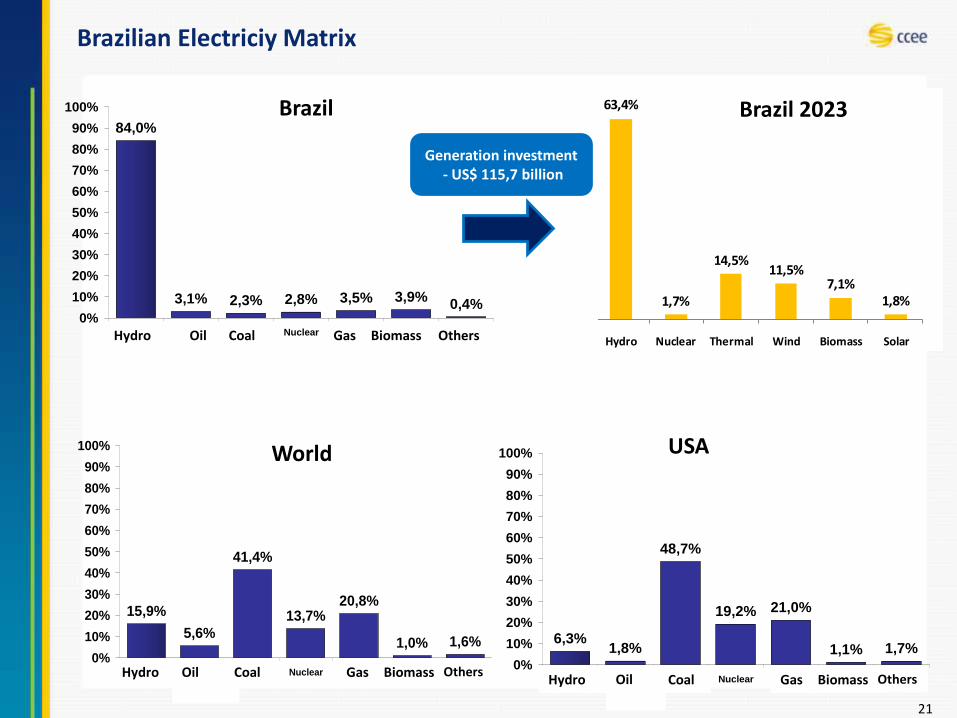
15,9%
5,6%
41,4%
13,7%20,8%
1,6%1,0%0%
10%
20%
30%
40%
50%
60%
70%
80%
90%
100%
Hidro Derivados
Petróleo
Carvão Nuclear Gás Biomassa Outros
84,0%
3,1% 2,3% 2,8% 3,5% 0,4%3,9%
0%
10%
20%
30%
40%
50%
60%
70%
80%
90%
100%
Hidro Derivados
Petróleo
Carvão Nuclear Gás Biomassa Outros
Brazilian Electriciy Matrix
21
World
6,3%1,8%
48,7%
19,2% 21,0%
1,7%1,1%0%
10%
20%
30%
40%
50%
60%
70%
80%
90%
100%
Hidro Derivados
Petróleo
Carvão Nuclear Gás Biomassa Outros
USA
Brazil
Hydro Oil Coal Gas Biomass Others
Hydro Oil Coal Gas Biomass OthersHydro Coal Gas Biomass OthersOil
63,4%
1,7%
14,5%11,5%
7,1%1,8%
0,0%
10,0%
20,0%
30,0%
40,0%
50,0%
60,0%
70,0%
Hydro Nuclear Thermal Wind Biomass Solar
Série1
Brazil 2023
Generation investment- US$ 115,7 billion

Auctions – Results
22
Results of new capacity auctions by technology, Dec-2005 to Sep-2014
Solar-PV 2021%
Hydro1239940%
Wind568518%
Biomass17475%
NaturalGas
28779%
Coal17526%
NLG9683%
Diesel5432%
Combustible Oil491116%
Thermal1105136%
FEC – Firm Energy Certificates in average MW

Brazilian Free Market
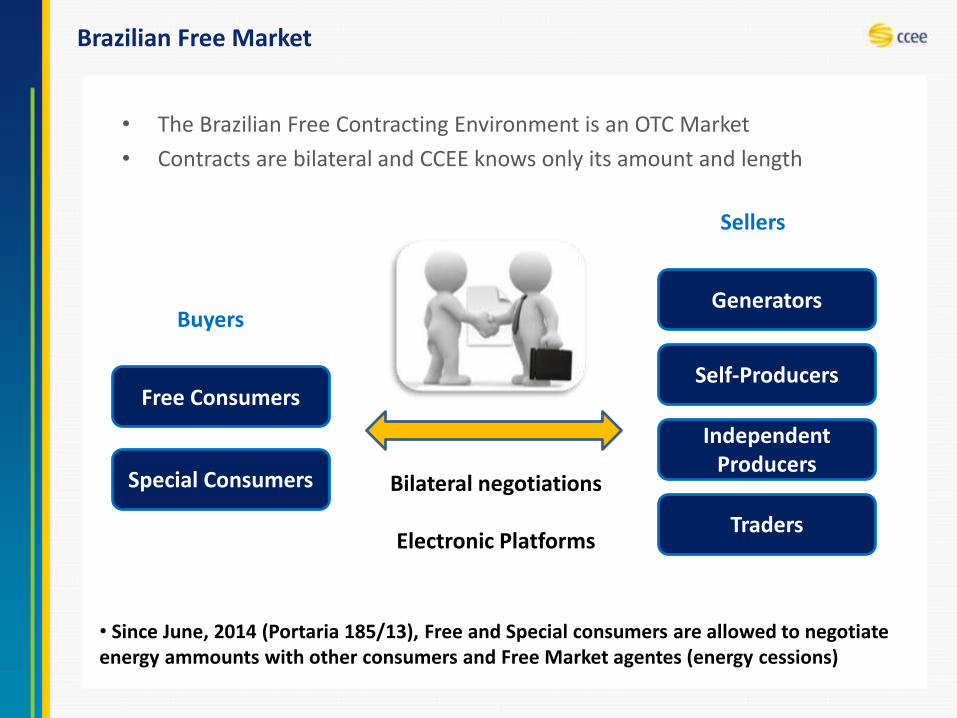
Brazilian Free Market
• The Brazilian Free Contracting Environment is an OTC Market
• Contracts are bilateral and CCEE knows only its amount and length
Generators
Self-Producers
IndependentProducers
Traders
Free Consumers
Special Consumers
Buyers
Sellers
Bilateral negotiations
Electronic Platforms
• Since June, 2014 (Portaria 185/13), Free and Special consumers are allowed to negotiateenergy ammounts with other consumers and Free Market agentes (energy cessions)
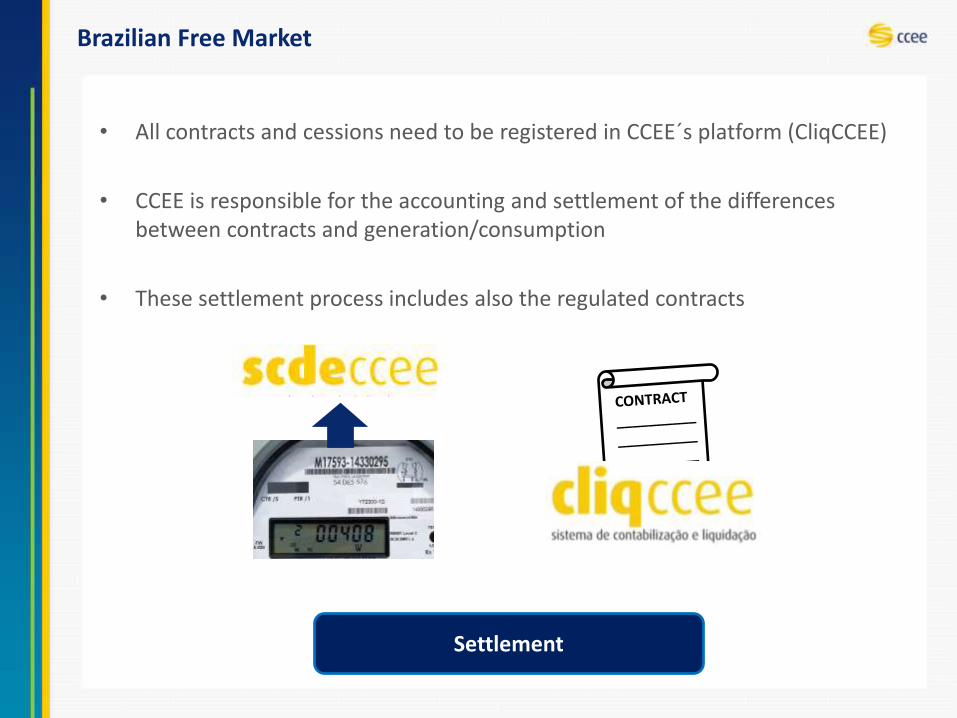
Brazilian Free Market
• All contracts and cessions need to be registered in CCEE´s platform (CliqCCEE)
• CCEE is responsible for the accounting and settlement of the differences between contracts and generation/consumption
• These settlement process includes also the regulated contracts
Settlement

Conclusions
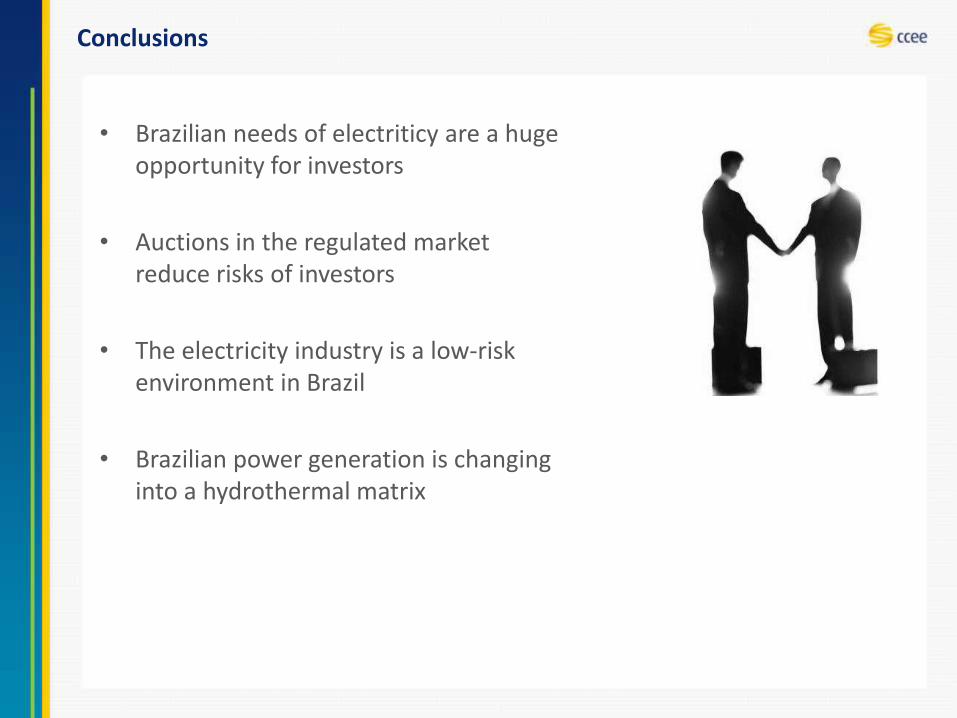
Conclusions
• Brazilian needs of electriticy are a hugeopportunity for investors
• Auctions in the regulated marketreduce risks of investors
• The electricity industry is a low-riskenvironment in Brazil
• Brazilian power generation is changinginto a hydrothermal matrix
Thank you
Roberto CastroAdministration Board
Top Related