


Languages
Pages
Legal


An evaluation of alternative binning approaches for composition data in integrated
stock assessments
Cole Monnahan, Sean Anderson, Felipe Hurtado, Kotaro Ono, Merrill Rudd, Juan Valero, Kelli Johnson, Roberto
Licandeo, Christine Stawitz, Allan Hicks, Ian Taylor
Intro
• Extensive literature exists on effective sample size and likelihood structure of composition data
• There are no studies investigating implications of different bin widths
• SS3 has separate population and data bins• Thus there is no general advice for how
analysts should process length data
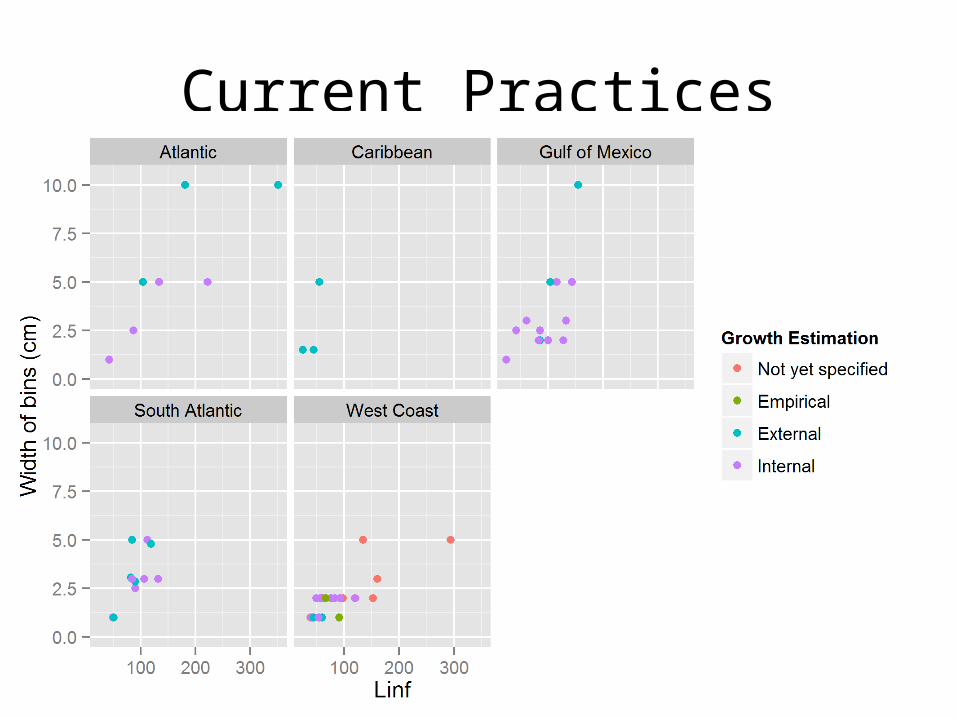
Current Practices
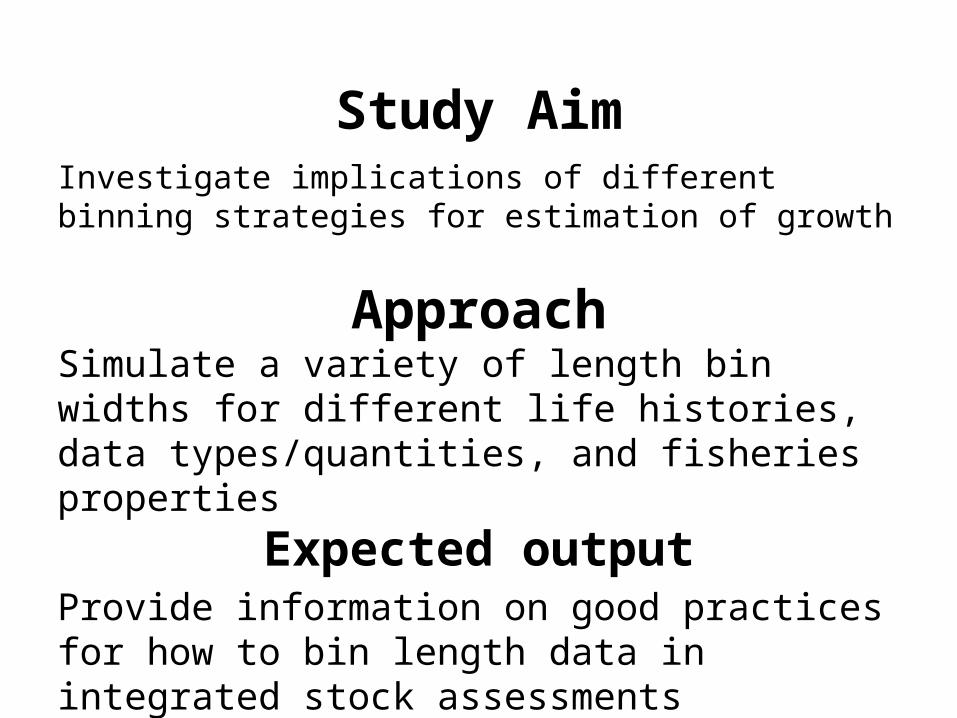
Study AimInvestigate implications of different binning strategies for estimation of growth
ApproachSimulate a variety of length bin widths for different life histories, data types/quantities, and fisheries properties
Expected outputProvide information on good practices for how to bin length data in integrated stock assessments
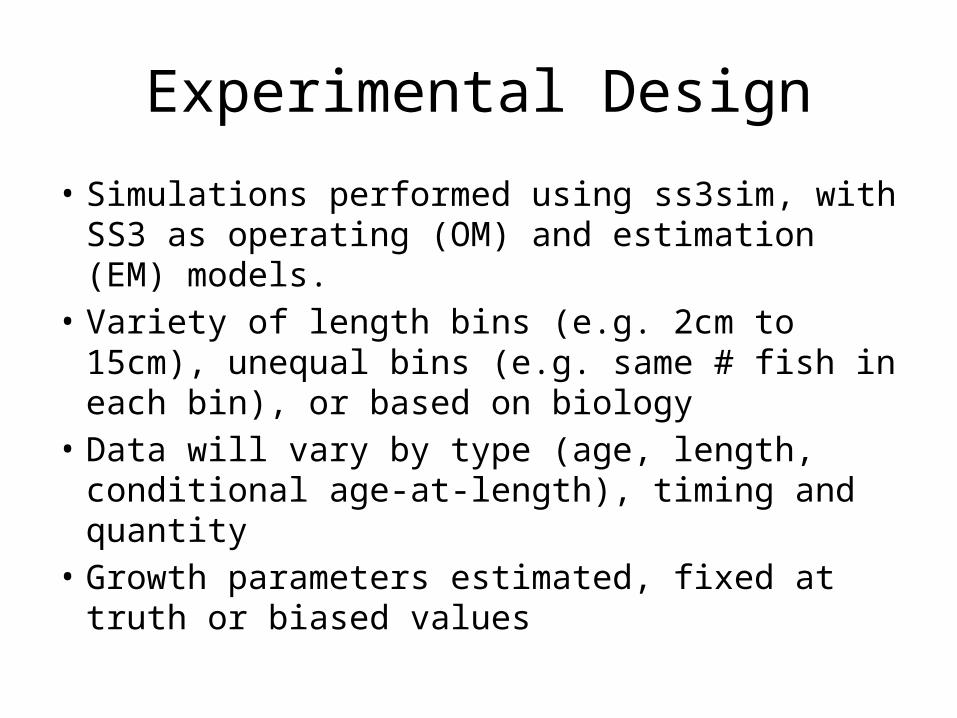
Experimental Design
• Simulations performed using ss3sim, with SS3 as operating (OM) and estimation (EM) models.
• Variety of length bins (e.g. 2cm to 15cm), unequal bins (e.g. same # fish in each bin), or based on biology
• Data will vary by type (age, length, conditional age-at-length), timing and quantity
• Growth parameters estimated, fixed at truth or biased values

Experimental Design
Biological assumptions– Life history: flatfish-like (yellowtail flounder) and
cod-like (North Sea cod).– Natural mortality fixed at truth– BH SR function w/ h fixed at truth, R0 estimated.– Weight/length and maturity fixed at truth– VBK growth constant in OM and EM, with all EM
parameters estimated.

Experimental Design
Fishery assumptions– 1 fishery starting in year 25, with two fishing
patterns (constant and two-way trip); 1 survey– OM fishery selectivity is time-invariant asymptotic
and estimated in the EM.– Catchability coefficients constant + estimated – No ageing error (for now)– Process error through recruitment
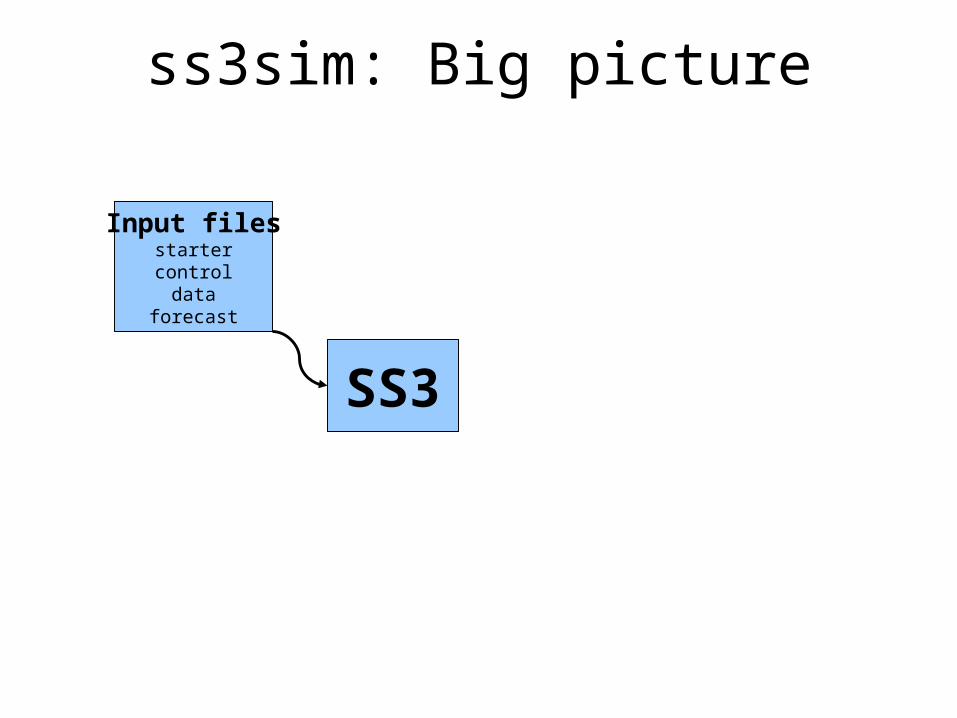
Input filesstartercontroldata
forecast
SS3
ss3sim: Big picture
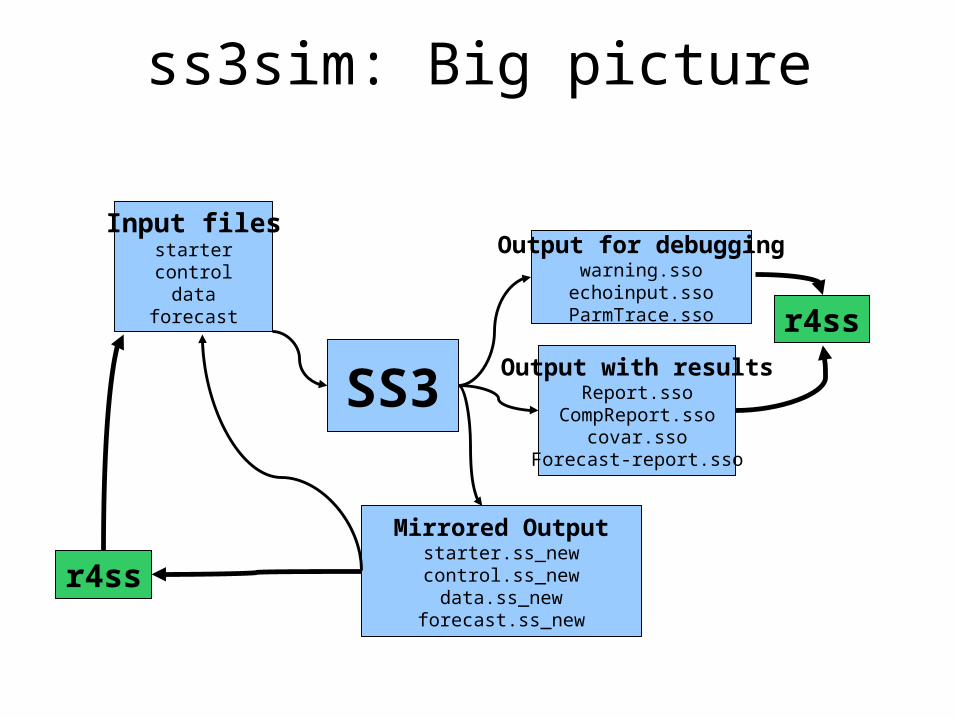
Input filesstartercontroldata
forecast
SS3Output with results
Report.ssoCompReport.sso
covar.ssoForecast-report.sso
Output for debuggingwarning.sso
echoinput.ssoParmTrace.sso
Mirrored Outputstarter.ss_newcontrol.ss_newdata.ss_new
forecast.ss_new
r4ss
r4ss
ss3sim: Big picture

Input filesstartercontroldata
forecast
SS3Output with results
Report.ssoCompReport.sso
covar.ssoForecast-report.sso
Output for debuggingwarning.sso
echoinput.ssoParmTrace.sso
Mirrored Outputstarter.ss_newcontrol.ss_newdata.ss_new
forecast.ss_new
r4ss
r4ss ss3sim
ss3sim: Big picture

ss3sim: Big picture
Reproducible, flexible, and rapid end-to-end simulation framework:
OM -> Data -> EM -> analysis– all within R, using SS3 for both models
• Designed to programmatically induce structural differences to
SS3 models (control, data, starter files)
• Useful for testing: model performance, model misspecification,
value of data, etc. Note: It does not use SS3 bootstrapping.

ss3sim: Package details
Software– Open source, cross platform (Windows, OS X, Linux). – Requires: SS3.24O, R >= 3.0.0, r4ss
Availability– CRAN (http://cran.r-project.org/package=ss3sim)
– Development version (www.github.com/ss3sim/ss3sim)
Contents – SS3 models, modified for simulation with ss3sim– R functions for modifying models, running simulations,
and extracting/plotting results

How to change data bins in SS3
• The population bins are left at a fine scale.• Change input .dat file in OM to have specified
bin structure, so that output (data.ss_new) contains the bins you want
• This accounts for selectivity for each fleet and true population dynamics is the same across binning scenarios
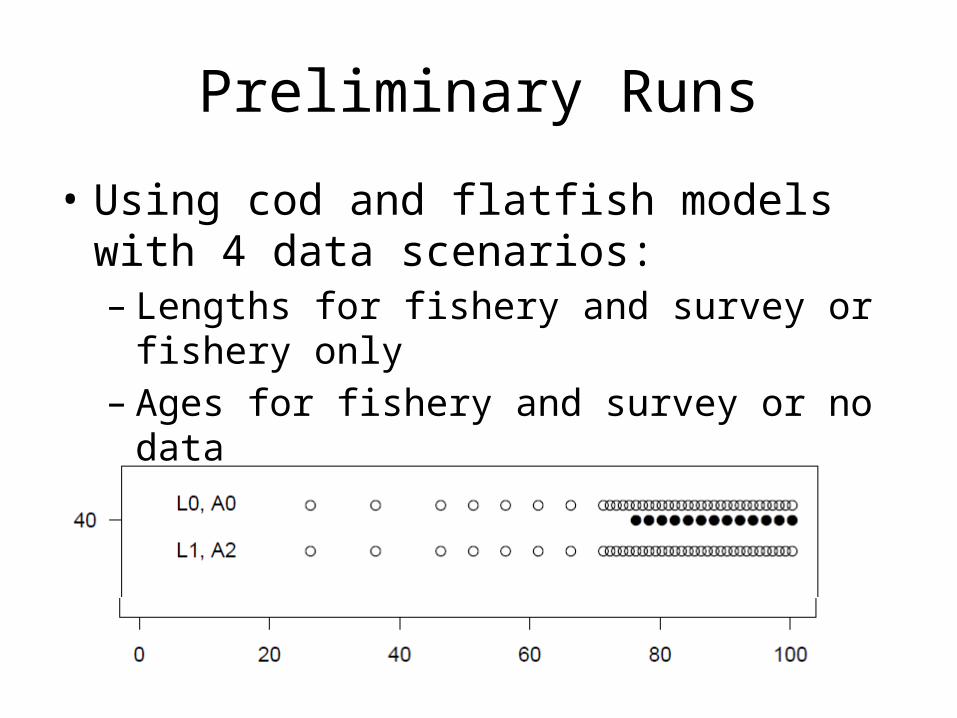
Preliminary Runs
• Using cod and flatfish models with 4 data scenarios:– Lengths for fishery and survey or fishery only– Ages for fishery and survey or no data– All growth parameters estimated
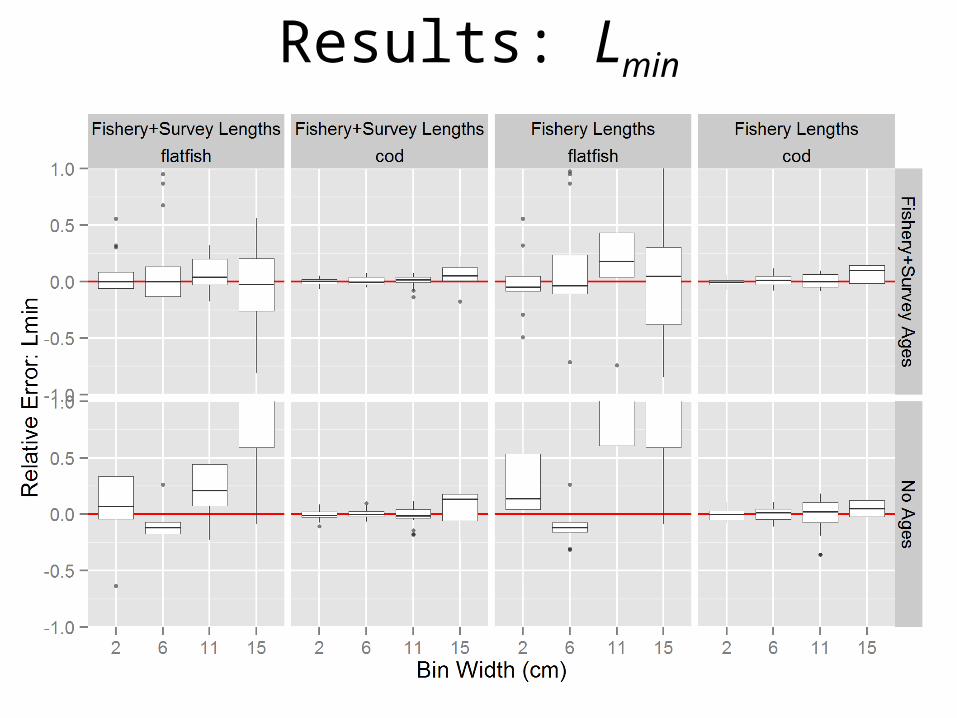
Results: Lmin

Results: Linf
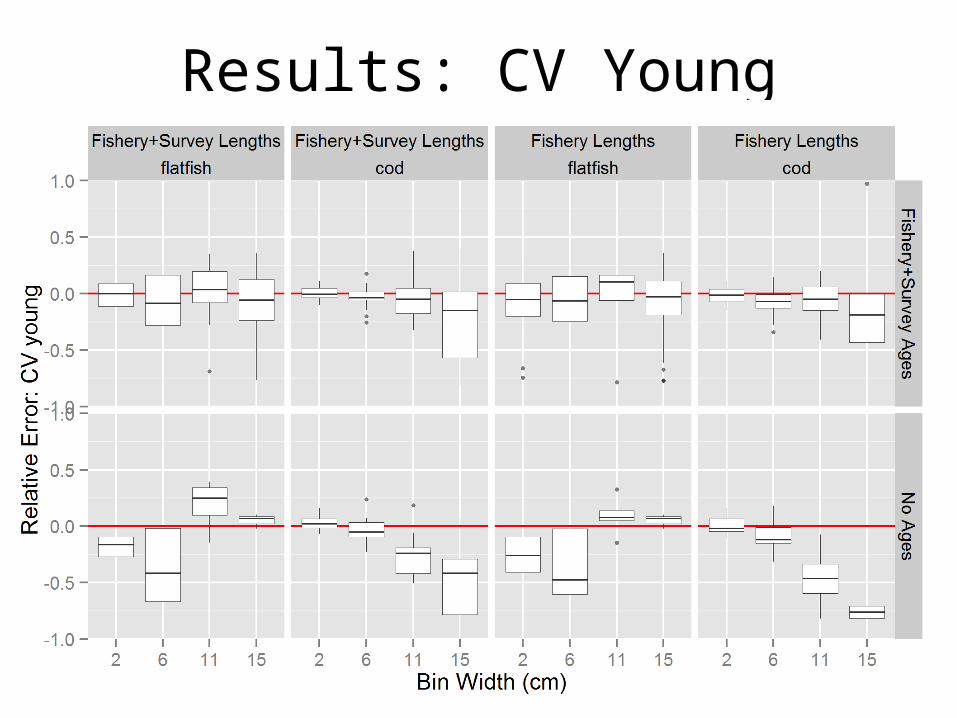
Results: CV Young

Results: CV Old

Results: K

Results: MSY

Summary of Results
• Very preliminary (with convergence issues), but…• Bin width especially important for stocks w/ large
growth CVs.• CV young and Lmin are most sensitive to the bin
structure, other parameters not as much• Larger bins actually took longer to run b/c of
convergence issues, but in general we expect them to be faster
• We expect optimal trade-off between performance and run time depends on life history and data scenario
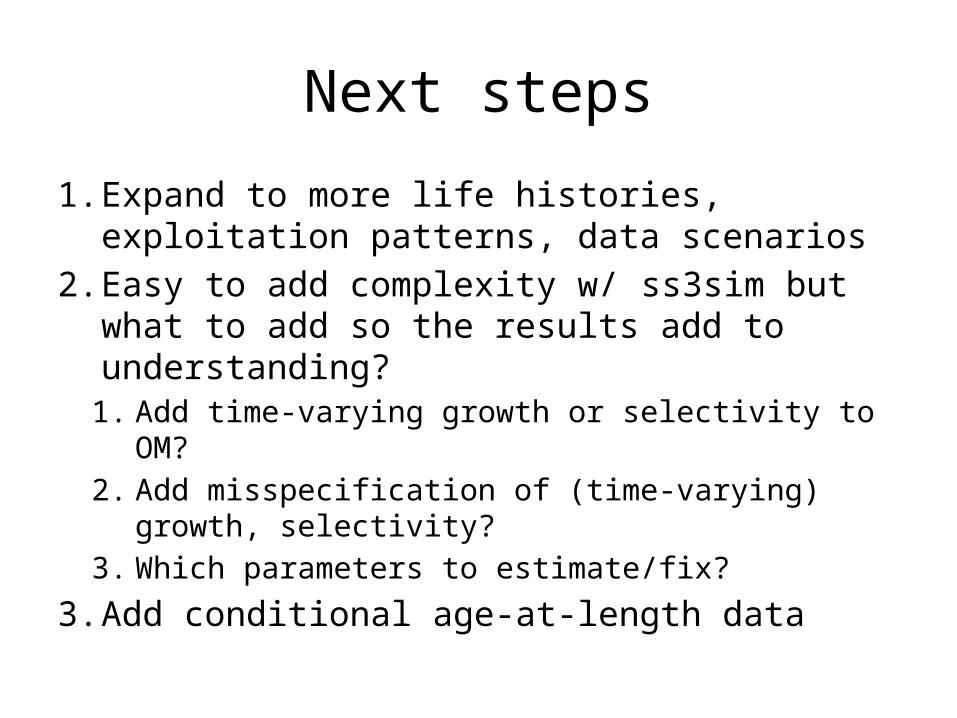
Next steps
1. Expand to more life histories, exploitation patterns, data scenarios
2. Easy to add complexity w/ ss3sim but what to add so the results add to understanding?
1. Add time-varying growth or selectivity to OM?2. Add misspecification of (time-varying) growth,
selectivity?3. Which parameters to estimate/fix?
3. Add conditional age-at-length data

Thanks
• Thanks to Andre Punt, Mark Maunder, and Ian Stewart for advice
• CAPAM for hosting and letting us talk
…. Questions?

Sampling conditional age-at-length (CAL) data
1. For each fleet (fl) and year (y):1. Multinomial sample from true length distribution
L of sample size Nlen from the length comps. This mimics sampling fish from length bins.
2. Using these proportions, multinomial sample of size Nage. This gives sample sizes for each CAL observation NCAL.
3. For length bins with NCAL >0, multinomial sample of true CAL distribution of size NCAL.


Tail compression
• Given p, compress lower and upper tail of length comps such that both contain p.
• E.g. if p=.1 then the first and last bin will contain 10% of the data.
• Note: p<0 is a different case than p=0.

Robustification Constant
• Constant added to both expected and observed values of length bins
• Supposed to help stabilize optimization.• Implemented as change_lcomp_constant
function
Top Related