


Languages
Pages
Legal

Western Kentucky UniversityTopSCHOLAR®
Dissertations Graduate School
5-2011
An Analysis of Peer Leadership Competencies andSkillsJohn P. BakerWestern Kentucky University, [email protected]
Follow this and additional works at: http://digitalcommons.wku.edu/diss
Part of the Higher Education Administration Commons, and the Military and Veterans StudiesCommons
This Dissertation is brought to you for free and open access by TopSCHOLAR®. It has been accepted for inclusion in Dissertations by an authorizedadministrator of TopSCHOLAR®. For more information, please contact [email protected].
Recommended CitationBaker, John P., "An Analysis of Peer Leadership Competencies and Skills" (2011). Dissertations. Paper 7.http://digitalcommons.wku.edu/diss/7

AN ANALYSIS OF PEER LEADERSHIP COMPETENCIES AND SKILLS
A Dissertation
Presented to
The Faculty of the Educational Leadership Doctoral Program
Western Kentucky University
Bowling Green, Kentucky
In Partial Fulfillment
Of the Requirements for the Degree
Doctor of Education
By
John Paul Baker II
May 2011

AN ANALYSIS OF PEER LEADERSHIP COMPETENCIES AND SKILLS
Cecile Garmon
~~Shane Spiller
0Jvk P~Au",,"-----,---k __Charley~
f?~.d. ~ Q.;.,{ II ?DI/. Dean, Graduate Studies and Research Date J .

I dedicate this dissertation to my family, especially my wife Cathy. My family's
understanding and support sustained me through the many hours spent away from them
studying, researching, and writing. Without their support and understanding, this doctoral
process could have defined a road of much angst rather than the road of inquiry and
enlightenment I found usually enjoyable. My wife was solely responsible for diverting
distractions and other concentration impediments, yet forcing an invaluable balanced
perspective on life critical to any worthwhile endeavor. Finally, knowing that all that is
good comes from God, my hope is this dissertation glorifies His Kingdom.
iv
ACKNOWLEDGEMENTS
This dissertation resulted from the professional dedication and sacrifices from
many wonderful people. First and foremost I acknowledge the insight, expertise,
mentoring, and sacrifice of my dissertation committee. Dr. Pride provided much needed
insight to the non-academic aspect of student life that impacts student leader development
in significant ways. Dr. Spiller was a constant force allowing mistakes yet guiding me
back to the correct methodological path. Dr. Garmon finally allowed the light of effective
and correct writing, as well as thoughtful leadership insight, to shine and illuminate a
path I desperately needed to travel. Dr. Speer is the perpetual optimist and the best choice
I made during my studies as his expert guidance, mentoring, and friendship provided a
sterling example of the perfect dissertation chair. To these four individuals I am eternally
grateful and deeply indebted.
The staff and faculty of WKU's Doctoral Program provided professionalism and a
constant source of understanding, helpful attitudes, and positive encouragement. I want to
thank Mr. Robert Cobb for his patience, sage advice, and wonderful responsiveness to
methodological issues. Ms. Emily Dillard was a constant source of accurate information
and assistance as this new doctoral program determined policies and defined standards.
Dr. Tony Norman provided guidance and never hesitated to engage the most demanding
and difficult issues that evolved while creating an effective doctoral program. The faculty
that taught us were superb, acknowledging the uniqueness of this doctoral program while
maintaining rigor and standards.
I would like to thank the faculty that allowed data collection for my dissertation in
their classes. Without their help and willingness to participate in this dissertation process

v
I could not have conducted this dissertation. I especially want to thank Dr. Jerry Dadday
for his great insight and guidance assisting in the development of the survey used to
gather data.
The graduate assistants in Leadership Studies, Ms. Meghan Purdy, Mr. Wesley
Meares, and Mr. Derrick Lottes provided great insight and thoughts that assisted me
during the data collection and research. Finally, I would like to thank Mrs. Linda Brumit
for all her support and encouragement while I completed this doctoral program.
As a member of the first Educational Leadership Doctorate cohort at WKU, the
other members of this wonderful group provided constant encouragement, positive
attitudes, and friendship. I would like to thank those of Cohort 1 who made this doctoral
journal more bearable and, in most instances, enjoyable: Dianne Bowles, Matthew
Constant, Stephanie Cornwell, Dan Costellow, Wes Cottongim, Kelly Davis, Cindy
Ehresman, Terry Elliott, Eric Gregory, Angela Gunter, Tracy Inman, Penny Logsdon,
Jace Lux, Lee Maglinger, Sheri McGuffin, Chris Mueller, Eugene Patsalides, Donna
Renaud, Holly Ross, Carol Schreiber, Lee Ann Smith, Kevin Thomas, and Wesley
Waddle.

vi
CONTENTS
ACKNOWLEDGMENTS ......................................................................................... ...iv
CONTENTS ................................................................................................................. vi
LIST OF FIGURES ....................................................................................................... x
LIST OF TABLES ....................................................................................................... xi
ABSTRACT ............................................................................................................... xiii
CHAPTER I: INTRODUCTION ................................................................................... 1
Definition ........................................................................................................... 2
Relationship Among Peer, Emergent, and Team Leadership............................... 5
Hypothesis and Methodology ............................................................................. 8
ROTC Leader Assessment Process and Definitions ............................................ 9
Common Leader Dimensions and Literature Review ........................................ 13
Assumptions .................................................................................................... 17
Limitations and Delimitations .......................................................................... 18
Significance of this Study................................................................................. 20
CHAPTER II: LITERATURE REVIEW ..................................................................... 23
Framework of Literature Review ...................................................................... 24
Social Learning Theory ........................................................................ 25
Emergent and Team Leadership ............................................................ 38
Peer Leadership .................................................................................... 45
Leader Skills and Competencies ........................................................... 57
Summary .............................................................................................. 72
CHAPTER III: METHOD ........................................................................................... 76

vii
General Research Perspective .......................................................................... 77
ROTC Database ............................................................................................... 78
Participants ........................................................................................... 79
Data and Variables ............................................................................... 79
Data Analysis ....................................................................................... 80
ROTC Database and Literature Review ............................................................ 81
Influence Survey .............................................................................................. 82
Initial Survey Development, Pre-Pilot Test ........................................... 83
Pilot Test .............................................................................................. 84
Study Participants ................................................................................. 85
Sample Technique ................................................................................ 87
Final Survey ......................................................................................... 88
Research Context and Data Collection ............................................................. 91
Data Analysis ................................................................................................... 92
Design Weaknesses .......................................................................................... 93
Summary ......................................................................................................... 96
CHAPTER IV: RESULTS ........................................................................................... 97
ROTC Database Analysis ................................................................................. 97
Influence Survey .............................................................................................. 99
Data Screening and Normality ............................................................ 100
Reliability of Influence Survey ........................................................... 101
Validity of Influence Survey ............................................................... 101
Peer Leadership Competency Hypothesis Analysis ........................................ 102

viii
Multiple Regression Analysis of Peer Leadership Competencies ........ 102
ANOVA and Multiple Regression Analysis Based on Gender ............ 105
ANOVA and Multiple Regression Analysis Based on College
Levels ................................................................................................. 108
Peer Leadership Skills Hypothesis Analysis ................................................... 111
Multiple Regression Analysis of Peer Leadership Skills ..................... 112
Gender Impact on Peer Leadership Skills............................................ 115
College Level Impact on Peer Leadership Skills ................................. 116
Summary ....................................................................................................... 118
CHAPTER V: DISCUSSION .................................................................................... 119
Development of an Influence Survey.............................................................. 119
Discussion of Peer Leadership Competency Hypothesis ................................. 123
Gender Influences on Peer Leadership Competencies ......................... 126
College Level Influences on Peer Leadership Competencies ............... 127
Discussion of Peer Leadership Skills Hypothesis............................................ 128
Gender Influences on Peer Leadership Skills ...................................... 128
College Level Influences on Peer Leadership Skills ............................ 130
Implications of this Study to Leadership Pedagogy ........................................ 133
Methodological Implications and Limitations ................................................. 135
Implications for Future Research .................................................................... 138
Summary and Conclusions ............................................................................. 140

ix
REFERENCES ...................................................................................................... 142
Appendix A—Institutional Review Board Approval .............................................. 154
Appendix B—Influence Survey, Demographic Data Sheet, and Administration
Script ..................................................................................................................... 158

x
LIST OF FIGURES
Figure 1. Relationship Between Team, Emergent, and Peer Leadership ......................... 7
Figure 2. Peer Leadership Model ................................................................................. 47

xi
LIST OF TABLES
Table 1. U.S. Army Leadership Dimensions and Descriptions .................................. ...11
Table 2. Leadership Skills and Competencies Identified from a Review of
Literature ........................................................................................................... 73
Table 3. Demographic Information for Pilot Data, Study Data, ROTC Data, and
Study University Population ............................................................................... 86
Table 4. Cronbach‘s Alpha Reliability of Influence Survey Principle Components .... 101
Table 5. Regression Model Summary of the Constant and Four Predictors: Assist,
Participate, Reflect, and Presence .............................................................................. 102
Table 6. Exploratory Principle Component Loading of 18 Survey Questions ............. 103
Table 7. Multiple Regression Source Table for Peer Leadership Competencies .......... 104
Table 8. Summary of Multiple Regression Analysis for Peer Leadership
Competencies ................................................................................................... 105
Table 9. Mean, Standard Deviations, and ANOVA Analysis for Peer Leadership
Competencies Based on Gender ........................................................................ 106
Table 10. Multiple Regression Source Tables for Male and Female Participants ........ 106
Table 11. Summary of Multiple Regression Analysis for Male and Female Peer
Leadership Competencies ................................................................................. 107
Table 12. Regression Model Summary of the Constant and Four Predictors for Male
And Female Participants: Assist, Participate, Reflect, and Presence ................. 108
Table 13. Mean, Standard Deviations, and ANOVA Analysis for Peer Leadership
Competencies Based on College Levels ........................................................... 108

xii
Table 14. Multiple Regression Source Table for College-Level Participants .............. 109
Table 15. Summary of Multiple Regression Analysis for Peer Leadership
Competencies by College Level ........................................................................ 110
Table 16. Regression Model Summary of the Constant and Four Predictors for
College-Level Participants: Assist, Participate, Reflect, and Presence .............. 111
Table 17. Multiple Regression Source Table for Peer Leadership Skills ..................... 112
Table 18. Summary of Multiple Regression Analysis for Peer Leadership Skills by
Competency ...................................................................................................... 113
Table 19. Regression Model Summaries of the Peer Leadership Competencies
Based on Peer Leadership Skills: Assist, Participate, Reflect, and Presence ..... 114
Table 20. Summary of Multiple Regression Analysis for Peer Leadership Skills by
Competency and Gender ................................................................................... 115
Table 21. Regression Coefficient Analysis for Peer Leadership Skills by
Competency and College Levels ....................................................................... 117

xiii
AN ANALYSIS OF PEER LEADERSHIP COMPETENCIES AND SKILLS
John Baker May 2011 161 Pages
Directed by: Nevil Speer, Cecile Garmon, Shane Spiller, and Charley Pride
Educational Leadership Doctoral Program Western Kentucky University
A significant leadership challenge exists while leading others without legitimate
or formal authority. Leading without legitimate authority may require different and
limited leadership skills and competencies, especially when leading peers. This
quantitative study analyzed the leader competencies and skills needed for effective peer
leadership.
A literature review identified four competencies cited frequently as important: (a)
communication; (b) support; (c) mental/hard work ethic; and (d) reflection/feedback.
Analysis of an ROTC leadership assessment database provided convergent validity for
the literature review while adding one additional competency, physical. The lack of
existing instruments measuring peer leadership competencies and skills necessitated the
development of an influence survey. The resulting influence survey included a frame of
reference scenario, two stem questions and 40 specific peer leadership skill questions.
The final survey allowed data collection from 1084 undergraduate students.
A principle component analysis verified validity and identified the best model
based on 18 of the 40 questions in the survey. The four components identified included
Assist, Reflect, Participate, and Presence based on the thematic nature of the questions
comprising the factors. The multiple-regression model of male and female participants
for the four peer leadership competencies indicated significant contributions of
xiv
competencies to the regression model in the same order of importance. An ANOVA of
college levels found no significant differences between the four levels.
Multiple regression analysis conducted on each peer leadership competency
defined in this study identified the most important peer leadership skills. Analyzing the
questions comprising the Participate competency indicated that peers prefer peer leaders
who communicate effectively, listen effectively, encourage them, and included them
when making decisions. The Assist competency included peers skills that demonstrated a
positive attitude, provided assistance in defining goals or making decisions, and made a
sincere effort to reach consensus with the peer. The Presence competency focused on the
peer leader having a physical presence with the peer. The Reflect competency consisted
of peer leader actions that caused the influenced peer to analyze the situation, learn from
the situation, and reflect and meditate to better understand the situation.

1
CHAPTER I: INTRODUCTION
A significant leadership challenge is to lead when not in a position of legitimate
or formal authority. Legitimate authority, or a formal position of leadership, allows
leaders to use a diverse set of skills and competencies to influence others and lead to
accomplish goals (French & Ravens, 1959). Leading without legitimate authority may
require different and limited leadership skills and competencies, especially when leading
peers. Relatively few studies have addressed effective skills and competencies needed for
peer leadership. Loughhead and Hardy (2005) stated, ―...very little research has focused
on peer leadership...‖ (p. 305).
Anecdotal observations over seven years as a Professor of Military Science revealed
a predictable cycle of leader failure in senior Reserve Officer Training Corps (ROTC)
Cadets leading their peers while attempting to accomplish required tasks during an
undergraduate academic school year. Senior ROTC cadets assigned to positions with
legitimate authority operated effectively as leaders for approximately four weeks into an
academic semester. However, after approximately one month, the seniors with legitimate
authority lost leadership effectiveness over other senior cadets who lacked legitimate
authority; resulting situations required ROTC instructors‘, (cadre), intervention. ROTC
cadre had to provide increased intervention as the semester progressed as senior ROTC
cadets with legitimate authority become increasingly ineffective. Many variables could
account for the ineffective leadership of senior ROTC cadets who had legitimate
authority, but one possible factor, from anecdotal observations, was ineffective peer
leadership.

2
Peers have a significant impact on college student development. Brown (1972)
focused on the impact peers have in student development. Adelman (2002) identified
Astin, Newcomb, Brown, Heath, Chickering, Pascarella, and Terenzini as having
contributed to the body of knowledge regarding peer leadership. Peer leadership is
closely linked to both emergent and team leadership, but distinct differences exist. The
research questions for this study focused on identifying leader competencies and skills
needed to enhance peer leadership. The present study explored and analyzed the
leadership skills and competencies needed to lead peers effectively. This study intended
to provide people who teach and develop student leaders a more defined set of peer
leadership skills and competencies to enhance leadership programs.
Definitions
Defining team, emergent, and peer leadership reduces confusion when discussing
the relationship among these leadership approaches. A discussion regarding the
relationship that exists among team, emergent, and peer leadership occurs later in this
chapter. Understanding the relationship and definitions of team, emergent, and peer
leadership provides a starting point for readers to understand the focus of the present
study hypotheses.
Curtin (2004) defined emergent leaders as ―a person who emerges and maintains a
position of leadership within a group‖ (p. 75). Hollander (1961) stressed that emergent
leaders were innovators, setting themselves apart from others in the group while adhering
to the group‘s norms. Emergent leaders can surface in various contexts including those
that have legitimate leaders appointed to those scenarios where no defined leader exists.
Many aspects of emergent leadership exist in peer leadership.

3
Morgenson, DeRue, and Karam (2009) defined team leadership as a process that
satisfies critical team needs and increases team performance. Bass (1990) defined team
leadership as influencing the attitudes and behaviors of individuals and the interaction
between and within groups to achieve goals. Johnson and Johnson (1994) defined team
leadership as a group of people aware that they have a, "positive interdependence as they
strive to achieve mutual goals, interact while they do so, are aware of who is and is not a
member of the team, and have specific roles or functions to perform" (p. 503). The three
team leadership definitions lack aspects of formal or legitimate authority and, like Rost‘s
(1991) definition, emphasize shared leadership responsibilities.
Ender and Winston (1984) definition of peer leadership emphasized students
helping other students to accomplish goals or solve problems. Adelman defined peer
leadership as "the process by which group members engage with one another so that the
group of peers comes together to operate and make decisions and accomplish their goals‖
(p. 7). Adelman‘s definition focuses on process, is vague, and does not provide insight to
possible leader skills or competencies needed by students to gain influence over other
students in order to make decisions and accomplish goals.
The present study required a more detailed description of the term peer leadership
while incorporating the key aspects of leadership skills and competencies. A peer is
defined as "a person or thing of the same rank, value, quality, ability, etc." (Webster,
1997, p. 996). Leadership has many definitions and authors usually define leadership
according to the context of their discussion or analysis. Northouse (2010) defined
leadership as "a process whereby an individual influences a group of individuals to
achieve a common goal" (p. 3). The U.S. Army (2006) defined leadership as "the process
4
of influencing people by providing purpose, direction, and motivation while operating to
accomplish the mission and improving the organization" (p. 1-2). Rost (1991) examined
587 publications spanning a 90-year period for definitions of leadership focused on a
leadership definition for the 21st century. Rost defined leadership as ―…an influence
relationship among leaders and followers who intend real change that reflects their
common purposes‖ (p. 102). Northouse, Rost, and the U.S. Army, as with most authors,
include influence as a central theme in their definition of leadership.
The present study combined the definitions of peer and leadership to define peer
leadership as influence over another person of equal status and abilities. In this definition
of peer leadership equal status encompasses background, age, and social status while
abilities include qualifications. Hare and O‘Neill (2000) also define peer leadership by
defining peer groups as ―…consisting of members who are essentially similar in skills
and abilities and /or social status and power‖ (p. 24).
Conger and Ready (2004) define leader competencies as a set of behavioral
dimensions. McClelland (1973) defined competencies as outcomes-relevant measures of
knowledge, skills, abilities, and traits and/or motives. Hollenbeck, McCall, & Silzer
(2006) defined leader competencies as the traits, abilities, and behaviors of a leader.
Dubois, Karoly, & Doubs (1994) provide examples of leader competencies that include
interpersonal skills, collaboration and teamwork, problem solving and decision making,
ethics, self-direction and motivation. Leader competencies include an overarching
construct comprised of individual skills. Skills are present in most discussions of leader
competencies and addressed as an aspect that contributes to competencies.

5
Mumford, Zaccaro, Connnelly, and Marks (2000) define leadership skills as an
interaction between traits and experience. Katz (1955) argued that traits define leader
characteristics whereas skills represent what leaders can accomplish. In further research,
Mumford, Campion, and Morgenson (2007), define leadership skills as capabilities that
one can develop. Leadership skills literature illustrates the wide array of specific actions
leaders can develop to lead given a specific context or situation.
The definition similarities between leader skills and leader competencies suggest
that competencies exist at a macro level compared to skills. Kouzes and Posner (2007)
illustrate the competency and skill hierarchal structure in their model of effective leader
practices. Their research identified five practices, or competencies, for effective leaders.
Each leader practice consists of several leaders skills.
This study assumes a definition of leader skills as specific actions that leaders take
to effect leadership. Leader competencies consist of a group of related specific leader
skills. A review of the relationship among peer, emergent, and team leadership illustrate
the distinct nature of peer leadership as analyzed by this study.
Relationship Among Peer, Emergent, and Team Leadership
Emergent and team leadership appear similar in that they both exist within groups.
Peer leadership, although containing many elements of both emergent and team
leadership, differs from team and emergent leadership in that peer leadership functions on
an individual level.
Peer leadership relates to both team and emergent leadership. All three forms of
leadership focus on leaders who do not have legitimate or formal authority. Emergent
leadership may occur in a context where a leader was appointed or elected, but fails to

6
win the group‘s confidence. In such instances, a leader emerges who has certain skills
and competencies that promote group norms while perceived by the group as one that can
advance the group to accomplish established goals. Team leadership promotes ideals
similar to emergent leadership and operates most effectively by utilizing the leader with
the best skills and competences needed for the given context and goal accomplishment.
Peer leadership exists in both instances of team and emergent leadership as leaders earn
confidence and trust with others. However, with team and emergent leadership the leader
influences the entire group. The group may consist of equals and those of greater
abilities, skills, or maturity. Peer leadership focuses on one or several member of the
group of equal status and abilities.
Figure 1 provides a model illustrating the relationship among peer, emergent, and
team leadership. I developed this model to assist readers in better understanding peer
leadership. In my review of literature, I found peer leadership often discussed when
studying team and emergent leadership. Defining peer leadership without providing
readers an understanding of the relationship peer leadership has to team and emergent
leadership can confuse readers regarding the intent of this study.
The three primary circles defined by the number 1, 2 and 3 represent team,
emergent, and peer leadership respectively. The intersecting areas of the primary circles
in Figure 1 illustrate a generic relationship between team, peer, and emergent leadership.
The size of the intersecting areas varies depending on the context and leadership
situation. Situations may also exist that exclude one of the three types of leadership
eliminating one of the primary circles.

7
Figure 1. Relationship Among Team, Emergent, and Peer Leadership
The most complex and difficult areas to define and understand are those intersection
areas defined by the numbers 4, 5, 6, and 7. Circle 3 defines peer leadership where all
leaders within this group are of equal status and abilities. Circles 1 and 2 represent team
and emergent leadership where all leaders have varying status and abilities. The areas
defined by numbers 5, 6, and 7 represent the similarities among peer, emergent, and team
leadership where leaders have gained the confidence and trust of the members within a
team or group of equal status and abilities. Area 4 represents leaders who potentially have
varying abilities and who emerge from the team or group to actively pursue a leadership
role for altruistic motives. The difference between those leaders in area 4 and those
leaders in area 1 or 2 is intent; those in area 4 actively seek leadership roles whereas
those in 1 or 2 fulfill leadership roles as needed by the team or as opportunities occur.
Area 6 represents leaders of equal status and abilities in team leadership positions. Area 7
represents leaders that emerge from that portion of a group that have equal leadership
skills and status. Area 5, the intersection of all three forms of leadership, represents
leaders of equal status and ability who are viewed by others as having skills and

8
competencies more desirable than other leaders, regardless of the context. Although equal
in ability and status, leaders in area 5 may have charismatic qualities.
This study analyzes the area represented by that portion of circle 3 minus the
intersections of team and emergent leadership. Circle 3 (Peer Leadership) minus the
intersections of team and emergent leadership represents leaders of equal status and
ability regardless of the context or situation.
Hypothesis and Methodology
The focus of this study was to analyze the leader competencies and skills needed for
effective peer leadership. From this focus, two hypotheses emerged:
H1 No specific leadership competencies exist that enhance peer leadership.
H2 No specific leadership skills exist that enhance peer leadership.
Leadership in various situations and contexts require different leadership skills and
competencies. Most leadership education and development programs focus on providing
participants a wide range of leadership skills and competencies to accommodate a
multitude of leadership challenges. A limited focus exists on the development of specific
leadership skills and competencies needed to lead peers effectively.
The methodology for this study incorporated data analysis from an external data
base that provided convergent validity for a literature review. The leadership
competencies and skills identified from the data base analysis and the literature review
provided the constructs needed to develop a survey instrument that allowed data
gathering from undergraduate students at a medium sized, public university located in the
upper south-central region of the United States.

9
The survey instrument developed consisted of 40 questions, 8 questions for each
competency identified by the literature review and data base analysis. Peer leadership
skills consist of specific behaviors or actions and emerge after defining peer leadership
competencies. The 40 survey questions represented peer leadership skills. Competency
retranslation and pilot tests of the survey instrument provided a final survey that had
acceptable psychometric measures as discussed in Chapter III.
A literature review in Chapter II identified 15 peer leadership competencies. Four
competencies were cited most frequently as important: (a) communication; (b) support;
(c) mental/hard work ethic; and (d) reflection/feedback. A data analysis of leadership
assessments conducted on U.S. Army Reserve Training Officer Corps (ROTC) cadets
provided convergent validity to the literature review and defined another possible peer
leadership competency.
ROTC Leader Assessment Process and Definitions
During the summer between the junior and senior years of undergraduate studies at
four-year universities, with few exceptions, U.S. Army ROTC cadets attend a leadership
assessment and development course held at Fort Lewis, located approximately 50 miles
south of Seattle, Washington. The name of this leadership assessment and development
course changed over the time period of this study, initially known as National Advanced
Camp from 1997 to 2002; National Advanced Leadership Camp from 2002 to 2004; and
as the Leader Development Assessment Course (LDAC) from 2004 to 2009. This study
refers to the course from 1999 to 2009 as LDAC. This study analyzed leadership
assessment data collected during each summer from 1999 to 2009. A small minority of
graduate students, Junior Military College cadets, and nursing cadets also attended the

10
course each year. Regardless of a cadet's status, each cadet studied and trained to the
same standards for the leadership assessments while on campus prior to attending LDAC.
The consistent level of leadership development preparation provided for a homogeneous
sample set.
Cadet assessments occurred over approximately 30 days of training and observation
that included evaluations of leadership and other military-specific tasks including
physical fitness, land navigation, marksmanship, and other technical tasks. The
assessments ensured that ROTC cadets had achieved the requisite development level in
assessed tasks and leadership competencies needed to function successfully as an officer
in the U.S. Army. Cadets earn their commission in the U.S. Army after completing
requirements for an undergraduate degree and successfully completing LDAC.
Each cadet received leadership assessments based on 16 leader competencies that
the Army termed leadership dimensions (see Table 1). The leader skills associated with
each of the 16 leadership competencies/dimensions consisted of specific behaviors or
actions that defined the competency/dimension. The Army assessment system does not
provide a list of specific behaviors or actions defining the leader skills, but provides a
narrative illustrated in Table 1 as the description. Army assessors at LDAC receive
extensive assessor training and calibration that further defines leader skills from the
descriptors for each competency/dimension.

11
Table 1
U.S. Army Leadership Dimensions and Descriptions
Dimension Description
Mental (ME) Possesses drive, will, initiative, and discipline
Physical (PH) Maintains appropriate level of physical fitness and military
bearing
Emotional (EM) Displays self-control; calm under pressure
Conceptual (CN) Demonstrates sound judgment, critical/creative thinking,
moral reasoning
Interpersonal (IP) Shows skill with people: coaching, teaching, counseling,
motivating, and empowering
Technical (TE) Possesses the necessary expertise to accomplish all tasks
and functions
Tactical (TA) Demonstrates proficiency in required professional
knowledge, judgment and war-fighting
Communicating (CO) Displays good oral, written, and listening skills for
individual and groups
Decision Making (DM) Employs sound judgment, logical reasoning, and uses
resources wisely
Motivating (MO) Inspires, motivates, and guides others toward mission
accomplishment
Planning (PL) Develops detailed, executable plans that are feasible,
acceptable, and suitable
Executing (EX) Shows tactical proficiency, meets mission standards, and
takes care of people/resources
Assessing (AS) Uses after-action and evaluation tools to facilitate
consistent improvement
Developing (DE) Invests adequate time and effort to develop individual
subordinates as leaders
Building (BD) Spends time and resources improving teams, groups, and
units; fosters ethical climate
Learning (LR) Seeks self-improvement and organizational growth;
envisioning, adapting, and leading
The U.S. Army leadership dimensions corresponded with the approved doctrine found in
FM 22-100 (1999), Army Leadership, Be, Know, Do, and FM 6-22 (2006), Army
Leadership, Competent, Confident, and Agile. The 16 leadership dimensions emerged

12
from research and development by various agencies within the U.S. Army prior to the
release of FM 22-100 in 1999. The Army used the same 16 leadership dimensions in
their leadership development model during the time frame of this ROTC data analysis.
The assessors conducting leadership evaluations were cadre (Army instructors)
from ROTC programs located at universities across the United States and territories.
Leadership assessor consisted of commissioned or non-commissioned officer in the U.S.
Army. Most assessors conducted leadership assessments on their campus during the
school year prior to assessing at LDAC using an identical system. Before conducting
leadership assessments at LDAC, each assessor attended a five-day training and
calibration course provided by LDAC cadre.
The leadership assessment training and calibration course consisted of in-depth
explanations of the sixteen leader dimensions, discussions regarding the assessment scale,
and multiple calibration exercises. The calibration exercises consisted of viewing video-
taped leader scenarios from popular movies (Remember the Titans, Glory, etc.) then
writing leadership assessments of the assigned leader. Comparisons of assessments to
approved assessment ratings provided calibration needed to ensure assessors understood
the differences between leadership dimensions and ratings. LDAC used a nominal rating
scale of N, S, E to assess leader dimensions; N represented Needs Improvement, S
represented Satisfactory, and E represented a rating of Exceeded Standards.
Each cadet participating in LDAC received at least six evaluations of the 16 leader
dimensions. Cadets participated in leadership scenarios that consisted of multiple
contexts ranging in duration from 4 to 24 hours. Assessors documented only the
dimensions observed during each leadership scenario. Varying leadership scenarios

13
provided assessors opportunities to observe all 16 dimensions over the course of the
minimum six evaluations. Immediately following each leadership scenario, assessors and
cadets discussed the leadership scenario and assessment ratings the cadet earned during a
debriefing and cadet reflection session that promoted two-way communication. After
participating in the six (or more) evaluations, an average of the 16 dimensions for each
cadet provided a final rating for each leader dimension.
An overall leader rating resulted from the final 16 leader dimension ratings. Cadets
receiving at least one rating of Needs Improvement received an overall rating of Needs
Improvement. Cadets receiving eight or more ratings of Exceeds Standards received an
overall rating of Exceeds Standards. Cadets not receiving a Needs Improvement or less
than eight Exceeds Standards received a Meets Standards overall rating. Cadets receiving
an overall rating of Needs Improvement in any of the 16 leader dimensions were
considered deficient in leader development and subject to retraining and repeating LDAC
as the Army required all cadets to earn an overall rating of Meets Standards in leadership
assessments to complete LDAC successfully.
Common Leader Dimensions and Literature Review
The leader dimensions of Executing (EX), Physical (PH), Mental (ME), and
Communicating (CO) consistently emerged as important leader dimensions in descriptive
statistics and reliability with deleted items analysis discussed in Chapter IV. The
consistent importance of the four leader dimensions provided insight to important leader
skills and competencies identified in the literature review.
The leader competencies/dimensions identified by the literature review and ROTC
data analysis include communication (identified by both literature review and ROTC

14
analysis), support (literature review) and executing (ROTC), hard work/ethic (literature
review) and mental (ROTC). Reflection/feedback was the third most cited competency
during the literature review, but does not have a specific ROTC data counterpart. The
leader dimension of physical (ROTC) does not correlate to any of the most cited leader
competency identified by the literature review, but does relate indirectly to several
tangential discussions in the literature. A discussion further clarifies the relationship
between the literature review competencies and ROTC dimensions.
The communication competency was identified by both the ROTC data analysis and
literature review. Communication, as described in the literature review and by the Army,
encompasses verbal, non-verbal, written, and listening skills. The leader competency of
support in the literature review includes the skills a leader has or develops to provide
better positive sustainment to peers. The positive sustainment depends on the needs of the
person influenced and capabilities of the leader. In most instances, positive sustainment
consists of social encouragement, logistical needs, technical skills lacking in the
influenced person, and advice in difficult situations. The ROTC leader dimension of
executing has similarities to the literature review competency of support as the ROTC
leader provides tactical and technical skills to support other cadets in the LDAC
environment. Additionally, the ROTC dimension of executing provides advice or social
encouragement to other cadets similar to the literature review competency of support as
both focus on accomplishing tasks and assisting others with their aspirations.
The ROTC mental leader dimension relates to the literature review hard work/ethic
competency as both focus on persistence and an internal drive to accomplish goals while
maintaining initiative and discipline. The ROTC mental dimension does center more on
15
self-discipline than the literature review hard work/ethic competency, but both have a
sense of controlled accomplishment and a focus on persistence. Additionally, both have a
consistent theme of determination to accomplish goals.
Although the ROTC leader dimension of physical does not correlate directly to
competencies identified by the literature review, the importance of the ROTC physical
leader dimension identified during the ROTC data base analysis was both intriguing and
worthy of investigation. The physical leader dimension, as defined by the Army (1999),
focuses on health and mental fitness as well as professional bearing. A cadet physically
fit and presenting himself/herself to their peers in a professional and confident manner
tend to command more respect and influence then cadets who appear disheveled and
uncertain. The physical presence of a cadet was an additional factor that could influence
other cadets providing a sense of security and comfort. Although not supported by the
literature review, I decided to include the ROTC physical dimension as part of this study.
The competency of reflection/feedback identified during the literature review does
not have a counterpart ROTC leader dimension, but is a critical aspect of the ROTC
leadership assessment process. Immediately after each ROTC leadership assessment,
assessors meet individually with each cadet assessed and assist the cadet to reflect on the
completed leadership assessment while providing feedback. Prior to the
reflection/feedback session, the assessed cadet reflects on the assessment and records
perceived strengths and weaknesses. The written comments on strengths and weaknesses
provide additional, critical feedback to both the cadet and assessor. Although this process
is not an identified leader dimension in the ROTC assessment, reflection and feedback

16
occur throughout the leadership assessment process and the third most cited leadership
competency identified in the literature review.
The following definitions provided clarity for developing the survey instrument
used to gather data regarding peer leadership skills and competencies: (a)
communication: the written, verbal, nonverbal, and listen skills needed to convey
information from one person to another person; (b) support/executing: a person who,
through his/her actions, provides positive sustainment for another person‘s social, mental,
and physical needs and desires; (c) mental/hard work ethic: persistence and drive to
accomplish goals while maintaining initiative and discipline; (d) physical: a person‘s
level of physical fitness, conditioning, and appearance; the ability to instill confidence in
others through his/her presence; and (e) reflection/feedback: careful consideration,
analysis, and meditation of recent events; information provided by a person on another
person‘s recent actions.
An influence survey developed by this author consisting of 40 questions provided a
means to focus on the importance of the peer leadership competencies and skills
identified by the literature review and corresponding ROTC leader dimensions. Proposed
survey questions provided an initial measure of peer leadership competencies and skills.
A retranslation of competencies to questions, pre-pilot, and pilot tests enhanced validity
and reliability of the influence survey and refined student understanding of survey
questions. 1084 undergraduate students at a south-central comprehensive university
provided responses to the influence survey. Student responses to the influence survey
allowed quantitative analyses of peer leadership competencies and skills.
17
Assumptions
I made several assumptions while conducting this study to facilitate data collection
and data analysis. First, I assumed that participants provided honest, accurate ratings of
survey questions, without which the validity of the influence survey remains suspect and
might provide inaccurate data contributing to misleading conclusions. A large sample
mitigates the possibility of inaccurate ratings and enhances the validity of the influence
survey.
The second assumption I made focused on participants clearly understooding the
survey scenario and the survey questions. This study required a specific scenario and two
unique stem questions for the influence survey to collect data needed for analysis. The
stem questions on the influence survey coincided with the survey scenario and allowed
participants to answer the survey questions. The retranslation, pre-pilot, and pilot tests of
the influence survey provided feedback on the survey validity and provided increased
confidence that participants clearly understood the construct of the survey. The questions
measuring the competencies were assumed accurate based on competency definitions.
The construct of questions constituting the influence survey had to accurately
represent the assessed peer leadership competencies. The retranslation process, pre-pilot,
and pilot processes increased question accuracy, but the lack of any pre-existing, valid
and reliable influence survey to compare the new survey created assumptions regarding
the validity of the newly constructed influence survey.
I assumed that the ROTC data collection occurred consistently and accurately over
the 11 year period that the Army collected the leadership data. The ROTC data involved a
complex and thorough data collection process. Any large, complex, longitudinal data
18
gathering process might create biases and inaccuracies. Assessors received assessment
training and calibration each year from different ROTC instructors providing for possible
bias in the assessor training and calibration. Factors that tended to mitigate the potential
bias and inaccuracies of the ROTC data collection included the extremely large number
of assessments, the consistent replication of the training and calibration for assessors over
the study period, and a consistent theoretical leadership assessment construct over the
study period.
Limitations and Delimitations
The limitations of this study pertain primarily to the participants and influence
survey. The participants consisted of undergraduate students from a regional public
university that has a significant part-time population (20.52 percent). The varied life-
experiences students have might impact perceptions and reflect a possible bias not found
in a more traditional student population.
The maturity level of the participating students varied as ages ranged from 17 to 62
(995 of 1050 were under the age of 30). Varying ages might provide different levels of
maturity impossible to account for creating potential survey question response bias from
varying maturity levels that could influence data analysis. Although a limitation, the
focus of this study required an aggregate sample of undergraduate students designed to
allow analyses of peer-leadership competencies and skills across maturity levels.
The majority of students participating in the influence survey originated from the
same geographic region of the United States. The university where this study gathered
data focuses on recruiting a diverse student population, however, 82 percent of the
student population originated within the home state of the university. Potential influences

19
from the culture of the study university geographic region could bias the influence survey
data and findings of this study.
Various survey participant characteristics including academic disciplines, race,
family environment, and ethnic groups could provide additional bias in the collected data.
Participants included a large number of academic disciplines, race, and ethnic group
populations to ensure a representative sample of the undergraduate student population at
the study university. The data gathered represented a cross-section of undergraduate
students rather than stratified sampling that collects within specific parameters to mitigate
bias. The limited number of survey responses from students representing specific
academic disciplines, the wide variety of family environments, and limited number of
ethnic groups represented in the data could prohibit quantitative analyses. However, the
potential bias any specific group of participants may provide based on academic
discipline, race, family environment, or ethnicity, remains unknown.
The ROTC database, although diverse, consists of like minded cadets. Most cadets
assessed at LDAC had a bias created by the common factor of selfless public service
resulting from his/her desire to pursue an initial career in the U.S. Army. The ROTC data
gathered by assessors occurred in various contexts, but most assessed cadets did possess
the selfless public service bias.
The influence survey is new and untested which may create a potential limitation.
Although psychometric measures were used to ensure accuracy, no comparable influence
survey exists. Lack of a benchmark survey offers an increased risk of biased results or
inaccurate findings that might lead to faulty conclusions during analysis. An existing
influence survey focused on the same or similar peer leadership competencies would

20
provide additional convergent validity and reliability of the influence survey developed
for this study.
Delimitations for this study include the influence survey scenario and applicability
to populations other than undergraduate students. The influence survey scenario
developed focused on undergraduate students who have had adequate life experiences in
high school or in higher education. The survey did not focus on professional contexts or
populations consisting of mainly non-traditional students. A new scenario that more
strongly relates to professional people or students with extensive life experiences outside
higher education might provide accurate results. In such instances, a review of questions
and psychometric analysis of pilot studies would provide needed verification of accuracy.
Including other populations of students or other professional people might allow the
generalization of this study. The influence survey and methodology of this study could
provide information for early leadership development programs or specific, targeted
leadership programs in professional settings. Developing the ability to influence peers is
an important component in various leadership development contexts and participant
populations; data from an adapted study based on this study would provide insights
needed to further refine and focus curricula for effective leadership development.
Significance of this Study
This study focused on providing curricular and pedagogic enhancements to
undergraduate leadership education and development programs. Peer leadership is an
area of leadership often overlooked or assumed within the context of other leadership
conversations. As such, educators and authors have not seriously considered it as a
separate leadership focus and have not taken advantage of the tremendous leadership
21
laboratory available to students while attending institutions of higher learning. Students
who interact with other students of relative equal status and abilities often encounter the
leadership challenge of gaining influence with them to accomplish a task or achieve a
goal. However, the literature is void in defining the leadership competencies and skills
needed for effective peer leadership education and development. Peer leadership skills
and competencies also provide for both formative and summative program evaluations.
Most leadership programs on campuses consist of many quality aspects that focus
on preparing students for leadership challenges that await them upon graduation.
Leadership program development usually occurs by adopting or modifying a pedagogic
model from other institutions or programs that closely mirrors the intended learning
objectives at their university. Most appear similar yet measuring the outcomes and
effectiveness is vague and in most instances, not achieved effectively. The campus
environment provides a means for students to experiment and experience peer leadership
competencies, to apply what was learned in the classroom then learn from mistakes on
campus without impacting potential career possibilities better preparing students for
professional leadership challenges.
Peer leadership possibly provides the most demanding and difficult leadership
challenge as a person attempts to gain influence over other people without formal or other
sources of authority or power. Peer leadership, similar to other forms of leadership,
requires leaders to establish effective relationships and to develop a sense of personal
commitment within the people they choose to influence towards a common purpose.
Leaders who understand how to develop a sense of commitment within people that have
equal status and ability that they want to lead can use the same process to gain influence
22
and to develop a sense of commitment from larger groups. Most undergraduate
leadership curriculums do not fully utilize on-campus experiences to develop
undergraduate leaders in leadership, especially peer leadership. This study provides
insight to effective peer leadership competencies and skills that may assist leadership
educators and curriculum developers in providing more effective peer leadership
pedagogy.
Where Chapter I provided the framework for this study, Chapter II reviews the
literature that has contributed to the study of peer leadership. Chapter III defines the
methodology used to determine better specific peer leadership competencies and skills.
Chapter IV describes the results of this study while Chapter V presents the data analyses
and conclusions.
23
CHAPTER TWO: LITERATURE REVIEW
A significant leadership challenge is leading one‘s peers. Peers are influential on
campus and contribute to leader development in many situations and contexts. Brown
(1972) stated:
One of the most potent environmental influences on student development in
college is the peer group. While the faculty may play some role in the development
of intellectual attitudes and perhaps in vocational choice, the dominant and single
most important force remains the peer group. (p. 31)
An important aspect of student development includes developing leadership. Most
leadership programs evolve from curriculum focused on leading in a divergent range of
contexts to equip students better for leadership challenges while on campus, and more
importantly, beyond the campus. Leading one‘s peers creates a significant challenge as
both leader and follower have equal status and abilities and the leader is not in a position
of formal or legitimate power. Without formal or legitimate power, peer leaders must rely
on other skills and competencies to earn credibility and gain the ability to influence those
whom they desire to lead.
Adelman (2002) defined peer leadership as, ―…the process by which group
members engage with one another so that the group of peers comes together to operate
and make decisions and accomplish their goals‖ ( p. 7). However, limited research
addresses the leadership skills and competencies needed for effective peer leadership.
Loughhead and Hardy (2005) described peer leadership as a relatively neglected topic of
inquiry. Komives, Mainella, Owen, Osteen, and Longerbeam (2006), found support and
mentoring as factors that impact peer leadership. Specific definitions of peer leadership,
24
in terms or skills and competencies, have not served as a focus of past or current research.
To direct more attention to peer leadership skills and competencies, two hypotheses
emerged:
H1 No specific leadership competencies exist that enhance peer leadership.
H2 No specific leadership skills exist that enhance peer leadership.
A significant leadership challenge occurs when attempting to lead without a basis of
social power. French and Ravens (1959) cited five bases of social power including
referent power, expert power, legitimate power, reward power, and coercive power.
Many contexts in higher education provide students with formal roles within an
organization allowing students the ability to use a form of social power to influence and
lead. However, students in formal leadership roles still must influence and lead their
peers regardless of the hierarchal or systematic structure of the organization. A review of
literature provides insight into peer leadership and associated leadership skills and
competencies.
Framework of Literature Review
I examined three major areas in the leadership literature to provide a comprehensive
theoretical understanding of peer leadership. Social Learning Theory provided the
overarching construct to understand the impact of peers on student development and
student learning. Social Learning Theory also provided insight to student leadership and
leader development. A review of leadership development literature focused on emergent,
team, and peer leadership theories and models. Much research describes emergent and
team leadership, but limited literature exists regarding peer leadership. These three
theories of leadership provide a bridge between Social Learning Theory and the specific

25
leadership focus of this study. A review of these theories and models also provides a
more defined focus on leadership from the Social Learning Theory. Literature on leader
development provides potential leadership skills and competencies for analysis.
Examining known leader skills and competencies from an examination of these
leadership theories and models provides multiple leader skills and competencies for
possible inclusion in this study.
Social Learning Theory
Many researchers (e.g. House (1996), McClelland (1973), Bass (1990)) have
studied human behavior and believed that motivation forms the principle force behind
displayed behaviors. Motivation came from within an individual and explained their
actions. Other researchers (Marmor (1962), Bandura (1977), Avolio and Luthans (2006))
have reviewed these theories both conceptually and empirically and offered other views.
Marmor (1962) stated that each psychodynamic approach appears to have its own
preferred set of inner causes and its own particular brand of insight. One central criticism
has been the tremendous variations in frequency and strength of behaviors in given
situations. Bandura (1977) conducted research on the impact of the environment on
behaviors, specifically, how one learns in a social context. According to Bandura,
behavior, personal factors and environmental factors all mutually influence each other in
the social learning process. Specifically, people are not driven by inner forces, but by a
reciprocal interaction of personal and environmental determinants.
Bandura (1977, 1986) championed Social Learning Theory. Social Learning Theory
focuses on learning primarily through observation. Behaviorists advocate that a person
learns by trial and error; that one must participate in experiential learning. Bandura
26
logically concluded that one could not live long enough using a trial and error method of
learning to shape his or her‘s behaviors. A child does not learn what he/she does during
the first two years of life through trial and effort (Svinicki, 2004). Learning and
developing behaviors by observing others allows a person to develop behaviors more
quickly that, in turn, provides more opportunities to change and develop new behaviors.
Although Bandura (1977) advocated observational learning, he also agrees that
experiential learning develops behaviors through the consequences of practicing the
observed behaviors.
Bandura (1977) based his Social Learning Theory on three broad phases: (a)
attention, (b) retention, and (c) learning. In the attention phase, the learner becomes
aware of the critical behaviors needed to complete the action and develops a mental
model of the behaviors. Models that create lasting impressions on learners assist the
second phase of retention. After creating a model and storing it mentally, the learner
begins the learning stage and engages in generating behaviors from the stored model.
Bandura noted that motivation was a common theme throughout the social learning
process and needed to complete any phase successfully.
People are not born with a collection of pre-established behaviors but learn them
from either direct participation or observation. Bandura (1977) acknowledges the
influence of biological factors but subjugates them to experiential learning in a social
context. Modeling appropriate behavior contributes to the ability of one to learn from his
environment and social context. People learn from modeling the information they receive
by observing behaviors of other people. Without such observations and modeling,
learning in social context would prove ineffective. Retention of modeled behavior

27
information takes place primarily through symbols representing the modeled behavior.
Rehearsals and reinforcement also assist in behavior retention as a person mentally
rehearses and received positive feedback for the modeled behavior. Once retained, one
must then recall behaviors converting the symbols into appropriate actions. Feedback and
repetitive processes refine actions that lead to desired behaviors obtained from the social
learning processes. Regardless of the medium, words, pictures, or actions, the modeling
process remains relatively constant in spite of the variations of the various mediums.
Social learning theory views moral judgments as a result of social decisions based
on many factors that justify the person‘s actions. The person involved, the act, and the
long-term ramifications all contribute to a social learning theory perspective of moral
actions. Adaptive behavior results from a self-reflective analysis of actions and from
feedback obtained from external sources. Adaptive behavior can result from moral action
feedback. Associated with moral judgments are actions that people take in response to
environmental stimuli. Bandura stated that humans do not just respond to stimuli, but
interpret stimuli and then act accordingly producing behaviors that, over time, become
predictable.
Bandura (1977) found four sources of personal efficacy: (a) performance
accomplishments, (b) vicarious experiences, (c) verbal persuasion, and (d) emotional
arousal. Personal efficacy impacts social learning that, in turn, can influence peer
leadership as people are attracted to and from loyalties to behaviors that they desire. Of
these four personal efficacies, performance accomplishments and verbal persuasion could
qualify as effective peer leader skills or competencies. Positive performance
accomplishments illustrate success that might enhance the perception of others and create

28
a means to influence peers. As noted earlier, modeling behavior impacts the perception of
others, similar to positive performance as others desire to emulate accomplishment
behaviors. Verbal persuasion reinforces previous studies that highlight the importance of
effective communication skills in regards to leader effectiveness. Bandura stressed the
importance of correct speech as an integral component of social learning and a means to
gain influence. The key aspect of correct speech is communicating correctly given the
context and environment.
Social contracting provides a powerful relationship skill that assists or hinders one‘s
ability to influence others and affect quality leadership. Rewards and punishments are
bases of social power as defined by French and Raven‘s (1959) earlier research. Positive
incentives early in the development phase of any relationship enhance the probability of
developing a positive, beneficial relationship. Leaders who intent to influence their peers
with rewards, positive encouragement, and modeling desirable behaviors can enhance the
early development of a social contract with these positive incentives. Intrinsic motivation
provides influential development of effective social contracts; however, internal
motivation can prove challenging to develop and inherently difficult to evaluate.
Likewise, personal change is also difficult to achieve without self-administered, tangible
reinforcements; concepts equally difficult to assess.
Verification of behaviors is essential to effective development of peer leadership
skills and competencies. Bandura (1977) discussed four ways to verify effective
behaviors. First, direct experimentation provides for instantaneous feedback that
reinforces effective behavior. Second, vicarious experiences allow one to observe
behaviors and their resulting effect. Third, comparing one‘s judgment with the judgment
29
of others allows feedback to occur without directly involving oneself. Last, logical
deduction allows one to evaluate cognitively if behaviors were effective. Critical to
effective verification is correctly assessing the feedback verification provides.
Verification is a naturally occurring phenomenon that, if leveraged properly, allows peers
to understand better effective skills and competencies given the context, environment,
and desired outcome.
Very similar to the Social Learning Theory is Authentic Leadership as proposed by
Avolio and Luthens (2006). Positive and negative moments in life can profoundly shape
leadership development if individuals understand how to maximize these moments and
move their future leadership to the present. Key life moments provide the best vehicle
for individual leadership development focused on the goal of Authentic Leadership. By
observing, reflecting, then acting on the key life moments, leader development advances
effectively and efficiently. The authors contend that measuring the effectiveness of most
leadership development programs is difficult.
Researchers have expanded Bandura‘s (1977) Social Learning Theory to include
components necessary to create a Cognitive Apprenticeship Model (CAM) focused on
developing thinking skills (Svinicki, 2004). CAM differs from the Social Learning
Theory as CAM focuses more on cognitive theoretical processes assisting the learner in
developing clear mental images of effective behaviors. Like authentic leadership (Avolio
& Luthens, 2006), CAM is most effective while leveraging life‘s moments for reflection,
building a mental map of the concept, then applying that concept experientially for
deeper meaning and development.

30
Sims and Manz (1982) conducted a literature review focused on the impact and
effectiveness of leadership modeling. Sims and Manz focused on Bandura‘s (1977)
Social Learning Theory to highlight leadership modeling as an important source of
learning new behaviors and successful behavioral change in organizations. Leadership
modeling occurs as followers attempt to emulate the behaviors of a leader within the
organization. This is very similar to referent power, one of the five Bases of Social Power
defined by French and Raven (1959). Modeling occurs frequently as followers constantly
learn from role models in their organization; this makes modeling an important aspect of
leader influence and potential leader development. Luchin and Luchins (1966) provided
an example of modeling with college students required to complete a technical task.
When provided only positive feedback, the students committed over 1000 errors while
attempting to complete the technical task. When provided a model that demonstrated the
task, errors decreased dramatically. Providing behavioral cues also reinforces behaviors.
As an example, if a manage praises one worker for good customer service while another
watches, the cue provided is likely to produce the same positive customer service
behavior in the observing worker.
Sims and Manz (1982) reviewed previous research that focused on training that
included modeling. Previous research reviewed by Sims and Manz indicated that
modeling increased efficiency and productivity when compared to control groups that did
not receive model-focused training. Modeling also proved very effective in reinforcing
behavior when leaders and trainers provided public rewards where other subordinates
could observe the consequences of desired behavior.

31
Positive role modeling as described by Sims and Manz (1982) closely relates to
Kouzes and Posner‘s (2007) leader practices of Model the Way and Encourage the Heart.
Both focus on leader behaviors and the importance of providing positive behaviors for
followers to observe and consider incorporating into their leadership. Although this
review focused on the effects that modeling has on training, Sims and Manz linked
modeling to effective leader behaviors that increase a leader‘s ability to influence those
whom they choose to lead. Modeling may impact peer leadership as peers may place
greater importance on observed peer behavior than observed behavior from other leaders.
Astin‘s revision (1993) of Four Critical Years (1977) included new data provided
by the Higher Education Research Institute (HERI) at the University of California, Los
Angeles. Astin‘s original work examined how various types of institutions of higher
learning and different educational experiences impact students. HERI utilized data
obtained from the Cooperative Institutional Research Program (CIRP), a new source of
data [at that time] consisting of responses from incoming freshmen focused on possible
outcome measures, self-predictions about possible future outcomes, and personal
characteristics. CIRP obtained data obtained from a questionnaire mailed to students after
graduation and from cognitive measures from post secondary tests; Law School
Admission Test (LSAT), Medical College Admission Test (MCAT), Graduate Record
Examination (GRE), and National Teacher Examination (NTE).
Astin (1993) provides a conceptual framework model titled, Input-Environment-
Output Model. The model operates on the premise that students arrive on campus with
many characteristics—inputs. Many environmental factors impact students including
32
faculty, curriculum, where students live, extracurricular activities, athletics and peers.
The result of the environment on the initial input is described as the output
Behavioral scientists usually classify human behavior into cognitive and
noncognitive domains, described in Astin‘s (1993) model as outputs. Higher order mental
processes that use reasoning and logic relate to most student educational objectives. The
noncognitive outputs, also called affective outputs, focus on extracurricular related
aspects of a student‘s life. Peer influences generally fall into the affective domain.
Astin (1977), Feldman and Newcomb (1969), and Pascarella and Terenzini (1991)
concur that the majority of literature examining the impact of the college experience on
student development identifies the peer group as one of the most important influential
factors. A peer group, as defined by Astin, consists of individuals that a student identifies
and affiliates with whom the student seeks approval and acceptance. The degree to which
a peer group exerts influence on its members depends on the norms and expectation of
the peer group. At face value, it is understandable that peers have a profound influence
on other students. Although peers are acknowledged as having an important impact on
student development, little is know on specific ways that peers impact other students.
In summarizing the environmental effects on student outcomes, the author stated,
Perhaps the most compelling generalization from the myriad findings…is the
pervasive effect of the peer group on individual student‘s development--cognitive
and affective, psychological and behavioral--is affected in some way by peer
group characteristics, and usually by several peer characteristics. Generally,
students tend to change their values, behavior, and academic plans in the direction
of the dominant orientation of their peer group. (Astin, 1977, p. 363)
33
To reinforce the findings of this research effort, Astin also stated that, ―…the student‘s
peer group is the single most potent source of influence on growth and development
during the undergraduate years (p. 398).‖
In regards to leadership, Astin (1993) provided data from the CIRP that indicates
student leaders in high school who excelled in speech, debate, and studied with other
students were more likely to win athletic letters and hold elected offices. Leaders on
campus tended to favor military science, pre-law, religious studies, and communications
and followed their interests into careers in these specific fields upon graduation:
But by far the strongest effect is associated with student-student interaction:
students who interacted most frequently with peers show a net increase of +13.2
in the percentage qualifying as Leaders, whereas those who have the least degree
of interaction with peers show a net decrease of -3.6 percent. (Astin, 1993, p.123)
Maturity did not appear significant as the age of students entering college was not
significantly associated with changes in leadership scores.
Gellin (2003) conducted a meta-analysis of the literature pertaining to college and
university student involvement and critical thinking during the 1990s. Peer interaction
had a positive effect on student critical thinking and was the only effect consistent with
research conducted through 1990. Gellin‘s findings are consistent with Pascarella and
Terenzini‘s (1991) findings and further indicate the impact peers have on student
development through the free exchange of ideas and involvement in student clubs and
activities.
Terenzini, Pascarella, and Blimling (1996) conducted a review of empirical
literature examining the effects of student out-of-class experiences on academic,

34
intellectual, or cognitive learning outcomes. A student‘s academic and cognitive growth
is usually viewed as the responsibility of academicians while student affairs concentrate
on enhancing a student‘s affective growth. The authors define learning as any gain in
cognitive or academic ability. Out-of-class experiences refer to structured and
unstructured activities or conditions that are not directly part of an institution‘s formal
programs.
Terenzini et al. (1996) also found no statistical significant difference between
resident and commuter students during their literature review of residence and commuter
out-of-class experiences. Students participating in a living learning community produced
significant increases in the academic, intellectual, and cognitive growth due to suspected
increased peer and faculty participation. Student participation in Greek life generally
indicated a weak but negative influence on growth and learning. The most negative
influences were found in homogeneous and white fraternities and sororities. Fraternities
of color displayed a slightly positive influence while there was no analysis of sororities of
color. The results are somewhat expected as white, male students tend to fall into a
―group think‖ mentality while fraternities of color provide its members support and
increased self esteem. Terenzini et al.'s review indicates that peers impact students in
many extracurricular activities.
Intercollegiate athletics, from Terenzini et al.‘s (1996) review, generally showed a
negative effect on student learning and development, especially during the first year in
college. The student-athletes primarily affected participated in football and basketball.
When male football and basketball players are not factored into the analysis, there is no
significant impact of intercollegiate athletics, suggesting that negative effects on learning

35
and growth may be sport specific. Steps taken early are needed to mitigate the negative
effect, especially for football and basketball players. Peer influence on intercollegiate
athletics was not mentioned, but assumed present due to the amount of time students
spent together participating in athletics.
Employment had mixed results regarding cognitive and affective growth. Full-
time employment generally had a negative impact on grade-point average (Astin, 1993).
Part-time off-campus work had a positive influence on virtually all areas of self-reported
cognitive and affective growth. In both instances, the opportunity for peer interaction
and influence diminished and adults may have had a greater impact on student growth.
Other extracurricular activities encompassed a wide array of clubs and
organizations in most studies. Due to the wide variety of activities, most studies could not
establish close linkages between the activity and student cognitive and affective growth.
The literature does indicate that peers and adults do have at least an indirect effect on
students due to the contact and associations developed while participating in other
extracurricular activities.
―The evidence is generally clear, however, that when peer interactions involve
educational or intellectual activities or topics, the effects are almost always beneficial to
students‖ (Astin, 1977, p. 165). Peers have a positive impact on student learning and
growth, especially in conceptual content. Students generally benefited most from
contacts outside social or formal contexts. Social contexts and excessive time spent with
the same peer, usually in volunteer activities, adversely effected student development.
Diversity had a positive influence on student growth and socializing with students of
different cultures enhanced cognitive and affected growth. Overall, Astin determined the

36
whole out weighs the parts and with peers being the single most important influence on
most campuses.
Whitt, Edison, Pascarella, Nora, and Terenzini (1999) examined student peer
interactions, both curricular and extracurricular, while in and out of the classroom.
Approximately 3,000 students participated in a three-year longitudinal study that
encompassed both four-year and two-year colleges from various states. This study also
examined student cognitive outcomes during the first three years of college and was able
to examine peer interaction conditional effects based on sex or race. Cognitive measures
based on standardized tests defined the dependent variables with student responses to
peer interaction questions as independent variables. Results reinforce the role of peer
interactions as the single most important aspect of student development. Increased
student peer interactions improve cognitive growth, both in and out of the classroom.
Residence lacked a significant impact on cognitive growth from peer interactions as those
living on campus experienced similar cognitive growth as those that lived off campus.
―This study is one of many that, when added together, demonstrate strong positive effects
of peer interactions on college students‘ learning and development‖ (Whitt et al., p. 75).
Although evidence indicated the positive influence peers have on cognitive
learning, Whitt et al.‘s (1999) study could not provide details on how peer leadership
influenced cognitive learning; ―...we cannot provide detailed descriptions of the
interactions nor explain why we obtained these results‖ (Whitt et al., p. 74). Specific
skills and competencies noted included studying (peer interaction), talking--
communicating, teaching, and reflection. Reflection emerged as a key component of peer
interaction in regards to positive cognitive development. However, students are usually
37
not taught how to properly reflect on peer interactions or reflection in relationship to
leadership development.
Love (1995) examined the impact student affairs and other non-faculty
professionals have on student development. Much literature and research focuses on
faculty, curriculum and peers, but does not address student affairs professional (defined
here as all non-faculty professionals). Astin (1993) and Chickering (1969) have studied
the importance of learning outside the classroom, where student affairs personnel impact
student development significantly. Informal interactions between students and faculty
impacts student development and informal interactions between students and student
affair professionals may have the same effect. Love also noted a decrease in faculty
interact with peers and posited that student affairs professionals and peers may fill the
void created by decreased faculty interaction with students.
Student affairs professionals and peers have more contact with students than
faculty due to residence halls and the amount of time students spend outside the
classroom. Love (1995) examined the nature of peers through a review of literature and
found peers representing collective groups at many levels of peer interaction. For this
study, Love categorizes ―true‖ peers as those peers who have more developed
relationships with certain other students of equal status and ability or students going
through the same experiences. Love defined ―non-peers‖ as those students of different
rank or experiences. Direct influences consist mainly of the interaction between true
peers and faculty. Indirect influences consist of residence halls, group activities, and
other non-intimate relational activities. Direct influences have been the focus of much
research while there is little research examining the indirect influences. Love argues that
38
student affairs professionals have a greater impact and are more prevalent in direct
influences than the research indicates.
Peers appear to have a definite effect on student development that translates into a
definite impact on student leader development. The effect of peers on other students
appears significant, but the specific leader skills and competencies are not well
researched and understood. From an examination of Social Learning Theory and other
closely related theories focused on student learning and development, the next body of
literature examined focuses more directly on leadership. Within this realm, emergent,
team and peer leadership best focus on the influence peers have on leadership and leader
development.
Emergent and Team Leadership
Research of emergent and team leadership provides insights to the importance of
peers in the leadership process and leader development, though there is a relative lack of
research in these areas. Emergent and team leadership implies that in most instances
processes focused on leader selection by peers as groups collaborate to identify and
support the chosen leader(s). Group processes encompassed by Social Learning Theory
highlighted the importance of peers in both emergent and team leadership processes.
However, the study of peer leadership is somewhat limited. Loughhead and Hardy (2005)
stated, ―Given that very little research has focused on peer leadership…‖ (p. 305).
Middlehurst (2008) stated, ―There has been less attention addressed to ‗informal and
emergent leadership‘ - that is, leadership exercised by individuals and groups outside
designated positions‖ (p. 327). A review of emergent, team, and peer leadership provided
needed awareness to the impact peers have in the leadership process.

39
Anderson and Wanberg (1991) developed a Talk Assessment Survey that
examined the relationship between self-perceived leadership (SPL) and observer-
perceived leadership (OPL) assessments of emergent leadership. Having similar
independent variables for SPL and OPL provided for construct validity. Anderson and
Wanberg examined the similarity and different construct validity between SPL and OPL.
Researchers identified communication as an important factor in emergent leadership.
Mullen, Salas, and Driskell (1989) stated ―generally, the tendency for the individual with
the highest level of verbal participation to be chosen as the leader was significant and of
strong magnitude‖ (p. 545). The authors used the Talk Assessment Survey developed by
Anderson and Wanberg (1991) to examine SPL and OPL emergent leadership. Results
using correlations and regression analysis for both primary and secondary SPL and OPL
factors indicate that in certain contexts leaders emerge who are not hesitant to speak, are
supportive and concerned regarding the welfare of others, view power as shared, and
utilize the diversity of others to serve the team better. Those emergent leaders with the
most advanced communications skills were also most able to lead or at least persuade
others of their ability to lead. Regarding peer leadership, the significant factors of
communication, support, and concern for others indicate possible competencies needed
for effective peer leadership.
Kickul and Neuman (2000) examined personality and cognitive ability in
determining behaviors in emergent leaders in regards to the knowledge, skills, and
abilities of teams. Kickul and Neuman examined the relationship between personality and
emergent leader behaviors and the relationship between personality traits of emergent
leaders and the knowledge, skills, and abilities (KSAs) impact on the performance of
40
teams. The authors also examined personality traits of emergent leaders augmenting team
performance and KSAs. Previous studies had not examined the specific influence certain
personality traits have on effective teamwork.
Kickul and Neuman (2000) also examined the influence that extroversion or
openness of the leader had on team leader effectiveness. Leaders who were willing to
consider diverse ideas, had the ability to communicate effectively, and who actively
engaged their cognitive abilities with others functioned as more effective team leaders
than leaders who did not engage in these practices. Team members positively regarded
those leaders who had the ability of leaders to engage others with team problem solving
and made deliberate efforts to enhance relationships.
Kickul and Neuman (2000) determined that extroversion, open mindedness, and
intelligence as significant predictors of emergent leadership. Cognitive ability and
conscientiousness emerged as predictors of effective team leadership. Studies by Guzzo
and Salas (1995) and Lord and Hall (1992) corroborated the results of Kickul and
Neuman also illustrating the importance of intellect, interpersonal, and administrative
abilities to emergent and team leader effectiveness. Kirkpatrick and Locke (1991)
identified achievement, tenacity, and initiative as necessary traits for emergent leaders to
influence their group. However, cognitive ability did not emerge as a significant predictor
of teamwork KSAs. Participants viewed interpersonal abilities, including conflict
resolution, collaboration, and effective communication, as more essential to effective
teamwork than cognitive ability. The ability to establish effective teamwork appears
closely related to peer leadership, as leaders must first establish effective teamwork
before accomplishing the group task.

41
Carson, Tesluk, and Marrone (2007) investigated the dynamics of shared leadership
within teams. The premise that leadership is critical to successful teams becomes more
imperative as organizations become flatter in structure and rely more on a team
organizational structure. ―Despite this transition in leadership responsibilities from formal
managers to team members, relatively little research has addressed the implications of
this evolutionary shift to internally distributed forms of team leadership‖ (Carson, et al.,
2007, p. 1217). The authors focused on antecedent conditions that lead to shared
leadership and the influence shared leadership has on team performance.
Carson, et al. (2007) defined shared leadership an emergent team characteristic that
resulted from leadership distributed to multiple team members. The conditions, or
antecedents, that foster effective shared leadership include both internal and external
conditions. Internal conditions included shared purpose, social support, and voice.
External conditions focused on supportive coaching available to the team.
An increase in internal leadership networks increases the ability of the team to share
leadership. Increased internal networks results from the reliance team members have on
each other to help solve issues or gather information. Internal networks do not evolve
from helping each other accomplish tasks or share in workload, but focus on higher levels
of interaction. Team members viewed leader cognitive constructs as distinctly different,
serving other team functions, and not involved in developing shared leadership.
The antecedent condition of shared purpose occurs when team members have the
same primary objectives and work toward accomplishing collective tasks. Shared purpose
fosters motivation, empowerment, and commitment. Social support evolves from team
members providing each other emotional and psychological strength that brings about a
42
sense of safety, inclusion, consideration of differing views, and accomplishment
recognition. Voice is a relative term that Carson et al. (2007) defined as leaders fostering
participation, input, a sense of effective communication, and effective listen. The three
antecedent conditions mutually support each other and assist in creating an environment
positively influencing shared leadership.
Supportive coaching is an external antecedent condition fostering shared leadership.
Supportive coaching includes encouraging, reinforcing, rewarding, and developing a
sense of self-competence that has a positive effect on leaders within a team. Having an
external supportive coach also assists team members in understanding the strengths and
weaknesses of other team members that may not realize without the assistance of the
coach. The positive influence produced by supportive coaching assists team members in
building commitment and accomplishing tasks, thus supporting internal antecedent
conditions.
Regression analysis conducted by Carson et al. (2007) identified both internal team
environment and external coaching as significant in regards to shared leadership. A
hierarchical regression analysis identified team performance as significant to shared
leadership; shared leadership was a strong, positive predictor of team performance. The
results indicate that the team internal conditions consisting of shared purpose, social
support, and voice increase team performance. Effective, supportive external coaching
also positively impacts team performance, especially for teams that do not have
supportive internal conditions. This study supports findings research by Komivas et al.
(2005, 2006), Adelman (2002), Erez, Lepine, and Elms (2002), Whitt et al. (1999),
Andersen and Wanberg (1991), Mullen et al. (1989), Tagger and Ellis (2007), and

43
Loughead and Hardy (2005), who also found similar results when studying similar
internal and external aspects impacting shared leadership.
Stone and Cooper (2009) argued that leaders emerge from within groups in multiple
ways. Situations exist where emergent leaders constantly take advantage of or create
leadership opportunities. In other situations, leaders consistently contribute and emerge as
the leader by providing credible solutions to problems. Another path to leadership lies in
filling voids created in failed leadership. The authors re-examined the idiosyncrasy credit
(IC) emergent leadership theory first posited by Hollander (1958) and identified several
methodological issues detracting from the theory, but also provided ways for research to
enhance Hollander‘s theory. IC focuses on a leader creating credibility within a group by
his or her positive contributions to the group.
A literature review by Stone and Cooper (2009) noted several trait analyses that
identified intelligence as a predictor of emergent leadership. The Big Five personality
traits by Judge, Bono, Ilies, and Gerhardt (2002) also predicted emergent leadership. The
Big Five personality traits include agreeableness, openness to change, extraversion,
conscientiousness, and neuroticism. Hollander (1958) examined the paradox within
emergent leadership where one must conform to the group to gain acceptance yet has to
deviate from group norms to lead the group. The primary question emerging from
Hollander‘s analysis was concerns regarding deviation from group norms without group
sanctions. Hollander concluded that emerging leaders transact to build credit with group
members that allows emergence to occur. Stone and Cooper contended that Holland
developed his IC theory during the late 1950s after many leadership researchers were
frustrated with trait theory and looked to the behavioral approach. As time progressed,
44
the IC was overshadowed by transformational and charismatic leadership. Burns (1978)
in his work, Leadership, stated that transactional leadership is needed for effective
transformational leadership and sees a continuum of leadership rather than discrete types,
such as laissez faire, transactional, and transformational. Avolio and Locke (2002) also
agreed with the premise that social exchange is foundational to transformational
leadership. Emergent and team leadership literature provides a foundation for better
understanding peer leadership.
Erez et al. (2002) investigated the effects of rotated leadership on team
functioning and effectiveness. The authors reported limited research regarding the
implications of team design and effect team design had on team functioning and
effectiveness. The specific hypotheses that resulted from the two design foci included: (a)
the use of peer evaluations in self-managed teams will be positively associated with
workload sharing, level of voice on the team, cooperation, team performance, and
member satisfaction, (b) the use of rotated leadership will be positively associated with
levels of workload sharing, levels of voice on a team, cooperation, team performances,
and member satisfaction, and (c) the relationships between the team designs and the
indices of team effectiveness will be partially mediated by the team processes.
The authors chose a quasi-experimental method to investigate the stated
hypothesis. The experiment included 114 undergraduate students enrolled in a required
human resources management course. The results of this research indicate that peer
evaluations or rotated leadership promotes team effectiveness as indexed by team
performance and member satisfaction. The effects appeared to be at least partially
mediated by three team processes: workload sharing, voice, and cooperation. The
45
research results indicate that relatively simple team designs can have important effects on
team processes and team effectiveness. Peer evaluations can promote workload sharing,
voice, and cooperation that translate into higher levels of performance and member
satisfaction. Rotating leadership responsibilities appeared less important than peer
evaluations on team processes, but did positively impact voice and cooperation. Although
the research focused on team processes, the peer group had additional incentives to
perform well as a group as each team member had an impact on the other member‘s
grade. Reward power is a significant influence and without it, the dynamics of peer
leadership shift and other factors may influence effective team leadership.
Peer Leadership
Brown (1972) looked at predictions and proposals for student development in
higher education, reviewed student development research, and made recommendations
for the future of student development. Brown‘s research focused on the importance of the
peer group in student development and stated,
One of the most potent environmental influences on student development in
college is the peer group. While the faculty may play some role in the
development of intellectual attitudes and perhaps in vocational choice, the
dominant and single most important force remains the peer group. (p. 31)
Other factors that impact student development include the living unit, the faculty, and the
classroom experience. Terenzini et al. (1996) and Brown (1972) agree that a holistic
approach enhances student development. Every aspect of a student to include educators,
athletic coaches, club advisors, others directly involved in student development
contribute to a student‘s development. Peers also play a significant role in student

46
development and logically impact a student‘s leadership development illustrating the
need to understand the impact peers have in developing student leadership.
Astin (1996), in a review of a cooperative longitudinal study of cognitive and
affected learning by undergraduate students, concluded that the most important
generalized finding focused on the influence peer groups had on student development.
Peer groups provided a more intense learning experience than activities conducted with
student affairs or academic studies.
Adelman (2002) examined a theoretical foundation for peer leadership based on
influence and suggests methods for developing curricular or extracurricular peer
leadership programs at universities. Emergent leadership provides the majority of
literature regarding influencing peers due to limited peer leadership literature. However,
Komivas and Adelman (2002) defined a model that includes peer leadership based on
power and structural dimensions. The Peer Leadership Model (PLM) consists of two
axes, the horizontal axis representing influence and power and the vertical axis
representing task structure (see Figure 2).

47
Figure 2. Peer Leadership Model
The authors illustrated with their model that the most effective peer leadership occurs in a
vertical parabolic area originating from influence and progressing towards authority. The
least effective peer leadership occurs at the extremes of the task axis and at the authority
end of the influence and task axis. Collaboration decreases from the center of the model
to the corners of each quadrant. The PLM does provide clarity and organization for
purposes of illustrating peer leadership in a general context based on two aspects
effecting peer leadership, but does not explain the reasons for the effective area defined
by the parabolic area they designate as team leadership; the area of most effective peer
leadership. The PLM is encompassing theoretically but does not address specific skills
and competencies needed for effective peer leadership.

48
Research by McDaniels, Carter, Heinzen, Candrl, and Weiberg (1994), Cuseo
(1991), Astin (1968 and 1985), and Roberts (1996) indicated that peer interactions
provided for enhanced cognitive development and allowed for the application of peer
leadership skills. Adelman commented on his observed realities regarding the dynamics
of peer leadership and concluded that peer relations are dynamic and peers are rarely
equal.
Ladyshewsky (2006) conducted qualitative research to examine the use of peer
coaching creating deeper learning and to promote the transfer of theory into practical
application. Ladyshewsky also explored the process features and relationship attributes
that support successful peer coaching.
To conduct this qualitative research, each student selected another student from
their learning unit to form a peer coaching team. Each team was required to meet at least
weekly. Most meetings were face-to-face, but not all, as some, due to necessity,
interfaced by email or phone calls. Each student received a peer coaching guide and one
hour of instruction by the author regarding peer coaching and its relationship to
management education and professional development. The duration of the peer coaching
relationship was for one semester (12 weeks) except for the 11 students in the Master in
Leadership and Management course who participated in this peer coaching relation for 24
weeks.
Each student submitted a reflective journal on the peer coaching relationship. A
total of 71 peer coaching reports were submitted as the master students were required to
submit two reports. The author provided a list of guiding questions for each student that
49
formed the basis of the reflective journal. A software program called N-VIVO© was used
as a database manager to assist in the coding of the reflective journals.
The results from the reflective journal coding analysis revealed three conceptual
dimension of the peer coaching experience. The first dimension related to enhancing
critical thinking and meta-cognition; the second related to the process features of peer
coaching; and the third related to relationship factors between the participants.
The research identified five aspects of critical thinking including knowledge
expansion, perspective sharing, knowledge verification, cognitive conflict, and alternative
perspectives. Knowledge expansion occurred for both participants in the team and those
in the coaching role gained more knowledge through the peer coaching dialogue.
Perspective sharing occurred as both participants shared similar perspectives on issues
that served to solidify knowledge. Knowledge verification occurred when either
participant verified knowledge already possessed. Cognitive conflict occurred when
either participant questioned the other participant's existing knowledge framework that
led to a deeper level of inquiry and learning to determine the truth. Alternative
perspective is leveraging the diversity of thought brought about through the peer
coaching interaction.
Through the cognitive conflict aspect, both participants in the peer coaching
relationship experienced moments of double or triple loop learning (Argyris, 1991). Most
learning experiences are single-loop where a student learns from analysis, but does not go
beyond the initial learning process. In double or triple loop learning, students made
discoveries that they ―…did not know what they did not know‖ as students had more
cognitive time for analysis (p. 76). The structured conflict between the participants

50
increased each other‘s understanding of the concept under debate and often led to
fundamental shifts in perspective. Cognitive conflict appears as an influential aspect of
peer involvement and important aspect of peer leadership. Cognitive conflict may provide
peer leaders with a means to engage other peers, win their confidence by taking risk, and
gain influence over other peers.
The process of peer coaching focused on commitment, peer coaching selection,
learning journals, learning objectives, formality, and coaching skills and techniques.
Formality formed an interesting aspect as most peers saw the need for an organized and
well-planned peer coaching session that had established goals and a structure to guide
them through the process. Coaching skills and techniques provided the most promising
aspect in the process of peer coaching in relationship to peer leadership. Participants
noted specific skills and techniques exist that improved the peer coaching process.
Qualities most desired in peer coaches focus on the basics of good communications and
include active listing, empathy, open-ended questions, probing, paraphrasing,
encouraging reflection, summarizing, and providing acknowledgement. Participants felt
that these skills were especially important as peer coaching is a non-evaluative process
that encourages effective communication and relationship building.
Relationship factors included relationship (empathy, respect and support), social
support, trust, self-confidence and self-efficacy, and coaching attributes. The
establishment of trust was a basis for social support that, in turn, promoted safety in the
learning environment. Trust is the basis of relationships and the Ladyshwesky‘s finding
supports the critical nature of establishing relations on trust. Coaching attributes involve
approachability, availability, enthusiasm, friendliness, intelligence, honesty, and
51
commitment to the peer coaching process. The coaching attributes identified by
Ladyshwesky appear similar to leadership traits and may also support effective peer
leadership.
Although limited in scope and different context (graduate versus undergraduate
student), the research provided by Ladyshwesky provides great insight to factors that may
influence peer leadership. The coaching attributes and skills and techniques identified in
this research as important to the peer coaching process may provide a basis to construct
assessment instruments possibly needed to gather data on analyzing the factors most
important to effective peer leadership. The discussion regarding trust is also valuable as it
reinforces other research that indicates the importance of trust when establishing and
developing relationships from which leadership influence can emerge.
Bowers and Seashore (1966) conducted quantitative leadership research in the
mid 1960s that examined the impact of both supervisory and peer leadership on employee
satisfaction and factorial performance measures. The theoretical construct of their
research included four factors believed at that time to contribute to effective leadership;
support, goal emphasis, interaction facilitation, and work facilitation. Bowers and
Seashore defined support as leader behavior that enhances the sense of personal esteem
of group members. Goal emphasis occurs when leaders advance the mutual interests of
the group. Interaction facilitation focuses on developing effective relationships to
enhance group effectiveness. Work facilitation occurs when leaders help remove
obstacles and manage environmental factors that inhibit group goal attainment.
Bowers and Seashore (1966) highlight an important aspect of leadership
progression up through the mid 1960s. Until the later half of the 20th century, most
52
leadership contexts used a hierarchal structure and patterned the leadership structure after
two influential social entities, the church and the military. Beginning in the early 1960s,
leadership thought began to recognize the impact of group dynamics and the realization
that others within a group could lead. Bowers and Seashore focused on non-hierarchal
leadership structures focused specifically on peer and supervisory influence consisting of
the four previously cited constructs.
Using correlations, Bowers and Seashore (1996) analyzed data collected from
surveys submitted to 40 randomly selected agencies within one insurance company. The
analysis found significant correlations between both peer and supervisory leadership and
all four leadership factors. Bowers and Seashore concluded from the correlations that
there is a significant relationship between peer and managerial leadership characteristics.
In most instances, an increase in peer leadership resulted from increased managerial
performance or combining managerial characteristics associated with the corresponding
peer characteristic. The authors conclude that peer leadership characteristics seem
important and peer leadership relates closely to managerial leadership.
Fredricks and Eccles (2005) focused on the relationships that exist within school-
based extracurricular participation focusing on pro-social peers and student development.
Although this research is on high school participants in grades nine through 12, the
findings suggested several aspects of peer leadership that may provide insight to the skills
and competencies needed for success as a peer leader in higher education.
Extracurricular activity data previously studied by Eccles and colleagues at the
University of Michigan provided descriptive statistics, correlations, and regression
analysis. Gender, grade-level, parent education, and grade point averages defined
53
covariates. Results indicated higher student participation with pro-social peers in school
involvement activities consisting of performing arts and academic clubs and a marginally
higher participation rate with team sports. These results indicate that peers appear to
have a stronger impact on student activities when students have more of a collegial
environment to develop relationships and engage in deeper conversations.
Fredricks and Eccles (2005) used regression analysis to examine the significance of
pros-social perceptions to time spent participating in school clubs, time in organized
sports, and indicators of adjustments to school. All pro-social peer group regression
models indicated significance and generally supported the hypothesis proposed by the
authors. In most instances, the findings of this quantitative research supported the
proposed mediation model of activity participation developmental outcomes suggested by
the authors.
Kellett, Humphrey, and Sleeth (2006) examined the relationships between leader
empathy and leadership attributions from peers. Research indicates that leaders can
impact subordinate attitudes and feelings of frustration and optimism that can impact
subordinate performance and group or team goals. Kellett et al. addressed the need for
further research regarding the relationships between emotional abilities and different
leadership styles by examining the interaction between three basic emotional abilities and
two leadership behaviors. The three emotional abilities included empathy, ability to
identify others‘ emotions, and ability to express one‘s own emotions. The two basic
leadership behaviors included relation-orientation and task-orientation. The analysis
produced a model that analyzed the relationships between the three emotional abilities
and two leadership behaviors.

54
Empathy provides a central theme to Kellett et al. (2006) research. Many
definitions for exist for empathy. A review of the literature defines empathy as, ―the
ability to comprehend another‘s feelings and to re-experience them oneself‖ (Salovey &
Mayer, 1990, pp. 194-195). Through empathy, the leader displays personal involvement
and creates a greater relationship that affects that leader‘s ability to influence and lead.
Empathy also tends to enhance a leader‘s credibility and foster cooperation and trust.
Leaders perform better at problem-solving, making decisions, and accomplishing
personal goals when employing these three aspects of empathy.
Limited research exists that examines the relationship between team leader
behavior and behaviorally-based team performance, specifically, perceived team
effectiveness, productivity, and learning. Criticism that exists focuses on leadership
theories and the lack of studies that examine a leadership theory or model in a more
complex context, preferring to evaluate the effectiveness of that theory in a clinical
setting. Burke et al. (2006) conducted a meta-analysis that investigated the relationship
between behaviorally based team performance and the impact of leader behavior. In
essence, the authors wanted to know if leadership behavior in teams matters.
In assessing leader behavior, Burke et al. (2006) considered only those studies
that focused on transformational, transactional, initiating structure, consideration,
boundary spanning, and motivational and empowering behaviors, in more applied
environments. A literature review provided the studied behaviors and a model for
analysis. The author‘s meta-analysis identified over 1000 articles from various electronic
searches that evolved into 231 published and unpublished studies included in the
analysis. Two industrial/organizational psychologists used a coding scheme on the
55
selected articles to quantify study characteristics. The resulting data set contained 50
empirical studies with 113 effect sizes.
Results indicated that task-focused leader behavior accounted for 11% of the
variance in team behavior-base effectiveness and 4% of the variance of team
productivity. Person-focused leader behavior accounted for 13% of the variance of team
behavior-base effectiveness and 8% of the variance of team productivity. A sub-group
analysis revealed that empowerment explained 22% of the variance in perceived team
effectiveness while boundary spanning explained 24 % of the variance. Empowerment
behaviors explained 31% of the variance in team learning.
Salas, Sims, and Burke (2005) conducted research to define teamwork and
proposed a practical model of teamwork based on empirically evidence. A review of
literature pertaining to teamwork over the past 20 years provided more than 138 models
that explained teamwork. A thematic analysis of the models revealed five important
aspects of teamwork: team leadership, mutual performance modeling, backup behavior,
adaptability, and team orientation. The authors titled the five aspects of teamwork, ―the
Big Five‖ (p. 558); they differ from other taxonomies as the authors considered only
components that have the greatest effect on teamwork and found in almost all definitions
of teamwork. The authors discussed three aspects needed for the five aspects in Salas et
al‘s model to work: development of shared mental models, achievement of mutual trust,
and engaging in closed-loop communication.
The five dimensions provide insight to effective peer leadership. The dimensions,
although team dimensions, allow for individual leader skills and competencies to emerge.
Specific skills and competencies proposed for further analysis include communication

56
skills, adaptability, and team orientation. Providing feedback and guidance to team
members also increases mutual performance modeling and increases team effectiveness.
Regardless, this research concluded that effective teams require a complex mix of
individual and organizational support, and teamwork.
Limited research exists that examines the leader's impact on establishing norms
within a team. Tagger and Ellis (2007) examined the role of leaders in shaping and
developing team norms by conducting an empirical study with third year honors business
students in an Ontario university. The primary emphasis of this study examined newly
formed teams and the impact staff and team leaders had on negotiated and agreed upon
team norms for problem solving.
Team norm development occurs during the early stages of team formation and
usually based on individual consensus. Clear and effective communication impacts norm
formation within the team. From this process, team norms develop that facilitate team
survival through punished nonconformance, provide for predictability of behavior, help
protect member self-images, and provide an identity to that team. Most teams establish
norms early when forming rather than occasionally during the life cycle of the team.
Tagger and Ellis (2007) proposed and tested a model based on team norms that
would predict individual team member behaviors. The model consisted of five team
norms including conflict resolution, collaborative problem solving, communication, goal
setting and performance management, and planning and task coordination. Results
indicated that initial team member expectations prior to entering into a team were not
significantly related to their subsequent behaviors indicating that member actions were
controlled by team norms. Results also indicated that the expectations that leaders and

57
staff have are important in the team norm forming process. Leaders with high
expectations can compensate for a staff that has lower expectations. Collaborative
problem solving team norms also impact individual behavior.
The five team norms provide possible insight to potential skills and competencies
needed to effect positive peer leadership. Communication is a common theme in studies
regarding effective emergent and team leadership and identified here as an explicit team
problem solving norm. Conflict resolution, collaborative problem solving, planning/task
coordination, and goal setting/performance management all impact team problem solving
norms and may prove significant when analyzing skills and competencies needed for
effective peer leadership. From the review of team and emergent leadership, a review of
resulting leadership skills and competencies illustrate potential peer leadership skills and
competencies.
Social Learning Theory provides the structural framework to better understand
emergent, team and peer leadership. However, a review of literature regarding emergent,
team, and peer leadership indicates the presence of peer skills and competencies, but the
literature remains relatively silent on peer skills and competencies needed to allow peers
to effectively influence other peers.
Leader Skills and Competencies
Many authors have provided research on the impact peers have on the
development of other students and the subsequent leadership effectiveness of peer
leadership (Astin 1968, 1977, 1984, 1985, 1993; Newcomb 1967; Brown, 1972; Heath,
1968; Chickering, 1969; Pascarella & Terenzini, 1991, 2001). In most instances, the
authors emphasized the interactions of the peers with other students and the impact the
58
environment, or context, has on peer leadership. Most authors do not address the skills or
competencies needed for effective peer leadership. The importance peers have on student
development remains a consistent theme in the leadership literature. Research, including
Adelman‘s (2002) monograph, generally do not address peer leader skills and
competencies, or does so in passing as an extension of the current research.
Mumford, Campion, and Morgeson (2007) constructed a summary of leadership
skills from previous research and defined four broad categories: (a) cognitive, (b)
interpersonal, (c) business, and (d) strategic. The organizational context of Mumford et
al.‘s research did not provide a direct link to peer leadership skills, but did provide a
general framework to further understand possible peer leadership skills.
Adelman (2002) commented on the essential leadership skills needed by effective
peer leaders. The essential skills cited by the author include communication and
interpersonal skills, self-awareness and confidence, a sense of civic and social
responsibility, critical thinking, and reflective abilities. Although the author mentions
these skills, he does not provide a further explanation or association to peer leadership.
The Adelman (2002) study illustrates the lack of research conducted to date on
the specific skills and competencies of effective peer leadership. The PLM previously
discussed provides insight to two important aspects of peer leadership and describes, in a
general sense, the evolution of peer leadership to team leadership.
Smith and Foti (1998) used a multi-variable pattern approach with the three
variables of dominance, intelligence, and general self-efficacy to analyze emergent
leadership within groups. Pattern approach first identifies variables then characterizes
each participant according to the patterns defined by the selected variables. The last step

59
in the pattern approach is to group participants based on their personality patterns and
attempt to identify sub-groups.
Smith and Foti‘s (1998) study built on previous research conducted by others
analyzing traits and emergent leadership. Previous research identified intelligence and
dominance as traits highly correlated with emergent leadership, but did not correlate
general self-efficacy. The authors identified self-efficacy as the expectation that a leader
can perform specific behaviors necessary to bring about a certain or intended outcome.
The pattern approach suggests that a specific pattern of leadership traits rather than
individual traits identify emergent leaders.
The multi-variable pattern research consisted of 160 male undergraduate
participants from a large, public university in the southeast (this study used only male
participants as women failed to emerge as leaders in mixed-sex situations based on
previous research). Results revealed that significant differences surfaced between the
participants with high ratings in three variables (HHH) and those with low ratings in the
three variables (LLL). All three variables correlated significantly to leadership ratings.
Participants with HHH characteristics emerged more frequently as leaders than other
participants. LLL participants were not chosen significantly less than other participants.
Lastly, HHH participants emerged more significantly as leaders than LLL participants.
The research by Smith and Foti (1998) indicated no significance for two-way
interactions. Three-way interactions indicated significance among the three variables.
The overall results reinforce previous research done on these specific traits of
intelligence, dominance, and self-efficacy.
60
Smith and Foti‘s research indicated significance of the three traits on peer leader
skills and competencies. The methodology provided an example of analysis that may
provide insight to determining the significant skills and competencies for effective peer
leadership. Intelligence, dominance, and self-efficacy emerged as three important
variables in peer leadership and may provide insight to the skills and competencies
needed for effective peer leadership.
Holmes, McNeil, Adorna, and Procaccino (2006) used a blended approach to
explore collegiate student athlete preferences and perceptions regarding leadership both
on and off the field. Specific questions asked consisted of the perceptions of peer
leadership and those qualities and attributes essential to team leaders. The second
question of this study explored the effects of participant characteristics such as
scholarship monies, gender of the student athlete, class year, and ethnicity on perceptions
of peer leadership.
Holmes et al. (2006) used the Revised Leadership Scale for Sport (RLSS) for
preferred leadership and two open-ended questions to evaluate collegiate student
preferences regarding leadership. The open-ended questions focused on student athlete
perceptions of peer leadership on and off the field. Specific open-ended questions asked
included, ―Please nominate 3 players who are leaders on the field. Why were they
nominated? Please name three leaders who were leaders off the field. Why were they
nominated?‖ (p. 343).
The significant finding in this pilot study focused mainly on gender differences in
perceptions regarding peer leadership. Men viewed autocratic leadership significantly
more effective than women who had a lesser opinion regarding the effectiveness of
61
autocratic leadership. For the open-ended questions, men and women both viewed
"working hard" as important in selecting those student leaders on the field. "Leads by
example" was the second most common response observed in the study for on-field
leaders (Holmes et al., 2006, p. 344, 345). Overall, women preferred working hard, being
vocal, encouraging the team and leading by example while men preferred working hard,
leading by example, and performance.
Gender differences impacted off-field leader characteristics. Women preferred
personality traits: being a good student, being a good role model, and being vocal. Men
preferred personality traits: being a good role model, and being a good student.
However, no instrument exists that measures the attitudes and beliefs of students
who perceived themselves not in leadership positions. Wielkiewicz (2000) developed the
Leadership Attitudes and Beliefs Scale (LABS), designed to measure the aforementioned
aspects of leadership. Wielkiewicz focused on developing an instrument that measured
student attitudes and beliefs regarding the nature of leadership. Specifically, Wielkiewicz
developed an instrument to determine, ―...what college students and others think about
leadership processes and how they expect leaders to function‖ (p. 337). Wielkiewicz
suggested that many leadership assessment instruments existed that measured the
attitudes and beliefs of students in leadership positions, but no instrument existed to
measure the leadership perceptions of the overall student population.
The original LABS contained four dimensions; Authority, Relationship Orientation,
Ethics, and Learning Orientation. Four additional dimension emerged from research for
the LABS-R; Change-Centered, Systemic Thinking, Positional Leadership Dependence,
and Cooperative Leadership Processes. A renamed LABS-III evolved from further
62
revisions and consisted of 28 items. LABS III consisted of 14 items that represented a
Systematic Thinking dimension and 14 items representing a Hierarchical Thinking
dimension. The author‘s development of the LABS-III instrument provided insight to
potential leadership skills and competencies for effective peer leadership.
Petzel, Johnson, and Bresolin (2001) examined the effect of situational variables
and gender on peer leader selection and likability. There exists a large body of literature
and research regarding sex role stereotypes among Americans. However, there exists
limited research regarding sex role stereotypes and peer selection as leaders. This study
examined the relationship between situational variables and gender in regards to leader
selection, the frequency that male and female subjects spoke, and likability. Two
different contexts focused participants on completing an impersonal and personal task.
Six mixed gender groups totaling 37 participants completed either an impersonal or
personal task. Each group consisted of three male and three female participants; one
group had four female and three male participants. Three groups completed an
impersonal NASA exercise designed to compare individual decision making with the
decisions of the group. The second three groups completed a similar exercise but personal
in context.
After completing the task, all participants completed forms that asked them to
designate the leader(s), the most likable group members, and to rank each member in
terms of the importance of his or her contribution to the group product. Participants chose
males more frequently as leaders for the impersonal task while choosing females more
frequently as leaders for the personal task. Participants chose females as more likable in
both task groups. No significant differences existed between female and male participants
63
on individual performance in any of the task groups, but males received higher rankings
for their contributions in the impersonal group while the same occurred for females in the
personal group. Male participants spoke more frequently than females in the impersonal
groups while females spoke more frequently than males in the personal groups. Both
groups did not like talkative females. The research indicates gender has an influence in
peer leadership in different contexts; females emerge as more effective leaders in
personal contexts while participants perceive males as more effective in impersonal
situations.
Hare and O‘Neill (2000) focused their research on three aspects of small,
academic peer groups: (a) shared vision, (b) leader-follower roles, and (c) organizational
culture and structure. Groups perceive vision as a critical leadership aspect as it allows
the group to develop a common goal and provides direction. Defining roles assists groups
in establishing parameters for accountability, gatekeeper functions, and norms. The
degree of commitment or acknowledgement of the group regarding the perceived culture
determines the extent that culture impacts the group.
The authors conducted 14 one-hour interviews with a faculty peer group to
determine their perceptions of their group‘s shared vision, roles, and organizational
culture. Qualitative research methods used codes for responses in the three areas of
shared vision, leader-follower roles, and organizational culture and structure. Most
comments regarding a shared vision reflected typical perceptions of groups or
organizations that may have a codified vision or mission, but not shared among
constituents. The outcomes resulted in a thoroughly misunderstood vision (mission),
confusion and chaos occurs, inefficiencies, and long-term degradation.
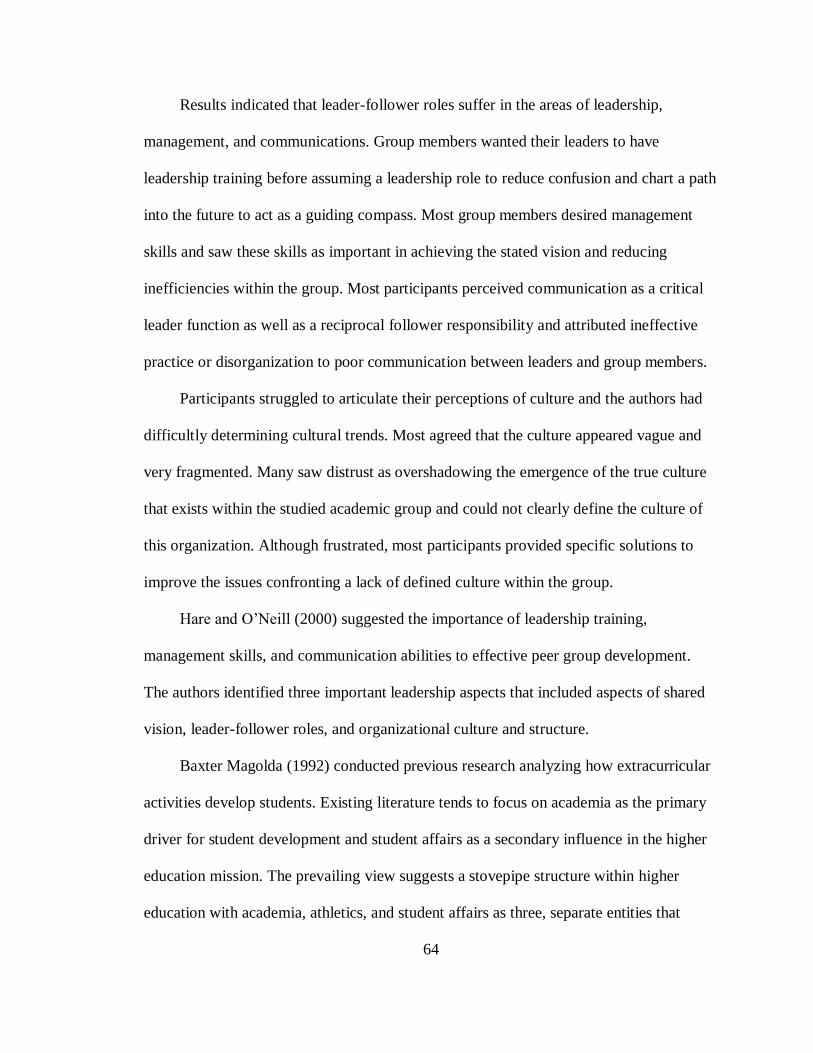
64
Results indicated that leader-follower roles suffer in the areas of leadership,
management, and communications. Group members wanted their leaders to have
leadership training before assuming a leadership role to reduce confusion and chart a path
into the future to act as a guiding compass. Most group members desired management
skills and saw these skills as important in achieving the stated vision and reducing
inefficiencies within the group. Most participants perceived communication as a critical
leader function as well as a reciprocal follower responsibility and attributed ineffective
practice or disorganization to poor communication between leaders and group members.
Participants struggled to articulate their perceptions of culture and the authors had
difficultly determining cultural trends. Most agreed that the culture appeared vague and
very fragmented. Many saw distrust as overshadowing the emergence of the true culture
that exists within the studied academic group and could not clearly define the culture of
this organization. Although frustrated, most participants provided specific solutions to
improve the issues confronting a lack of defined culture within the group.
Hare and O‘Neill (2000) suggested the importance of leadership training,
management skills, and communication abilities to effective peer group development.
The authors identified three important leadership aspects that included aspects of shared
vision, leader-follower roles, and organizational culture and structure.
Baxter Magolda (1992) conducted previous research analyzing how extracurricular
activities develop students. Existing literature tends to focus on academia as the primary
driver for student development and student affairs as a secondary influence in the higher
education mission. The prevailing view suggests a stovepipe structure within higher
education with academia, athletics, and student affairs as three, separate entities that

65
rarely work together, but all have a significant impact on student development. Baxter-
Mogolda proposed a structure describing how students acquire knowledge and the impact
peers have on knowledge acquisition.
Baxter-Mogolda (1992) proposed three levels of acquiring knowledge. The first
level consists of absolute knowledge where the students gain knowledge from authority
figures and peers do not possess knowledge unless obtained from authority figures. The
second level focuses on in-transitional knowledge, students are less certain regarding the
validity of the knowledge and peers tend to play a greater role in knowledge acquisition.
The third level describes independent learning where students view knowledge as
uncertain.
Baxter-Mogolda (1992) gathered data from semi-structured interviews conducted
over the four-year student life cycle at a mid-western public institution. Each year the
author interviewed students by allowing a free-flowing interview based on open-ended
questions focused on extracurricular development influences. Based on the interviews,
data themes were grouped then categorized into the three levels of knowledge
acquisition. Absolute learners found support from peers as most useful when making
decisions based on knowledge they acquired. Diversity, learning about others, and
gaining interpersonal skills appear most influenced by peers at the transitional knowledge
level. Independent functioning and diversity provided two key themes that peers
impacted students at the independent knowledge level. Peers have the greatest influence
on other students at the third level as peers assist students in shaping their own
perspectives on the issues being analyzed and incorporated as knowledge.

66
Peers had a greater impact on women than men as women appeared more concerned
for their peers than men. Support and challenge by peers emerged as two prevalent
aspects having the most impact on student development. Baxter-Magolda‘s (1992)
research coincides with other studies in identifying support as a major function of
effective peer influence on other students and a possible competency for effective peer
leadership.
Fisher (1974) discussed the importance of communication in small group processes.
Social systems and a status hierarchy influenced emergent leadership and provided
indicators of who the small group would choose as their leader. Those emerging as
candidates for small group leadership positions exhibited better communicative behavior
than those not chosen. Fisher‘s findings coincide with the finding of Adleman (2002),
Holmes et al. (2006), Ladyshewsky (2006), Erez et al. (2002), Whitt et al. (1999),
Stevens and Campion (1994), Salas et al. (2005), and Tagger and Ellis (2007) who
indicated that communication skills directly influence effective peer leadership.
Despite the broad scope of leadership literature, there is little scholarship regarding
how a leadership identity develops over time. Most leadership development scholarship
focuses on skill-building or short-term interventions such as retreats or courses, rather
than on the process of how leadership capacity or leadership identity develops or changes
over time.
Komives et al. (2005) provided readers with a qualitative research and grounded
theory study that examined leadership identity development. The authors noted a lack of
systemic models for educators to use in leadership development. The authors proposed a
six-stage model to fill this void titled the Leadership Identity Development (LID) model.

67
Komives et al. (2005) used intensity sampling, a type of purposeful sampling, to
identify students who evidenced leadership identity development, the focus of their study.
Professionals who had the opportunity to observe students interacting in group settings at
the mid-Atlantic study university nominated students for the study who exemplified
relational leadership. Each student participated in a series of three interviews conducted
by the same interviewer using a structured interview protocol.
Through the interviews, researchers identified six progressive stages that
constituted leadership identity. The six stages identified were (a) Awareness, (b)
Exploration/Engagement, (c) Leader Identified, (d) Leadership Differentiated, (e)
Generativity, and (f) Integration/Synthesis. The findings suggest that throughout the six
leadership development stages identified, the essential developmental influences that
fostered the development of a leadership identity included adult influences, peer
influences, meaningful involvement, and reflective learning.
Adult influence focused on the family as well as the importance adults have as the
first to identify the student‘s leadership potential. Adults represent the first, and often
primary, role models for students versus peer influences where peers serve as role
models. Students look to older peers as sponsors to motive student involvement. Peers
also provide affirmation facilitating a deeper and more meaningful example of leadership
identity.
Komives et al.(2005) defined meaningful involvement as the training grounds
where leadership identity evolved, helping students clarify personal values and interests.
Team-based involvements such as sports, theater, and band taught students to do their
personal best while concurrently supporting others. Reflective learning structured

68
opportunities for critical reflections, such as journaling and meaningful conversations
with others allowing students to uncover their passions, integrity, and commitment to
continual self-assessment and learning.
Research by Komives et al. (2005) revealed that students found as their leadership
developed, their views towards leadership or leadership identity shifted from a
hierarchical, leader centered form of leadership to a collaborative, relational leadership
process. Results from Komives et al. indicated a critical shift in developing a leadership
identity between stage three, Leader Identified, and stage four, Leadership Differentiated.
Between stages three and four students began to realize that leadership occurred by more
than just the leader and that others could effectively contribute to the leadership process.
The shift, from viewing leadership as being done by leaders to leadership accomplished
by many, was a major research finding and key transition in the LID model.
Several limitations occurred in the research by Komives et al.(2005) that afford
opportunities for further research. Students involved in this study participated in
organizations that may differ from those students with little formal group involvement.
The sample size of this study limited the influences of diversity and culture on the
leadership identity process. Therefore, transferability of the study becomes suspect due
to the methodology, especially the small number of participants that participated in this
study. Additional research focused on environmental interventions that facilitate the key
transition from stage three to four might reinforce the initial study findings.
Peer leadership appears as an environmental influence and a key development
factor in developing leadership identity. Komives et al. (2005) noted the positive
influence peers had on students encouraging them to participate in the leadership process
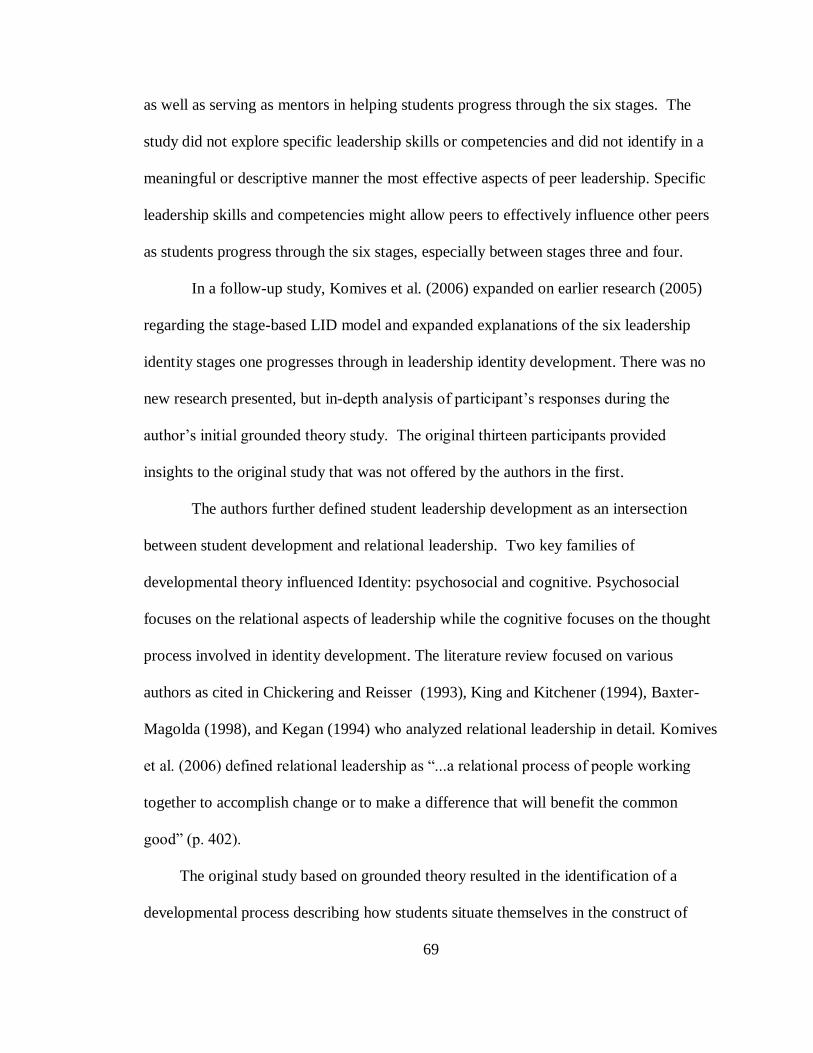
69
as well as serving as mentors in helping students progress through the six stages. The
study did not explore specific leadership skills or competencies and did not identify in a
meaningful or descriptive manner the most effective aspects of peer leadership. Specific
leadership skills and competencies might allow peers to effectively influence other peers
as students progress through the six stages, especially between stages three and four.
In a follow-up study, Komives et al. (2006) expanded on earlier research (2005)
regarding the stage-based LID model and expanded explanations of the six leadership
identity stages one progresses through in leadership identity development. There was no
new research presented, but in-depth analysis of participant‘s responses during the
author‘s initial grounded theory study. The original thirteen participants provided
insights to the original study that was not offered by the authors in the first.
The authors further defined student leadership development as an intersection
between student development and relational leadership. Two key families of
developmental theory influenced Identity: psychosocial and cognitive. Psychosocial
focuses on the relational aspects of leadership while the cognitive focuses on the thought
process involved in identity development. The literature review focused on various
authors as cited in Chickering and Reisser (1993), King and Kitchener (1994), Baxter-
Magolda (1998), and Kegan (1994) who analyzed relational leadership in detail. Komives
et al. (2006) defined relational leadership as ―...a relational process of people working
together to accomplish change or to make a difference that will benefit the common
good‖ (p. 402).
The original study based on grounded theory resulted in the identification of a
developmental process describing how students situate themselves in the construct of

70
leadership over time. The proposed six-stage LID emerged from the central category of
leadership identity. Five categorical themes influence LID and consist of (a) broadening
view of leadership, (b) developing self, (c) group influences, (d) developmental
influences, and (c) the changing view of self with others. The authors integrated the
categories of the grounded theory into building a LID model and tentatively applied the
grounded theory to illustrate and further develop how the categories of the theory change
across stages of the model. The authors also discussed the stages of the model and how
each stage begins with a transition from the previous stage.
The authors discussed the influence of peers on the LID model. Peer leadership first
surfaces in stage two when students began to interact with peers by seeking opportunities
to explore their numerous interests, and when students focused on interpersonal peer
relationships. Older peers act as role models, appear as leaders, and encouraged
leadership development.
Stages three through six indicated increased peer involvement:
- Stage three: students looked to older peers as models for guidance to accomplish
tasks and functioned as increasingly important role models. Stage three illustrates the
student‘s perception that they were either the leader or not the leader. Over time, as
students experienced more complex leadership situations, students began to realize that
they could not accomplish all required leader tasks, had to rely on others, and that others
could also participate in leadership with them. Older peers played an increasingly
important role now as sponsors or peer mentors.
- Stage four: students began to view leadership as a process--not a hierarchical
structure. Peers continued as mentors and became meaning makers. Students began to
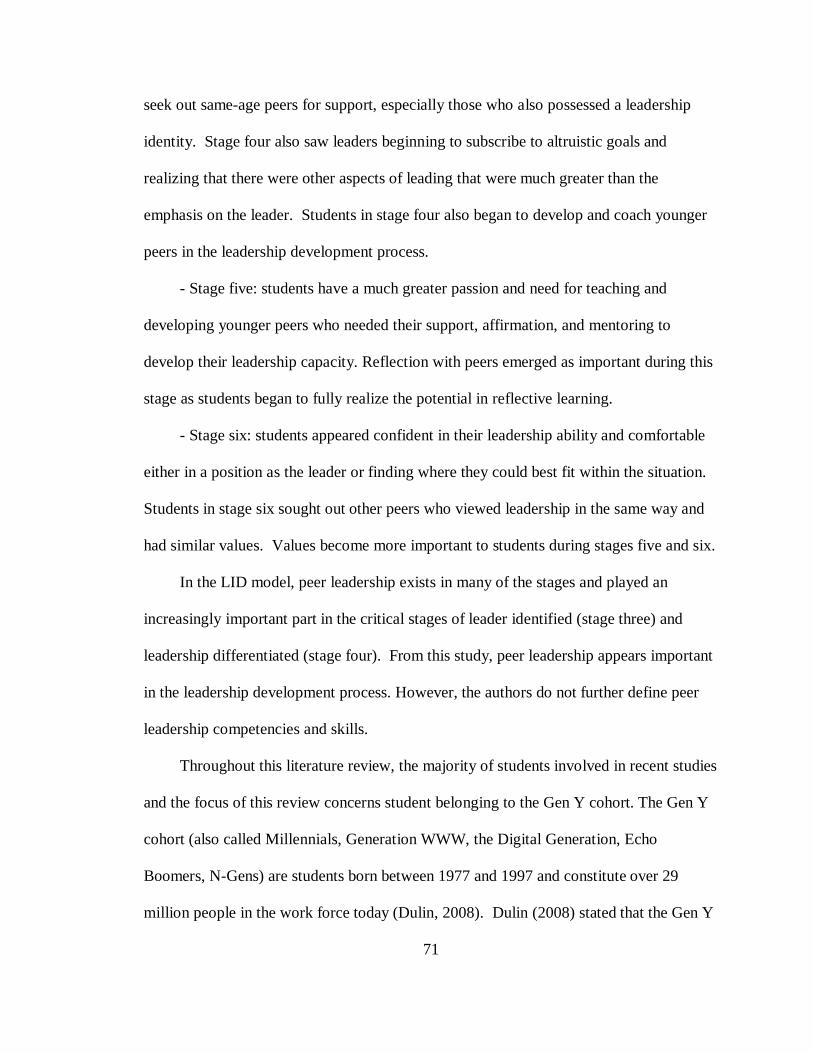
71
seek out same-age peers for support, especially those who also possessed a leadership
identity. Stage four also saw leaders beginning to subscribe to altruistic goals and
realizing that there were other aspects of leading that were much greater than the
emphasis on the leader. Students in stage four also began to develop and coach younger
peers in the leadership development process.
- Stage five: students have a much greater passion and need for teaching and
developing younger peers who needed their support, affirmation, and mentoring to
develop their leadership capacity. Reflection with peers emerged as important during this
stage as students began to fully realize the potential in reflective learning.
- Stage six: students appeared confident in their leadership ability and comfortable
either in a position as the leader or finding where they could best fit within the situation.
Students in stage six sought out other peers who viewed leadership in the same way and
had similar values. Values become more important to students during stages five and six.
In the LID model, peer leadership exists in many of the stages and played an
increasingly important part in the critical stages of leader identified (stage three) and
leadership differentiated (stage four). From this study, peer leadership appears important
in the leadership development process. However, the authors do not further define peer
leadership competencies and skills.
Throughout this literature review, the majority of students involved in recent studies
and the focus of this review concerns student belonging to the Gen Y cohort. The Gen Y
cohort (also called Millennials, Generation WWW, the Digital Generation, Echo
Boomers, N-Gens) are students born between 1977 and 1997 and constitute over 29
million people in the work force today (Dulin, 2008). Dulin (2008) stated that the Gen Y

72
cohort, although more reliant on technology than previous cohorts, ―…still puts a
premium on the human connection‖ (p. 48). In her research, Dulin identified 11 qualities
that the Gen Y cohort used to describe leaders with strong interpersonal relationships: (a)
provides constructive feedback, (b) effective listener, (c) treats others with respect, (d)
manages conflict effectively, (e) fosters fun, (f) friendly, (g) has a good sense of humor,
(h) approachable, (i) has a positive attitude, (j) provides praise, and (k) encourages others.
The qualities of interpersonal relationships determined by Dulin‘s study provide
insight to possible leadership skills and competencies important to the peers involved in
this research. The differences between the different cohorts may have an influence on the
necessary skills and competencies for effective peer leadership and provides a limiting
factor for this research as the focus is on the Gen Y cohort.
Summary
A literature review of Social Learning Theory, emergent leadership, team
leadership, peer leadership, and the limited body of literature on specific peer leader
skills and competencies, identified several themes that provide for further study. Peers
have a definite impact on the development of other students and impact most aspects of a
student‘s life. Much research regards the impact peers have on the cognitive and affective
or extracurricular learning processes of other students. Established leadership constructs
of team and emergent leadership provide insight to peer leadership and the influence
peers have when engaged in establishing influence over other peers. The literature on
specific leader skills and competencies needed for effective peer leadership appears
limited and inconsistent. Discussions involving peer leader skills and competencies
usually focus on broad categories or concepts and few studies focus on specific aspects of
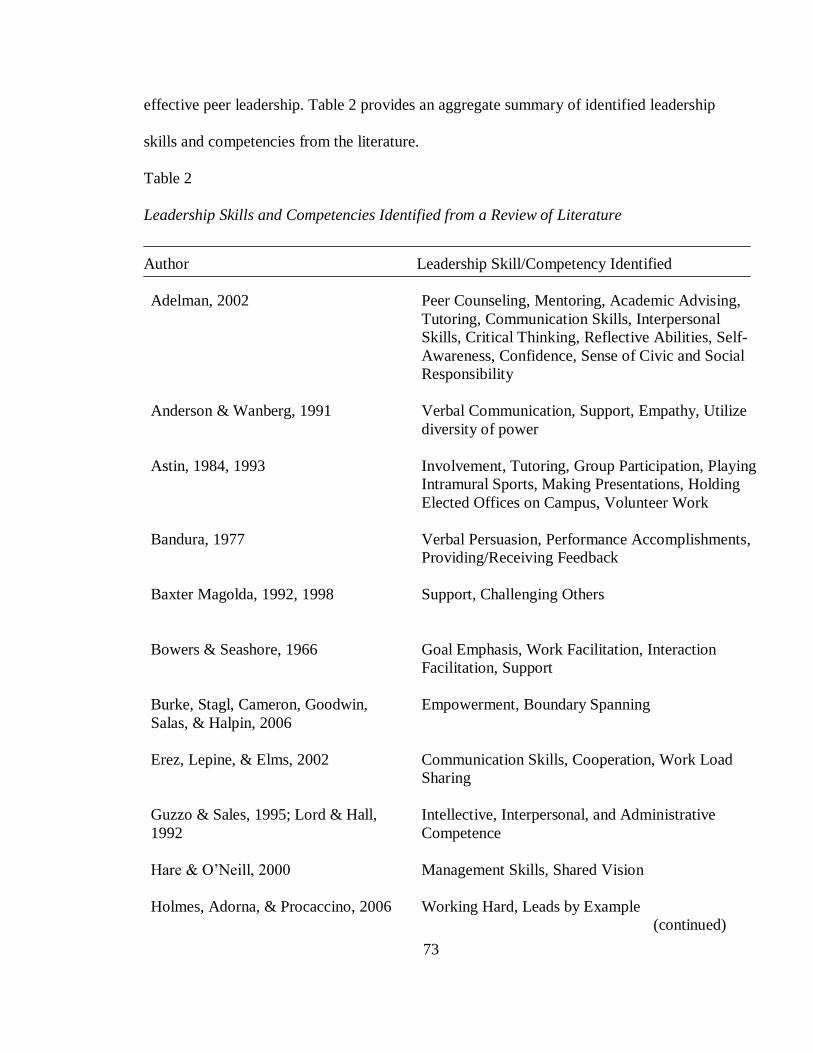
73
effective peer leadership. Table 2 provides an aggregate summary of identified leadership
skills and competencies from the literature.
Table 2
Leadership Skills and Competencies Identified from a Review of Literature
Author Leadership Skill/Competency Identified
Adelman, 2002 Peer Counseling, Mentoring, Academic Advising,
Tutoring, Communication Skills, Interpersonal
Skills, Critical Thinking, Reflective Abilities, Self-
Awareness, Confidence, Sense of Civic and Social
Responsibility
Anderson & Wanberg, 1991 Verbal Communication, Support, Empathy, Utilize
diversity of power
Astin, 1984, 1993 Involvement, Tutoring, Group Participation, Playing
Intramural Sports, Making Presentations, Holding
Elected Offices on Campus, Volunteer Work
Bandura, 1977 Verbal Persuasion, Performance Accomplishments,
Providing/Receiving Feedback
Baxter Magolda, 1992, 1998 Support, Challenging Others
Bowers & Seashore, 1966 Goal Emphasis, Work Facilitation, Interaction
Facilitation, Support
Burke, Stagl, Cameron, Goodwin,
Salas, & Halpin, 2006
Empowerment, Boundary Spanning
Erez, Lepine, & Elms, 2002 Communication Skills, Cooperation, Work Load
Sharing
Guzzo & Sales, 1995; Lord & Hall,
1992
Intellective, Interpersonal, and Administrative
Competence
Hare & O‘Neill, 2000 Management Skills, Shared Vision
Holmes, Adorna, & Procaccino, 2006 Working Hard, Leads by Example
(continued)

74
Author Leadership Skill/Competency Identified
Kellett, Humphrey, & Sleeth, 2006 Emotional Intelligence, Empathy
Kickul & Neuman, 2000 Openness to Experience, Cognitive Ability,
Extroversion
Kirpatrick & Locke, 1991 Achievement, Tenacity, Initiative
Komives, Mainella, Owen, Osteen, &
Longerbeam, 2005, 2006
Support, Mentoring
Kouzes & Posner, 2007 Model the Way, Inspire a Shared Vision, Challenge
the Process, Enable Others to Act, Encourage the
Heart
Ladyshewsky, 2006 Peer Coaching, Critical Thinking, Communication
Skills, Active Listening, Reflective Abilities,
Empathy, Respect, Confidence, Support
Loughead & Hardy, 2005 Social Support, Positive Feedback, Democratic
Decision Making
Mullen, Salas, & Driskell, 1989 Verbal Persuasion, Support, Concern for Others
Rubin, Bartels, & Bommer, 2002 Intelligence, Self-Monitoring (the extent at which
individuals monitor and control their self-
perceptions in social situations
Salas, Sims, & Burke, 2005 Shared Mental Models, Closed-Loop
Communication, Providing Feedback, Mutual Trust,
Team Orientation
Sims & Manz, 1982 Modeling
Smith & Forti, 1998 Dominance, Intelligence, General Self-Efficacy
Stevens & Campion, 1999 Conflict Resolution, Collaborative Problem Solving,
Communication Skills, Planning, Coordinating
Stone & Cooper, 2009 Providing Credible Solutions to Problems, Fill
Voids, Intelligence
(continued)

75
Author
Tagger & Ellis, 2007
Leadership Skill/Competency Identified
Communication Skills, Conflict Resolution,
Collaborative Problem Solving, Planning, Goal
Setting, Performance Management
Whitt, Edison, Pascarella, Nora, &
Terenzini, 1999
Communication Skills, Tutoring, Reflection,
Teaching
The summary of Table 2 reveals the following most cited leadership skills and
competencies: (a) communication (cited 10 times); (b) support (7); (c)
reflection/feedback (6); (d) work hard/ethic (4); (e) goal setting/emphasis (4); (f)
mentoring/peer counseling (4); (g) collaboration (3); (h) providing solutions (3); (i)
interpersonal (3); (j) expertise/cognitive/competence (3); (k) empathy (3); (l) and five
others cited twice.
The literature did not provide clear guidance on the skills and competencies that
appear most effective for peer leadership. Analysis of a database, ROTC leadership
assessments, consisting of leadership skills and competencies discussed in Chapter III
provided another perspective on skills and competencies needed for effective peer
leadership. The combined information from a literature review and analysis of the ROTC
data base still indicate a lack of specified peer leadership skills and competencies and
provide an opportunity to advance the body of knowledge pertaining to peer leadership.

76
CHAPTER III: METHOD
This study focused on examining and determining competencies and skills needed
for effective peer leadership. A literature review and analysis of an existing leadership
assessment database provided a list of possible peer leadership competencies and skills.
The purpose of this and succeeding chapters is to define the methodology, conduct
analysis of gathered data, and provide conclusions and discussions regarding effective
peer leadership competencies and skills.
Many leadership programs develop learning objectives by focusing education and
development to prepare students for the leadership challenges after graduation and in
professional situations. Many undergraduate leadership programs provide a limited view
of micro, or lower-level, leadership development and how students can gain influence
over other students of equal status and ability, even when in positions of legitimate
authority. Integrating peer leadership education and development into existing leadership
programs allows educators and mentors the use of campuses as laboratories and practice
fields to better prepare students for the significant leadership challenge of leading peers.
This chapter provides a description of methods used and rationale for gathering and
analyzing data needed to address the hypotheses developed in chapter II. The
methodology centers on analyzing an existing leadership assessment data base to enhance
convergent validity, creating an influence survey to measure peer leadership
competencies and skills, and then verifying the survey. Quantitative analysis of data
provided by the influence survey provides insight for discussions regarding effective peer
leadership competencies and skills.

77
General Research Perspective
Research questions in this study focus on providing insight to peer leadership that
leads to a more definitive explanation of the factors needed to effectively influence peers.
Better defined peer leadership competencies and skills might provide additional
information to enhance peer leadership. Hypotheses generated from research questions
provide a focus to determine aspects needed for effective peer leadership. The resulting
two hypotheses examined by this study include:
H1 No specific leadership competencies exist that enhance peer leadership.
H2 No specific leadership skills exist that enhance peer leadership.
Each hypothesis focused on providing greater insight to the limited body of
knowledge regarding effective peer leadership. Leadership competencies provide an
over-arching framework that identifies broad defined areas of leadership needed for
effective peer leadership development. Leadership skills based on identified leadership
competencies provide defined behaviors that might enhance peer leadership development.
Both peer leadership competencies and skills allow a concentrated focus on constructs
needed to develop leadership educational outcomes and effective program evaluation.
The type of research chosen for this study allowed for a quantitative analytical approach
to determine hypotheses outcomes.
This study utilized descriptive quantitative survey research providing insight to
research questions through stated hypotheses (Rossi, Wright, & Anderson, 1983). The
primary methods allowed an analysis of an existing leadership database to enhance
convergent validity to assist in the development of a valid and reliable survey. The
resulting survey allowed data collection on peer leadership competencies and skills.
78
Quantitative procedures used during the database and survey data analysis consisted of
various inferential parametric statistical methods.
ROTC Database
Army ROTC has a total of 272 programs located at colleges and universities
throughout the 50 states, the District of Columbia, Puerto Rico and Guam with an
enrollment of approximately 20,000 cadets each year (United States Army Cadet
Command Headquarters, 2010). The ROTC program produces over 60 percent of the
second lieutenants that join the active Army, the Army National Guard, and the U.S.
Army Reserve. More than 40 percent of current active-duty Army general officers
received commissions through ROTC programs. An essential aspect of the ROTC
leadership development program is a leadership assessment that occurs at the end of three
years of ROTC leader development. Chapter I provided details on the leadership
assessment process.
Beginning in 1999 through 2009, the US Army used 16 leader dimensions
(competencies) to assess leader effectiveness (see Chapter I for definitions of the leader
dimensions). The 16 leadership dimensions remained consistent over the 11 years that
leadership assessment data was collected at LDAC creating a stable, consistent database
of leadership assessments. Although cadets are in legitimate leadership positions when
evaluated, peer leadership influenced the effectiveness of the assessed cadets as all
students attending LDAC are peers in ROTC programs and perceive each other as equal
while at LDAC.
79
Participants
Access to ROTC leader assessment data occurred after receiving approval from the
Study University‘s Human Subjects Review Board and the U.S. Army Accessions
Command Institutional Review Board (see Appendix A). Table 1 provides demographic
information for the ROTC data. The ages of cadets attending LDAC during the study
period ranged from 18 to 41with 83 percent under the age of 25. Older cadets consisted
of prior service Soldiers pursuing undergraduate degrees to earn commissions as officers.
The vast majority of cadets reflected the demographics of the US Army officer corps.
The ROTC data consisted of 47,555 cadet leadership evaluations of 16 leadership
dimensions from 1999 to 2009 covering 11 assessment summers.
Data and Variables
ROTC evaluators used a nominal scale to assess leader dimensions. ROTC
evaluators rated Cadets using a scale that indicated an Exceeds Standards (E), Meets
Standards (S), or Needs Improvement (N) rating for each of the 16 leader dimensions.
The sum of the 16 leader dimensions determined an overall rating. Cadets achieving eight
or more E ratings received an overall E assessment. Cadets receiving at least 1 N rating
received an overall N assessment as cadets must achieve S ratings in all 16 Dimensions to
graduate from LDAC. A conversion of the nominal scale of E, S, and N to an ordinal
scale permitted an analysis using the software Statistical Package for the Social Sciences
(SPSS)©, version 18. The 16 leader dimensions comprised the independent variables
while the overall ROTC leadership assessment acted as the dependent variable.

80
Data Analysis
The initial ROTC data received from the U.S. Army required a conversion from
nominal (E, S, N) to ordinal (1, 2, 3) data to accommodate various statistical analysis.
Two sets of statistical procedures provided insight to the ROTC data. The first set of
statistical procedures focused on the entire data set ignoring the stratification of the data
based on overall cadet assessments. The second set of procedures analyzed the three
stratified samples based on the overall Cadet assessments of Exceeds Standards, Meets
Standards, or Needs Improvement.
The data had a normal distribution according to skewness and kurtosis indicators.
Correlations between the 16 leaders dimension indicated significance between all
dimensions. Stratified correlations also indicated significance among all dimensions
providing limited insight to significant dimension relationships.
Descriptive statistics provided information on the 16 leader dimensions and overall
Cadet-leader assessment. Although variances appeared small from a visual inspection,
rank ordering the 16 dimension means provided information on those dimensions that
appear important. The analysis of the stratified and entire database highlighted
differences between overall leadership assessments.
Viewing the data as a survey of leadership allowed for an analysis of the reliability
using Cronbach's Alpha with deleting dimensions. Analyzing reliability by deleting
dimensions provides information on independent variables influencing the reliability of
an assessment instrument. The Cronbach‘s Alpha reliability analysis provided
information on dimensions important to the entire and stratified data samples.

81
The statistical analysis of the ROTC data provided information regarding those
leader dimensions important to the overall cadet leadership assessment. Identifying the
leader dimensions important to the ROTC leadership assessment process conducted with
peers provided insight to possible peer leadership competencies. The ROTC leader
dimension analysis enhanced convergent validity with the literature review.
ROTC Database and Literature Review
Table 1 in Chapter II provides a summary of the most often cited leadership
competencies and skills found during a literature review: (a) communication (cited 10
times); (b) support (7); (c) reflection/feedback (6); work hard/ethic (4); goal
setting/emphasis (4); mentoring/peer counseling (4); collaboration (3); providing
solutions (3); interpersonal skills (3); expertise/cognitive/competence (3); empathy (3);
and five others cited twice. The literature did not provide clear guidance on the
competencies and skills that appear most effective for peer leadership. A comparison of
the ROTC database to the literature review provided another perspective on competencies
needed for effective peer leadership.
The commonalities between the important leader dimensions identified by the
literature review and ROTC data analysis included communication (identified by both),
support (literature review), executing (ROTC data), work hard/ethic (literature review),
and mental (ROTC data). The Reflection/feedback competency ranked third as the most
cited competency during the literature review, but did not have a specific ROTC data
counterpart. The leader dimension of physical (ROTC data) did not correlate directly to
any specific leader skill or competency identified by the literature review, but did relate
indirectly to several skills and competencies in the literature. Based on the literature
82
review and ROTC data base analysis, five peer leadership competencies emerged for
initial evaluation during this study: communication, support, mental/hard work ethic,
reflection, and physical. Chapter I provided definitions of each peer leadership
competency.
The literature review and a separate investigation of possible survey instruments
provided no viable instruments that measured peer leadership competencies and skills.
Several authors (Whitt et al., 1999; Astin, 1977, 1993; Terenzini et al., 1996; Loughhead
& Hardy, 2005; Brown, 1972; Adelman, 2002) conducted research gathering or
analyzing peer leadership data, but did not focus on peer leadership competencies and
skills. An instrument focused on peer leadership competencies and skills developed by
this author provided needed data for analysis to answer research questions and determine
the status of hypotheses.
Influence Survey
An initial influence survey included a frame of reference scenario, two stem
questions and 40 specific peer leadership skill questions derived from the literature
review and ROTC database analysis. Several preliminary validity and reliability analyses
produced a final survey. The final survey allowed data collection from 1084
undergraduate students at a public university located in the south-central region of the
United States. The average student took approximately five minutes to complete the
survey. Data analysis concentrated on quantitative inferential parametric statistical
procedures using SPSS.

83
Initial Survey Development, Pre-Pilot Test
The initial survey designed to measure student peer leadership competencies and
skills evolved from the theoretical construct determined during a literature review and
analysis of the ROTC database. Five peer-leadership competencies provided a framework
for the initial survey: (a) communication, (b) mental/hard work ethic, (c) support, (d)
reflection, and (e) physical presence and appearance. These five peer leader competencies
provided the theoretical construct needed to develop a scenario that would allow
participants to relate to the five constructs and accurately answer questions. Eight
questions per construct comprised the initial 40-question survey. An eight-question
construct allowed for elimination of suspect questions to enhance validity. A permission
request granted from the Study University‘s Human Subjects Review Board allowed data
collection from volunteer undergraduate students.
A small focus group familiar with leadership pedagogy developed the initial
questions relating to each of the five constructs. Two stem questions allowed for a more
consistent and understandable survey and was consistent with the theoretical construct.
The second stem question resulted from the theoretical construct, physical, requiring a
separate stem question due to the nature of the questions asked and information desired.
A five-point Likert scale ranging from Never (1) to Always (5) captured student
perceptions of peer leadership skills (Peterson, 2000). A demographics section captured
data to compare to the university student population to provide for desired comparisons
during this peer leadership study. Another small focus group of four students varying in
age and college level reviewed the scenario, questions, demographics, and survey format.
Comments from focus group participants indicated that students would clearly understand

84
the survey questions allowing students to complete the instrument accurately in a
minimum amount of time. One concern focused on the frame of reference question which
seemed ambiguous as it allowed participants to select several individuals as a frame of
reference when answering the questions. Adjustments to the frame of reference scenario
asked participants to focus on only one person when answering the influence survey
questions. Additional comments and suggestions from the focus group provided for a
clearer and effective initial influence survey.
A pre-pilot test consisting of 16 undergraduate students confirmed focus group
comments, provided additional insight to the face validity of the Influence survey, and
provided new insights to content and construct validity of several questions. A
retranslation process, based on pre-pilot test information and participant feedback,
enhanced the content and construct validity of survey questions. The retranslation process
consisted of six doctoral students and nine Leadership Studies faculty matching peer
leadership competency definitions to survey questions. Results of the retranslation
process allowed adjustments to questions resulting in an influence survey for pilot
testing.
Pilot Test
A pilot test of the revised influence survey included 102 undergraduate students and
focused on examining survey reliability and validity. Peterson (2000) stated that at least
60 students constituted an accurate pilot survey test. Undergraduate students in the pilot
study represented 37 academic disciplines (see Table 1 for pilot study demographics).
Participants completed the pen and paper survey taking approximately five minutes to
answer the 40 questions. This study preferred a pen and paper survey to an electronic

85
survey to mitigate environmental variables and provide consistent conditions for students
completing the survey providing for more consistent and accurate data. An in-person
delivery of the pen and paper influence survey also provided for a higher participation
rate of volunteer undergraduate students.
Statistical procedures using SPSS software allowed an examination of the survey
validity and reliability. Reliability using Cronbach‘s Alpha indicated an acceptable
reliability with a rating of above .90 for the entire survey and above .70 for each of the
individual five theoretical constructs. The small sample size precluded an accurate
assessment of the survey validity, but did indicate adequate factor loading consistent with
the theoretical constructs. The reliability and validity analysis indicated that the 40
question survey provided an adequate instrument to gather data from students.
Study Participants
Participants in this study consisted of 1048 undergraduate students. The sample
represented 52 majors or programs from the 6 colleges of the university. Demographic
information appeared similar to the pilot study, ROTC data, and the university population
(see Table 3).

86
Table 3
Demographic Information for Pilot Data, Study Data, ROTC Data, and Study University
Population
Demographic Pilot Data Study Data ROTC Data Study University
Population
(n=102) (n=1048) (n=47,555) (n=17,827)
Gender
(percent male) 55 38 80 43
Race
White 82 88 77 83
Black 13 7 12 11
Asian 2 2 5 1
Other 3 3 6 5
College Level** *
Freshmen 34 26 - 29
Sophomore 27 16 - 19
Junior 21 23 100 18
Senior 18 35 - 25
Age
(percent below 25 years) 99 94 83 79
* University reported 9 percent other for College Level **Note: No college-level demographics for two surveys
The study sample reflected the university population except for college levels as the
study data participants consisted of 58 percent upper level compared to 43 percent upper
level for the actual university population. A comparison between the ROTC and study
participants indicated more demographic similarities than differences. The ROTC cadets
and study sample participants had similar ages with 83 percent of the cadets under the
age of 25 compared to 94 percent of study participants. Race demographics for the study
and ROTC data also indicated similarity with the vast majority being white. Both samples
included a majority of participants in upper levels of higher education with all cadets and

87
58 percent of study participants being juniors or seniors. The largest discrepancy between
the ROTC and study data occurred with gender, as males represented 80 percent of cadets
and only 38 percent of study participants. Both gender and age could induce bias and are
discussed in Chapter V.
Sampling Technique
This author utilized a convenience-random sampling technique to collect data.
Generalized studies require simple random or probability sampling (Rossi et al., 1983;
Oppenheim, 1992). The basic principle associated with probability sampling is ―…the
condition that each element in the population is given a known nonzero probability of
being selected into the sample‖ (Rossi et al., 1983, p. 21). The convenience sampling
technique utilized in this study allowed all students at the university the same probability
of selection into the study sample providing for a random characteristic of the study
sample.
Faculty known by this author provided students to participate potentially in this
study. The initial collection strategy consisted of 61 classes from 31 faculty members that
included 1691 students. The final sample included 54 classes from 28 faculty members
with 1084 students completing the survey. The lower number of participants included in
this study resulted from an approximate 75 percent attendance rate for each sampled
class. Class distribution consisted of 19 100-level classes, 8 200-level classes, 18 300-
level classes, and 3 400-level classes. The sample represented 57 academic programs
illustrating the academic diversity of the sample.
The sample included 16 classes of general education courses. Normally students
enroll in general education courses during their first two years in higher education, but

88
for various reasons many juniors and seniors enroll in general education courses.
Students often do not take course in sequence unless a requirement exists for a
prerequisite course. The senior-level students participating in this sample provide one
example illustrating the enrollment randomness of study participants. Only three 400-
level classes participated in this sample, yet 35 percent of the sample consisted of seniors.
The lack of targeting any specific academic program, college, or level provided for a
degree of randomness. Due to the diversity of programs represented, the apparent random
student enrollment, and the number of general education courses included in the sample,
all students at the study university did have a nonzero probability of selection for this
study providing for an adequate degree of randomness in the study sample.
Final Survey
Final adjustments from the pilot test made to the initial influence survey resulted in
a survey used to gather data for analyzing the hypothesis questions (Appendix B). One
reverse-coded question from each of the five peer leadership competencies ensured
accurate student participation. A visual inspection after completion identified 36 surveys
not included in the survey data where students provided the same rating for each survey
question.
Interval scales measured student perceptions of peer leadership skills that combined
to evaluate peer leadership competencies for the survey data. The 40 questions included
in the final survey constituted the independent variables. An overall rating of the peer
influence experience based on the survey scenario provided the dependent variable. A 10
point Likert scale, 10 the highest rating, provided a rating system for data collection of
the overall peer leadership experience.

89
An initial data screening verified that responses ranged within the prescribed scale
of one to five. Skewness and kurtosis functions of SPSS provided indications of normal
distributions of collected data. A visual inspection of data frequency distributions based
on the principle components identified during validity verification ensured normally
distributed data. The Kaiser-Meyer-Olkin measure of sampling adequacy indicated an
adequate sample size.
SPSS verified the reliability of the entire survey and each of the identified
theoretical construct principle components using the Cronbach‘s Alpha method. An
analysis of question correlation matrices based on .3 or less correlation relationship
criteria identified questions for elimination (Field, 2009). The four physical construct
questions evaluating attributes or physical appearance correlated very weakly to the other
survey questions. One physical-presence question correlated very weakly to the other
three physical presence questions. Eliminating the four physical construct and one
physical presence question allowed an analysis of the physical construct of presence.
Exploratory principle component analysis based on the remaining 27 questions identified
five components, but also indicated cross-loading of components. Eliminating questions
that cross-loaded and using a Promax oblique rather than Varimax orthogonal rotation
yielded four components. An oblique rotation provides the appropriate method for these
data as correlations of identified components indicated relationships among the
components rather than independent components. Costello and Osborne (2005) remarked
that,
Conventional wisdom advises researchers to use orthogonal rotations because is
produces more easily interpretable results, but this is a flawed argument. In the

90
social sciences we generally expect some correlation among factors, since behavior
is rarely partitioned into neatly packaged units that function independently of one
another. (p. 3)
The consistency and thematic nature of the identified four components provided a model
with 18 questions and no cross loadings at the .3 level. Reliability and normality of the
four-component exploratory analysis model yielded adequate reliability and indicated
normally distributed data. Exploratory principle component analysis validated the
validity of the survey based on the four components.
Exploratory principle component analysis using an oblique rotation identified four
components that weakly verified the theoretical constructs. Principle component analysis
provided a more appropriate analysis for this study than factor analysis as principle
component analysis decomposes the original data into a set of linear variates. Factor
analysis develops a mathematical model from which it then estimates the factors (Field,
2009). The nature of this study is in the Social Sciences, and theoretical constructs have a
greater tendency to correlate than to cluster independently, favoring a principle
component rather than factor analysis.
Exploratory principle component analyses of the 18 question survey indicated
increased content and construct validity and defined four components that explained
50.08 percent of the variance. Two of four components accurately identified theoretical
constructs. Two constructs, communication and support, loaded onto two components
best defined as Partner and Participate. One component, Motivate, consisted of
mental/hard work and one support question. The physical construct Presence consisted of
three questions, eliminating the Appearance construct. Based on reliability and validity

91
analysis, the final study survey consisted of 18 questions that allowed for effective and
efficient data analysis.
Research Context and Data Collection
All data collection occurred in classrooms at the Study University. Pen and pencil
surveys provided consistency and more accuracy than electronic, web-base survey data
collection methods due to the physical presence of administrators. Web-based methods
can increase bias as verification of participant identity and demographic information is
difficult to obtain and often unknown. Pen and pencil surveys also have potential bias,
especially pressure to complete the survey due to the presence of other students and a
moderator. However, the use of moderators for data collection used by this study
provided for increased control measures by answering questions and ensuring anonymity,
thereby increasing data accuracy and decreasing bias.
The author and graduate assistants collected data over a four-week time period at
the end of the fall term at the study university. Data collectors read a script (Appendix A),
answered questions, ensured against repeat survey participants, and stressed the voluntary
nature of the survey. Data collectors identified repeat participants by asking students not
to participate if they had already completed this survey. The script that data collectors
read contained a short description of the study and hypotheses questions and assured
participants of the voluntary nature of the survey. This study provided no incentives to
students for participating in the study. Most faculty encouraged participation and
approximately 99 percent of each class voluntarily participated in the survey.
The author visually screened each survey for completeness and obvious non-
participation. An Excel spreadsheet formatted for SPSS facilitated a transfer of the survey
92
data into SPSS for analysis. Several demographic questions required conversion from
nominal to ordinal scales for data analysis. Data imported into SPSS required adjustments
to variables that allowed for parametric, inferential statistical analysis.
Data Analysis
Inferential parametric statistical procedures examined research questions and
provide answers to hypotheses. Regression analysis, with the overall influence rating as
the dependent variable and the four components identified during the principle
component analysis as independent variables, provided insight to those peer leadership
competencies most significant. Four independent variables resulted from summing the
questions included in each of the four principle components. The summed independent
variables allowed analysis to identify significant and most important peer leadership
competencies. Hierarchal regression analysis provided insight to the significant peer
leadership competencies needed to predict an overall peer leadership experience rating.
Multiple regression and analysis of variance (ANOVA) allowed the identification of
significant peer leadership skills.
ANOVA and regression analysis provided insight to significant peer leadership
skills. The overall influence experience rating provided the dependent variable while the
individual questions and summed questions comprising the four principle components
provided independent variables. ANOVA and regression analyses identified significant
leadership skills. This study used various methods to answer hypotheses and draw
conclusions from an analysis of data providing for insights to peer leadership
competencies and skills.

93
Design Weaknesses
Design weaknesses of this study could occur primarily in the ROTC data,
development of the influence survey, and data collection. Although weaknesses could
occur, implemented design controls mitigated adverse effects limiting design flaws. A
critical review of the influence survey and ROTC data provide insight to possible
weaknesses.
Few, if any, studies exist that involve the ROTC leadership assessment data. No
possible studies using the ROTC data exist for public knowledge and internal to the U.S.
Army, providing no means to compare methodology or results. Multiple inquires by this
author to U.S. Army agencies did not surface any published or unpublished reports using
the ROTC data.
Gender could bias the peer leadership competency analysis due to the over-
representation of male Cadets and assessors compared to the general population of
students. The large male percentage of Cadets and assessors does cause concerns of male
bias, but the large sample size of the ROTC data helps to mitigate the male bias.
Extensive frame of reference training each ROTC assessor completed before assessing
Cadets also helps to mitigate the potential male assessor bias (see Chapter I for ROTC
assessor training).
Maturation presents a concern as all ROTC Cadets and the majority of influence
survey students consisted of upper classmen. Maturation is a difficult variable to assess in
leadership development due to the many variables provided by the context and situation
(Komives & Aldelman, 2002; Komives et al., 2005). The influence survey did include 42
percent freshmen and sophomores mitigating the maturation influence in this study.

94
Although maturation is difficult to account for in any study, the intent of this study
focused on undergraduate students and not the effect maturation has on leadership
development.
As mentioned previously, the ROTC data consists of like-minded Cadets. All
participants involved in generating the leader assessment data had a common factor of
selfless public service resulting in a potential bias. The ROTC assessors similarly
appeared like-minded providing for a potential selfless public service bias. Although a
potential bias existed in the ROTC data, the quality of the data focused on peer leadership
providing a quantitative means to correlate with the literature review.
Instruments used to measure leadership emerged from a literature review, but none
of the instruments focused exclusively on peer leadership. Given the limited knowledge
and research concerning peer leadership, the lack of peer leadership assessment
instruments coincides with the literature review. None of the leadership assessment
instruments designed for other studies presented acceptable alternatives as the intent for
these assessment instruments focused on non-peer leadership competencies and skills. As
Loughhead and Hardy (2005) stated, peer leadership represented a relatively neglected
topic of inquiry. The lack of a peer leadership assessment instrument focused on peer
leadership competencies and skills provided an opportunity to develop an instrument to
fill this void and provide a means to collect data. However, as with any new instrument,
the validity and reliability could provide liabilities and become a weakness for this study
with no other similar instruments to compare results.
Student participation is a potential weakness as interpretation of the survey frame
of reference scenario, stem questions, and the competency questions could provide

95
confounding or multicollinearity effects in the data. Questions were developed based on a
theoretical construct derived from a literature review and analysis of an extensive
leadership assessment database. However, one frame of reference scenario, two stem
questions, and the 40 competency questions can provide a wide variance of meanings to
students. Small focus groups, a pre-pilot and pilot test, and leadership expert retranslation
of survey questions to competencies provided for mitigation of potential bias. The large
sample size helps mitigate bias.
The samples for the pilot tests and study survey resulted from one public university
of higher education. The diversity of the sample university student population appeared
limited and most students originate from a small geographic area surrounding the
university. Due to the limited scope taken by collecting data from only one university, the
universalization of the influence survey appears very limited at this time. Further studies
should collect data from a diverse array of universities in different geographic areas, from
private and other public universities, and in different cultures. This study focused on
developing a starting point to measure peer leadership competencies and skills to enhance
leadership curriculum. The uniqueness of the influence survey required a limited scope to
ensure an effective and accurate initial survey instrument.
The time of the year that the survey data collection occurred could influence results.
Both the pilot data and study data collection occurred during the fall semester. Different
results could occur if data collection occurred towards the end of the academic year when
students may have more recent experiences.
96
Summary
The methodology of this study provided for a logical and quantitative process to
examine competencies and skills needed for effective peer leadership. A literature review
and analysis of an existing leadership assessment database provided the theoretical
construct allowing development of an influence survey. The influence survey provided a
means to collect data on peer leadership competencies and skills. Quantitative analysis of
the influence survey data provided insights to significant competencies and skills needed
to effectively lead one‘s peers.
Chapter IV contains an explanation of the quantitative findings for both the ROTC
database and data obtained by the influence survey. The findings of the ROTC database
quantitative analysis provided verification of literature review findings and one possible
peer leadership competency. Chapter V discusses the significance of findings in Chapter
IV and final thoughts regarding this study.

97
CHAPTER IV: RESULTS
Chapters I, II, and III defined the scope of this study, described a literature review
of peer leadership, and defined the methodology of this study. Chapter IV provides an
analysis of the data collected to evaluate the stated hypotheses. Although mainly
quantitative, the analysis in this chapter provides many insights that educators might
utilize to enhance their understanding of peer leadership, peer-leadership pedagogy, and
leadership curriculum.
This chapter analyzes the leadership dimensions comprising the ROTC data base.
The ROTC data base provided convergent validity with the literature review while
providing an additional possible peer leadership competency. Although different in size,
scope, context, and longitudinal nature, the ROTC data base has many similarities to the
study sample. A second focus of this chapter provides insight to the development of an
influence survey. The last focus analyzes data gathered using the influence survey to
answer the two study hypotheses.
The literature review and ROTC data analysis determined the peer leadership
competencies used to define questions that represent peer leadersh3ip skills. Quantitative
analysis determined the best influence survey by verifying the resulting survey reliability
and establishing validity. Multiple regression analysis and ANOVA performed on
influence survey data provided answers to the study hypotheses. Influence survey data
analysis provides the framework for results and conclusions discussed in Chapter V.
ROTC Database Analysis
Convergent validity lends creditability and confidence to research findings. The
ROTC data base provided this study convergent validity while assisting in identifying

98
and understanding peer leadership competencies. Descriptive statistics and a reliability
analysis with deleted items of the ROTC data base allowed the identification of important
leadership competencies.
An analysis of the ROTC leader dimension means determined that the Exceeds and
Meets Standards ratings have communication, execution, mental, and physical within the
top five highest dimension means. None of the four dimensions appeared in the top five
highest averages for the lowest rating, Needs Improvement. The differences in dimension
means between the lowest and highest ratings indicate the possibility of leader
dimensions needed for success at LDAC based on dimension means.
On face validity, the leader-dimension database resembles a survey or leadership
assessment instrument. Each Cadet received assessments based on the 16 dimensions by
multiple assessors. The average of each dimension contributed to produce an overall
rating in each dimension for each Cadet. A Cronbach‘s Alpha reliability analysis based
on the 16 leader dimensions determined the leader dimensions important in the overall
and three stratifications of the data (Es, Ss, and Ns). The communication, execution,
mental, and physical leadership dimensions had the greatest impact on reliability for the
Overall, Exceeds, and Meets Standards ratings. A comparison of the rankings from the
descriptive statistics and the reliability analysis found communication, execution, mental,
and physical common to both analyses.
The commonalities between the leader dimensions identified by the literature
review and ROTC data analysis include communication (identified by both), support
(literature review) and executing (ROTC data), and work hard/ethic (literature review)
and mental (ROTC data). The reflection/feedback competency ranked third in frequency

99
citations during the literature review, but does not have a specific ROTC data
counterpart. The leader dimension of physical from the ROTC data analysis does not
correlate directly to any specific leader skill or competency identified by the literature
review, but does relate indirectly to several skills and competencies in the literature. A
comparison of the literature review and ROTC leadership assessment data identified five
possible peer leadership competencies: 1) communication, 2) mental/hard work, 3)
support, 4) reflection/feedback, and 5) physical. The five identified competencies
provided a broad theoretical framework for developing an instrument to assess peer
leadership in undergraduate students.
Influence Survey
The lack of existing instruments measuring peer leadership competencies and skills
necessitated the development of an influence survey. The literature review and
convergent validity of the ROTC data base provided the constructs needed to develop an
instrument focused on peer leadership. A pilot test verified reliability and a principle
component analysis confirmed the validity of the instrument. After verifying the survey
reliability and validity, data gathered then screened and checked for normality established
the needed analyses sample. An analysis of the gathered data determined the final
influence survey model needed for inferential parametric statistical methods to analyze
study hypotheses.
Chapter III provided details on the initial survey development, pre-pilot, and pilot
tests needed to develop the final survey used to gather study data. Chapter IV focuses on
the reliability and validity of the final influence survey, the characteristics of the data, and

100
the findings produced by gathered data statistical analysis. Data consistency and
normality verification allowed the use of inferential parametric analyses.
Data Screening and Normality
An initial review of data ensured all responses ranged between one and five based
on the Likert scaled used to measure participant responses. Additional reviews conducted
on the five theoretical constructs consisted of summing question responses that defined
each peer leadership competency then ensuring the total was within the appropriate
range. Initial normality verification occurred by examining the skewness and kurtosis of
each survey question and the summed leadership competencies.
Skewness and kurtosis verification included a visual analysis of frequency
distribution compared to a superimposed normal curve provided by SPSS. Additional
verification of skewness and kurtosis indicated normality as ratings for each construct
ranged within acceptable standards -2 to 2 (Field, 2009). Later, normality re-verification
occurred using the same process on the four identified principle components determined
through exploratory principle component analysis. Frequencies of the four principle
components and Overall dependent variable indicated a negative skewness providing
evidence of students rating questions higher (4s and 5s for independent variables, 9s and
10s for the dependent variable) rather than lower (1s and 2s). The negative skewness
coincides with the mean of the Overall dependent variable of 8.2 indicating that students
rated their peer influence experience high creating a ‗halo‘ effect, common when
favorably rating someone. The Kaiser-Meyer-Olkin (KMO) measure verified the sample
size (KMO = .922) as superb according to Field (2009).
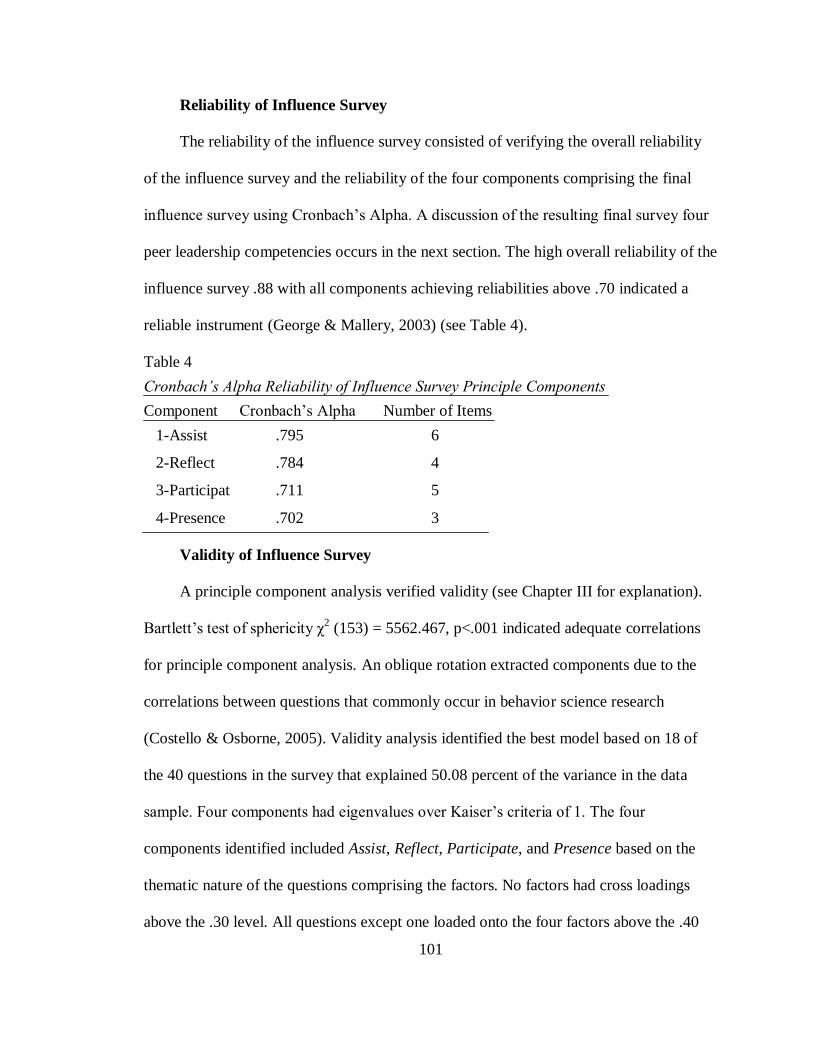
101
Reliability of Influence Survey
The reliability of the influence survey consisted of verifying the overall reliability
of the influence survey and the reliability of the four components comprising the final
influence survey using Cronbach‘s Alpha. A discussion of the resulting final survey four
peer leadership competencies occurs in the next section. The high overall reliability of the
influence survey .88 with all components achieving reliabilities above .70 indicated a
reliable instrument (George & Mallery, 2003) (see Table 4).
Table 4
Cronbach’s Alpha Reliability of Influence Survey Principle Components
Component Cronbach‘s Alpha Number of Items
1-Assist .795 6
2-Reflect .784 4
3-Participat .711 5
4-Presence .702 3
Validity of Influence Survey
A principle component analysis verified validity (see Chapter III for explanation).
Bartlett‘s test of sphericity χ2 (153) = 5562.467, p<.001 indicated adequate correlations
for principle component analysis. An oblique rotation extracted components due to the
correlations between questions that commonly occur in behavior science research
(Costello & Osborne, 2005). Validity analysis identified the best model based on 18 of
the 40 questions in the survey that explained 50.08 percent of the variance in the data
sample. Four components had eigenvalues over Kaiser‘s criteria of 1. The four
components identified included Assist, Reflect, Participate, and Presence based on the
thematic nature of the questions comprising the factors. No factors had cross loadings
above the .30 level. All questions except one loaded onto the four factors above the .40

102
level as recommended for interpretation according to Stevens (2002). The one question
not loading above .40 loaded above .30 allowing its inclusion in the validity analysis.
Each component had several strong (above .70) loadings after rotation further confirming
the validity of the influence survey model (see Table 6, next page).
Peer Leadership Competency Hypothesis Analysis
Multiple regression provided insight to significant peer leadership competencies
based on the four component model identified through validity analyses. ANOVA
determined the significance between college levels and gender. Multiple regression
analysis determined the significant peer leader competencies and the degree of
importance each competency has in predicting an overall influence rating. Regression
also analyzed significant peer leadership competencies based upon gender. The low
sample sizes of the various races in the sample prevented an analysis of peer
competencies. Multiple regression analysis indicated significant differences exist
between competencies.
Multiple Regression Analysis of Peer Leadership Competencies
Multiple regression analysis identified each of the four components as significant in
explaining the resulting model. The resulting multiple regression model explained 50.80
percent of the variance in the data sample (see Table 5).
Table 5
Regression Model Summary of the Constant and Four Predictors: Assist,
Participate, Reflect, and Presence
Standard Error of the
R R Square Adjusted R Square Estimate
.713 .508 .506 .939

103

104
The Durbin-Watson measure analyzed the data for multicollinearity and found the
sample rating of 1.880 very close to 2.000 indicating the lack of multicollinearity; results
less than 1 or greater than 3 raises concern regarding multicollinearity in a data sample
(Field, 2009). The average Variance Inflation Factor (VIF) for each principle component
(1.74) also indicated a lack of multicollinearity. Myers (1990) suggested that an average
VIF value of 10 or greater raises cause for concern.
Table 7 indicates significance for the multiple regression model at the .01 level
and that there is less than 1 percent chance that the F-ratio of this model would occur due
to chance.
Table 7
Multiple Regression Source Table for Peer Leadership Competencies
Source Sum of Squares df Mean Squares F observed
(Variance)
Regression 869.083 4 217.271 246.384
Residual 841.274 954 .882
Total 1710.357 958
F critical (.01, 4, 954) = 3.34
The significance of the F-ratio allows rejection of the first hypothesis:
H1 No specific leadership competencies exist that enhance peer leadership.
ANOVA results also indicated significance of the regression model at predicting the
overall influence experience than the mean participant response.
All multiple regression model parameters indicated significance and resulted in the
following predictive model: y = .569 + .114(Assist) + .063(Reflect) + .147(Participate) +
.082(Presence). All competencies positively related to the outcome variable. The order of
importance for identified peer leadership competencies included: 1) Participate, 2) Assist,
3) Presence, and 4) Reflect (see Table 8). Casewise diagnostics

105
Table 8
Summary of Multiple Regression Analysis for Peer Leadership Competencies
Competency B SE B
Constant .569* .248
Assist .114** .012 .307
Reflect .063** .016 .126
Participate .147** .015 .303
Presence .082** .014 .147
(n=959) *p<.05 **p<.001
analyzing extreme cases identified 39 cases or 4.13 percent (39/945), less than the
expected 5 percent mitigating the potential bias from extreme cases and indicating a
good-fit model for the sample (Field, 2009). Standardized beta coefficients agreed with
unstandardized coefficients except for the Assist and Participate competencies resulting
in a slightly different importance ranking. Generalization of the model appears very good
with only 2 percent of the variance not explained (R square - Adjusted R square).
However, this model represents a specific population and its generalization remains
unknown.
Explaining 50.80 percent of the variance may appear low, but within behavioral
sciences and the challenge of predicting human behavior with extraneous variables, an r2
of .508 represents a large effect according to Cohen (1988). The large effect
determination results from Cohen's effect size (EF) index of f2= r
2/(1
- r
2). Cohen
considered An f2 greater than .35 as a large effect within the behavioral sciences.
ANOVA and Multiple Regression Analysis Based on Gender
ANOVA between male and female peer leadership competencies identified
significant differences between genders (Table 9).

106
Table 9
Mean, Standard Deviations, and ANOVA Analysis for Peer Leadership Competencies Based
on Gender Gender Peer Leadership Mean Standard F p
Competency Deviation
Female Assist 23.86 3.55 31.11 .000
Male 22.56 3.67
Female Reflect 16.06 2.59 19.21 .000
Male 15.32 2.66
Female Participate 20.82 2.68 29.06 .000
Male 19.89 2.67
Female Presence 12.07 2.39 32.64 .000
Male 11.20 2.36
Multiple regression analysis by gender provided insight to important peer
leadership competencies for each gender. The sample survey had a higher percentage of
females (62 percent) but had an adequate sample of males (386) to allow ANOVA and
multiple regression analysis of peer leadership competencies. Regression analysis
comparing the four leadership competencies of male and female participants produced a
significant model (see Table 10).
Table 10
Multiple Regression Source Tables for Male and Female Participants
Source Sum of Squares df Mean Squares F observed
(Variance)
Male Female Male Female Male Female Male Female
Regression 378.276 532.825 4 4 94.569 133.206 83.846 169.154
Residual 428.597 497.690 380 632 1.128 .787
Total 806.873 1030.515 384 636
F critical (.01, 4, 380) = 3.37 - Male, F critical (.01, 4, 632) = 3.83 – Female

107
The multiple-regression model of male and female participants for the four peer
leadership competencies indicated significant contributions of competencies to the
regression model (see Table 11). The peer leadership competencies in order of
Table 11
Summary of Multiple Regression Analysis for Male and Female Peer Leadership
Competencies
Competency B SE B
Male Female Male Female Male Female
Constant .448 .721* .425 .296
Assist .118** .101** .020 .013 .308 .289
Reflect .079* .054* .027 .018 .150 .112
Participate .128** .170** .025 .017 .250 .373
Presence .104** .065** .024 .015 .173 .124
(n=385 for Male, n=637 for Female)
*p<.01 **p<.001
importance for both male and females included: (a) Participate, (b) Assist, (c) Presence,
and (d) Reflect. The ranking importance of the four competencies for separate gender
samples reflects the overall sample rank ordering.
The multiple-regression model for male participants explained 46.90 percent of
the variance in the male sample population, less than the overall regression model (50.80
percent). The multiple-regression model for female participants explained 51.70 percent
of the variance in the female sample population, more than the overall regression model
(50.80 percent) and male regression model (46.90 percent-see Table 12).
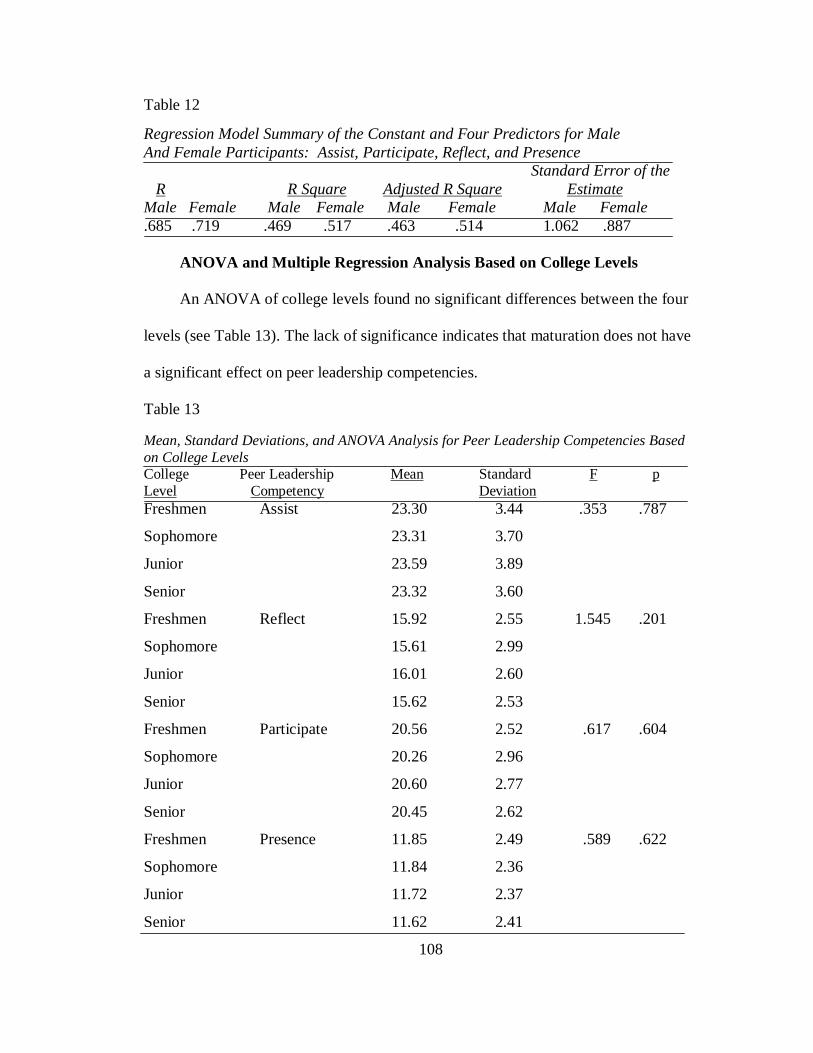
108
Table 12
Regression Model Summary of the Constant and Four Predictors for Male
And Female Participants: Assist, Participate, Reflect, and Presence
Standard Error of the
R R Square Adjusted R Square Estimate
Male Female Male Female Male Female Male Female
.685 .719 .469 .517 .463 .514 1.062 .887
ANOVA and Multiple Regression Analysis Based on College Levels
An ANOVA of college levels found no significant differences between the four
levels (see Table 13). The lack of significance indicates that maturation does not have
a significant effect on peer leadership competencies.
Table 13
Mean, Standard Deviations, and ANOVA Analysis for Peer Leadership Competencies Based
on College Levels College Peer Leadership Mean Standard F p
Level Competency Deviation
Freshmen Assist 23.30 3.44 .353 .787
Sophomore 23.31 3.70
Junior 23.59 3.89
Senior 23.32 3.60
Freshmen Reflect 15.92 2.55 1.545 .201
Sophomore 15.61 2.99
Junior 16.01 2.60
Senior 15.62 2.53
Freshmen Participate 20.56 2.52 .617 .604
Sophomore 20.26 2.96
Junior 20.60 2.77
Senior 20.45 2.62
Freshmen Presence 11.85 2.49 .589 .622
Sophomore 11.84 2.36
Junior 11.72 2.37
Senior 11.62 2.41
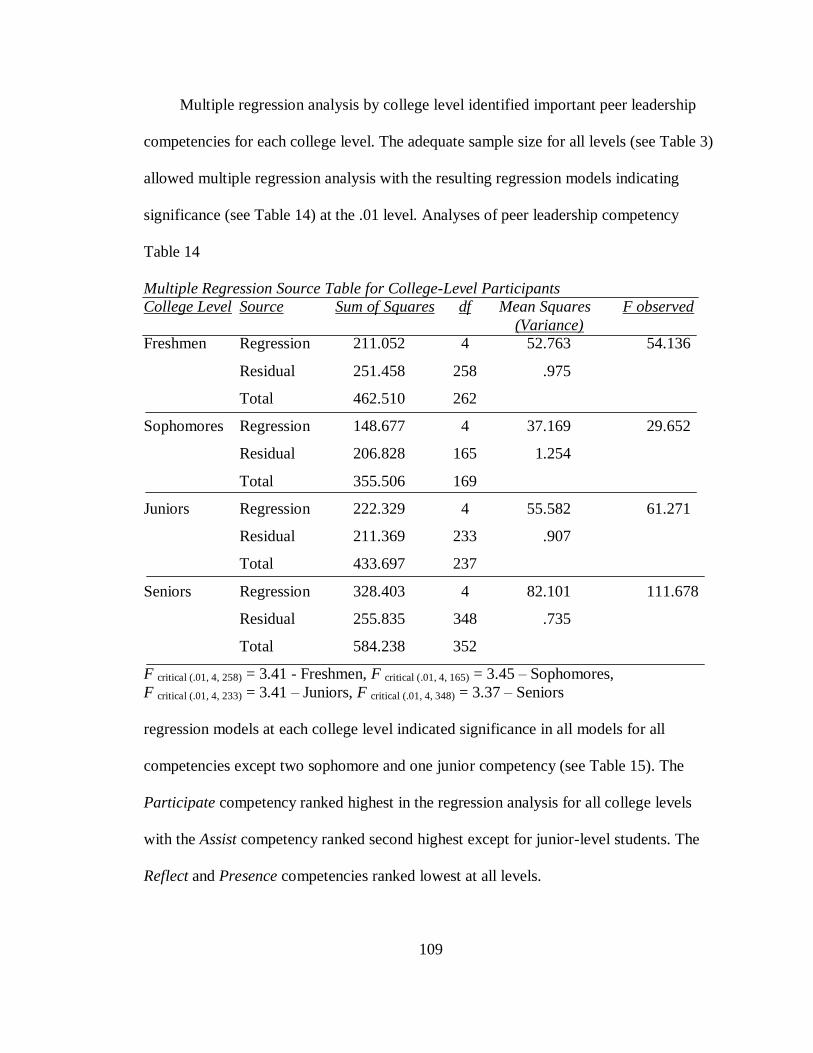
109
Multiple regression analysis by college level identified important peer leadership
competencies for each college level. The adequate sample size for all levels (see Table 3)
allowed multiple regression analysis with the resulting regression models indicating
significance (see Table 14) at the .01 level. Analyses of peer leadership competency
Table 14
Multiple Regression Source Table for College-Level Participants
College Level Source Sum of Squares df Mean Squares F observed
(Variance)
Freshmen Regression 211.052 4 52.763 54.136
Residual 251.458 258 .975
Total 462.510 262
Sophomores Regression 148.677 4 37.169 29.652
Residual 206.828 165 1.254
Total 355.506 169
Juniors Regression 222.329 4 55.582 61.271
Residual 211.369 233 .907
Total 433.697 237
Seniors Regression 328.403 4 82.101 111.678
Residual 255.835 348 .735
Total 584.238 352
F critical (.01, 4, 258) = 3.41 - Freshmen, F critical (.01, 4, 165) = 3.45 – Sophomores,
F critical (.01, 4, 233) = 3.41 – Juniors, F critical (.01, 4, 348) = 3.37 – Seniors
regression models at each college level indicated significance in all models for all
competencies except two sophomore and one junior competency (see Table 15). The
Participate competency ranked highest in the regression analysis for all college levels
with the Assist competency ranked second highest except for junior-level students. The
Reflect and Presence competencies ranked lowest at all levels.
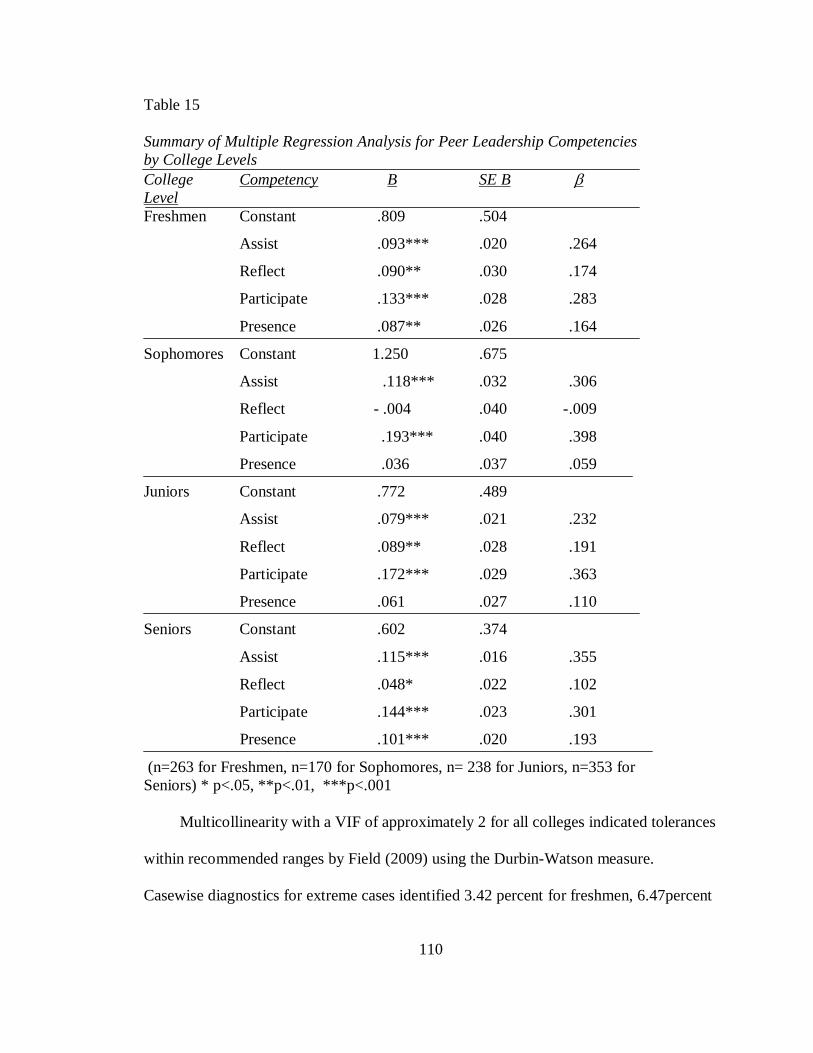
110
Table 15
Summary of Multiple Regression Analysis for Peer Leadership Competencies
by College Levels
College Competency B SE B
Level
Freshmen Constant .809 .504
Assist .093*** .020 .264
Reflect .090** .030 .174
Participate .133*** .028 .283
Presence .087** .026 .164
Sophomores Constant 1.250 .675
Assist .118*** .032 .306
Reflect - .004 .040 - .009
Participate .193*** .040 .398
Presence .036 .037 .059
Juniors Constant .772 .489
Assist .079*** .021 .232
Reflect .089** .028 .191
Participate .172*** .029 .363
Presence .061 .027 .110
Seniors Constant .602 .374
Assist .115*** .016 .355
Reflect .048* .022 .102
Participate .144*** .023 .301
Presence .101*** .020 .193
(n=263 for Freshmen, n=170 for Sophomores, n= 238 for Juniors, n=353 for
Seniors) * p<.05, **p<.01, ***p<.001
Multicollinearity with a VIF of approximately 2 for all colleges indicated tolerances
within recommended ranges by Field (2009) using the Durbin-Watson measure.
Casewise diagnostics for extreme cases identified 3.42 percent for freshmen, 6.47percent
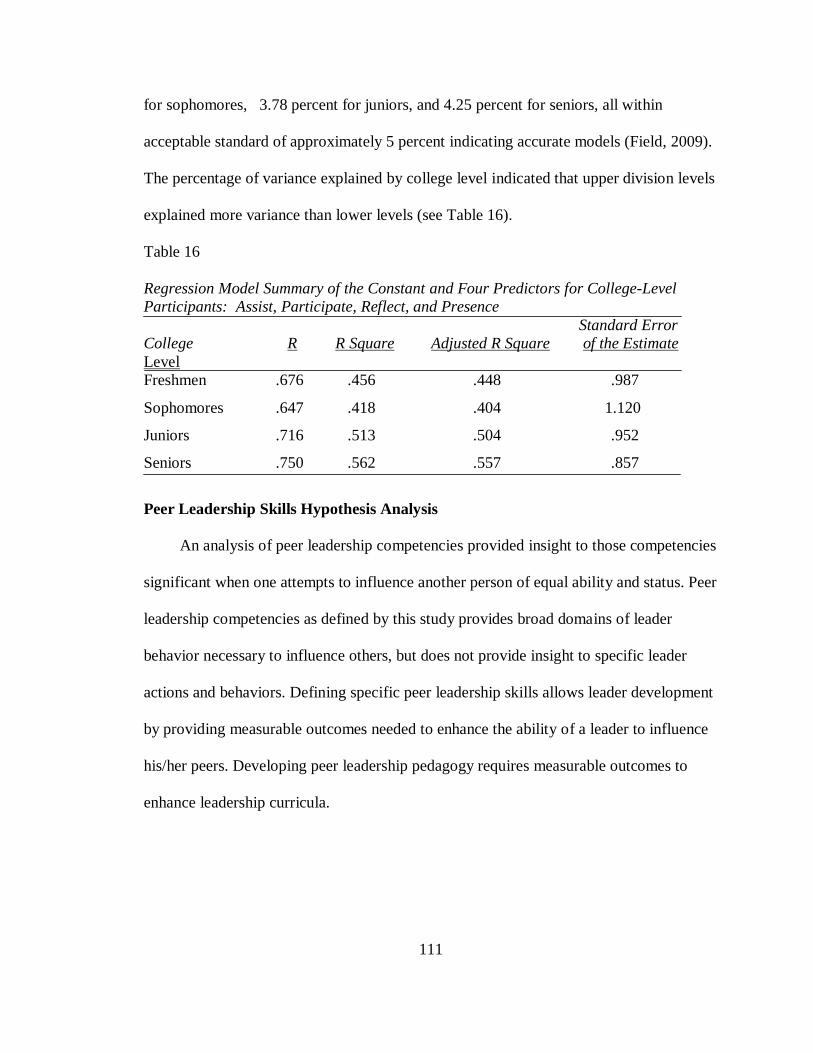
111
for sophomores, 3.78 percent for juniors, and 4.25 percent for seniors, all within
acceptable standard of approximately 5 percent indicating accurate models (Field, 2009).
The percentage of variance explained by college level indicated that upper division levels
explained more variance than lower levels (see Table 16).
Table 16
Regression Model Summary of the Constant and Four Predictors for College-Level
Participants: Assist, Participate, Reflect, and Presence
Standard Error
College R R Square Adjusted R Square of the Estimate
Level
Freshmen .676 .456 .448 .987
Sophomores .647 .418 .404 1.120
Juniors .716 .513 .504 .952
Seniors .750 .562 .557 .857
Peer Leadership Skills Hypothesis Analysis
An analysis of peer leadership competencies provided insight to those competencies
significant when one attempts to influence another person of equal ability and status. Peer
leadership competencies as defined by this study provides broad domains of leader
behavior necessary to influence others, but does not provide insight to specific leader
actions and behaviors. Defining specific peer leadership skills allows leader development
by providing measurable outcomes needed to enhance the ability of a leader to influence
his/her peers. Developing peer leadership pedagogy requires measurable outcomes to
enhance leadership curricula.

112
Multiple Regression Analysis of Peer Leadership Skills
Multiple regression analysis conducted on each peer leadership competency defined
in this study identified the most important peer leadership skills. All four regression
models defined by peer leadership skills indicated significance. Table 17 indicates
Table 17
Multiple Regression Source Table for Peer Leadership Skills
Competency Source Sum of Squares df Mean Squares F observed
(Variance)
Assist Regression 720.195 6 120.032 108.664
Residual 1105.725 1001 1.105
Total 1825.920 1007
Participate Regression 716.681 5 143.336 130.737
Residual 1097.470 1001 1.096
Total 1814.151 1006
Reflect Regression 540.151 4 135.038 105.686
Residual 1298.165 1016 1.278
Total 1838.315 1020
Presence Regression 314.832 3 104.944 68.907
Residual 1554.959 1021 1.523
Total 1869.791 1024
F critical (.01, 6, 1001) = 2.82 - Assist, F critical (.01, 5, 1001) = 3.04 –Participate,
F critical (.01, 4, 1016) = 3.34 – Reflect, F critical (.01, 3, 1021) = 3.80 – Presence
multiple regression models significant at the .01 level and that there exists less than 1
percent chance that the F-ratio of these models would occur due to chance. The average
Durbin-Watson measure for multicollinearity (1.9035), close to the 2.0 desired level,
indicated the lack of multicollinearity in the data (Field, 2009). The average VIF for each
peer leadership skill (1.478) also indicated a lack of multicollinearity (Myers, 1990).

113
The significance of the F-ratio for the four regression models allows rejection of the
second hypothesis:
H2 No specific leadership skills exist that enhance peer leadership.
ANOVA results also indicated significance of the regression model and provided a better
prediction of the overall influence experience than the mean participant response for peer
leadership skills.
All peer leadership skills appear significant at the .001 level except for three skills
(one significant at the .01 level, two significant at the .05 level) indicating that all skills
contributed significantly to each peer leadership competency regression model (see Table
18). Table 18 also provides the importance of each peer leadership skill for each peer
Table 18
Summary of Multiple Regression Analysis for Peer Leadership Skills by
Competency
Competency Skill B SE B
Assist Constant 2.807*** .215
Q29_NHW .197*** .040 .138
Q25_MHW .208*** .049 .130
Q26_SUPT .289*** .054 .174
Q27_REFL .138** .047 .087
Q19_SUPT .153*** .043 .102
Q30_REFL .386*** .049 .239
Participate Constant 1.896*** .253
Q2_COMM .343*** .050 .188
Q3_COMM .316*** .048 .189
Q4_SUPT .231*** .049 .138
Q5_MHW .389*** .043 .253
Q11_SUPT .254*** .045 .150
(continued)

114
Competency Skill B SE B
Reflect Constant 3.872*** .214
Q21_REFL .260*** .054 .166
Q22_REFL .150* .063 .090
Q23_REFL .367*** .053 .232
Q9_REFL .318*** .045 .210
Presence Constant 5.427*** .195
Q34_PHY .393*** .051 .270
Q37_PHY .200*** .048 .146
Q39_PHY .089* .038 .074
(n=1008 for Assist, n=1007 for Participate, n= 1021for Reflect, n=1025 for Presence)
* p<.05, **p<.01, ***p<.001
Note: see Table 5 for question descriptions.
leadership competency. Casewise diagnostics for each competency analyzing extreme
cases resulted in outcomes less than the expected 5 percent (ranging from 4.02 to 4.76
percent) mitigating the potential bias from extreme cases and indicating good-fit models
for the samples (Field, 2009). Standardized beta coefficients generally agreed with
unstandardized coefficients with few exceptions.
The peer leadership skills comprising the Assist, Participate, Reflect, and Presence
peer- leadership components accounted for 39.40, 39.50, 29.40, and 16.80 percent
respectively of the variance in the data samples (see Table 19). Generally, the
Table 19
Regression Model Summaries of the Peer Leadership Competencies Based on Peer
Leadership Skills: Assist, Participate, Reflect, and Presence
Standard Error
Competency R R Square Adjusted R Square of the Estimate
Assist .628 .394 .391 1.051
Participate .629 .395 .392 1.047
Reflect .542 .294 .291 1.130
Presence .410 .168 .166 1.234
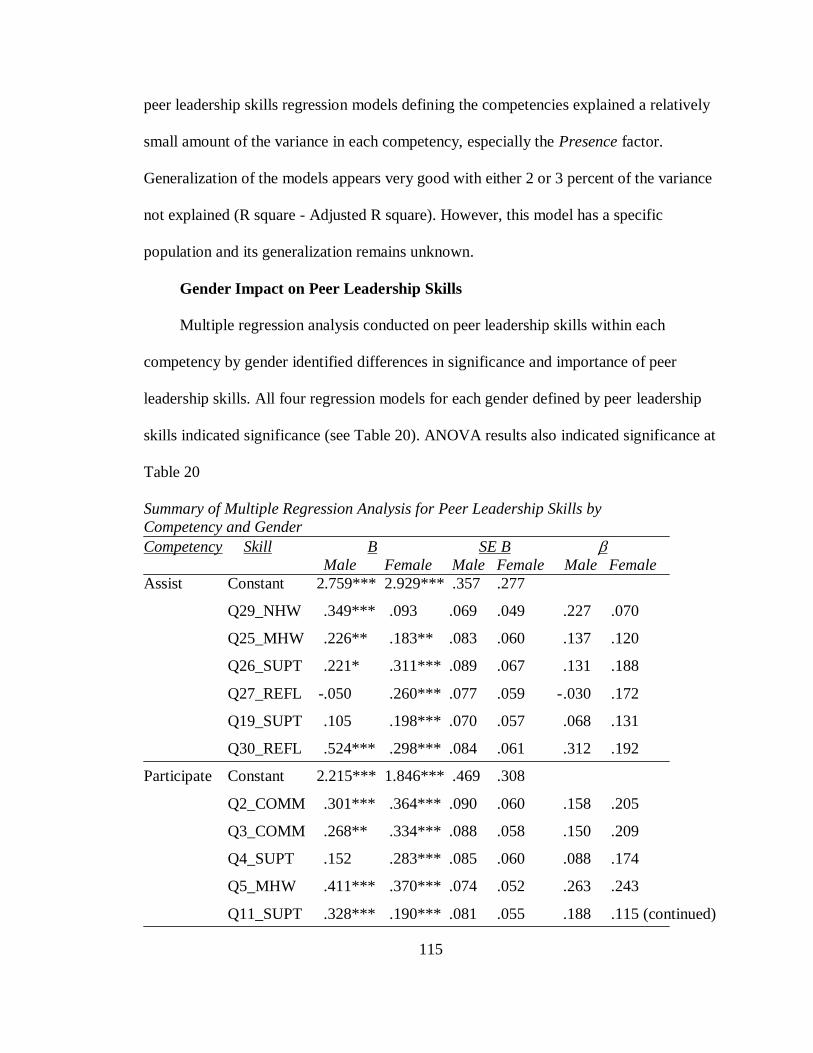
115
peer leadership skills regression models defining the competencies explained a relatively
small amount of the variance in each competency, especially the Presence factor.
Generalization of the models appears very good with either 2 or 3 percent of the variance
not explained (R square - Adjusted R square). However, this model has a specific
population and its generalization remains unknown.
Gender Impact on Peer Leadership Skills
Multiple regression analysis conducted on peer leadership skills within each
competency by gender identified differences in significance and importance of peer
leadership skills. All four regression models for each gender defined by peer leadership
skills indicated significance (see Table 20). ANOVA results also indicated significance at
Table 20
Summary of Multiple Regression Analysis for Peer Leadership Skills by
Competency and Gender
Competency Skill B SE B
Male Female Male Female Male Female
Assist Constant 2.759*** 2.929*** .357 .277
Q29_NHW .349*** .093 .069 .049 .227 .070
Q25_MHW .226** .183** .083 .060 .137 .120
Q26_SUPT .221* .311*** .089 .067 .131 .188
Q27_REFL -.050 .260*** .077 .059 - .030 .172
Q19_SUPT .105 .198*** .070 .057 .068 .131
Q30_REFL .524*** .298*** .084 .061 .312 .192
Participate Constant 2.215*** 1.846*** .469 .308
Q2_COMM .301*** .364*** .090 .060 .158 .205
Q3_COMM .268** .334*** .088 .058 .150 .209
Q4_SUPT .152 .283*** .085 .060 .088 .174
Q5_MHW .411*** .370*** .074 .052 .263 .243
Q11_SUPT .328*** .190*** .081 .055 .188 .115 (continued)

116
Competency Skill B SE B
Male Female Male Female Male Female
Reflect Constant 3.438*** 4.247*** .360 .270
Q9_REFL .325*** .283*** .078 .069 .200 .187
Q21_REFL .196* .114 .091 .080 .121 .071
Q22_REFL .211* .314*** .103 .069 .122 .205
Q23_REFL .461*** .301*** .086 .056 .281 .207
Presence Constant 5.152*** 5.758*** .331 .251
Q34_PHY .431*** .316*** .081 .068 .291 .217
Q37_PHY .168* .237*** .077 .064 .118 .177
Q39_PHY .139* .062 .063 .050 .110 .054
(n=379 for Male Assist, n=617 for Female Assist, n=374 for Male Participate, n=621 for
Female Participate, n= 380 for Male Reflect, n=631 for Female Reflect, n=382 for Male
Presence, n=631 for Female Presence)
* p<.05, **p<.01, ***p<.001
Note: see Table 5 for question descriptions.
the .001 level of all regression models and provided a better prediction of the Overall
influence rating than the mean participant response for peer leadership skills for each
gender. Peer leadership skills between genders varied in levels of significance to the
regressions of their peer leadership competency.
College Level Impact on Peer Leadership Skills
The influence of maturation presents potential bias by college levels. Regression
using peer leadership skills by college level for each peer leadership competency
provided insight to possible maturation effects. All college-level
regression models indicated significance at the .01 level (see Table 21). Peer leadership
skills in each level provide discussion points in Chapter V.

117
Table 21
Regression Coefficient Analysis for Peer Leadership Skills by Competency and
College Levels
Competency Skill B
Freshmen Sophomores Juniors Seniors
Assist Constant 3.012*** 2.618*** 3.188*** 2.769***
Q29_NHW .175* .083 .187* .258***
Q25_MHW .211* .212 .187 .197*
Q26_SUPT .229* .230 .314** .378***
Q27_REFL .175 .171 .082 .085
Q19_SUPT .047 .358** .199 .118
Q30_REFL .484*** .377** .313** .333***
Participate Constant 2.243*** 2.015** 1.951*** 2.079***
Q2_COMM .283** .473*** .340** .288***
Q3_COMM .532*** .261* .319** .174*
Q4_SUPT .006 .414** .163 .368***
Q5_MHW .401*** .242 .313*** .473***
Q11_SUPT .218* .130 .410*** .172*
Reflect Constant 3.920*** 5.095*** 3.348*** 3.551***
Q9_REFL .306** .332** .310*** .297***
Q21_REFL .085 -.058 .525*** .448***
Q22_REFL .198 .215 - .022 .171
Q23_REFL .479*** .319 .422*** .257***
Presence Constant 5.584*** 6.230*** 5.549*** 4.992***
Q34_PHY .361*** .311* .381*** .400***
Q37_PHY .091 .009 .203* .343***
Q39_PHY .188* .175 .096 .038
(n=258 for Freshmen Assist, n=160 for Sophomore Assist, n=232 for Junior Assist,
n=344 for Senior Assist, n=248 for Freshmen Participate, n=167 for Sophomore
Participate, n=230 for Junior Participate, n=348 for Senior Participate, n= 262 for
Freshmen Reflect, n=167 for Sophomore Reflect, n=230 for Junior Reflect, n=350 for
Senior Reflect, n=263 for Freshmen Presence, n=167 for Sophomore Presence, n=234 for
Junior Presence, n=347 for Senior Presence)
* p<.05, **p<.01, ***p<.001 Note: see Table 5 for question descriptions.
118
Summary
Chapter IV provided an analysis using inferential parametric statistical methods on
data gathered after developing an instrument to measure peer leadership skills and
competencies. The verified instrument validity and reliability allowed for a degree of
confidence in the multiple regression analyses of various sample aspects. Results of the
multiple regression analyses generally confirmed the theoretical constructs determined
through the literature review and analysis of the ROTC data base. The results also
provided information needed to reject the two study hypotheses.
Chapter V provides a detailed discussion of the results determined in Chapter IV
based on the methodology defined in Chapter III. A primary focus in Chapter V focuses
on the analyses of each peer leadership competency and the peer leadership skills that
comprise each competency discussing the causation of significance or lack of
significance to the analyzed peer leadership models. A final focus of Chapter V provides
limitations, summaries, conclusions, and recommendations for future studies.

119
CHAPTER V: DISCUSSION
This study analyzed the competencies and skills associated with effective peer
leadership. A literature review summarized in Chapter II and an analysis of an existing
leadership assessment data base conducted in Chapter IV identified peer leadership
competencies that further identified peer leadership skills. The results of Chapter III and
IV produced an influence survey that allowed the collection of data consisting of
undergraduate students at a comprehensive university. Analysis of the undergraduate
sample using inferential parametric statistical methods provided the needed proof to
reject this study's two hypotheses.
Chapter V described a detailed analysis of the results found in Chapter IV. The first
focus of Chapter V discusses the development of the influence survey needed to collect
data and for an adequate and reliable sample. The second focus of this chapter provides
insights to the peer leadership competencies in regard to the overall sample, possible
gender differences, and an analysis of the four undergraduate college levels. A discussion
of peer leadership skills resulted from the analysis of peer leadership competencies.
Finally, Chapter V provides implications to the literature review, future research
opportunities, methodological limitations, and limitations.
Development of an Influence Survey
Lack of a reliable and valid instrument that measured student perceptions regarding
peer leadership competencies and skills led to the development of an influence survey.
Many authors (Brown, 1972; Astin, 1996; Adelman, 2002; Komiveset al., 2006)
conducted research involving peer leadership but did not quantitatively measure peer
leadership competencies and skills. Models involving peer leadership evolved from

120
grounded research and research conducted in non-scholastic settings, but no survey that
quantitatively measured peer leadership in any manner appear to exist. The need to gather
data on undergraduate student perceptions regarding peer leadership required developing
an instrument that accurately measured student perceptions of peer leadership. An
accurate instrument must have adequate reliability and validity based on a theoretical
construct.
Reliability and validity for the influence survey resulted from an iterative and
progressive process focused on a theoretical construct. The five competencies determined
from the literature review and analysis of the ROTC data base provided the framework to
develop survey questions. The broad constructs and focus population of undergraduate
students for this study required the use of initial, small focus groups to develop proposed
survey questions. Pilot studies provide extremely valuable insight to every aspect of the
survey including the format, font, size of font, color of paper, shading and non-shading of
questions, and most importantly, the wording and meaning of questions (Oppenheim,
1992).
A pre-pilot study consisting of 16 undergraduate students verified the format of the
survey, the readability of the survey questions, and ensured that students understood the
frame of reference scenario for the survey. The pre-pilot study could not validate
reliability or validity due to the small sample size, but the intent of the pre-pilot study
focused on other non-statistical aspects to ensure development of a survey that students
found appealing and could accurately answer questions. After adjusting the survey from
comments emerging from the pre-pilot study, a retranslation process occurred that
provided greater clarity to survey questions and a more accurate pilot study.

121
A retranslation process occurred with 15 faculty and leadership students who
associated each of the 40 survey questions with the five peer competencies. The
retranslation process provided information regarding the wording of the questions and
how others viewed the question in relationship to the five competencies. The participants
included nine faculty members who had extensive knowledge regarding leadership and
provided valuable insight from a leadership perspective. The retranslation process
allowed further adjustments to the survey that resulted in a clearer, more focused version
for pilot testing.
A pilot test of the adjusted influence survey consisted of 102 undergraduate
students in leadership studies courses. The leadership studies courses provided a
representative demographic distribution of undergraduate students (see Table 1, Chapter
III). The pilot study provided for an analysis of the demographic data, the process of
collecting the data, the time students took to complete the influence survey, and an
opportunity to determine unexpected process and content outcomes. Students took
approximately five minutes to complete the survey; there were no significant questions
regarding the content or structure of questions, and demographic data appeared adequate.
Data entered into an Excel spreadsheet provided the means to import the data into SPSS
for analysis.
An exploratory principle component analysis identified eight principle components
with eigenvalues greater than 1.0. However, the eight principle components had multiple
cross-loadings at the .4 level and identified components did not identify meaningful peer
leadership themes nor did the components support the five theoretical constructs. An
analysis of the correlations between questions using a .3 or greater relationship

122
eliminated multiple questions that explained a very limited amount of variance in the data
(Field, 2009). The physical theoretical construct questions correlated weakly with all
other questions and had two distinct components. One physical component focused on
the presence of the person the other the physical attributes of the person (the physical
condition of the person, their personal appearance). Multiple principle component models
emerged based on question correlations, principle component loadings, and cross-loading
between components.
The final model used for data analysis consisted of 18 questions representing four
peer leadership components: (a) Assist, (b) Participate, (c) Reflect, and (d) Presence. The
Presence component questions did not have strong (greater than .3) correlations with the
majority of questions. Given the significance of the Physical component identified during
the ROTC data base analysis, the Physical component represented an aspect of interest
for peer leadership and was included in the final model. The final model had no cross-
loadings at the .3 level and identified four distinct peer leadership competencies that
explained 50.80 percent of the variance in the sample. The resulting competencies related
to but also differed from the original five theoretical constructs identified by the literature
review and ROTC data base analysis due to the nature of peer leadership and behavioral
sciences research.
It is difficult to account for the multitude of variables that impact leadership
research. To illustrate the difficulty in accounting for all variables, The Global
Leadership Institute at the University of Nebraska-Lincoln conducted a meta-analysis of
leadership intervention effectiveness over the past 100 years (Avolio, 2005). The results
indicated that a leadership intervention program has approximately a 67 percent chance

123
of effectiveness due to the many variables impacting any program and the difficulty in
measuring outcomes. This study analyzed peer leadership and had defined, yet broad
constructs. Given the nature of leadership research, the four components identified in this
study represent peer competencies that further define the theoretical constructs and allow
for quantitative analysis to answer study hypotheses.
Before conducting reliability and validity analysis, the data must have a normal
distribution. A frequency analysis conducted on the questions comprising the four
competencies indicated a normal distribution. The skewness and kurtosis for each
component and the overall dependent variable ranged within the recommended tolerances
of 2 to -2. A visual inspection of frequencies with a normal curve superimposed onto the
frequency distribution indicated a normal and slightly negative skewness.
A survey must have adequate reliability before determining the content and
construct validity. The overall reliability for the influence survey was .880. The reliability
of each principle component was above the recommend .70 indicating good reliability for
the influence survey (George & Mallery, 2003). Exploratory principle component
analysis identified four peer leadership components with each component having strong
loadings (at least two questions per component loading above .70) and no cross-loadings
above .30.
Discussion of Peer Leadership Competency Hypothesis
An analysis of peer leadership competencies using ANOVA and multiple regression
analysis indicated all competencies made significant contributions to the regression
model and allowed rejection of study‘s first hypothesis regarding peer competencies. The
Participate competency emerged as the most significant based on regression coefficients

124
(see Table 8, Chapter IV). Analyzing the questions comprising the Participate
competency indicated that peers prefer peer leaders who communicate effectively, listen
effectively, encourage them, and included them when making decisions. The second most
significant competency, the Assist competency, focused on peers who demonstrated a
positive attitude, provided assistance in defining goals or making decisions, and made a
sincere effort to reach consensus with the peer. The third most significant competency,
Presence, focused on the peer leader having a physical presence with the peer. The least
significant competency, Reflect, consisted of peer leader actions that caused the
influenced peer to analyze the situation, learn from the situation, and reflect and meditate
to better understand the situation.
The Participate and Assist competencies have a common theme of working with
peers and offering supportive, helpful behaviors. Both competencies suggest that peers
can influence other peers by relational behaviors rather than task or conceptual behaviors.
Interpersonal skills appear important when attempting to influence others of equal
abilities and status. Komives et al. (2002, 2005, & 2006) suggested similar finding in
their grounded studies that defined and discussed the Leadership Identity Development
(LID) model. Effects of peer influence emerged in stage two of the six stages and
appeared as more important in stages three through six. Although Komives et al.
discussed peer influences, the studies did not define specific peer competencies or skills.
The competencies and skills defined in this study provide greater clarity and better define
peer leadership in the LID context.
The Presence competency, as discussed earlier, did not correlate with other survey
questions, but did emerge as a competency of interest based on the ROTC data base
125
analysis. The importance of the Presence competency indicates that effective peer
leadership results from the mere presence of the peer leader. Leaders, regardless of peer
status or in positions of legitimate authority, increase their ability to influence others with
their physical presence. The U.S. Army has long recognized the importance of physical
presence to leadership and emphasizes this competency during leader development. The
ability to project a confident, physical presence when attempting to influence and lead
soldiers creates a desired leader quality that increases the leader‘s ability to gain
influence. This study conducted in a university context supports the Army‘s views on
leader development regarding the physical presence of leaders and indicates that leading
peers may generalize to different contexts.
The least influential peer leadership competency, Reflect, focused on the situation,
not the leader or the peer. The Reflect competency represents the only competency that
does not focus on the leader or peer. The emphasis of the situation rather than the leader
indicates the possibility that peer leadership is more relational and not dependent on
situational variables.
Adelman (2002) cited communication and interpersonal skills, self-awareness and
confidence, a sense of civic and social responsibility, critical thinking, and reflective
abilities as important aspects of peer leadership. The competencies identified by this
study generally agree with Adelman, but better define the peer leader influences by
defining specific competencies and skills. An analysis of the effects gender and college
levels have on peer leadership competencies provided insight to possible maturation
influences and bias.
126
Gender Influences on Peer Leadership Competencies
ANOVA and multiple regression analysis based on gender identified significant
differences among all four peer leadership competencies. Female means for all peer
leadership competencies compared to male means indicated higher ratings by females of
peer leadership questions (see Table 9, Chapter IV). The consistent higher averages for
all peer competency ratings by female participants may indicate a gender difference in
peer leadership perception rather than significant differences due to peer leadership
competency constructs. Females may have a greater halo effect than males.
Eagly, Karau, and Makhijani (1995) conducted a meta-analysis illustrating that men
and women performed equally as leaders except when in leadership roles congruent to
their gender. In this study, both genders perceived the peer leadership scenario congruent
to their gender and tended to rate question responses accordingly with females having a
more positive frame of reference than males. Additional evidence of a possible female
positive tendency occurred with rating the Overall dependent variable where females had
an average of 8.293 and males an average of 7.979.
Both genders had the same order of importance for peer leadership competencies in
the peer leadership competency regression model: (a) Participate, (b) Assist, (c)
Presence, and (d) Reflect. The same order of importance for both genders indicates that
although differences exist between gender perceptions of peer leadership, the influence
survey constructs remain consistent. The regression model for females explained more
variance (51.70 percent) than the male model (46.90 percent) indicating a more consistent
rating between independent and dependent variables for females.

127
College Level Influences on Peer Leadership Competencies
ANOVA on college-level peer leadership competencies indicated no significant
differences among college levels. Maturation is a very difficult aspect of leadership
development to measure and analyze. Parcarella and Terenzini (1991) stated that
maturation occurs across multiple, broad constructs and developmental in nature while
students attend college. Most research in leadership views maturation as a positive effect
on leadership development and could account for significant differences between
maturity levels. This analysis of peer leadership competencies indicates no maturation
impact on peer leadership competencies.
Possible reasons for the lack of maturation in this study could result from the scope
or context of the study and the leadership aspect studied--peer leadership. The scope of
this study focused on undergraduate students with the majority of ages between 18 and
25. This narrow age range of seven years could account for the lack of differences
between college levels. However, seven years is a substantial period of time and
considerable maturity results when transitioning from high school and home to higher
education and college life. If these transitional factors did impact maturation, it would
appear in the data as significant differences.
The context of this study was a medium sized, public university campus. Students
have the ability to become involved or uninvolved in campus activities creating a
prevalent environment of equality, unlike smaller or private colleges where more peer
pressure exists to participate in campus activities. The general lack of peer pressure at the
study university could create a more informal and less structured environment mitigating
the effects of maturation.

128
The aspect of leadership studied, peer leadership, represents a unique aspect of
leadership as one person attempts to influence another person without the use of
traditional forms of power such as those identified by French and Ravens (1959). The
results of this study indicated that the leadership competencies needed to influence peers
do not change over time. Possible reasons for the consistent peer leadership competencies
observed by college levels during this study could result from the personal and relational
nature of peer leadership. The competencies and skills needed by peers to establish and
maintain effective relationships may not improve with maturity. Additional studies using
different contexts and age groups could provide more insight to the effects maturation has
on peer leadership.
Discussion of Peer Leadership Skills Hypothesis
Multiple regression analysis produced significant regression models with all peer
leadership skills providing a significant contribution at the .05 level to the associated peer
competency regression model. All peer skills contributed significantly to regression
models at the .001 level except for three skills; one in the each of the Assist, Reflect, and
Presence competencies. The significance of peer leadership skills contributing to the
regression model reinforced the content and construct validity of the influence survey.
Regression results also provided the relative importance of each question to the peer
leadership competency as the most significant skill clearly supported the construct of
each competency.
Gender Influences on Peer Leadership Skills
A comparison of male and female peer leadership skills indicated significance at the
.05 level by at least one gender for all questions. Three male and three female skill

129
questions did not contribute significantly to regression models (see Table 20). Although
similarity between genders occurred for the majority of peer leadership skill questions,
non-significant questions occurred in all four peer leadership competencies and indicated
possible gender-based tendencies.
Two skill questions indicated a possible male tendency for autonomy. The
autonomy questions (Q27, Help you develop objective criteria during the decision-
making process, and Q4, Actively include you in the decision-making process) focused
on helping peers develop objective criteria and including peers during the decision-
making. A lack of significance by male participants on Q27and Q4 during the regression
analysis of peer leadership competencies may indicate that males perceived assistance
from their peers and the inclusion of peers as not important when making decisions. The
perceived male tendency towards autonomy supports research done by van Engen and
Williamsen (2004) who found that women led in a more democratic and inclusive
manner.
Question Q19 (Praise you or celebrate small victories with you) emerged as not
significant during the regression analysis of the Assist peer leadership competency. A
potential male tendency may exist as males thought praise from peers or the celebration
of small victories as not important. Female participant responses indicated significance
for each question found not-significant by male participants indicating potential male
tendencies.
Three survey questions did not indicate significance for female participants during
the regression analysis of the four peer leadership competencies. Question Q21 (Cause
you to learn from the situation) of the Reflection competency focused on learning from
130
the situation. Q 29 (Remind you to follow-up on important activities) of the Assist
competency focused on reminding peers to follow up on important activities. Both Q21
and Q29 may indicate that females have a tendency to focus on the present and not the
future or past when attempting to influence their peers.
Q39 (Having the person helping you physically near you) of the Presence did not
indicate significance for female participants during the regression analysis of peer
competencies. Q39 focused on having the helping peer physically near the influenced
peer. The other two questions (Q34, The mere presence of that individual in helping or
supporting you, and Q37, The presence of the person in creating a sense of confidence
within you) comprising the Presence competency indicated significance at the .001 level
during the regression analysis by female participants. The lack of significance that Q39
had may indicate that female participants did not need the influencing peer physically
near them for help and may rely more heavily on other means for communicating
presence such as texting or other electronic communication means. Male participant
responses indicated significance for all three female questions found not-significant
indicating potential female tendencies. Overall, both genders generally agreed in their
perceptions of peer leadership skills.
College Level Influences on Peer Leadership Skills
Regression models based on college-level peer leadership skills found no
significance to peer leadership competencies for 6 freshmen, 11 sophomore, 6 junior, and
4 senior peer leadership skills. The ANOVA analysis of college-level competencies
indicated no significance among the four peer leadership competencies. The wide
variance in the number of skills indicating no significance among college levels supports

131
the college-level peer leadership competencies findings. Although no significance
differences occurred among the college-level competencies, significant differences
existed by college levels regarding the importance of peer leadership skills defining the
competencies.
Two peer leadership skills did not significantly contribute to any college-level
competency regression model. Two peer leadership skills had significance at the .05 or
.01 level for only one of the college levels. The four skills focused on peers helping to
develop objective criteria during the decision making process, causing peers to analyze
effectively the situation, peers having physical proximity to the influenced peer, and
celebrating small victories with peers. These four skills, although they properly loaded
during the exploratory principle component analysis, do not explain any significant
portion of the variance in the data by college levels and may indicate ineffective peer
skills. The four peer skills did contribute significantly to the regression model of their
respective peer competency, but three of the four did so at the .01 or .05 level compared
to the other skills contributing at the .001 level. Difficulty in identifying these four
ineffective peer skills resulted from the correlations between these independent variables
allowing inclusion during the exploratory principle component analysis and indicating
adequate loadings. The significance of this analysis highlights the nature of exploratory
principle component analysis to verify validity while items included in the validation may
not have a significant impact on explaining the study causal relationships.
Regression rankings provide useful information regarding the importance of peer
leadership skills as a component of the associated competency. The most important peer
skills for the Assist competency included (1) demonstrating enthusiasm and (2) making a

132
sincere effort to reach consensus with peers (Q26 and Q30 on the survey). Having a
positive attitude provides leaders with a distinct advantage. Colin Powell (2002)
remarked that ―Perpetual optimism is a force multiplier‖ portraying the significance of a
positive leader in military terminology (p. 259). Consensus may relate to enthusiasm in
certain situations as both might have a positive influence on the situation.
The Participate competency had greater variance in ranking peer skills, but did
identify effective communication, good listening qualities, and constantly encouraging as
the most important peer skills (Q2, Q3, and Q5). The encouraging skill relates to the
enthusiasm skill identified for the Assist competency and may indicate an overall positive
attitude as effective for peer leadership. Communication skills identified as important
relate directly to this study‘s literature review that identified communication as the most
important peer leadership skill competency. Both genders identified constant
encouragement as the most important peer leadership skill.
The important peer skills identified for the Reflect competency focused on
situational aspects. Two questions (Q9 and Q23) had equal importance and contained
cognitive aspects by helping the peer reflect and meditate to understand fully the situation
and to reflect on the situation. Overall, both genders identified the peer reflecting and
meditating skill (Q23) as important to the Reflect competency.
Only one peer skill (Q34) surfaced as important for the Presence competency and
focused on the mere presence of the peer leader when helping or supporting them. An
analysis by gender indicated both male and female participants ranked the mere presence
of the peer leader as important. The Presence competency evolved from the ROTC data

133
base analysis and indicated the peers prefer to have peer leaders visible and act as a
source of comfort and reassurance.
Overall, the peer leadership skills ranked most important by competency: (1) had
themes of positive leader behaviors, (2) highly rated effective communication and
listening skills, (3) focused on helping peers to reflect and fully understand the situation,
and (4) indicated the importance that the presence of the peer had on other peers. The
findings of this study on peer leadership competencies and skills support general findings
and themes discovered during the literature review. The information determined from the
analysis of the influence survey data provided several suggested foci for enhancing
leadership pedagogy and peer leader development.
Implications of this Study to Leadership Pedagogy
Brown stated,
One of the most potent environmental influences on student development in college
is the peer group. While the faculty may play some role in the development of
intellectual attitudes and perhaps in vocational choice, the dominant and single most
important force remains the peer group. (1972, p. 31)
Astin (1996), Adelman (2002), McDaniels, et al. (1994), Cuseo (1991), Astin (1968,
1985), and Roberts (1996) all noted the positive impact peer interactions have on
cognitive development and the application of peer leadership skills. The ability to utilize
fully the peer group in student education and development requires specific outcomes,
especially in the realm of leadership. The lessons learned from this author's study can
enhance leadership curricula and pedagogy by providing leadership educators and
134
developers with a more defined focus on important competencies and skills needed for
effective peer leadership.
Pascarella and Terenzini (2001) studied the interaction of faculty and peer-group
interactions across 15 pre-enrollment characteristics regarding undergraduate residence
settings on freshman year academic and non-academic outcomes. The peer-group
interactions had a significant impact on non-academic outcomes, but the authors did not
define peer-group interactions and called for additional research on specific patterns of
interpersonal interactions to specific educational outcomes. Unlike Pascarella and
Terenzini's study, the present study provided insight to more defined peer interactions
and could provide helpful insights for future studies in this realm.
Fisher (1974), Baxter-Magolda (1992), Hare and O‘Neill (2000), and Petzel et al.
(2001) studied various aspects and contexts of leadership in higher education. In all
instances, the impact of peers emerged as an important and positive factor. The authors
identified peer influences, but did not further define specific competencies or skills
needed for leadership development.
Adelman (2002) cited communication and interpersonal skills, self-awareness and
confidence, a sense of civic and social responsibility, critical thinking, and reflective
abilities as critical peer leadership skills. This researcher agreed with most of Adelman‘s
findings regarding peer leadership competencies, but also provided specific peer
leadership skills missing in the Adelman study.
Research done by Komives et al. (2005) developed the LID model based on
grounded research and identified peer leadership as one of the ―…essential
developmental influences that fostered the development of a leadership identity…‖ (p.

135
596). The authors cited affirmation and support as important to peer leadership, but did
not further elaborate on the two large constructs. Komives et al. (2006) expanded their
grounded research by further defining and discussing the six stages encompassing the
LID model previously defined. Peers had a positive impact on the developmental
influences found in stages two through six indicating the influence peer leadership had on
the LID model of leadership development. The terms used to define peer leadership in the
LID model focused on mentoring, sponsoring, supporting, and developing other peers.
The terms used for peer influences described large and vague constructs providing
leadership educators and developers difficulty in determining the important peer
leadership competencies and skills to include in leadership pedagogy. This researcher's
study affirmed both the support and affirmation constructs proposed by Komives et al.
and further defined competencies and skills that can provide useful information as peers
and mentors look to influence other peers. The results of this researcher's study provided
insight to more definitive competencies and skills that can provide for more focused
leadership program outcomes.
Methodological Implications and Limitations
Methodological considerations impacted the effectiveness of the influence study.
Developing a survey and not having a comparison or similar survey created challenges
that impacted verification of the survey validity. The influence survey validity needed to
achieve adequate data analysis required focus group considerations, a retranslation of
peer leadership skill questions into competencies, a pre-pilot study, and a pilot study. The
process involved in verifying the validity of the influence survey is complex due to the
variables involved and to the intent of the survey. The intent of this survey provided for
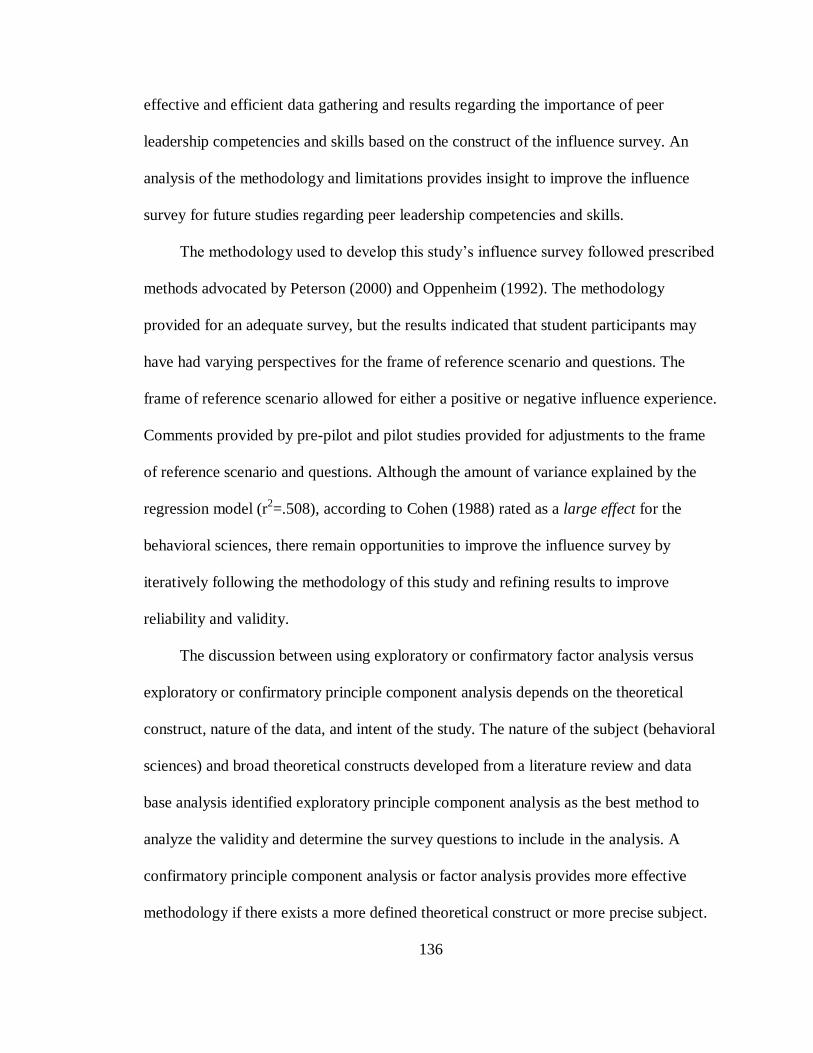
136
effective and efficient data gathering and results regarding the importance of peer
leadership competencies and skills based on the construct of the influence survey. An
analysis of the methodology and limitations provides insight to improve the influence
survey for future studies regarding peer leadership competencies and skills.
The methodology used to develop this study‘s influence survey followed prescribed
methods advocated by Peterson (2000) and Oppenheim (1992). The methodology
provided for an adequate survey, but the results indicated that student participants may
have had varying perspectives for the frame of reference scenario and questions. The
frame of reference scenario allowed for either a positive or negative influence experience.
Comments provided by pre-pilot and pilot studies provided for adjustments to the frame
of reference scenario and questions. Although the amount of variance explained by the
regression model (r2=.508), according to Cohen (1988) rated as a large effect for the
behavioral sciences, there remain opportunities to improve the influence survey by
iteratively following the methodology of this study and refining results to improve
reliability and validity.
The discussion between using exploratory or confirmatory factor analysis versus
exploratory or confirmatory principle component analysis depends on the theoretical
construct, nature of the data, and intent of the study. The nature of the subject (behavioral
sciences) and broad theoretical constructs developed from a literature review and data
base analysis identified exploratory principle component analysis as the best method to
analyze the validity and determine the survey questions to include in the analysis. A
confirmatory principle component analysis or factor analysis provides more effective
methodology if there exists a more defined theoretical construct or more precise subject.

137
If a more precise subject matter focus evolved for a study regarding peer leadership
competencies and skills, the use of confirmatory principle component analysis or factor
analysis could provide more definitive results.
The use of the ROTC data base provided a bias of a like-minded and male sample
population. The similarities of the ROTC data base to this study allowed a comparison
between the ROTC data base and the literature review in determining theoretical
constructs. A data base without the like-minded or male bias could provide better
corroboration with a literature review and may provide insights to other peer leadership
competencies or skills.
A truly random sample set may provide different results. The sampling technique
employed for this study was convenient, yet random. Students at the study university did
have a non-zero chance for selection to participate in the study as this study did not target
a specific academic discipline, college level, gender, or ethnicity. A true random sample
may provide differing results and would allow for greater generalization.
Incorporating several similar universities representing different geographic
locations and sample populations could influence the study results. The study intended to
establish an initial methodology and instrument to investigate peer leadership
competencies and skill. Including various similar universities would introduce additional
extraneous variables with varied sample populations possibly confounding the survey
development and study results. A discussion of possible future studies highlights the
potential established by this study.

138
Implications for Future Research
This study identified a set of peer leadership competencies and skills and provided
an impetus for additional studies designed to further define and refine the identified skills
and competencies as well as investigate various aspects not examined in this study.
Future studies on peer leadership competencies and skills should focus on generalizing
the influence survey and allowing investigations of different populations. Peer leadership
is an aspect of leadership that transcends ages, ethnicities, and other aspects of any
society, as peers exist in all human contexts.
This study analyzed undergraduate students in higher education. Future studies
could look to at the peer leadership influences that exist in different age levels such as
graduate students or K through 12 students. Although maturation does not seem to impact
perspectives on peer leadership at the undergraduate level, it could emerge in other, more
extreme age groups. The influence survey questions may require re-wording depending
on the target population.
The data collected for this study occurred at a medium-sized public higher
education institution. The university services a distinct geographic location in the south-
central region of the United States. Data gathered at private universities as well as small
or large public universities may produce different results. Data gathered at similar
universities in different geographic locations may also produce varying results.
Ultimately, generalization of the influence survey and study methodology to different
cultures and countries would provide interesting findings.
Demographic data collected for this study included race information. The low
number of minorities participating in this study did not allow a meaningful statistical

139
analysis or qualitative analysis on that factor. Future research regarding peer leadership
may take a purposeful approach to collect a larger sample of minority students that would
allow a meaningful analysis of the impact race has on peer leadership competencies and
skills.
The Presence peer leadership construct provided a unique perspective that had
received limited attention in a literature review, but took a prominent role in the ROTC
data base analysis. The degree of influence that the physical presence of a person has on
peer leadership remains unclear. The analysis conducted for this study indicates an
impact, but the limited questions and possibly the wording of the questions limited the
value of the Presence peer leadership competency and skills. Additional research
regarding the Presence competency and skills could clarity the importance regarding the
physical presence of a person to effective peer leadership.
Additional research on the Reflect competency and associated skill could provide
more meaningful insight to the impact reflection has on peer leadership. The literature
review identified reflection in numerous studies as an important aspect of peer leadership.
The results of this study indicated that reflecting on the experience or situation had
limited importance to peer leadership. The discrepancy between this study‘s results and
body of literature could evolve from the influence survey questions or construct of the
influence survey. A more effective influence survey could provide more definitive results
and insights to peer leadership constructs.
Developing an effective survey is an iterative process filling a void in leadership
assessment research. This study developed an influence survey for undergraduate
students. The influence survey in its present form answered study hypotheses, but could
140
provide more thorough results with iterative forms of the influence survey. Each
methodological developmental iterative process could further enhance and refine the
questions asked and construct of the influence survey. One recommendation to improve
the influence survey requires additional emphasis on effective focus group processes to
ensure accurate peer leadership questions. Additional focus groups specific to the target
study population could also provide insight to more effective survey theoretical
constructs or adjusted peer leadership competencies. Additional research regarding
further development and refinement of the influence survey would provide for possibly
more meaningful conclusions.
Summary and Conclusions
Astin (1993) stated ―…the student‘s peer group is the single most potent source of
influence on growth and development during the undergraduate years" (p. 398). Whitt, et
al. (1999) summarized ―When other factors were taken into account, the more that
students were involved with their peers in both course-related and non-course related
interactions, the greater their cognitive growth during college‖ (p. 72). Peer interactions
provide meaningful impacts on student learning leading to opportunities for improving
leadership development. Higher education environments provide a living laboratory for
peer interactions allowing peers to develop skills and competencies needed to influence
effectively others of equal status and ability. This study examined peer leadership
competencies and skills providing additional information to better shape and refine
leadership programs leveraging the surrounding environment. Both curricular and
extracurricular programs can benefit from the results of this study allowing educators and

141
leadership developers additional means to leverage the higher education environment to
enhance student's understanding of leadership.
142
REFERENCES
Adelman, A. L. (2002). Peer leadership. Leadership insights and applications series #12.
College Park, MD: National Clearinghouse for Leadership Programs.
Anderson, S. D., & Wanberg, K. W. (1991). A convergent validity model of emergent
leadership in groups. Small Group Research, 22, 380 – 397.
Argyris, C. (1991). Teaching smart people how to learn. Harvard Business Review, May-
June, 99-109.
Astin, A. W. (1968). The college environment. Washington, DC: American Council on
Education.
Astin, A. W. (1977). Four critical years. San Francisco: Jossey-Bass.
Astin, A. W. (1984). A developmental theory for higher education. Journal of College
Student Personnel, (25)4, 297-308.
Astin, A. W, (1985). Achieving educational excellence: A critical assessment of priorities
and practices in higher education. San Francisco: Jossey-Bass.
Astin, A. W. (1993). What matters in college four critical years revisited. San Francisco:
Jossey-Bass.
Astin, A. W. (1996). Involvement in learning revisited: Lessons we have learned. Journal
of College Student Development, 37, 123-134.
Avolio, B. J., & Locke, E. E. (2002). Contrasting different philosophies of leader
motivation: Altruism vs. egoism. The Leadership Quarterly, 13, 169-191.
Avolio, B. J. (2005). Executive summary: 100 year review of leadership intervention
research, Gallup Leadership Institute Briefings Report. Kravis Leadership Institute
Leadership Review, 5, 7-13.

143
Avolio, B. J. & Luthans, F. (2006). The high impact leader: Moments matter in
accelerating authentic leadership development. New York: McGraw-Hill.
Bandura, A. (1977). Social learning theory. Englewood Cliffs, N.J.: Prentice Hall, Inc.
Bandura, A. (1986). Social foundations of thought and action: A social cognitive theory.
Englewood Cliffs, NY: Prentice-Hall.
Bass, B. (1990). Bass & Stogdill’s handbook of leadership. New York: Free Press.
Baxter Magolda, M. B. (1992). Co-curricular influences on college students‘ intellectual
development. Journal of College Student Development, 33(3), 203-213.
Baxter Magolda, M. B. (1998). Developing self-authorship in young adult life. Journal of
College Student Development, 39, 143-156.
Bowerman, B. L., & O‘Connell, R. T. (1990). Linear statistical models: An application
(2nd ed.). Belmont, CA: Duxbury.
Bowers, D. G. & Seashore, S. E. (1966). Predicting organizational effectiveness with a
four-factor theory of leadership. Administrative Science Quarterly, 11(2), 238-263.
Brown, R. (1972). Student development in tomorrow‘s higher education – A return to the
academy. Student Personnel Series, 16. Washington, DC: American College
Personnel Association.
Burke, C. S., Stagl, K. C., Cameron, K., Goodwin, G. F., Salas, E., & Halpin, S.M.
(2006). What type of leadership behaviors are functional in teams? A meta-analysis.
Leadership Quarterly, 17, 288 – 307.
Burns, J. M. (1978). Leadership. New York: Harper and Row.
144
Carson, J. B., Tesluk, P. E., & Marrone, J. A. (2007). Shared leadership in teams: An
investigation of antecedent conditions and performance. Academy of Management
Journal, 50, 1217 – 1234.
Chickering, A. W. (1969). Education and identity. San Francisco: Jossey-Bass.
Chickering, A. W., & Reisser, L. (1993). Education and identity (2nd ed.). San Francisco:
Jossey-Bass.
Cohen, J. (1988). Statistical Power Analysis for the Behavioral Sciences (2nd ed.).
Hillsdale, NJ: Lawrence Erlbaum Associates.
Conger, J. A., & Ready, D. A. (2004). Rethinking leadership competencies. Leader to
Leader, 32, 41-47.
Costello, A. B. & Osborne, J. W. (2005). Best practices in exploratory factor analysis:
Four recommendation for getting the most from your analysis. Practical
Assessment, Research & Evaluation (10) 7, 1-9.
Curtin, J. L. (2004). Emergent leadership: Case study of a jury foreperson, Leadership
Review, 4, 75-88.
Cuseo, J. B. (1991). The freshmen orientation seminar: A research-based rationale for its
value, delivery, and content, No. 4. Columbia, SC: University of South Carolina,
National Resource Center for the Freshman Year Experience.
Dulin, L. (2008). Leadership preferences of a generational y cohort: A mixed-methods
investigation. Journal of Leadership Studies, 2, 43-59.
Dubois, D., Karoly, E., & Doubs, A. (1994). Evaluating the ROI and effectiveness of
competency-based training and development programs. Competency conference
proceedings. Boston: Linkage Inc.

145
Eagly, A. H., Karau, S. J., & Mikhijani, M. G. (1995). Gender and the effectiveness of
leaders: A meta-analysis. Psychological Bulletin, 111, 3-22.
Ender, S. C. and Winston, R. B. (1984). Using students as paraprofessional staff. New
Directions for Student Services, 27, 3-21. San Francisco: Jossey-Bass.
Erez, A., Lepine, J., & Elms, H. (2002). Effects of rotated leadership and peer evaluation
on the functioning and effectiveness of self-managed teams: A quasi-experiment.
Personnel Psychology, Vol 55, 929 – 948.
Feldman, K., & Newcomb, T. (1969). The impact of college on students. San Francisco:
Jossey-Bass.
Field, A. (2009). Discovering statistics using SPSS (3rd ed). London: Sage.
Fisher, B. A. (1974). Small group decision making: Communication and the group
process. New York: McGraw-Hill.
Fleishman, E. A., Mumford, M. D., Zaccaro, S.J., Levin, K.Y ., Korotkin, A. L., & Hein,
M.B. (1991). Taxonomic effort in the description of leader behavior: A synthesis
and functional interpretation. Leadership Quarterly, 2, 245 – 287.
Fredricks, J. A., & Eccles, J. S. (2005). Developmental benefits of
extracurricular involvement: Do peer characteristics mediate the link between
activities and youth outcomes? Journal of Youth and Adolescence, Vol 34 (6), 507 –
520.
French, B., & Ravens, J. (1958). Group support, legitimate power, and social influence.
Journal of Personality, 26, 400 - 401.

146
French, B., & Ravens, J. (1959). Bases of social power. In Studies in social
power. Cartwright, Dorwin (Ed.); Oxford, England: University of Michigan, 1959,
150-167.
Gellin, A. (2003). The effects of undergraduate student involvement on critical thinking:
A meta-analysis of the literature, 1990 – 2000. Journal of College Student
Development,44, 746-762.
George, D., & Mallery, P. (2003). SPSS for Windows step by step: A simple guide and
Reference. 11.0 update (4th ed.). Bosnot: Allyn & Bacon.
Guzzo, R. A., & Salas, E. S. (1995). Team effectiveness and decision making in
organizations. San Francisco: Jossey-Bass Publishers.
Hare, L., & O‘Neill, K. (2000). Effectiveness and efficiency in small academic peer
groups a case study. Small Group Research, 31(1), 24-53.
Heath, D. H. (1968). Growing up in college. San Francisco: Jossey-Bass.
Hollander, E. P. (1958). Conformity, status, and idiosyncrasy credit. Psychological
Review, 65, 117 - 127.
Hollander, E. P. (1961). Emergent leadership and social influence. In L. Petrullo & B.
M. Bass (Eds.), Leadership and interpersonal behavior (30 – 47). New York: Holt,
Rinehart, and Winston.
Hollenbeck, G. P., McCall, M. W., & Silzer, R. F. (2006). Leadership competency
models. Leadership Quarterly, 17, 398-413.
Holmes, R., McNeil, M., Adorna, P., & Procaccino, J. (2006). College student athletes‘
preferences and perceptions regarding peer relationships. Journal of Sports
Behavior, 31(4), 338-351.

147
House, R. J. (1996). Path-goal theory of leadership: Lessons, legacy, and a reformulated
theory. Leadership Quarterly 7(3), 323-352.
Johnson, D. W., & Johnson, F. P. (1994). Joining together: Group theory and group
skills (5th ed.). Needham Heights, MA: Allyn and Bacon.
Judge, T. A., Bono, J. E., Ilies, R. & Gerhardt, M. W. (2002). Personality and leadership:
a qualitative review. Journal of Applied Psychology, 87, 765 - 780.
Katz, R. L. (1955). Skills of an effective administrator. Harvard Business Review, 33(1),
33-42. Kellett, J.B., Humphrey, R.H., & Sleeth, R.G. (2006). Empathy and the
emergence of task and relations leaders. Leadership Quarterly, 17, 146 – 162.
Kegan, R. (1994). In over our heads: The mental demands of modern life. Cambridge,
MA: Harvard University Press.
Kellett, J. B., Humphrey, R. H., & Sleeth, R. G. (2006). Empathy and the emergence of
task and relations leaders. Leadership Quarterly (17), 146-162.
Kickul, J., & Neuman, G. (2000). Emergent leadership behaviors: The function of
personality and cognitive ability in determining teamwork performance and KSAS.
Journal of Business and Psychology, 15, 27 – 51.
King, P. M., & Kitchener, K. S. (1994). Developing reflective judgment. San Francisco:
Jossey-Bass.
Kirkpatrick, S. A., & Locke, E. A. (1991). Leadership: Do traits matter? Academy of
Management Executive, 5, 48 - 60.
Komives, S., & Adelman, A. (2002). The peer leadership model. Unpublished
manuscript.

148
Komives, S., Mainella, F., Owen, J., Osteen, L., & Longerbeam, S. (2005). Developing a
leadership identity: A grounded theory. Journal of College Student Development,
46(6), 593-611.
Komives, S., Mainella, F., Owen, J., Osteen, L., & Longerbeam, S. (2006). A leadership
identity development model: Applications from a grounded theory. Journal of
College Student Development, 47(4), 401-418.
Kouzes, J. & Posner, B. (2007). The Leadership Challenge (4th ed.). San Francisco:
Jossey-Bass.
Ladyshewsky, R. (2006). Peer coaching: A constructivist methodology for
enhancing critical thinking in postgraduate business education. Higher Education
Research & Development, Vol 25 (1), 67 – 84.
Loughead, T., & Hardy, J. (2005). An examination of coach and peer leader behaviors in
sport. Psychology of Sport & Exercise, 6(3), 303-312.
Lord, R. G., & Hall, R. J. (1992). Contemporary views of leadership and individual
differences. Leadership Quarterly, 3, 137 - 157.
Love, P. G. (1995). Exploring the impact of student affairs professionals on student
outcomes. Journal of College Student Development, 36(2), 162-170.
Luchin, A. S., & Luchins, E. H. (1966). Learning a complex ritualized social role. The
Psychological Record, (54), 175 - 197.
Marmor, J., (1962). Psychoanalytic therapy as an educational process: Common
denominators in the Therapeutic Approaches of Different Psychoanalytic ‘Schools.‘
In J.H. Masserman (Ed.), Science and Psychoanalysis, Vol 5, Psychoanalytic
Education. New York: Grune & Stratton.
149
McClelland, D. C. (1973). Testing for competency rather than intelligence. American
Psychologist, 28, 1-14.
McDaniels, R. M., Carter, J. K., Heinzen, C. J., Candrl, K. I., & Weiberg, A. M. (1994).
Paraprofessionals: A dynamic staffing model. Journal of Career Development,
21(2), 95-109.
Middlehurst, R. (2008). Not enough science or not enough learning? Exploring the gaps
between leadership theory and practice. Higher Education Quarterly, 62 (4), pp.
322 - 339.
Morgenson, F. P., DeRue, D. S., & Karam, E.P. (2009). Leadership in teams: A
functional approach to understanding leadership structures and processes. Journal
of Management 36, (5), 5-39.
Mullen, B., Salas, E. & Driskell, J. E. (1989). Salience, motivation, and artifact as
contributors to the relation between participation rate and leadership. Journal of
Experimental Social Psychology, 25, 545 - 559.
Mumford, M. D., Zaccaro, S. J., Connelly, M. S., & Marks, M. A. (2000). Leadership
skills: Conclusions and future directions. Leadership Quarterly, 11, 155-170.
Mumford, T. V., Campion, M. A., Morgeson, F. P. (2007). The leadership skills
strataplex: Leadership skills requirements across organizational levels. Leadership
Quarterly, 18, 154-166.
150
Myers, R. (1990). Classical and modern regression with applications (2nd ed.). Boston:
Duxbury. Neubert, M.J., & Taggar, S. (2004). Pathways to informal leadership: The
modeling role of gender on the relationship of individual differences and team
member network centrality to informal leadership emergence. Leadership
Quarterly, 15, 175 – 194.
Newcomb, T. M. (1967). Persistence and Change: Bennington College and its Students
After 25 Years. New York: Wiley.
Northouse, P. G. (2010). Leadership theory and practice (5th ed.). Thousand Oaks, CA:
Sage.
Oppenheim, A. N. (1992). Questionnaire design, interviewing and attitude measurement.
London: Pinter Publishers
Parcarella, E. T. & Terenzini, P. T. (1991). How College Effects Students: Findings and
Insights from 20 Years of Research. San Francisco: Jossey-Bass.
Parcarella, E. T. & Terenzini, P. T. (1996). Student-faculty and student-peer relationships
as mediators of the structural effects of undergraduate resident arrangement.
Journal of Educational Research, 73(6), 344-353.
Peterson, R. A. (2000). Constructing effective questionnaires. Thousand Oaks, CA: Sage.
Petzel, T. P., Johnson, J. E., & Bresolin, L. (2001). Peer Nominations for leadership and
likeability in problem-solving groups as a function of gender and task. The Journal
of Social Psychology, Vol. 130 (5), 641 - 648.
Powell, C. (2002). The leadership secrets of Colin Powell. New York: McGraw-Hill.
151
Roberts, G. (1996). An African-American view of the collegiate residential experience on
predominantly white campuses. In S. L. Hamid (Ed.), Peer leadership: A primer on
program essentials, No. 32. Columbia, SC: University of South Carolina, National
Resource Center for the First-Year Experience & Students in Transition.
Rossi, P. H., Wright, J. D., & Anderson, A. B. (1983). Handbook of survey research.
New York: Academic Press.
Rost, J. C. (1991). Leadership for the twenty-first century. London: Praeger.
Rubin, R. S., Bartels, L. K., & Bommer, W. H. (2002). Are leaders smarter or do they
just seem that way? Exploring perceived intellectual competence and leadership
emergence. Social Behavior and Personality, 30, 105 – 118.
Salas, E., Sims, D. E., & Burke, C. S (2005). Is there a ―big five‖ in teamwork? Small
Group Research, 36, 555 – 599.
Salovey, P., & Mayer, J. D. (1990). Emotional intelligence. Imagination, Cognition and
Personality, 9, 185 - 211.
Sims, P., & Manz, C. (1982). Social learning theory: The role of modeling in the
exercise of leadership. Journal of Organizational Behavior Management, 3(4),
55 - 63.
Smith, J. A., & Foti, R. J. (1998). A pattern approach to the study of leader emergence.
Leadership Quarterly 9(2). 147–161.
Stevens, J. P. (2002). Applied multivariate statistics for the social science (4th ed.).
Hillsdale, NJ: Erlbaum.
Stevens, M. J., & Campion, M. A. (1999). Staff work teams: Development and validation
of a selection test for teamwork settings. Journal of Management, 25, 207-228.
152
Stone, T. H., & Cooper, W. H. (2009). Emerging credits. Leadership Quarterly, 20, 785 –
798.
Svinicki, M. D. (2004). Learning and Motivation in the Postsecondary Classroom.
Bolton, MA: Anker Publishing.
Taggar, S., & Ellis, R. (2007). The role of leaders in shaping formal team norms.
Leadership Quarterly, 18, 105 – 120.
Terenzini, P. T., Pascarella, E. T., & Blimling, G. S. (1996). Student‘s out-of-class
experiences and their influence on learning and cognitive development: A literature
review. Journal of College Student Development, Vol 37 (2), 149-162.
United States Army Cadet Command Headquarters, (2010). ROTC history. Retrieved
from http://www.rotc.usaac.army.mil/history.html.
United States Army (2006). Field Manual No. 6-22, Army Leadership Competent,
Confident, and Agile. Washington, D.C.: Department of the Army.
United States Army (1999). Field Manual No. 22-100, Army Leadership Be, Know, Do.
Washington, D.C.: Department of the Army.
van Engen, M. L., & Willemsen, T. M. (2004). Sex and leadership styles: A meta-
analysis of research published in the 1990s. Psychological Reports, 94, 3-18.
Webster (2008). Collegiate Dictionary (11th ed.), Springfield, MA: Merriam-Webster.
Whitt, E. J., Edison, M., Pascarella, E. T., Nora, A., & Terenzini, P. T. (1999).
Interactions with peers and objective and self-reported cognitive outcomes across 3
years of college. Journal of College Student Development, 40(1), 61-78.

153
Wielkiewicz, R. M., (2000). The leadership Attitudes and Beliefs Scale: An instrument
for evaluating college students‘ thinking about leadership and organizations.
Journal of College Student Development, Vol 41 (3), 335 - 347.

154
APPENDIX
Appendix A. Institutional Review Board Approvals

155

156
157
1

158
Appendix B. Influence Survey, Demographic Data Sheet, and Administration Script
Influence Survey
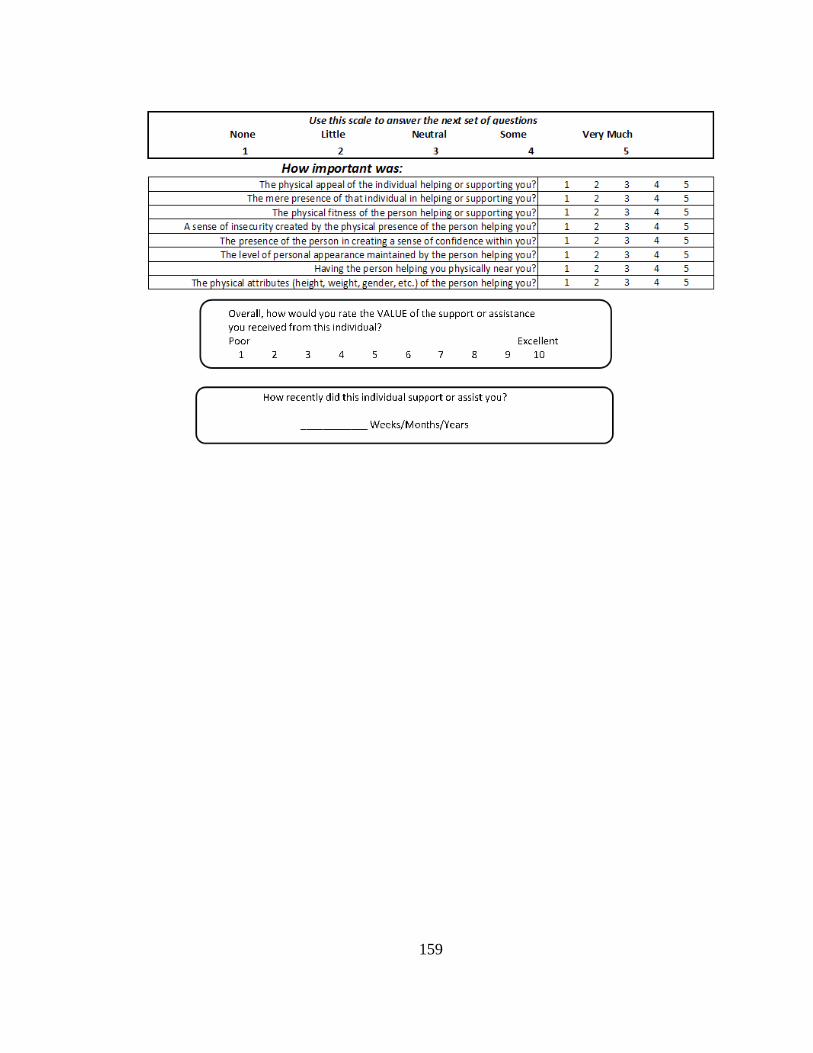
159

160
Demographic Data Sheet
Please provide the following information. You are not required to answer any question
that you find inappropriate.
Date:___________________
Class:__________________
Age:__________
Gender: M F
Race: White Black Hispanic Asian Other
College Level: Freshman Sophomore Junior Senior
Academic Major:______________________________
Grade Point Average:__________________________
ACT/SAT Score:______________________________
Are you the first in your immediate family to attend college? YES NO
What was the approximate size of your graduating class?__________________

161
Survey Administration Script
Hello, my name is _____________________ and I am collecting data to support research
on the competencies and skills most effective for peer leadership. This survey is
voluntary; you may elect not to participate or may stop at any time. We do ask for your
insights and cooperation by completing the survey which most students complete in
approximately five minutes. The survey you are about to take has approval from WKU‘s
Human Subject Review Board and constitutes no threat to you or your identity. At no
time does this survey ask for any identifying information and please do not provide any
identifying information on this survey. When you have completed the survey, please
[depends on the classroom configuration]:
- pass the completed survey to your right (or left) and I will collect them.
- raise your hand and I will pick-up your survey
Top Related