


Languages
Pages
Legal


3/18/2016
1
TheJourneyofaThousandMilesBeginswithaSingleStep
KristineKoontz,PhD,SSGBAmyDianeShort,MHSA,CSSBB
KristineKoontz,Ph.D.• ClinicalPsychology—SciencePractitioner• SixSigmaGreenBelt• DirectorofQualityandPerformanceManagement• QPMOversightofBehavioralHealthOrganization
• ResidentialandCommunitySettings• IntellectualDisabilities,MentalHealth,AutismSpectrumDisorders
• LifespanServices• USA:PA,DE&CT• International:Moldova,India

3/18/2016
2
AmyShort,MHSA• BSPsychology• MHSA(Master’sHealthServicesAdministration)• CertifiedSixSigmaBlackBelt• OperationalOversightofHospitalFunctions• QILeadershipofImplementationResearchatAcademicHealthCenter
• PatientAdvisoryCouncilMentor• UniversityofCincinnatiIRBMember• AdministrativeDirectorofCenterofImprovementScience,CincinnatiCCTST
PresentationOverview
• ANewApproach• GettingtoKnowYou• SixSigmaandDMAIC• Data,Data,Data• StrongProjectStarts• MakingImprovements• MaintainingtheGains
Active Learning

3/18/2016
3
ChangesfromYOURFeedback
• LessBroad,aDeeperDive• ExamplesfromaSuccessfulProject• MoreTimetoDoActivities
• WorksheetSentAheadofTimetoRegisteredParticipants
WhoAreYou?• AnswerPrivatelyinSocrative.com,• TypeinRoomNumber:
AMYSHORT• LoginasStudent• EnteratLeastOneLetterasaName
Click Here for Menu
Click Here to Login
Or Use the App

3/18/2016
4
HowExperiencedAreYouinQI?• AnswerPrivatelyinSocrative.com,• TypeinRoomNumber:
AMYSHORT• LoginasStudent• EnteratLeastOneLetterasaName
Click Here for Menu
Click Here to Login
KeepingItReal• WhatComplianceIssueKeepsYouUpatNight?
Worksheet

3/18/2016
5
DMAICDefineMeasureAnalyzeImproveControl
WheretheJourneyBegins:Data

3/18/2016
6
WhyData?• YouCannotManagewhatYouCannotMeasure
• DataInformation KnowledgeWisdom
WhatisData?Datais….
• Pluralof“Datum”Latin for“SomethingGiven”
• SetofValuesofQualitativeorQuantitativeVariables
• InformationinaRaworUnorganizedFormthatReferto,orRepresent,Condition,IdeasorObjects
• FactsthatCanBeAnalyzedorUsedinanEfforttoGainKnowledgeorMakeDecisions
• InformationthathasBeenTranslatedintoaFormthatIsMoreConvenienttoMoveorProcess

3/18/2016
7
WhatDoWeMeasure?
Characteristicsof:
• IndividualsWeSupport• Outcomes• Demographics/Characteristics
• Workforce• Outcomes• Demographics
• Programs/Services• Outcomes• Processes• Environment
“Everyday”Data
OUTCOME
• Lab/AssessmentResults
• SatisfactionRatings• UtilizationRate• ProgressNoteContent
PROCESS• TimelinessofExpectedDeliverable(E.g.,24HrsforaProgressNote)
• PointsofContactwithCaregivers
• CriticalProcessMilestones
3/18/2016
8
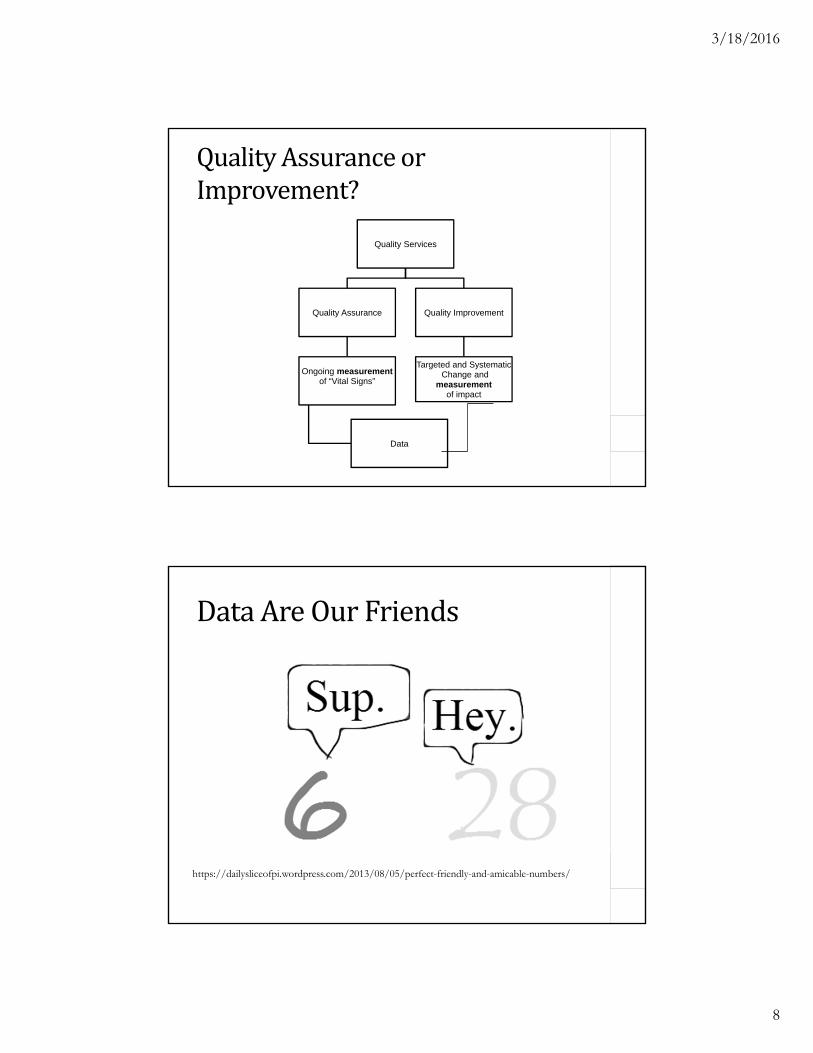
Quality Services
Quality Assurance
Ongoing measurementof “Vital Signs”
Data
Quality Improvement
Targeted and SystematicChange and
measurement of impact
QualityAssuranceorImprovement?
DataAreOurFriends
https://dailysliceofpi.wordpress.com/2013/08/05/perfect-friendly-and-amicable-numbers/

3/18/2016
9
DataTypes/Levels• Nominal Name• Ordinal Order• Interval EqualUnits• Ratio EqualUnits&“True0”
• Derived LinearCombination
NominalData• ToNameanObjectandThustoAssignIttoaClass(a.k.a.Categorical)
• StatisticsCanBeAppliedtoTheseDataOnlyAfterTheyHaveBeenConvertedtoPercentagesorProportions,forExample:
• 45%Femaleand55%Male• Gender• Program• LevelofDelay

3/18/2016
10
OrdinalData• ObjectsAreMeasuredasBeingEitherGreaterThanorLessThan,HigherorLowerThanaComparativeObject
• IntervalsBetweenAreMeaningless(Non‐Standard)
• BirthOrder/Win,Place,Show• LikertScale(Never,Sometimes,Always)
IntervalData• Interval:ABasicStandardIntervalbutNotNecessarilyaTrueZero/StartingPoint
• DifferenceBetweenScoreof1and2isSameasDifferenceBetween2and3Etc.
• ZeroDoesNotHaveaTrueMeaningIndicatingtheCompleteAbsenceofWhateverWeAreMeasuring
• E.g.Temperature(FahrenheitandCelsius)• 60DegreesIsNotTwiceasHotas30Degrees• 0DegreesIsNotAbsenceofKineticEnergy
• E.g.StandardScores(IQ,AdaptiveBehavior)

3/18/2016
11
Ratio• ThereIsaBasicStandardIntervalasinInterval
• AlsoHasaMeaningfulZeroValue
• E.g.Height,Weight,DurationofTime
DescriptiveStatisticsTermGiventotheAnalysisofDatathatHelpsDescribe,ShoworSummarizeDatainaMeaningfulWay
• MeasuresofCentralTendency
• MeasuresofDispersionandVariability
Hellloooooo! Let Me Tell You a Bit About Me and the Gang!
3/18/2016
12
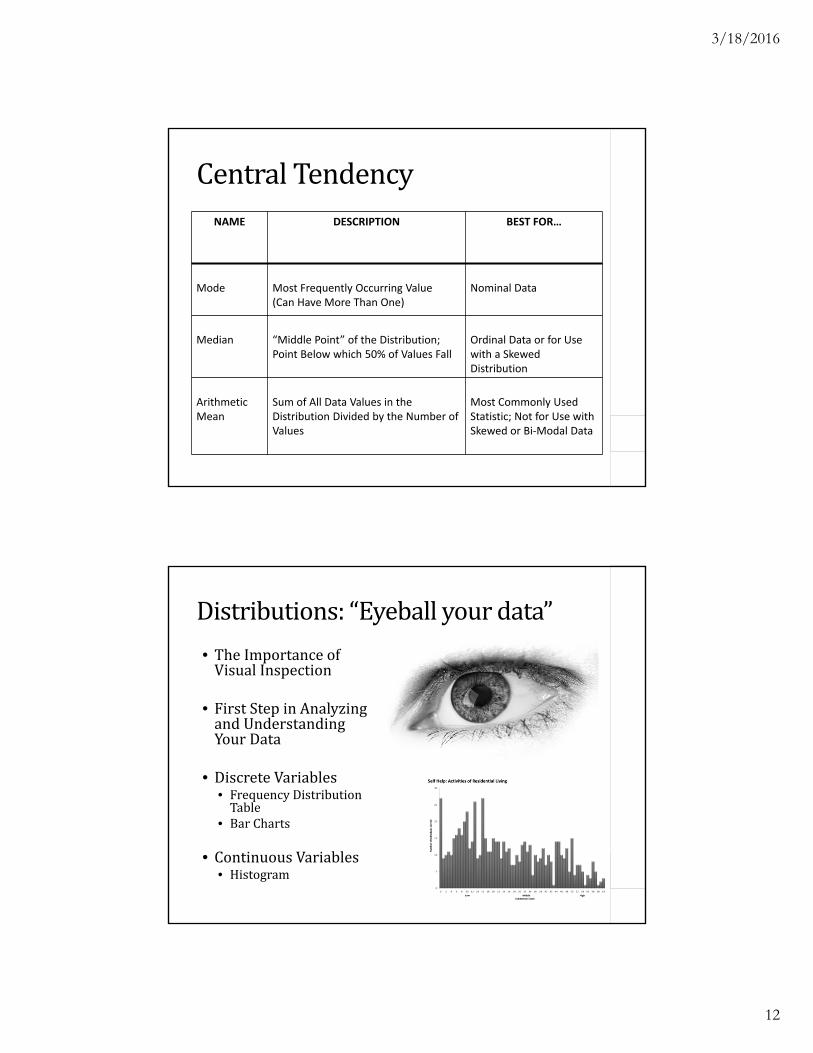
CentralTendencyNAME DESCRIPTION BEST FOR…
Mode Most Frequently Occurring Value (Can Have More Than One)
Nominal Data
Median “Middle Point” of the Distribution; Point Below which 50% of Values Fall
Ordinal Data or for Use with a Skewed Distribution
Arithmetic Mean
Sum of All Data Values in the Distribution Divided by the Number of Values
Most Commonly UsedStatistic; Not for Use with Skewed or Bi‐Modal Data
Distributions:“Eyeballyourdata”
• TheImportanceofVisualInspection
• FirstStepinAnalyzingandUnderstandingYourData
• DiscreteVariables• FrequencyDistributionTable
• BarCharts
• ContinuousVariables• Histogram

3/18/2016
13
Behold……andBeware
MeasuresofDispersion/Variability

3/18/2016
14
VariabilityofDistribution• 155555559• 122356789
• BothDistributionsHaveaMeanof5
• InwhichDistributionIsYourScoreof9More“Impressive”?• InwhichDistributionaretheScoresMoreSpreadOut?
KnowYourData
SecuretheFoundationandTrajectoryofYourProject
WheninDoubt,ConsultanExpert….
WhenConfidentAboutYourData,StillConsultanExpert….

3/18/2016
15
(R)DMAIC
RecognizeDefineMeasureAnalyzeImproveControl
Recognize
• TheSecretStepBEFOREDMAIC
• First,LookatData:• QualityControl• Audits• CustomerServiceSurveys• FinancialPerformanceIndicators

3/18/2016
16
Recognize
• Second,MakeanEvaluation:• NixifThereIsaKnownSolution
• Implement!• NotSuitableifProblemIsaManagementIssue• MakeSuretheProblemIsProcessRelated
Recognize
• Third,Prioritize:• HowImportantIsIttoYourOrganization?• IsItWorthyofResourcesthatCouldBeOtherwiseDeployed?
• AreThereOtherProjectsthatNeedtoHappenFirst?

3/18/2016
17
Recognize
• Fourth,DefinetheProblem• DevelopaHigh‐LevelUnderstandingoftheProblem• BegintoThinkAboutScope
• HelpfulTools:• ProjectDefinitionWorksheet• MacroMap
Worksheet
Recognize
MacroMap

3/18/2016
18
DMAICDefineMeasureAnalyzeImproveControl
Define
• IdentifyTeamMembers• LocalExperts• PeoplefromUpandDownStream
• HelpfulTools:• TeamAttributeChart• TeamRoster
• BuildTeamCulture• HelpfulTool:
• GroundRules
Worksheet

3/18/2016
19
DefineTeamAttributeWorksheet
ProjectRoster
Define
Meetings start and end on time.
Stick to the agenda.
No looping back.
Be honest/speak your mind.
Members will meet deliverables’
deadlines.
Treat each other with respect.
Challenge ideas, not people.
Be actively engaged.
All voices will be heard.
Silence equals agreement.
Limit side conversations.
Seek consensus.
Define how decisions will be made.
Cell phone used only for emergencies.
SampleGroundRules
3/18/2016
20
Define
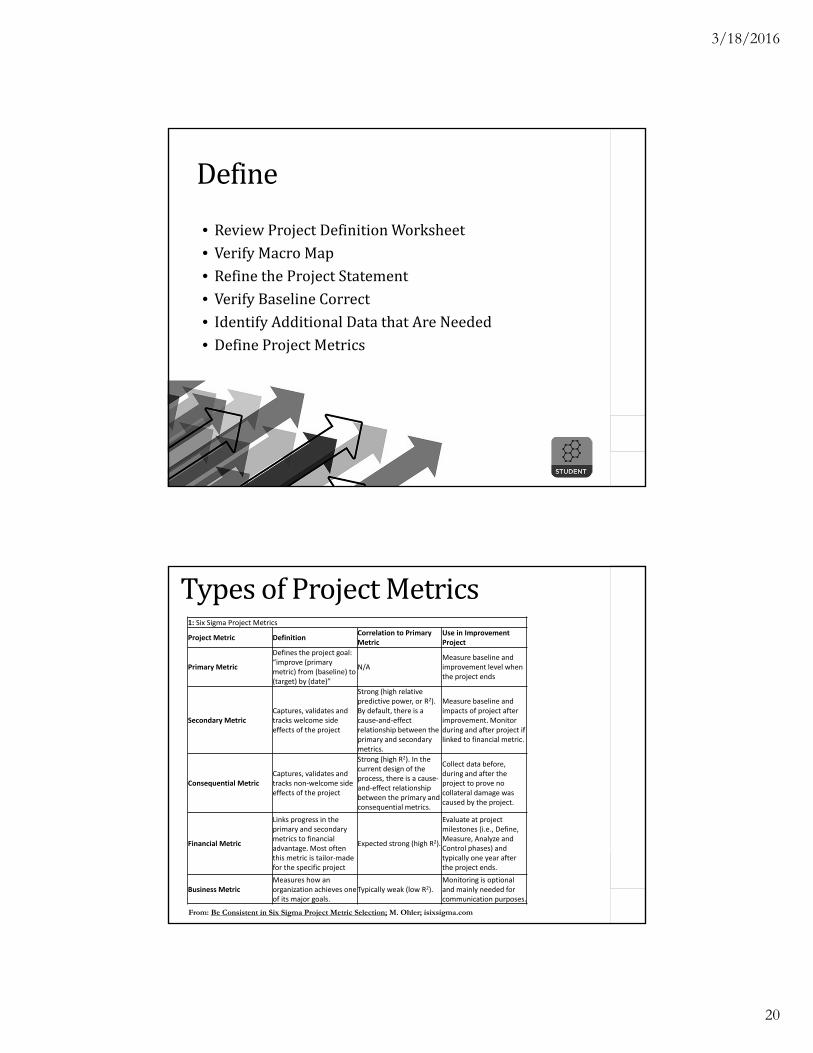
• ReviewProjectDefinitionWorksheet• VerifyMacroMap• RefinetheProjectStatement• VerifyBaselineCorrect• IdentifyAdditionalDatathatAreNeeded• DefineProjectMetrics
TypesofProjectMetrics1: Six Sigma Project Metrics
Project Metric DefinitionCorrelation to Primary Metric
Use in Improvement Project
Primary Metric
Defines the project goal: “improve (primary metric) from (baseline) to (target) by (date)”
N/AMeasure baseline and improvement level when the project ends
Secondary MetricCaptures, validates and tracks welcome side effects of the project
Strong (high relative predictive power, or R2). By default, there is a cause‐and‐effect relationship between the primary and secondary metrics.
Measure baseline and impacts of project after improvement. Monitor during and after project if linked to financial metric.
Consequential MetricCaptures, validates and tracks non‐welcome side effects of the project
Strong (high R2). In the current design of the process, there is a cause‐and‐effect relationship between the primary and consequential metrics.
Collect data before, during and after the project to prove no collateral damage was caused by the project.
Financial Metric
Links progress in the primary and secondary metrics to financial advantage. Most often this metric is tailor‐made for the specific project
Expected strong (high R2).
Evaluate at project milestones (i.e., Define, Measure, Analyze and Control phases) and typically one year after the project ends.
Business MetricMeasures how an organization achieves one of its major goals.
Typically weak (low R2).Monitoring is optional and mainly needed for communication purposes.
From: Be Consistent in Six Sigma Project Metric Selection; M. Ohler; isixsigma.com

3/18/2016
21
Define Worksheet
Define
• CreateProjectTimeline,MeetingPlan,andCommunicationPlan
• HelpfulTool:• ProjectCharter
Pro‐Tip:IssuesList
Worksheet

3/18/2016
22
Define
DMAICDefineMeasureAnalyzeImproveControl

3/18/2016
23
MeasureThe Process Map
WhyProcessMap?
• YouCan’tFixaProblemUntilYouUnderstandthePresentState• …HowItREALLYWorks• ….EveryoneSharestheSameUnderstanding
• ProcessMapsRevealWhereImprovementIsNeededMost
• ProcessMappingHelpsKeepaProjectinScope

3/18/2016
24
HowtoProcessMap
• GatherYourTeam• DefinetheEndPoints• BrainstormtheProcessSteps• PutProcessStepsinProperOrder
Pro‐Tip:UseStickyNotes
Activity
ProcessMapErrors
• OnlyWorkingwithThoseDistaltotheProcess• MappingtheImprovedProcessFirst• MappingtheWayaProcessis“SupposedtoWork”• IncorrectLevelofAbstraction• NotVerifyingAccuracy
3/18/2016
25
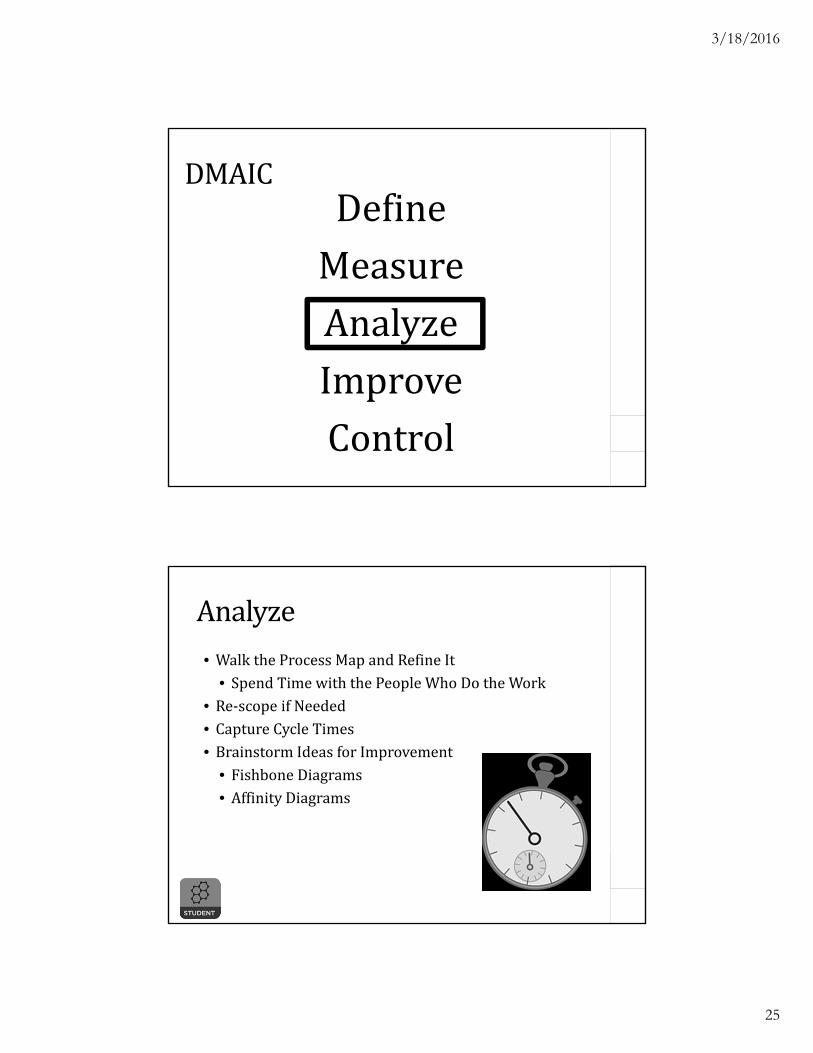
DMAICDefineMeasureAnalyzeImproveControl
Analyze• WalktheProcessMapandRefineIt
• SpendTimewiththePeopleWhoDotheWork• Re‐scopeifNeeded• CaptureCycleTimes• BrainstormIdeasforImprovement
• FishboneDiagrams• AffinityDiagrams
3/18/2016
26
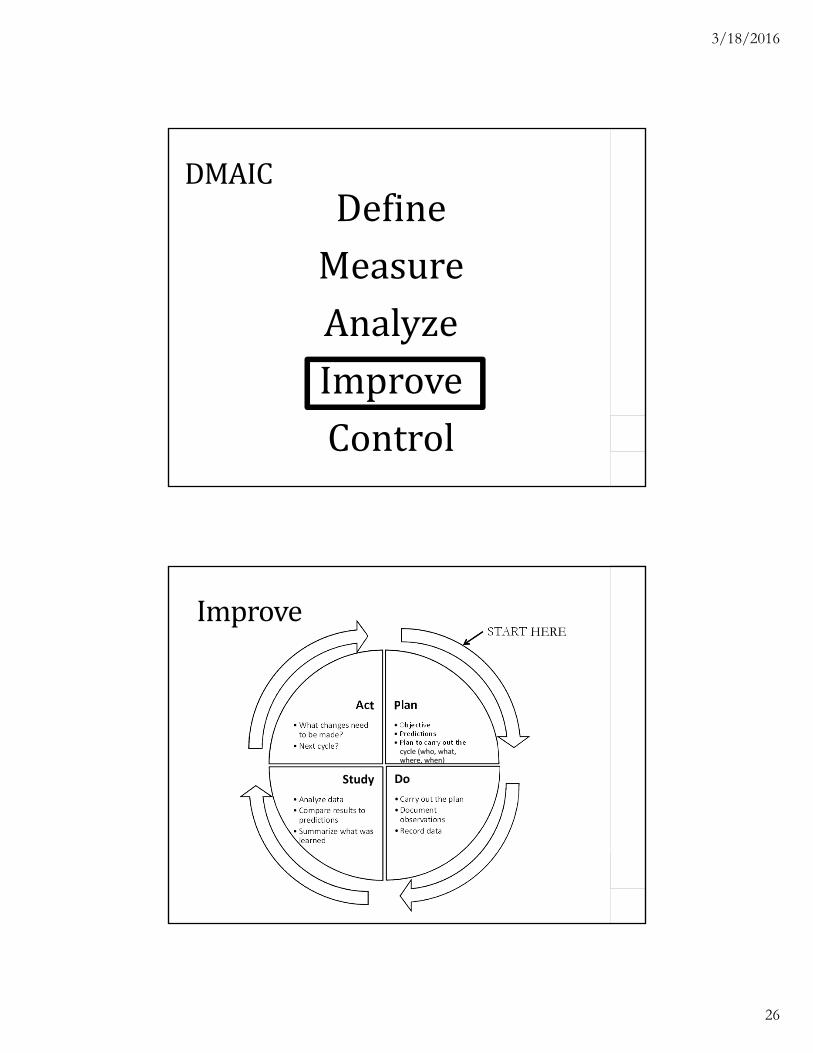
DMAICDefineMeasureAnalyzeImproveControl
START HERE
Plan
• Objective• Predictions• Plan to carry out the cycle (who, what, where, when)
• Plan for data collection (who, what, where, when)Do
• Carry out the plan
• Document observations
• Record data
Study
• Analyze data
• Compare results to predictions
• Summarize what was learned
Act
•What changes need to be made?
• Next cycle?
Improve

3/18/2016
27
DMAICDefineMeasureAnalyzeImproveControl
NowWhat?
CONTROL
• “Surface” Key Process and Outcome Measures
• Timely Data Entry =“Knowable” Individual and Group Performance
• Embed Use of Data into Management Repertoire
C
B
A

3/18/2016
28
CONTROL• ThisistheMostDifficultPhaseinDMAIC
• MaintainingtheGains
• Safeguards:WhatWillBeDonetoKeepThisonTrack?
• ResponsibilityRestsontheProcessOwner(RoleofKPI)
• WhatHappensinthisPhase?
• PicktheRightControlMethod(Checklists,Monitoring,Reporting)
• WhatisAcceptableVariance?
• DocumenttheResponsePlan
Focus andStreamline
Typical Desired
Data Collection/Measure
Data Analysis
Data Utilization/Improve
Plan/Define
Follow-up/Control
Changing the Approach is Key to Success

3/18/2016
29
Scorecard
ActiveManagementvs.AuditingFactor Active Management Auditing
Time Close to “Real Time” 6 Months, Yearly
Sample Size Population Served Sample
Focus Current Time and Prospective
Retrospective
Action Point‐in‐Time and Proactive
Reactive
Ownership Operations & QPM Compliance & Operations

3/18/2016
30
WhoeverOwnstheProcessAssumestheResponsibility
PuttingItAllTogether

3/18/2016
31
Questions?
Top Related