


Languages
Pages
Legal


Amazon Elasticsearch Service
Fully managed, reliable, and scalable Elasticsearch service.
Easy and Scalable Log Analytics
Inside a VPC
Lab Instructions

Contents Lab Overview ................................................................................................................................................ 4
Lab Goals ................................................................................................................................................... 5
Lab Materials............................................................................................................................................. 5
Amazon Elasticsearch Service Feature Details .......................................................................................... 6
Getting Setup ................................................................................................................................................ 8
Preparing Key Pairs ................................................................................................................................... 8
Using existing SSH Key .......................................................................................................................... 8
Creating a new SSH Key with EC2 ......................................................................................................... 8
Additional Instructions for Windows .................................................................................................... 8
Building the solution ..................................................................................................................................... 9
Create a service linked role for Amazon Elasticsearch Service ................................................................. 9
Install the CloudFormation templates .................................................................................................... 10
Launch the Application ........................................................................................................................... 16
Visualizing your data ................................................................................................................................... 19
Configure your index pattern .................................................................................................................. 19
Add a template to make your data more accessible .............................................................................. 23
Build a Kibana dashboard ........................................................................................................................... 25
A word on Elasticsearch aggregations .................................................................................................... 25
Simple metrics ......................................................................................................................................... 27
Track result codes ................................................................................................................................... 31
Visualize your traffic, separating ELB traffic from web traffic ................................................................ 36
Monitor bytes transmitted ..................................................................................................................... 38
Visualize query terms .............................................................................................................................. 39
Create a dashboard for monitoring ........................................................................................................ 39
Run queries from Kibana ............................................................................................................................ 42
Explore the _cat API ................................................................................................................................ 42
Explore the search API ............................................................................................................................ 42
Working with prebuilt dashboards. ............................................................................................................ 44
What next? .................................................................................................................................................. 46


Lab Overview
In this lab, you will build a working web application, served from within your VPC and
complete with a logging back end provided by Amazon Elasticsearch Service and with
real-time monitoring using Kibana. The application provides a movie search experience
across 5,000 movies, powered by Amazon ES and served with Apache httpd and PHP.
The logging infrastructure sends the httpd web logs to Amazon ES via Amazon
ElastiCache for Redis, which we use to buffer the log lines, and Logstash, which
transforms and delivers records to Amazon ES.
All components of the solution reside in a VPC. In this lab, we explore how to use Amazon
ES in a VPC for scalable log handing as well as for full text search. In addition to the
application and logging infrastructure, you will deploy an internet gateway to allow traffic
to flow to your application via an Application Load Balancer, and a proxy/bastion instance
to allow administrative and Kibana access.
For the logging infrastructure, we use Filebeat and Logstash on EC2, Amazon
ElastiCache for Redis and of course Amazon Elasticsearch Service. Filebeat is a host-
based log shipper that remembers its location if interrupted. Logstash collects, transforms
and pushes your data to your desired store which in this case is an Amazon Elasticsearch
Service Domain. The combination of these items gives a flexible, configurable, private
networked option within VPC that will allow you to scale as your volume increases.
ENI Logstash Apache / Filebeat Redis Elasticsearch Proxy
Admin / Security
YUM
Users

Lab Goals
Deploy a secure end to end solution within VPC Private Networking
Host two indexes (movies and logs) with which the solution interacts
Leverage managed services from AWS and popular tools from the Elasticsearch
ecosystem
Visualize the log interactions with Kibana
Lab Materials
The majority of this lab will be controlled with nested CloudFormation templates. The
templates will enable you to create the necessary resources needed to achieve the goals
of the lab without worrying about the details of getting the components set up to create
the solution.
The organization of the templates are as follows:
1) bootcamp-aes-moas – This template wraps the other templates below to provide
a single template that you can execute to deliver all of the infrastructure.
2) bootcamp-aes-network – builds the VPC, subnets, and NAT gateway and bastion
used for the lab activities and hosting the SSH Tunnel and proxy to the Amazon
ES domain.
3) bootcamp-aes-redis – builds the Amazon ElastiCache for Redis cluster.
4) bootcamp-aes-domain – builds the Amazon Elasticsearch Service domain
5) bootcamp-aes-logstash – builds a logstash deployment behind an Auto Scaling
Group that pulls from Redis and pushes into the Amazon Elasticsearch Domain.
6) bootcamp-aes-servers – builds the final layer, the web application. From this
layer, requests are logged each time the user interacts with the website; an IMDB
search engine.

Amazon Elasticsearch Service Feature Details
Placing an Amazon ES domain within a VPC enables secure communication between
Amazon ES and other services without the need for an Internet gateway, NAT device, or
VPN connection. All traffic remains securely within the AWS Cloud. Domains that reside
within a VPC have an extra layer of security when compared to domains that use public
endpoints: you can use security groups as well as IAM policies to control access to the
domain.
To support VPCs, Amazon ES places an endpoint into either one or two subnets of your
VPC. A subnet is a range of IP addresses in your VPC. If you enable zone awareness for
your domain, Amazon ES places an endpoint into two subnets. The subnets must be in
different Availability Zones in the same region. If you don't enable zone awareness,
Amazon ES places an endpoint into only one subnet.
The following illustration shows the VPC architecture if zone awareness is not enabled.
The following illustration shows the VPC architecture if zone awareness is enabled.

Amazon ES also places elastic network interfaces (ENIs) in the VPC for each of your data
nodes. Amazon ES assigns each ENI a private IP address from the IPv4 address range
of your subnet and also assigns a public DNS hostname (which is the domain endpoint)
for the IP addresses. You must use a public DNS service to resolve the endpoint (which
is a DNS hostname) to the appropriate IP addresses for the data nodes:
If your VPC uses the Amazon-provided DNS server by setting the
enableDnsSupport option to true (the default value), resolution for the Amazon
ES endpoint will succeed.
If your VPC uses a private DNS server and the server can reach the pubic
authoritative DNS servers to resolve DNS hostnames, resolution for the Amazon
ES endpoint will also succeed.

Getting Setup
Preparing Key Pairs
In order to access the EC2 instances deployed by the lab, you need an SSH key pair.
You can register a key pair for use by EC2 by following the instructions below.
Using existing SSH Key
http://docs.aws.amazon.com/AWSEC2/latest/UserGuide/ec2-key-pairs.html#how-to-
generate-your-own-key-and-import-it-to-aws
Creating a new SSH Key with EC2
http://docs.aws.amazon.com/AWSEC2/latest/UserGuide/ec2-key-pairs.html#having-
ec2-create-your-key-pair
Additional Instructions for Windows
Windows - http://docs.aws.amazon.com/AWSEC2/latest/UserGuide/putty.html#putty-
private-key

Building the solution
Create a service linked role for Amazon Elasticsearch Service
Ensure you have a user with a secret / access key that can execute IAM commands
If you have not created an AWS IAM user on your account, please go to the following
link to create the user. You will need the secret / access key from the user to leverage
the CLI unless you are running on an EC2 instance with a role for IAM.
https://docs.aws.amazon.com/IAM/latest/UserGuide/id_users_create.html
Give the user permissions to (create a policy, attach to user or role with user):
{
"Version": "2012-10-17",
"Statement": [
{
"Sid": "esclass",
"Effect": "Allow",
"Action": "iam:*",
"Resource": "*"
}
]
}
Create the secret / access key.
https://docs.aws.amazon.com/IAM/latest/UserGuide/id_credentials_access-keys.html
Ensure you have the latest version of the AWS CLI installed on your machine
Please navigate to the following link to install the CLI if does not exist.
https://docs.aws.amazon.com/cli/latest/userguide/installing.html
If you already have the CLI, you will need to ensure it is the latest. Leverage “pip
install”, “yum” or grab the latest .msi from the link above.
Once the CLI is at the latest and you have it configured using aws configure command
(add secret / access key, region –since iam is agnostic of region can be any – choose
us-east-1, and choose json format), you can then execute the following command:
aws iam create-service-linked-role --aws-service-name
es.amazonaws.com

Install the CloudFormation templates
Sign into your AWS account and navigate to the CloudFormation service
Click on the CloudFormation service to get into the service console.

Navigate to the Create Stack button to create the nested stack set
Once you click on the Create Stack button, you will be presented with the following options
set.
Select the “Specify an Amazon S3 template URL” and enter the following path:
https://search-sa-log-solutions.s3-us-east-2.amazonaws.com/logstash/templates/json/bootcamp-aes-moas
Click on the next button to navigate to the parameters needed to enact the
CloudFormation template.

Populate the parameters needed to create the stack
Most of the parameters are pre-populated and you will not need to change them. The
stack name, your SSH key and the email address fields are the only options you will need
to change for this template if you are not using a shared account. If you are using a
shared account, make sure you vary the stack name, domain name and environment tag
as these things differentiate your deployment in a shared account.
Let’s review the inputs and their meaning:
1) Stack Name – The name for this CloudFormation stack. You will find the details
on the Amazon ES domain, The IP address for the bastion, and the URL for the
web server in the Outputs section of this stack. Your initials will suffice.
2) CIDRPrefix – (use default) - this B block is used for the seed to create a /21
VPC with 2 - /24 public and 2 - /24 private subnets across 2 AZs.
3) ElasticsearchDomainName – (use default) - the name for your Amazon ES
domain.
4) EnvironmentTag – (use default) – used to tag your resources
5) KeyName – they Key Pair name you created
6) OperatorEMail – Email address to receive autoscaling notifications
Click Next.
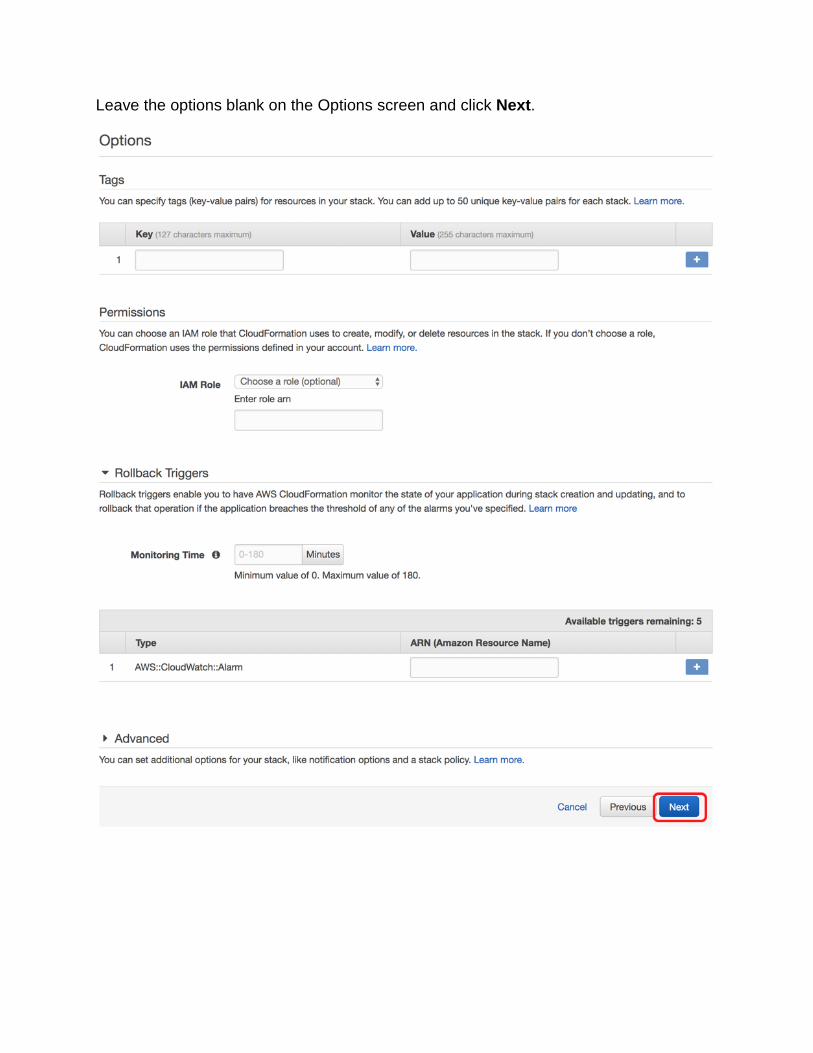
Leave the options blank on the Options screen and click Next.

Click the check box by I acknowledge that AWS CloudFormation might create IAM
resources with custom names and then click Create.
CloudFormation will kick off the deployment of the other templates to their own stacks. It
can take up to 30 minutes for the whole process to complete. You will see notations
called NESTED that indicate child stacks were created by the parent template. Click
the name of your stack (aes in my case) to see the details of the creation.

When the aes stack is done, you will see it marked CREATE_COMPLETE.
Click the check box next to aes to reveal details.
Then click the Outputs tab.
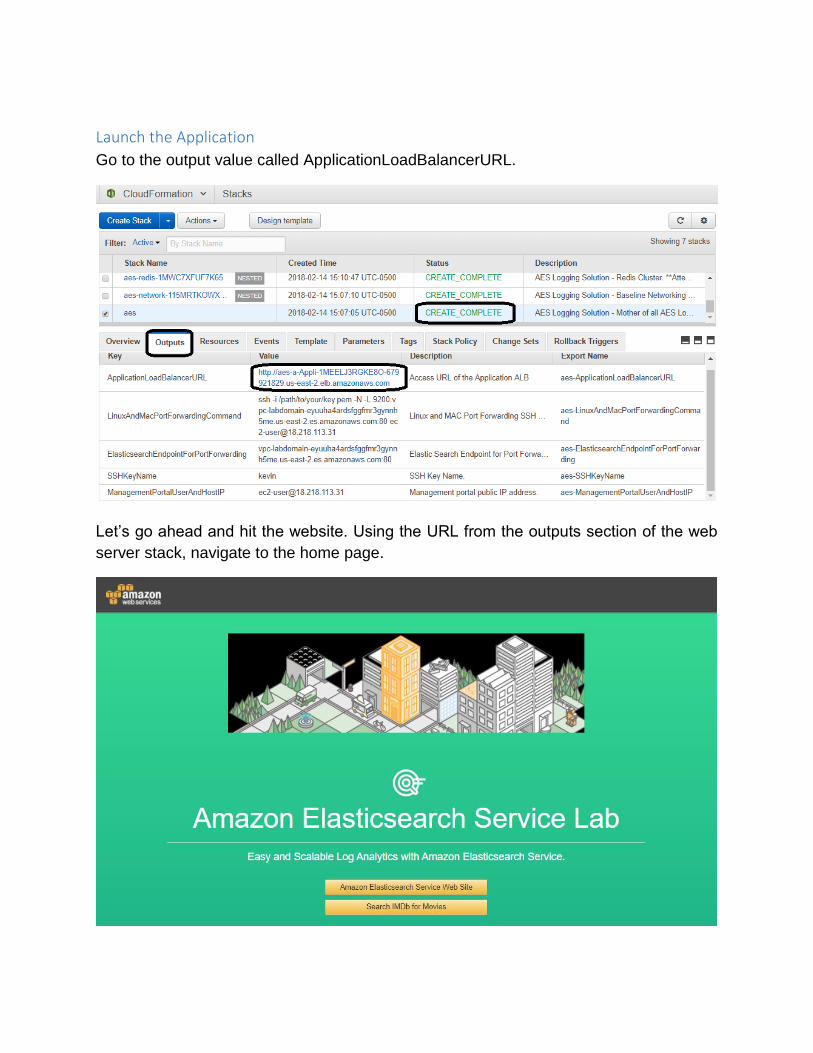
Launch the Application
Go to the output value called ApplicationLoadBalancerURL.
Let’s go ahead and hit the website. Using the URL from the outputs section of the web
server stack, navigate to the home page.

If you then navigate to the “Search IMDb for Movies” button and click on it, you will be
presented with the search page. In the search box for “Search movies”, enter in something
like “ship”, “car”, etc.
Type in a couple of words, click Search, and to get some search results.

Now that we have the solution up and running, let’s start visualizing our data.
Please use the following instructions for creating a tunnel and a proxy to the Amazon
Elasticsearch Domain.
Windows: https://search-sa-log-solutions.s3-us-east-
2.amazonaws.com/logstash/docs/Kibana_Proxy_SSH_Tunneling_Windows.pdf
Linux / Mac: https://search-sa-log-solutions.s3-us-east-
2.amazonaws.com/logstash/docs/Kibana_Proxy_SSH_Tunneling_Mac_Linux_Loft.pdf

Visualizing your data
Open your browser and hit http://localhost:9200/_plugin/kibana. You will see a splash
screen, followed by
Configure your index pattern
Kibana enables seamless access to data in your indexes through an index pattern. You
specify the index pattern on the start page, and Kibana automatically figures out which
indexes to hit for the time range you are displaying. You tell Kibana where to look by
specifying an index pattern.
Logstash creates one index per day by default, named “Logstash-YYYY.MM.DD”. You
use a wildcard to specify the pattern of these indexes, specified in the Index name or
pattern text box. Since Kibana is designed to work with Logstash indices, the correct
pattern is already filled in for you.
Kibana also uses a date field to filter to a particular time frame. This is already filled in for
you in the Time Filter field name drop down.
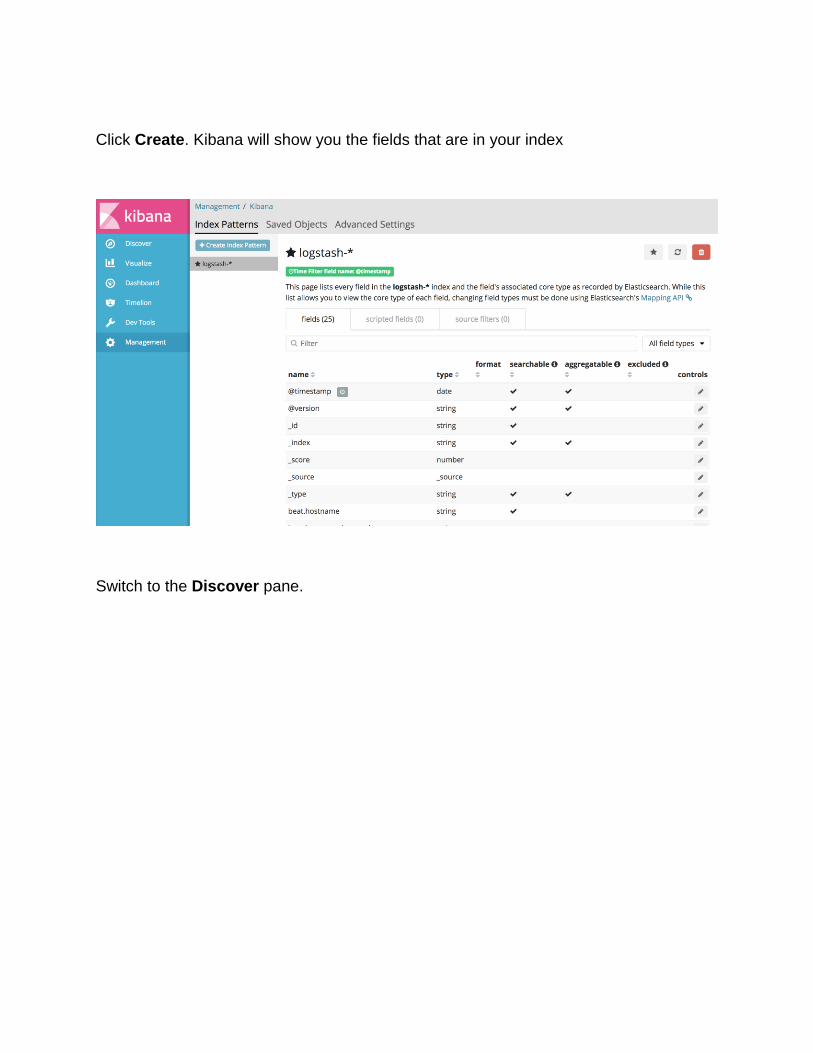
Click Create. Kibana will show you the fields that are in your index
Switch to the Discover pane.

Kibana shows you a graph of the traffic, and below it a sample set of results. You can see
in the top right the current time frame that you are viewing (Last 15 minutes). You can
examine some of the log data by clicking the disclosure triangle next to one of the
documents (log lines) below the traffic histogram.

Most or all of your data will be the same at this point.
We want to keep our visualizations up to date and Kibana will do that automatically. Click
Last 15 minutes at the top/right of the screen to reveal the time selector. You can adjust
the time range and all of Kibana’s panels will update to show data from that time frame.
For now, leave that set to Last 15 minutes, and click Auto-refresh.
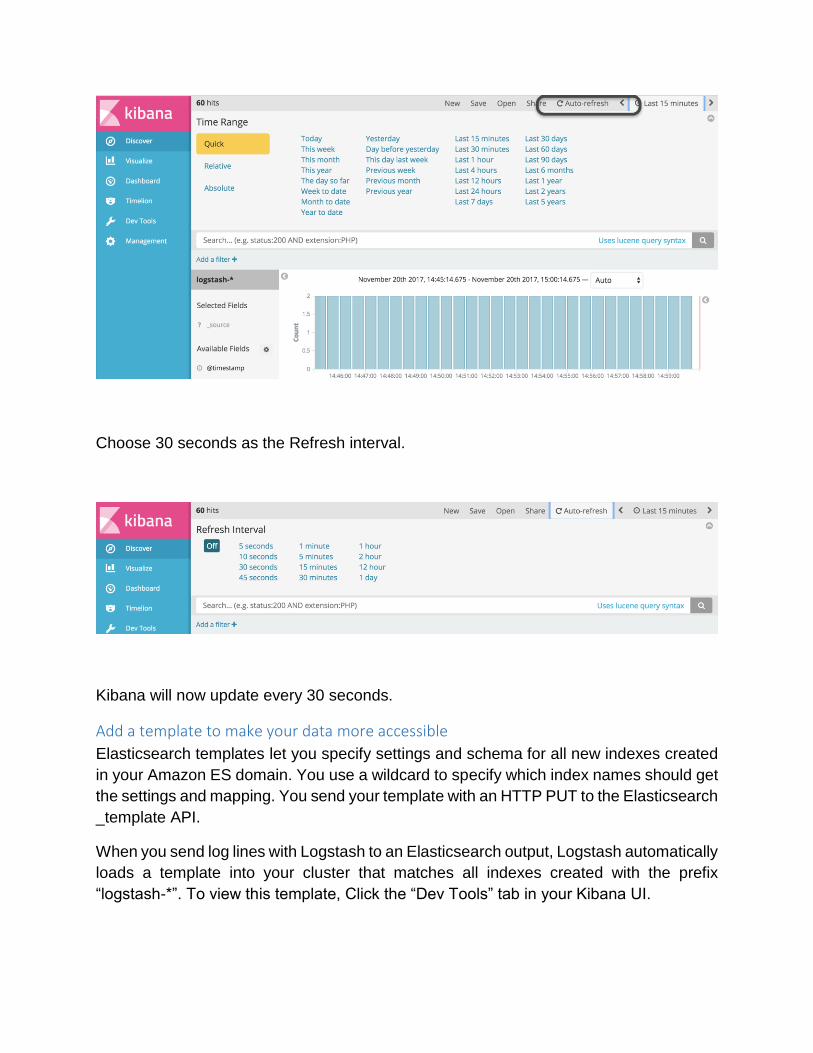
Choose 30 seconds as the Refresh interval.
Kibana will now update every 30 seconds.
Add a template to make your data more accessible
Elasticsearch templates let you specify settings and schema for all new indexes created
in your Amazon ES domain. You use a wildcard to specify which index names should get
the settings and mapping. You send your template with an HTTP PUT to the Elasticsearch
_template API.
When you send log lines with Logstash to an Elasticsearch output, Logstash automatically
loads a template into your cluster that matches all indexes created with the prefix
“logstash-*”. To view this template, Click the “Dev Tools” tab in your Kibana UI.

Type GET _template and press the green arrow (notice that Kibana helps auto-complete
as you type). In the right pane, you will see the default template that Logstash loads into
your Amazon ES domain.
You will add a new template that stores the field data (values) for the keywords field,
which records the search terms that users have typed. You can use that field data to build
more complex visualizations to follow the way that people are using the movie search
application.
Erase what you’ve typed in the left pane of the Dev Tools Kibana tab. Copy paste this
text
PUT _template/template1
{
"order": 0,
"version": 1,
"template": "logstash-*",
"mappings": {
"log": {
"properties": {
"keywords": {
"type": "text",
"fielddata": true
}
}
}
}
}
Push the green arrow to send the command. Elasticsearch will acknowledge in the right
pane.
This template and its settings will be applied to all new indexes you create. However,
Logstash has already created an index and loaded in some log files. We can make sure
the template is defined by deleting the existing index. When Logstash sends the next
batch, Elasticsearch will automatically recreate the index. Type DELETE logstash* in the
left pane and press the green arrow. Elasticsearch will acknowledge in the right pane.
Now you need to refresh the index pattern to reflect the new field mapping you created.
Select the Management tab. Then click Index Patterns. Click the refresh icon at the top-
right of the screen, and OK to reset field popularity counters
Build a Kibana dashboard Kibana has a set of visualizations that you can configure and deploy into a dashboard.
When you enable Auto-refresh, you get near-real-time monitoring for your web server.
In the following sections, you’ll set up a number of visualizations and create a dashboard
from those visualizations.
A word on Elasticsearch aggregations
Kibana builds visualizations based on the Elasticsearch aggregations feature. To
understand how to build visualizations, you need to understand aggregations.
Elasticsearch is a search engine first, and an analytics engine second. When you send
log data into an Elasticsearch cluster, you, or the ingest technology you are using, parse
each log line and build structured JSON documents from the values in it. Here’s an
example log line
192.168.0.167 - - [21/Nov/2017:00:15:18 +0000] "GET / HTTP/1.1" 200 12943 "-"
"ELB-HealthChecker/2.0"
When Filebeat sends that line to Logstash, Logstash parses the full string, and assigns
the values to JSON elements. Each element represents a single field, whose value is the
value from the log line. Logstash parses and structures the above log line to produce

{
"request": "/",
"agent": """"ELB-HealthChecker/2.0"""",
"auth": "-",
"ident": "-",
"verb": "GET",
"referrer": """"-"""",
"@timestamp": "2017-11-21T00:15:18.949Z",
"response": "200",
"bytes": "12943",
"clientip": "192.168.0.167",
"beat": {
"name": "ip-192-168-2-76",
"hostname": "ip-192-168-2-76",
"version": "5.6.4"
},
"httpversion": "1.1",
"timestamp": "21/Nov/2017:00:15:18 +0000"
}
When you perform a search, you specify fields (explicitly or implicitly), and values to match
against those fields. Elasticsearch retrieves documents from its index whose field values
match the fields you specified in the query. The result of this retrieval is called a match
set.
Elasticsearch then creates an aggregation by iterating over the match set. It creates
buckets according to the aggregation (e.g., time slices) and calculating a numeric value
(e.g., a count) placing each value from the document’s field into the appropriate bucket.
For example, a search for documents with a @timestamp in the range of 15 minutes ago
to now might yield 60 matches. An aggregation for those values with 1 minute buckets
would increment the count in the newest bucket (1 minute ago to now) for each document
with a @timestamp in that range.
Aggregations nest. Elasticsearch can take all of the documents in a bucket and create
sub-buckets based on a second field. For example, if the top-level bucket is time slices,
a useful sub-bucket is the response. Continuing the example, Elasticsearch will create
sub-buckets for each value of the response field present in one of the documents in that
bucket. It increments a counter in the sub-bucket for each document with that sub-
bucket’s value. This analysis of the data can be displayed as a stacked, bar chart with
one bar per time slice and height of the sub-bars proportional to the count.

Count is not the only function that Elasticsearch can perform. It can compute sums,
averages, mins, maxes, standard deviations and more. This provides a rich set of
combinable functions to be the basis for Kibana to display.
Simple metrics
The simplest thing you can do is to count the requests to your web server and display
that count as a number. Click the Visualize tab at the left of the Kibana page, then click
Create a visualization or the button.
You can select from among 18 different visualizations (as of Amazon Elasticsearch
Service’s support for Kibana 6.3). Under Data, click Metric.

You need to tell Kibana which indexes to search, and you do that by specifying the index
pattern that you want to use. Click logstash-*.
You’ll immediately get a metric, named Count, that sums the total number of documents
(web log lines) the domain has ingested in the last 15 minutes. Let’s add to that by
creating another metric that reports the unique number of hosts that have sent requests
to the domain. Click Add metrics.

Under Select metrics type, click Metric. Open the menu under Aggregation, and select
Unique Count.
This will reveal another menu: Field. Select referrer.keyword. Click at the top of the
entry panel to show the second metric in the visualization.
Repeat this process to add a Unique Count for the request.keyword field. This will let
you know how many different requests are coming to your web servers. Your visualization
should look like this:

At this point, all of my traffic is heartbeats from ELB, so I have only 1 source and 1 request.
If you’ve run a couple of searches, you may have different counts.
Save your visualization for later use in your dashboard. At the top of the screen, click
Save.
Name the visualization Metrics, and click the Save button. Navigate to the Simple
Search Page in your browser and run a few searches. Come back to Kibana and you
should see the counts increase.

Track result codes
To make sure that your website is functioning, you need to track result codes. You can
build a simple visualization to see result codes over time. Click the Visualize tab once,
and if you see a visualization instead of the below screen, click Visualize again to clear
it. Click the to create a new visualization.
Select Vertical Bar as the type, Click logstash-* under Name as the index pattern
Many of the Kibana’s visualizations work with both an X and a Y axis. When you build
these visualizations, you’ll usually start by dividing the X axis into time slices (a Date
Histogram aggregation) and then further sub-dividing for the value you want to graph.

Under Buckets, click X-Axis.
Then, select Date Histogram from the Aggregation menu.

Kibana automatically selects the @timestamp field. If you click now, you’ll see a
duplicate of the Discover pane, with a histogram of traffic in time slices. We’ll subdivide
the time slices by the values in the response field. Click the Add sub-buckets button.
Then click Split Series under Select Buckets Type. Select Terms from the Sub
Aggregation menu.
Then select response from the Field menu.

Click and you will see something like this
Now Save this visualization as Response codes. You can see I have all 200 responses,
along with one 404.
That’s somewhat interesting, but it’s more interesting to monitor for error codes.
Remember, Elasticsearch is a search engine. We can modify the results by adding a
search in the search bar. Replace the * in the large text box with NOT response:200 and

hit enter. This will filter the data for this visualization to only those documents that do not
have HTTP 200 responses; that is, errors (if you don’t have any error responses, the
visualization may be empty).
When you change the parameters of a visualization in Kibana, it will overwrite your
existing visualization even if you give it a different name. Save this visualization as Error
codes, but be sure to check the Save as a new visualization check box.

Visualize your traffic, separating ELB traffic from web traffic
You can further exploit Elasticsearch’s search capabilities to build visualizations that
combine different data series. Well use Filter aggregations to create a line chart with
ELB traffic (heartbeats) separated from other traffic.
Click the Visualize tab, and if there’s a stored visualization, click Visualize again to clear
it. Click the to create a new visualization.
Select Line from the visualization types and click logstash-* under Name as the index
pattern.

Create a Date Histogram, X-Axis aggregation (see the previous section if you don’t
remember how to do that). Then, click Add sub-buckets and Split series. For the Sub
aggregation, select Filters
In the Filter 1 box, type agent:"ELB-HealthChecker". Be sure to include the double-
quote. Click Add Filter, and type NOT agent:"ELB-HealthChecker" in the Filter 2
box. Go back to the Simple Search page, run a few searches, return to the Kibana page,
click and you should see something like this:
Save this visualization as Traffic.

Monitor bytes transmitted
To this point, we have use a date histogram on the X axis and a count on the Y axis. You
can also apply functions to the underlying data. Let’s build a line graph that sums bytes
sent from the web servers over time.
Click Visualize (and click it again to get to the new visualization panel). Click the button
to create a new visualization, and choose Line. Select the logstash-* pattern.
Now, click the disclosure triangle next to Y-Axis to reveal the parameters for the Y axis.
Drop the Aggregation menu and choose Sum. Drop the Field menu and choose bytes.
Now set the X-Axis for a Date Histogram, click and you should see something like
this (you may have to hit the website to generate some outbound traffic).

Save the visualization as Bytes Sum
Visualize query terms
When you use the search interface, the keywords you’re searching are in the URL that
you send. Logstash splits those out into a “keywords” field. You can build a visualization
to show common query terms. Create a new visualization and scroll down to select Tag
Cloud. Select “logstash-*” pattern. Select Tags under Select bucket type. Select
keywords.keyword under Fields. Click to see the visualization. Save this
visualization as Keywords cloud. ( Navigate to the Simple Search Page in your browser
and run a few searches to get the Tag Cloud populated )
Create a dashboard for monitoring
You can gather all of your visualizations into a dashboard. With Auto-repeat on, you can
monitor the key metrics of your website, in near real time. Click on the Dashboard tab,
then Create a dashboard.
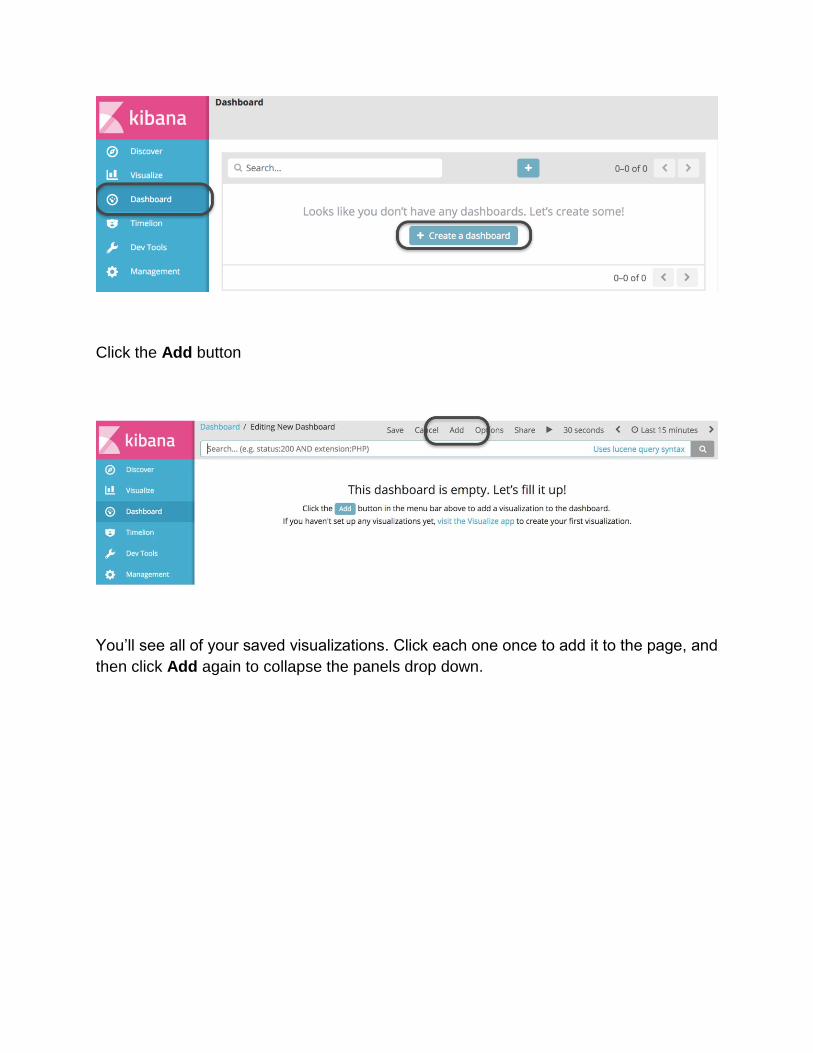
Click the Add button
You’ll see all of your saved visualizations. Click each one once to add it to the page, and
then click Add again to collapse the panels drop down.

You can use the handle to drag the panels around, and the lower, right corner to resize
the panels. The control in the lower left corner reveals a data table view.
You can choose Request to view the Elasticsearch query that powers the table,
Response to view Elasticsearch’s response to the query, and Statistics to see timing
and result information.

You can save your dashboard, by clicking Save at the top of the screen. Data for
visualizations and dashboards is saved in Elasticsearch itself. Any time you connect
Kibana to this cluster, you can retrieve your saved dashboard and visualizations.
Run queries from Kibana We’ll close our discussion with a walk through the Dev Tools tab of Kibana. Through the
dev tools, you can send HTTP requests directly to Elasticsearch. You can access both
query and administrative functions.
Explore the _cat API
When you want to know summary details on various elements of the Elasticsearch
cluster, the _cat API is your first place to look. Click the Dev Tools tab in Kibana. Type
GET _cat in the left half of the split pane, then the to run the query. Notice that Kibana
helps out with auto-complete.
Kibana shows the response in the right half of the split pane. The _cat API has many sub-
APIs that you can call. Try GET _cat/indices?v (the v parameter adds table headers).
This gives you a list of all of the indices in your Amazon ES domain, along with their sizes
and shard counts. You’ll see the logstash-* index, where Logstash is sending the web
logs, the .kibana index, which holds the visualizations and dashboards, and the movies
index, which is serving queries from the web page. GET _cat/nodes?v gives an overview
of the nodes in your cluster. GET _cat/shards?v shows the location of all of the shards
in the cluster, along with their size and state.
Explore the search API
Let’s explore the search that powers the Simple Search Page. The page takes the
keywords from the text box and inserts them into the following query:
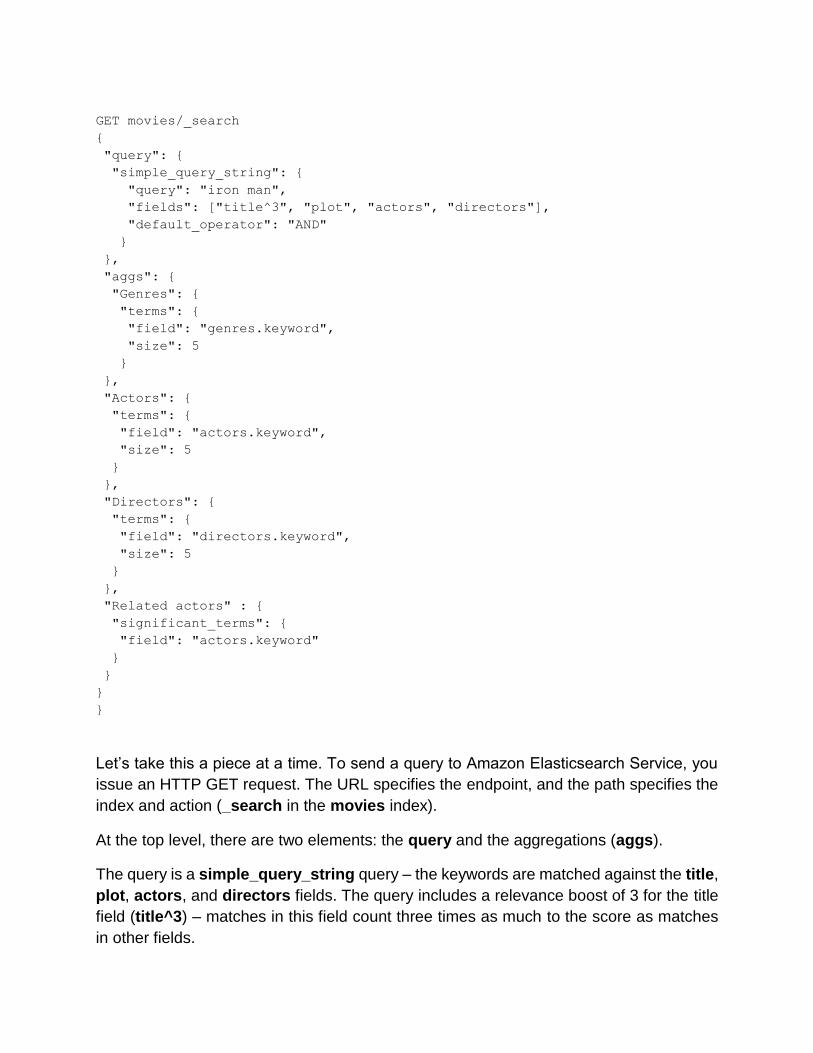
GET movies/_search
{
"query": {
"simple_query_string": {
"query": "iron man",
"fields": ["title^3", "plot", "actors", "directors"],
"default_operator": "AND"
}
},
"aggs": {
"Genres": {
"terms": {
"field": "genres.keyword",
"size": 5
}
},
"Actors": {
"terms": {
"field": "actors.keyword",
"size": 5
}
},
"Directors": {
"terms": {
"field": "directors.keyword",
"size": 5
}
},
"Related actors" : {
"significant_terms": {
"field": "actors.keyword"
}
}
}
}
Let’s take this a piece at a time. To send a query to Amazon Elasticsearch Service, you
issue an HTTP GET request. The URL specifies the endpoint, and the path specifies the
index and action (_search in the movies index).
At the top level, there are two elements: the query and the aggregations (aggs).
The query is a simple_query_string query – the keywords are matched against the title,
plot, actors, and directors fields. The query includes a relevance boost of 3 for the title
field (title^3) – matches in this field count three times as much to the score as matches
in other fields.

The query specifies four aggregations – genres, actors, directors, and a special
significant_terms aggregation for the actors field. For actors, directors, and genres, the
results will contain the top five buckets based on their counts. The Related actors
aggregation will show any actors that have a different match pattern for this result set
than their distribution across all documents would suggest.
Copy-paste, and run the query. You can change the keywords, change the default
operator, or even change the query type to something different.
Working with prebuilt dashboards. In this section we will look at metricbeats. The data originates from the metricbeat install
on your instances. Prebuilt dashboards can be selected to display a variety of details.
Navigate to the index patterns and create a pattern for metricbeat-*

Use timestamp@ as Time Filter field name. Under advanced options – enter
“metricbeat-*” as Custom Index Pattern ID. Click Create index pattern.
Go back to the visualizations and play around with the beats visualizations and
dashboards. These are good examples of out of the box visualizations and dashboards
that you can use.

What next? In this lab, you deployed a working web page served through an internet gateway in your
VPC. You sent log data to Amazon Elasticsearch Service via Filebeat, Amazon Redis,
and Logstash, all within your VPC. You set up administrative and Kibana access to the
Amazon ES domain, then built a working dashboard and visualizations.
Continue to explore the different visualizations in Kibana. Can you create a panel to
display a pie chart of requests subdivided into the hosts that sent them? How about a
heat map for the request URLs?
Top Related