


Languages
Pages
Legal

DEPARTMENT OF ECONOMICS
UNIVERSITY OF CRETE
BE.NE.TeC. Working Paper Series
Working Paper: 2012-03
Using data envelopment analysis to measure hotel efficiency in Crete
Alexandros Apostolakis, George Datseris, Constantine Manasakis
Business Economics & NEw TeChnologies Laboratory
www.soc.uoc.gr/benetec
1
Using data envelopment analysis to measure hotel efficiency in Crete
Alexandros Apostolakisa, George Datserisb and Constantine Manasakisc*
a Department of Economics, Portsmouth Business School, University of Portsmouth,
Richmond Building, Portland StreetPO3 DE, Tel.:0044-23-92844779, E-mail: [email protected]
b Department of Finance and Insurance, School of Management and Economics, Technological Educational Institute of Crete, Agios Nikolaos 72100, Greece. E-mail:
[email protected] c* Corresponding author, Department of Political Science, University of Crete,
University Campus at Gallos, Rethymnon 74100, Greece, Tel: 0030-28310-77446, E-mail: [email protected]
ABSTACT
The present paper studies the relative efficiency between hotels operating under a brand and hotels operating independently, in the island of Crete, Greece, using the Data Envelopment Analysis. Interestingly enough, we find that nationally branded hotels are the relatively most efficient; internationally branded are the least efficient, while those operating under a local brand and the independent ones lie in between. This efficiency ranking can be explained by the interplay between operating under a brand and being to changes in the local market’s conditions. We also investigate the inefficiency causes and make suggestions for improvements, in the transformation of inputs to outputs, for each type of hotels studied.
KEYWORDS: Superior hotels, Crete, technical efficiency, scale efficiency, slack analysis
Part of this research was undertaken while C. Manasakis was visiting the Department of Economics, Universidad Carlos III de Madrid. We would like to thank Konstantinos Andriotis, Dimitris Koutoulas and Maria Tugores Ques, for their helpful comments and suggestions. Full responsibility for all shortcomings is ours.
2
1. INTRODUCTION
It is well established that the global market for tourism services is a key source of economic growth. The World Tourism Barometer (UNWTO, 2012) estimates that international tourist arrivals reached a total of 980 million in 2011, exhibiting a steady annual increase of 10%. Moreover, Pulina et al. (2010) cite evidence according to which, travel and tourism are responsible for 300 million direct and indirect jobs and represent 13% of the world’s gross domestic product.
Within this global market, Greece is an established tourism destination in the European tourism industry (UNWTO, 2012). SETE (2011) reports that travel and tourism activity in Greece contributes with 15.3% of its GDP and 18.4% of its total employment. The projections to 2021 suggest that the relevant contributions will be increased, implying the crucial role of tourism for the Greek economy. In this context, Crete, the largest island of Greece, attracts almost 2.8 million tourists annually, more than 35% of the national total (HNTO, 2008). Given the importance of Crete’s tourism sector on the local and national economy and the fierce competition between Mediterranean destinations, it is of high interest to examine hotel efficiency in the island. Yet, to the best of our knowledge, there is no relevant study measuring hotel efficiency either for Greece or Crete. Moreover, in the context of fierce competition among tourism destinations in the Mediterranean, hotel branding in Crete has become a strategy for risk reduction, survival, competitive advantage and profitability (Koutoulas, 2009). Hence, a further question is whether the managerial practice of hotel branding guarantees efficiency levels higher than the respective of the hotels operating as totally independent.
Motivated by the above, the present paper attempts to address the following two questions: First, what is the relative efficiency of hotels operating under a brand as compared to those operating as totally independent in the island of Crete? Second, what are the relevant inefficiency causes among hotels and what recommendations could be provided for their improvements? The present paper contributes in both these respects since it is first attempt to examine hotel efficiency in Greece.
To fulfill the above objectives, we construct a sample constituted by 50 superior hotels (Luxury and class A) operating in Crete in 2008. These hotels are classified into four categories, with respect to their type of operational management: hotels operating under an international brand, under a national brand, under a local (Cretan) brand, and finally hotels operating as totally independent. The relative technical efficiency in the above hotels is estimated through the Data Envelopment Analysis (DEA hereafter) methodology, which, regarding a hotel is “a comparative measure of how well it actually processes inputs to achieve its outputs, as compared to its maximum potential for doing so, as represented by its production possibility frontier” (Barros and Mascarenhas, 2005; p. 416). The input variables used in the present study are the number of employees, the number of beds and the total operational cost of a hotel. They reflect the required resources to achieve particular managerial goals. The

3
relevant output variables used, are total revenues total number of nights spent in an establishment, reflecting broad managerial goals and objectives.
As far as the first question is concerned, our results suggest that the hotels in our sample operating under a national brand are the relatively most efficient, followed by those operating under a local brand. Then, the independently operating hotels hold the third position in the relevant efficiency ranking, followed by the hotels operating under an international brand. This relatively high efficiency of the nationally and locally branded hotels can be explained by the advantages of belonging to a brand which is flexible to changes in the relevant local market’s conditions. Regarding the independently operating hotels, they have the maximum potential for flexibility; yet, they have no branding potentials to exploit. Finally, the internationally branded hotels’ efficiency is relatively low because although they exploit high visibility and internationally established managerial practices, their flexibility and ability for adjustments to the local market is relatively low.
Regarding the second question of the present paper, we investigate the inefficiency causes and make suggestions for improving the transformation of inputs to outputs. Regarding the input slacks, our results suggest that when compared to independent ones, branded hotels, are characterized by a relative oversupply of beds, are relatively overstaffed and operate with a relatively higher cost. We can thereby infer that the independently operating hotels need to adopt more slack movements with respect to their inputs for improvements in their efficiency scores. Furthermore, our analysis suggests that both the independent and branded hotels should make adjustments in their outputs in order to improve their efficiency scores. More specifically, the branded hotels, compared to the independent ones, should increase their total revenues relatively more; and the independent hotels should increase their overnight stays relatively more as compared to branded hotels.
The rest of the paper is organized as follows. Section 2 reviews the relevant literature studying hotel efficiency and Section 3 gives a brief description of the hospitality sector in Crete. Section 4 describes the sample and Section 5 the methodology used. In Section 6, we present our empirical results, regarding the hotel efficiency, the inefficiency causes and the respective recommendations for improvements. Finally, Section 7 concludes the paper.
2. LITERATURE REVIEW
Catering to the research objectives of the present paper, a recent branch of the literature studies hotel efficiency using the DEA methodology. In particular, Barros (2005) examines the efficiency of hotels belonging to the Portuguese state-owned chain Pousadas de Portugal, by estimating the pure technical efficiency (BCC index developed by Banker et al., 1984) and the overall efficiency (CCR index, developed by Charnes et al., 1978), using as inputs: the number of full time workers, the cost of labour, the number of rooms, the hotel’s surface area, the hotel property’s book value,
4
the operational cost and the external costs; and as outputs: the revenues, the number of guests and the nights spent. He finds that the majority of hotels in the Pousadas chain is efficient, identifies the slacks in inputs and outputs of the inefficient hotels; and argues that the findings based in the DEA can suggest operational changes towards efficiency improvements.
Hwang Shiuh-Nan and Chang Te-Yi (2003) study the overall efficiency evolution in 45 hotels with different managerial styles and types of customers in Taiwan, using as inputs: the number of employees, the number of rooms, the total meal department area and the operating expenses; and as outputs: the room revenues and the revenues of food and beverage. Their findings suggest that differences in the types of customers and the style of management lead to differences in the evolution of the overall efficiency.
Chiang et al. (2004) examine the relative pure technical efficiency of different operational styles in 25 hotels in Taipei, using as inputs: the number of hotel rooms, the food and beverage capacity, the employees’ number and the total cost; and as outputs: the revenues of food and beverage, miscellaneous revenues and revenues per available room. They find that the franchised or international managed hotels perform more efficiently rather than the independently operating ones.
Sigala et al. (2005) contributed by developing a stepwise approach to DEA combining correlation and DEA analysis for developing robust models and sound productivity measurement. Applying it to a dataset of three-star hotels in the UK, they identify six inputs (the rooms’ number, the front office payroll, the administration and general M&O expenses, the other payroll, the demand variability and other M&O expenses) and three outputs (the average room rate, the number of room nights and the non room revenue) as the factors affecting rooms division efficiency in three star hotels.
More recently, Perrigot et al. (2009) evaluated the relative technical efficiency among hotel chains in France, using as inputs: the hotel chain’s age, the hotel chain’s size in rooms, the chain’s expansion measured with the number of openings during the year, royalties in percentage and the chain’s quality ranking; and as outputs: the occupancy rate and the total sales. They find that the predominantly company-owned chains and the plural form chains are both technically efficient, in contrast to the predominantly franchised hotel chains which are technically inefficient.
Neves and Lourenco (2008), in a worldwide sample of 83 hotels, investigate whether DEA can be used as a tool for strategic analysis in hotel management. Their main conclusions are: first, the performance of hotels is better under a focus strategy rather than under a diversification strategy; second, managers should concentrate on productivity improvements (transformation of inputs into outputs; and third, the identified decreasing returns-to-scale imply that a decrease in the size of the hotels would have a positive effect on their average efficiency level.
5
Pulina et al. (2010) evaluate the relative technical efficiency of Italian hotels, applying a dynamic DEA with the cost of labour representing the input variable and the revenues as well as the generated added value representing the output variables. They find that Italian regions exhibit stability in technical efficiency during the examined period, while Molise and Lombardy are the most efficient regions. Restricting their attention to Sardinia, they find that the most technically efficient are the medium sized hotels.
Sigala et al. (2005) contributed by developing a stepwise approach to DEA combining correlation and DEA analysis for developing robust models and sound productivity measurement. Applying it to a dataset of three-star hotels in the UK, they identify six inputs (the rooms’ number, the front office payroll, the administration and general M&O expenses, the other payroll, the demand variability and other M&O expenses) and three outputs (the average room rate, the number of room nights and the non room revenue) as the factors affecting rooms division efficiency in three star hotels.
3. THE HOSPITALITY SECTOR IN CRETE
Crete is the largest island of Greece with a total extent of 8.335 km2 covering the 6.3% of the country’s total surface. It consists of four administrative prefectures: Heraklion, Lassithi, Rethymno and Chania and represents almost 5.5% of the country’s total population and 5.3% of national GDP (HNTO, 2011). The island of Crete attracts almost 2.8 million tourists annually, more than 35% of the national total (HNTO, 2008). According to Andriotis et al. (2007), the tourism sector of the island has consistently played a leading role to its economic growth and development during the last decades. Moreover, it has consistently acted as the interface for strong inter-sectoral connections between agriculture, commerce, transportation, construction and services, with further multiplying growth effects (Andriotis and Vaughan, 2008).
According to Briassoulis (2003), tourism development in Crete started in the late ’60s when tourists were attracted to Greek destinations mostly for their natural and cultural attractions and local capital took advantage of state provided economic incentives to invest in large hotels. From mid-1970s to mid-1980s onwards, the demand for tourism in Crete started becoming substantially influenced by foreign tour operators. This demand, which was mainly expressed form Western Europe, was consistently increasing with tourist accommodation units attaining their highest growth during this period. By 1981 the number of hotel beds had almost tripled in the island. In Andriotis (2011) words “up to now tourism development in Crete was directed to the attraction of more tourists through the increase of the number of beds in the coast, rather than trying to provide diversified products and services to meet tourists’ diversified needs and desires (Andriotis, 2002; 2003; 2005)”.
Since the mid-1980s, Crete has become an established tourist destination in the Mediterranean, with foreign tour operators controlling the largest part of tourist
6
demand (Andriotis, 2011). Although, Crete has remarkable natural, cultural and historical resources (Andriotis and Vaughan, 2008), since the mid-1980s the island attracts, almost entirely, low spending package tourists (Andriotis, 2003; 2006) who tend to buy inclusive tour packages organised exclusively in origin countries and visit coastal resorts (Andriotis, 2011).
Andriotis and Vaughan (2008) survey evidence (Donatos and Zairis 1991; Tsitouras 1998; HNTO, 2008) suggesting that it is precisely because of the mass type of tourists visiting Crete that tourism in the island has an unequal seasonal distribution of activity with 85 percent of tourist arrivals taking place from May to September. This has consequent effects on hotels’ occupancy rates, which range from over 75 percent from May to September; fall to less than 20 percent during the low season and are almost unused during the winter.
The rapid expansion of accommodation supply in Crete, jointly with the strong seasonal demand, has led to excess capacity on the island’s accommodation capacity. According to the Greek Chamber of Hotels (2009), the accommodation supply in Crete, counted in terms of hotel beds, is almost 25% higher than the respective demand. This results to fiercer competition, consistent with price decreases and stronger dependence on tour operators. Koutoulas (2006) presents evidence according to which, the resort hotels in Crete secure 78% of their customers through tour operators, creating oligopsony market situations.
In this context, hotel branding has become a strategy for risk reduction, survival, competitive advantage and profitability (Cai and Hobson, 2004; Holverson and Revaz, 2006; O’Neill and Xiao, 2006). According to Koutoulas (2009), 28% of room capacity in Crete operates under a branded hotel group, while the national average is 19%.
4. METHODOLOGY
According to Barros and Mascarenhas (2005, p. 416), the efficiency of a hotel is “a comparative measure of how well it actually processes inputs to achieve its outputs, as compared to its maximum potential for doing so, as represented by its production possibility frontier”.
The analytical framework which we follow to measure efficiency in the Cretan hospitality market is the DEA, a multifactor linear programming model, which was first introduced by Farrell (1957). DEA measures the efficiency of a single unit, a Decision-Making Unit (DMU), which transforms inputs (resources) to outputs (products or services). Barros et al. (2009) argue that DEA departs from other methodologies measuring efficiency because of its ability to use multiple inputs and outputs without imposing any specific functional form, or other restrictions on the dataset; neither does it make distributional assumptions for the inefficiency terms.
Efficiency, in the DEA context, deals with the optimization of the resource allocations among alternative uses. More specifically, DEA yields a linear production
7
surface which, in economic terms, represents the best production possibility frontier. By projecting a DMU to this frontier and comparing it with a single reference unit or a convex combination of other reference units, we estimate the DMU’s efficiency.
The first DEA efficiency index, developed by Charnes et al. (1978) (CCR index), assumes constant returns-to-scale (crs) production technology, i.e., an increase in the inputs is followed by the same proportional increase in the outputs for all DMUs. The CCR index is calculated by maximizing the ratio of the weighted sum of outputs over the weighted sum of inputs for all units, according to (1).
∑
∑ (1)
Subject to:
0∑
∑1
With: 0, 1, … , and 0, 1, … ,
Where h0 is the efficiency score of the DMU under study; i = inputs (i =1, 2, …, m); j = DMUs (j = 1, 2, …, n); r = outputs (r = 1, 2, …, s); 0 = unit under consideration; Xij is the i input of j DMU; Yrj is the r output of j DMU. The weights Ur and Ni are calculated as the values which have to be matched to each input and output variable in order to maximize the efficiency ratio of a DMU. Following Thanassoulis et al. (1996), the number of DMUs (J) must be higher or equal to the number that will result from the multiplication of inputs (N) and outputs (M), i.e., J ≥ N*M. This is because the units have N*M possibilities to be efficient and so, one could expect at least N*M unit identifications to be efficient.
Given a set of DMUs, the model determines for each DMU the optimal set of input weights and output weights that maximize its efficiency ratio h0. A DMU is considered both scale and pure technically efficient, if its ratio h0 is equal to one. A score of less than one means that the DMU is inefficient and implies that a linear combination of other units from the sample could produce the vector of outputs using a smaller vector of inputs.
The second DEA efficiency index, developed by Banker et al. (1984) (BCC index), assumes variable returns-to-scale (vrs) production technology and measures only pure technical efficiency for each DMU. Following García Sánchez (2009), the main distinction between the BCC and the CCR models is the introduction of a parameter that relaxes the constant returns-to-scale condition by not restricting hyperplanes, defining the envelopment surface to go through the origin. For a DMU to be considered as BCC efficient, it only needs to be pure technically efficient.
revedecr
efficDMcomthe samwithFinatecheffic
firstall bthemhomOurcateundand Koudire
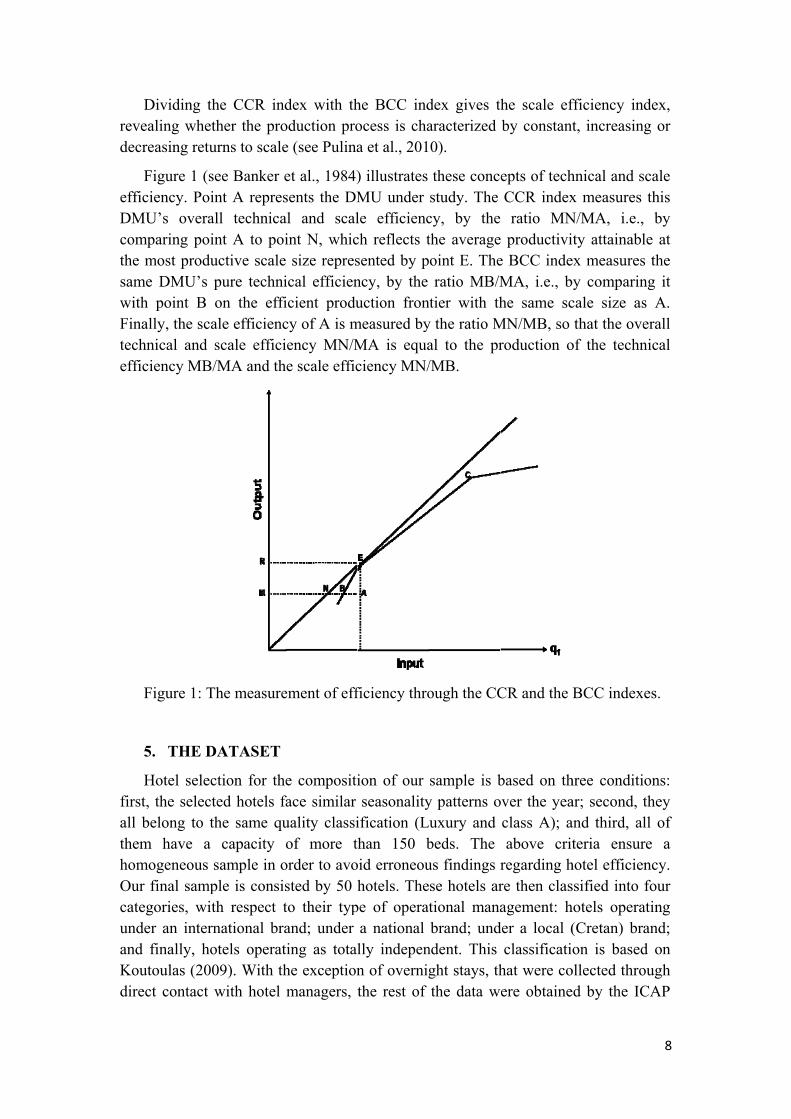
Dividing thealing whetreasing retu
Figure 1 (sciency. Poi
MU’s overamparing poin
most produme DMU’s ph point B ally, the scahnical and ciency MB/
Figure 1: T
5. THE D
Hotel select, the selectbelong to thm have a mogeneous sr final sampegories, witder an intern
finally, houtoulas (200ect contact w
he CCR indther the prourns to scale
ee Banker ent A represll technicant A to poi
uctive scalepure technion the effi
ale efficiencscale effici/MA and th
The measure
DATASET
ction for theted hotels fahe same qucapacity o
sample in ople is consisth respect tnational braotels operat09). With thwith hotel
dex with thoduction proe (see Pulina
et al., 1984)sents the DMal and scalint N, whic size represical efficienicient producy of A is miency MN/Me scale effic
ement of eff
e compositiface similar uality classiof more t
order to avosted by 50 hto their typand; under ting as totalhe exceptionmanagers, t
he BCC indocess is chaa et al., 201
) illustrates MU under le efficiencch reflects tsented by pncy, by the uction fron
measured byMA is equaciency MN/
ficiency thro
ion of our seasonality
ification (Lthan 150 boid erroneouhotels. The
pe of operata national lly indepenn of overnigthe rest of
dex gives tharacterized 0).
these concstudy. The cy, by thethe averageoint E. Theratio MB/M
ntier with thy the ratio Mal to the pr/MB.
ough the CC
sample is by patterns o
Luxury and beds. The us findings rse hotels artional manabrand; und
ndent. This ght stays, ththe data w
he scale efby constan
epts of techCCR index ratio MN
e productivie BCC indeMA, i.e., bhe same sc
MN/MB, so roduction o
CR and the
based on thover the yea
class A); aabove crit
regarding hre then clasagement: h
der a local (classificati
hat were coere obtaine
fficiency innt, increasin
hnical and sx measures
N/MA, i.e.,ity attainablex measuresby comparincale size asthat the ove
of the techn
BCC index
hree conditiar; second, tand third, alteria ensur
hotel efficiessified into hotels opera(Cretan) braon is based
ollected throed by the IC
8
dex, g or
scale this by le at s the ng it s A. erall nical
es.
ons: they ll of re a ncy. four
ating and; d on ough CAP
9
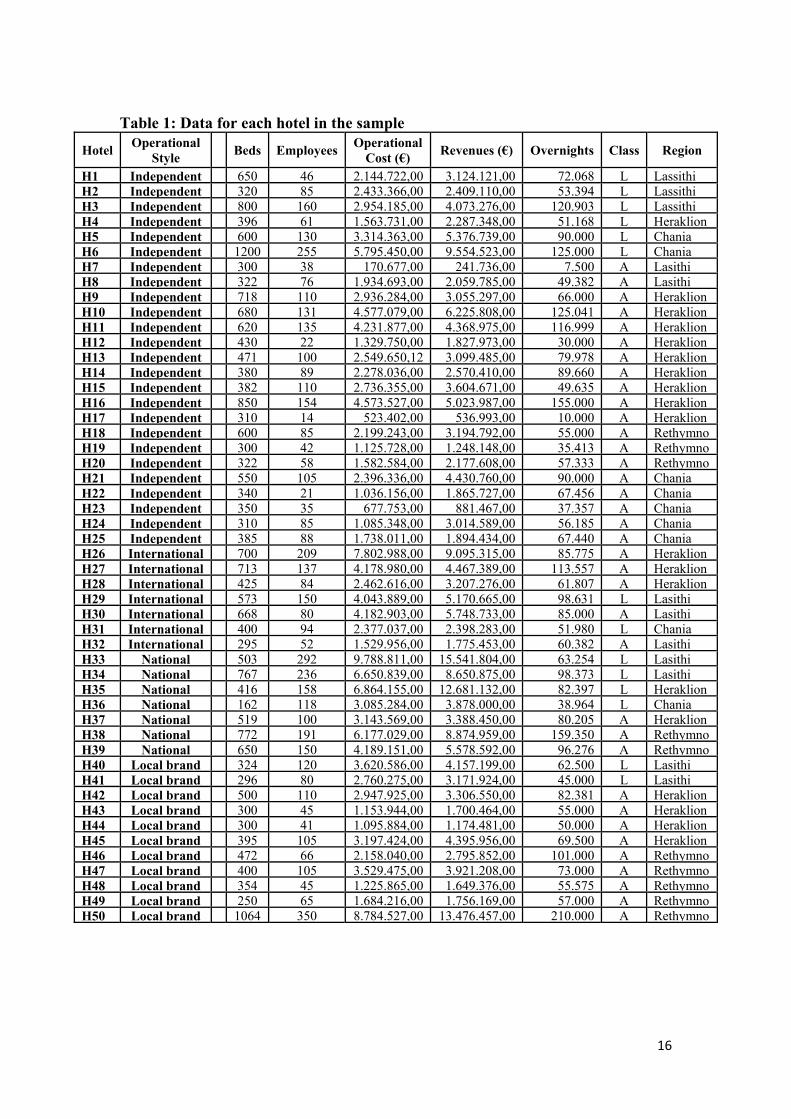
Group Databank for the year 2008. Table 1 below presents the summary statistics of our sample.
[Table 1 --- About Here]
The variables which were chosen as inputs in the study reflect the required resources to achieve particular managerial goals. The number of employees measures the human resources in a hotel (Barros, 2005; Hwang and Chang, 2003; Chiang et al., 2004; Barros and Mascarenhas, 2005; Anderson et al., 1999). The number of beds and the total operational cost of a hotel (see Barros, 2005; Hwang and Chang, 2003; Chiang et al., 2004) measure the capital inputs used. The variables which were chosen as outputs in the present study reflect broad managerial goals and objectives. The first output variable is total revenues, comprising of room revenues, food and beverage revenues and other sources of revenues (Neves and Lourenco, 2008; Anderson et al., 1999). The second output variable chosen was the total number of nights spent (fullness indicator) (Barros, 2005; Barros and Mascarenhas, 2005).
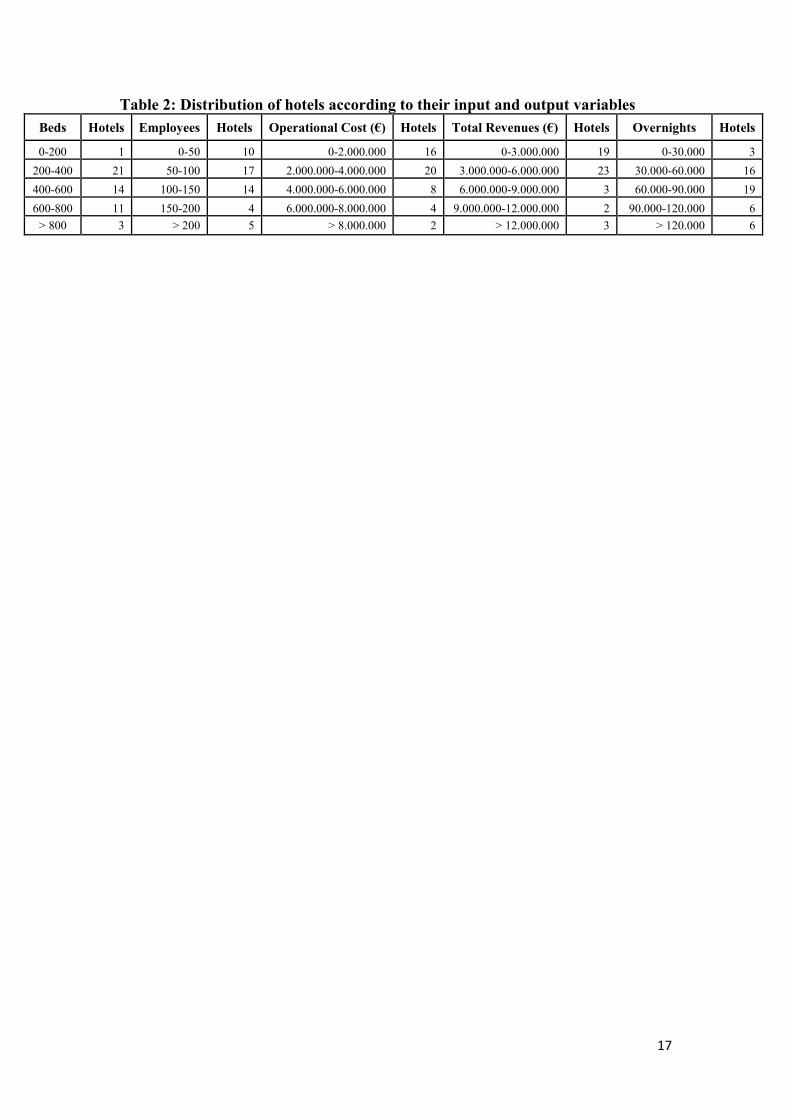
Table 2 below describes the sample. According to the analysis, the majority of hotels in the sample has a capacity of 200-400 beds, employed between 50-100 persons, has an annual operational cost of 2-4 million Euros, annual total revenues between 3-6 million Euros, and between 60-90 thousands overnight stays per year. The average hotel in the sample had 496 beds, employed 108 persons, operated with 3.130.473 Euros annual cost, earned 4.202.206 Euros net profits with 75.896 overnight stays.
[Table 2 --- About Here]
6. EMPIRICAL RESULTS
6.1. Efficiency Results
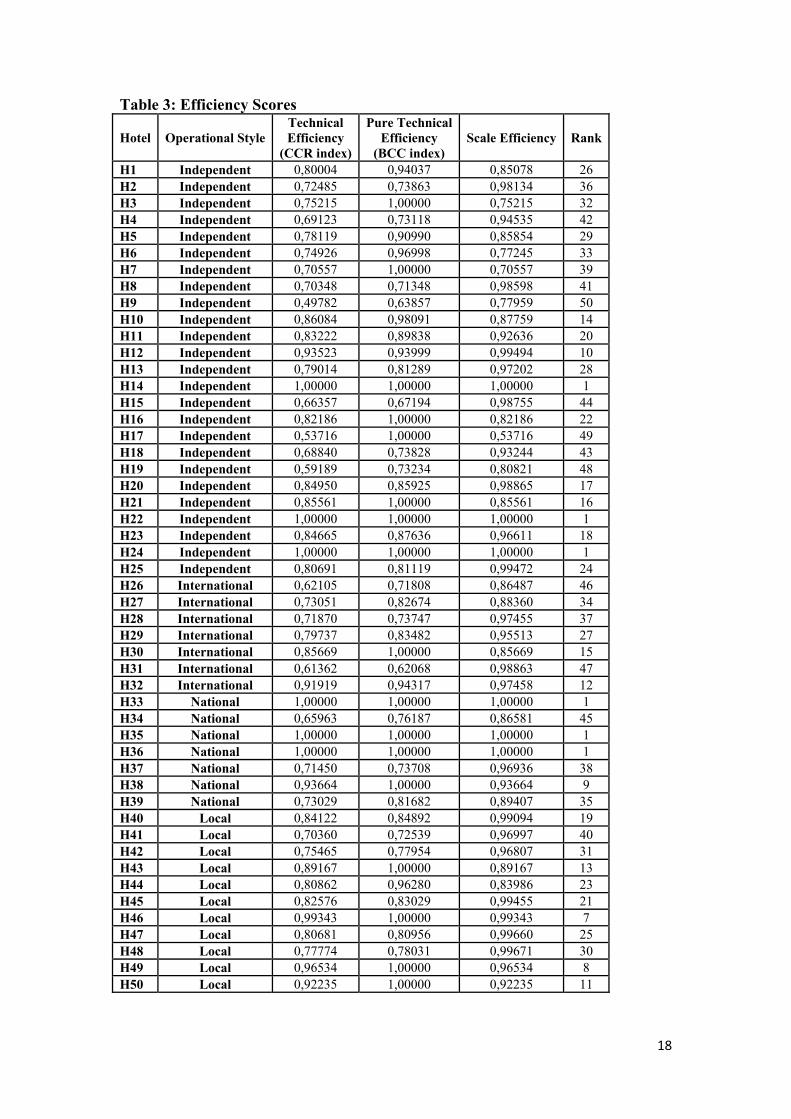
The relevant efficiency computations have been carried out using the “DEA-solver” software package. The pure technical, technical and scale efficiency scores for each hotel of our sample are presented in Table 3.
[Table 3 --- About Here]
The third column illustrates the technical efficiency (CCR) index results. This efficiency index is equal to 1 for six hotels, three independently operating and three branded hotels, implying that they operate with relative 100% efficiency, as compared to the overall sample. It is noteworthy that all the above branded hotels are nationally branded. The fourth column illustrates the pure technical efficiency (BCC) index results, according to which, a significantly larger number of hotels (17) operate with 100% relative efficiency, in transforming their inputs to outputs, as compared to the overall sample too. The last efficiency index which is illustrated in Table 3 is the
10
scale efficiency of DMUs. The evidence on hand indicates that only three hotels of each operational style are 100% scale efficient. Thus, the empirical results tend to suggest that the main source of hotels’ inefficiency is scale economies.
Let us now consider the average efficiency index for each operational management type of hotels in our sample. According to the overall technical efficiency estimates (CCR index), nationally branded hotels operate at 86% efficiency level, holding the leading position in the relevant efficiency ranking. This is mainly due to a number of pioneering national hotel brands (such as the Grecotel hotel chain which operates partly under TUI). The locally branded hotels are following close by with an average of 84% overall efficiency level. This illustrates the strong influence of micro and macro environmental knowledge on hotels’ operations combined with brand name advantages. Hence, nationally and locally branded hotels are likely to sustain a high level of capabilities and best business practices in the relevant market. The hotels operating as totally independent follow with an overall efficiency score of 78%. Finally, the internationally branded hotels with 75% overall efficiency seems to have limited adaptation to local conditions. Qualitatively similar findings are reached when considering pure technical efficiency estimates (BCC index).
The evidence above suggests an overall picture which can be rationalized as follows: Nationally and locally branded hotels operate under relatively high efficiency levels because they combine the advantages of branding jointly with their flexibility to changes in the conditions in the relevant local market On the contrary, although the independently operating hotels have the maximum potential for flexibility and adjustments, they have no branding potentials to exploit. Finally, hotels operating under international brands seem to exhibit relatively low efficiency scores because of their respective relatively low ability for adjustments to the local market.
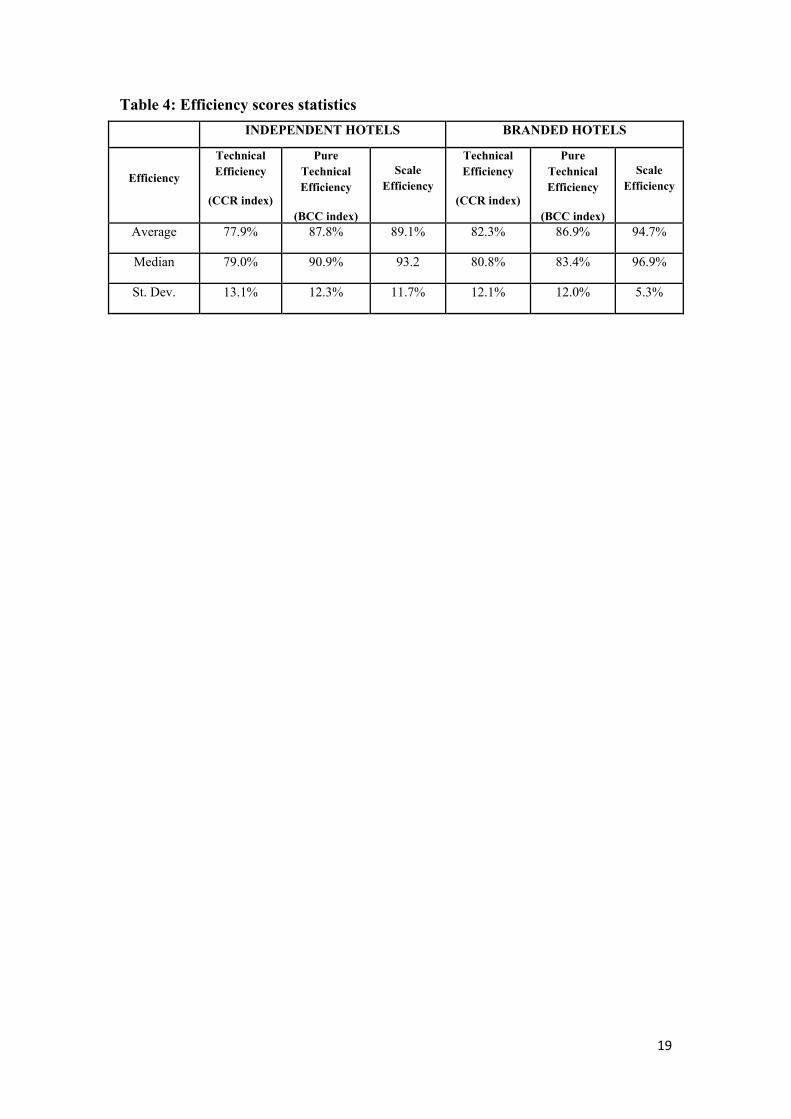
Following the analysis above, we then restrict our attention to the relative efficiency scores between independent and branded hotels. The relevant results are presented in Table 4.
[Table 4 --- About Here]
Results on technical efficiency suggest that branded hotels operate at an average level of 82.3% efficiency, higher than the respective 77.9% for the independently operating hotels. A similar gap is identified for scale efficiency. Interpreting these two findings, we argue that the branded hotels’ DMUs are relatively closer to their optimal size, as compared to the respective size for the independently operating hotels. Moreover, the branded hotels seem to “waste” fewer resources as compared to independently operating hotels. Considering the pure technical efficiency, the relevant efficiency gap between branded and independently operating hotels is reduced to almost 1%.
The scale efficiency index on Table 4 is higher as compared to pure technical efficiency index for both the independent and branded hotels. This identifies a

11
weakness in productivity, for both the branded and the independently operating hotels in our sample. Hence, both types of hotels’ operational goal should become to improve their transformation processes of inputs into outputs. Independently operating hotels should further prioritize the optimization of their scale size.
6.2. Slack Analysis and Managerial Implications
One of the most useful insights provided by the DEA is the set of target values for the DMUs improvement through specific recommendations. In Barros (2005, p. 470) words, under DEA, “adjustments for the inefficient hotels can be identified for outputs and inputs in order for them to join the efficient frontier”. Hence, a further qualitative analysis on a case-by-case basis is usually necessary, to determine the sources of their inefficiencies so as to undertake the appropriate actions for improvements. This task will help us address the second research question.
The examination of input and output slacks, in Table 5 below, provides interesting suggestions for corrections in inputs and outputs, so that inefficient DMUs can become efficient.
[Table 5 --- About Here]
Indicatively, in order the hotel H1 to be efficient, it should reduce its operational capacity by 192 beds and make an effort to increase its overnight stays by 664.
Table 6 below presents the classified levels of input and output slacks for the independent and branded hotels. The column titled ‘slack/input ratio’ indicates the relative importance of each slack. A high slack/input ratio score indicates a large potential for non-proportional input reduction. Furthermore, it reflects an extravagance of the corresponding input. Correspondingly, the lower the ratio score is, the fewer adjustments are required for efficiency improvements.
[Table 6 --- About Here]
Based on the results presented in Table 6, the following observations are in order:
First, as far as bed capacity is concerned, the ratio of 10.96% for the independent hotels implies the need for a significant decrease (scaling down) in their operational capacity, as compared to the branded hotels, for which the respective ratio is zero. This finding suggests that independent hotels provide a relative oversupply of beds, illustrating in this way their relative low bargaining power with tour operators. On the contrary, branded hotels appear to be more capable in handling their operational capacity. This reflects branded hotels’ relatively better bargaining position against tour operators when setting prices. This piece of evidence also illustrates the power of network and brand externalities over (alleged) economies of scale running through the sector.
Second, as far as employees are concerned, the relevant ratio for the independent hotels (5.87%) is higher than the respective for branded hotels (2.40%). This piece of
12
evidence suggests that independent hotels are relatively overstaffed. Moreover, independent hotels could produce the same level of outputs with 5.24 less staff on average, while the respective rate for branded hotels is 3.06. This implies that branded hotels seem to have better human resource management as compared to independent hotels in Crete.
Third, the slack/input ratio of operational cost is slightly higher for the branded hotels (0.94%) as compared to independent hotels (0.92%). Moreover, branded hotels are able to produce the same level of outputs as compared to independent hotels at a lower operational cost of 37.149 Euros on average. This may have been resulted either due to poor operational management among independent hotels, or through branded hotels’ continuous efforts for higher quality tourism services coupled with lower prices. We can thereby infer that independently operating hotels need to adopt relatively more slack movements with respect to their inputs for improvements in their efficiency scores.
The slack/output ratio column shows the relative importance of each slack on the outputs produced. The output ratio of total revenues is higher for branded hotels (0.31%) as compared to the one for independent hotels (0.24%). This suggests that branded hotels should place more emphasis, as compared to independent hotels, on increasing their total revenues in order to improve their efficiency. The overnights ratio is higher for independent hotels (2.23%) as compared to branded hotels (1.63%). Note also that independent hotels should increase their overnight stays by 1.570 on average in order to improve their efficiency scores. The higher ratio for independent hotels further reflects the need for better utilization of bed capacity.
The above analysis indicates that that both types of hotels should make adjustments in their corresponding outputs. Branded hotels should pay greater attention to the increase of their total revenues while the attention for independent should focus to the increase of their overnight stays.
7. CONCLUSIONS
Within the global market for tourism, the island of Crete is an established tourism destination attracting annually more than 35% of Greece’s total number of tourists. Given the fierce competition among destinations in the Mediterranean, hotel branding in Crete has recently become a strategy for risk reduction, survival and profitability. Despite the importance of Crete’s tourism sector on the local and the national economy, no attempt has been undertaken up to date to investigate how efficiently hotels operate in the island.
The aim of the present paper was to study the relative efficiency between hotels operating under a brand and hotels operating as totally independent in the island of Crete; as well as to identify the relevant inefficiency causes and provide recommendations for improvements.
Using the DEA methodology, we studied a sample of 50 hotels of class A and Lux, operating in Crete in 2008. We found that hotels operating under a national
13
brand are the most efficient; hotels operating under an international brand are the least efficient, while those operating under a local brand and the independent ones lie in between. This efficiency ranking can be explained by a brand’s flexibility to changes in the local market’s conditions. National and local branded hotels exploit the advantages of branding, while at the same time; they are flexible to changes in the relevant local market’s conditions. The independently operating hotels have the maximum potential for flexibility; yet, they have no branding potentials to exploit. Finally, the internationally branded hotels’ efficiency is relatively low because although they exploit high visibility and internationally established managerial practices, their flexibility and ability for adjustments to the local market is relatively low.
Regarding the inefficiency causes, our results suggest that the independent hotels, compared to the branded ones, offer a relative oversupply of beds, are relatively overstaffed and operate with a relatively higher cost. These imply their need to adopt relatively more slack movements with respect to their inputs for improvements in their efficiency. Regarding the relevant slack movements in outputs, our results suggest that the branded hotels, compared to the independent ones, should try to increase their total revenues relatively more; and the independent hotels should try to increase their overnight stays relatively more than the branded hotels.
Although the present paper contributes since it is the first attempt to measure hotel efficiency in Greece, we are aware of its limitations. Firstly, although Greece has offers different destinations, such as the Cyclades islands, Ionian islands and Dodecanese, the sample of the present study has been restricted to Crete. Secondly, our data cover only the year 2008. Constructing a dynamic panel data set, including more destinations for an expanded interval of years would allow us to generalize our analysis so as to reach more robust results and offer managerial and policy implications.
References
Anderson, R.I., Fish, M., Xia, Y., Michello, F., 1999. Measuring Efficiency in the Hotel Industry: A Stochastic Frontier Approach. International Journal of Hospitality Management 18 (1), 45-57.
Andriotis, K., 2002. Dependency on tour operators. Problem faced by the Cretan tourism businesses and the views of their owners/managers. International Journal of Hospitality and Tourism Administration 4 (3), 23-48.
Andriotis, K., 2003. Tourism in Crete. A form of modernisation. Current Issues in Tourism 6 (1), 23-53.
Andriotis, K., 2005. Community groups’ perceptions and preferences to tourism development: Evidence from Crete. Journal of Hospitality and Tourism Research 29 (1), 67-90.
Andriotis, K., 2006. Host, guests and politics - Coastal resorts morphological change. Annals οf Tourism Research 33 (4), 1079-1098.
Andriotis, K., 2011. A Comparative Study of Visitors to Urban, Coastal and Rural Areas - Evidence from the Island of Crete. European Journal of Tourism Research 4 (2), 93-108.
14
Andriotis, K., Agiomirgianakis, G., Mihiotis, Α., 2007. Tourist vacation preferences - The case of mass tourists to Crete. Tourism Analysis 12 (1/2), 51-63.
Andriotis, K., Vaughan, D.R., 2008. Reality, Perceptions and Tourism Policy in Crete. The Interrelationship. Journal of Hospitality and Tourism 1, 29-43.
Banker, R.D., Charnes, A. Cooper, W.W., 1984. Some models for estimating technical and scale inefficiencies in data envelopment analysis. Management Science 30 (9), 1078-1092.
Banker, R.D., Charnes, A., Cooper, W.W., Swarts, D. Thomas, D., 1989. An introduction to DEA, with some of its models and their uses. Research in Governmental and Non Profit Accounting 5, 125-163.
Banker, R.D., Charnes, A., Cooper, W.W., 1984. Some models for estimating technical and scale inefficiencies in data envelopment analysis. Management Science 30 (9), 1078-1092.
Barros, C.P., 2005. Measuring efficiency in the hotel sector. Annals of Tourism Research 32 (2), 456-477.
Barros, C. P. Mascarenhas, M.J., 2005. Technical and allocative efficiency in a chain of small hotels. International Journal of Hospitality Management 24 (3), 415-436.
Barros, C.P., Peypoch, N., Solonandrasana, B., 2009. Efficiency and Productivity Growth in Hotel Industry. International Journal of Tourism Research 11, 389-402.
Briassoulis, H., 2003. Crete: Endowed by nature, privileged by geography, threatened by tourism? Journal of Sustainable Tourism 11 (2&3), 97-115.
Cai, L.A., Hobson, J.S.P., 2004. Making hotel brands work in a competitive environment. Journal of Vacation Marketing 10 (3), 197-208.
Charnes, A., Cooper, W.W., Rhodes, E., 1978. Measuring the efficiency of decision making units. European Journal of Operational Research 2 (6), 429-444.
Chiang, W.E., Tsai, M.H. and Wang, L.M., 2004. A DEA Evaluation of Taipei Hotels. Annals of Tourism Research 31 (3), 712-715.
Donatos, G., Zairis, P., 1991. Seasonality of foreign tourism in the Greek island of Crete. Annals of Tourism Research 18 (3), 515-519.
Farell, M.J., 1957. The measurement of productive efficiency. Journal of the Royal Statistical Society 120 (3): 253-290.
García Sánchez, I.M. (2009). Technical and Scale Efficiency in Spanish Urban Transport: Estimating with Data Envelopment Analysis. Advances in Operations Research, vol. 2009, Article ID 721279, 15 pages, 2009. doi:10.1155/2009/721279.
Greek Chamber of Hotels (2009). Greek Tourism Review 2009. Holverson, S., Revaz, F., 2006. Perceptions of European independent hoteliers: hard
and soft branding choices. International Journal of Contemporary Hospitality Management 18 (5), 398-413.
Hwang, S.N., Chang, T.Y., 2003. Using data envelopment analysis to measure hotel managerial efficiency change in Taiwan. Tourism Management 24 (4), 357-369.

15
HNTO 2008. Statistics. Athens: Hellenic National Tourism Organisation. Koutoulas, D., 2006. The Market Influence of Tour Operators on the Hospitality
Industry: The Case of Greek Resort Hotels: In: Papatheodorou A. (Ed.).
Corporate Rivalry and Market Power: Competition Issues in the Tourism Industry. I.B. Tauris, London. pp. 94-123.
Koutoulas, D., 2009. The 2009 Greek Hotel Branding Report.<www.sete.gr/files/media/GreekHotelBrandingReport2009.pdf>(accessed 30.03.2012).
Neves, J., Lourenco, S., 2009. Using data envelopment analysis to select strategies that improve the performance of hotel companies. International Journal of Contemporary Hospitality Management 21 (6), 698-712.
O’Neill, J.W., Xiao, Q., 2006. The Role of Brand Affiliation in Hotel Market Value. Cornell Hotel and Restaurant Administration Quarterly 47 (3), 210-223.
Perrigot, R., Cliquet, G. Piot-Lepetit, I., 2009. Plural form chain and efficiency: Insights from the French hotel chains and the DEA methodology. European Management Journal 27 (4), 268-280.
Pulina, M., Detotto, C. Paba, A., 2010. An investigation into the relationship between size and efficiency of the Italian hospitality sector: A window DEA approach. European Journal of Operational Research 204 (3), 613-620.
SETE 2011. Greek Tourism: Facts and Figures.<http://www.sete.gr/files/Media/SETE%202011%20final.pdf>(accessed 30.03.2012).
Sigala, M., Jones, P., Lockwood, A., Airey, D., 2005. Productivity in hotels: a stepwise data envelopment analysis of hotels' rooms division processes. The Service Industries Journal 25 (1), 61-81.
Tsitouras, A.K., 1998. The Seasonality of Tourism in Greece and the Competitive Countries. Athens: Research Institute for Tourism, [in Greek].
Thanassoulis, E., Boussofiane, A. Dyson, R.G., 1996. A comparison of data envelopment analysis and ratios as tools for performance assessment. Omega: The International Journal of Management Science 24 (3), 229-244.
UNWTO, 2012. UNWTO World Tourism Barometer. Vol. 10, January. < http://mkt.unwto.org/en/barometer> (accessed 30.03.2012).
16
Table 1: Data for each hotel in the sample
Hotel Operational
Style
Beds Employees Operational
Cost (€) Revenues (€) Overnights Class Region
H1 Independent 650 46 2.144.722,00 3.124.121,00 72.068 L LassithiH2 Independent 320 85 2.433.366,00 2.409.110,00 53.394 L LassithiH3 Independent 800 160 2.954.185,00 4.073.276,00 120.903 L LassithiH4 Independent 396 61 1.563.731,00 2.287.348,00 51.168 L HeraklionH5 Independent 600 130 3.314.363,00 5.376.739,00 90.000 L ChaniaH6 Independent 1200 255 5.795.450,00 9.554.523,00 125.000 L ChaniaH7 Independent 300 38 170.677,00 241.736,00 7.500 A LasithiH8 Independent 322 76 1.934.693,00 2.059.785,00 49.382 A LasithiH9 Independent 718 110 2.936.284,00 3.055.297,00 66.000 A HeraklionH10 Independent 680 131 4.577.079,00 6.225.808,00 125.041 A HeraklionH11 Independent 620 135 4.231.877,00 4.368.975,00 116.999 A HeraklionH12 Independent 430 22 1.329.750,00 1.827.973,00 30.000 A HeraklionH13 Independent 471 100 2.549.650,12 3.099.485,00 79.978 A HeraklionH14 Independent 380 89 2.278.036,00 2.570.410,00 89.660 A HeraklionH15 Independent 382 110 2.736.355,00 3.604.671,00 49.635 A HeraklionH16 Independent 850 154 4.573.527,00 5.023.987,00 155.000 A HeraklionH17 Independent 310 14 523.402,00 536.993,00 10.000 A HeraklionH18 Independent 600 85 2.199.243,00 3.194.792,00 55.000 A RethymnoH19 Independent 300 42 1.125.728,00 1.248.148,00 35.413 A RethymnoH20 Independent 322 58 1.582.584,00 2.177.608,00 57.333 A RethymnoH21 Independent 550 105 2.396.336,00 4.430.760,00 90.000 A ChaniaH22 Independent 340 21 1.036.156,00 1.865.727,00 67.456 A ChaniaH23 Independent 350 35 677.753,00 881.467,00 37.357 A ChaniaH24 Independent 310 85 1.085.348,00 3.014.589,00 56.185 A ChaniaH25 Independent 385 88 1.738.011,00 1.894.434,00 67.440 A ChaniaH26 International 700 209 7.802.988,00 9.095.315,00 85.775 A HeraklionH27 International 713 137 4.178.980,00 4.467.389,00 113.557 A HeraklionH28 International 425 84 2.462.616,00 3.207.276,00 61.807 A HeraklionH29 International 573 150 4.043.889,00 5.170.665,00 98.631 L LasithiH30 International 668 80 4.182.903,00 5.748.733,00 85.000 A LasithiH31 International 400 94 2.377.037,00 2.398.283,00 51.980 L ChaniaH32 International 295 52 1.529.956,00 1.775.453,00 60.382 A LasithiH33 Νational 503 292 9.788.811,00 15.541.804,00 63.254 L LasithiH34 Νational 767 236 6.650.839,00 8.650.875,00 98.373 L LasithiH35 Νational 416 158 6.864.155,00 12.681.132,00 82.397 L HeraklionH36 Νational 162 118 3.085.284,00 3.878.000,00 38.964 L ChaniaH37 Νational 519 100 3.143.569,00 3.388.450,00 80.205 A HeraklionH38 Νational 772 191 6.177.029,00 8.874.959,00 159.350 A RethymnoH39 Νational 650 150 4.189.151,00 5.578.592,00 96.276 A RethymnoH40 Local brand 324 120 3.620.586,00 4.157.199,00 62.500 L LasithiH41 Local brand 296 80 2.760.275,00 3.171.924,00 45.000 L LasithiH42 Local brand 500 110 2.947.925,00 3.306.550,00 82.381 A HeraklionH43 Local brand 300 45 1.153.944,00 1.700.464,00 55.000 A HeraklionH44 Local brand 300 41 1.095.884,00 1.174.481,00 50.000 A HeraklionH45 Local brand 395 105 3.197.424,00 4.395.956,00 69.500 A HeraklionH46 Local brand 472 66 2.158.040,00 2.795.852,00 101.000 A RethymnoH47 Local brand 400 105 3.529.475,00 3.921.208,00 73.000 A RethymnoH48 Local brand 354 45 1.225.865,00 1.649.376,00 55.575 A RethymnoH49 Local brand 250 65 1.684.216,00 1.756.169,00 57.000 A RethymnoH50 Local brand 1064 350 8.784.527,00 13.476.457,00 210.000 A Rethymno
17
Table 2: Distribution of hotels according to their input and output variables
Beds Hotels Employees Hotels Operational Cost (€) Hotels Total Revenues (€) Hotels Overnights Hotels
0-200 1 0-50 10 0-2.000.000 16 0-3.000.000 19 0-30.000 3
200-400 21 50-100 17 2.000.000-4.000.000 20 3.000.000-6.000.000 23 30.000-60.000 16
400-600 14 100-150 14 4.000.000-6.000.000 8 6.000.000-9.000.000 3 60.000-90.000 19
600-800 11 150-200 4 6.000.000-8.000.000 4 9.000.000-12.000.000 2 90.000-120.000 6
> 800 3 > 200 5 > 8.000.000 2 > 12.000.000 3 > 120.000 6
18
Table 3: Efficiency Scores
Hotel Operational Style Technical Efficiency
(CCR index)
Pure Technical Efficiency
(BCC index) Scale Efficiency Rank
H1 Independent 0,80004 0,94037 0,85078 26 H2 Independent 0,72485 0,73863 0,98134 36 H3 Independent 0,75215 1,00000 0,75215 32 H4 Independent 0,69123 0,73118 0,94535 42 H5 Independent 0,78119 0,90990 0,85854 29 H6 Independent 0,74926 0,96998 0,77245 33 H7 Independent 0,70557 1,00000 0,70557 39 H8 Independent 0,70348 0,71348 0,98598 41 H9 Independent 0,49782 0,63857 0,77959 50 H10 Independent 0,86084 0,98091 0,87759 14 H11 Independent 0,83222 0,89838 0,92636 20 H12 Independent 0,93523 0,93999 0,99494 10 H13 Independent 0,79014 0,81289 0,97202 28 H14 Independent 1,00000 1,00000 1,00000 1 H15 Independent 0,66357 0,67194 0,98755 44 H16 Independent 0,82186 1,00000 0,82186 22 H17 Independent 0,53716 1,00000 0,53716 49 H18 Independent 0,68840 0,73828 0,93244 43 H19 Independent 0,59189 0,73234 0,80821 48 H20 Independent 0,84950 0,85925 0,98865 17 H21 Independent 0,85561 1,00000 0,85561 16 H22 Independent 1,00000 1,00000 1,00000 1 H23 Independent 0,84665 0,87636 0,96611 18 H24 Independent 1,00000 1,00000 1,00000 1 H25 Independent 0,80691 0,81119 0,99472 24 H26 International 0,62105 0,71808 0,86487 46 H27 International 0,73051 0,82674 0,88360 34 H28 International 0,71870 0,73747 0,97455 37 H29 International 0,79737 0,83482 0,95513 27 H30 International 0,85669 1,00000 0,85669 15 H31 International 0,61362 0,62068 0,98863 47 H32 International 0,91919 0,94317 0,97458 12 H33 Νational 1,00000 1,00000 1,00000 1 H34 Νational 0,65963 0,76187 0,86581 45 H35 Νational 1,00000 1,00000 1,00000 1 H36 Νational 1,00000 1,00000 1,00000 1 H37 Νational 0,71450 0,73708 0,96936 38 H38 Νational 0,93664 1,00000 0,93664 9 H39 Νational 0,73029 0,81682 0,89407 35 H40 Local 0,84122 0,84892 0,99094 19 H41 Local 0,70360 0,72539 0,96997 40 H42 Local 0,75465 0,77954 0,96807 31 H43 Local 0,89167 1,00000 0,89167 13 H44 Local 0,80862 0,96280 0,83986 23 H45 Local 0,82576 0,83029 0,99455 21 H46 Local 0,99343 1,00000 0,99343 7 H47 Local 0,80681 0,80956 0,99660 25 H48 Local 0,77774 0,78031 0,99671 30 H49 Local 0,96534 1,00000 0,96534 8 H50 Local 0,92235 1,00000 0,92235 11
19
Table 4: Efficiency scores statistics
INDEPENDENT HOTELS BRANDED HOTELS
Efficiency
Technical Efficiency
(CCR index)
Pure Technical Efficiency
(BCC index)
Scale Efficiency
Technical Efficiency
(CCR index)
Pure Technical Efficiency
(BCC index)
Scale Efficiency
Average 77.9% 87.8% 89.1% 82.3% 86.9% 94.7%
Median 79.0% 90.9% 93.2 80.8% 83.4% 96.9%
St. Dev. 13.1% 12.3% 11.7% 12.1% 12.0% 5.3%

20
Table 5: CRS Model Slacks
Inputs Slacks Output Slacks Hotel Beds Employees Operational Cost (€) Total Revenues (€) Overnight
H1 192,52534 0,00000 0,00000 0,00000 664,46379H2 0,00000 2,81895 0,00000 0,00000 0,00000H3 0,00000 43,49255 0,00000 0,00012 0,00000H4 10,84769 0,00000 0,00000 0,00000 0,00000H5 0,00000 0,00000 0,00000 0,00000 0,00000H6 304,23667 0,00000 0,00000 0,00000 0,00000H7 245,53039 32,44405 0,00000 0,00000 0,00000H8 0,00000 0,00000 0,00000 0,00000 0,00000H9 29,24187 0,00000 0,00000 0,00000 0,00502H10 0,00000 0,00000 0,00000 0,00019 0,00000H11 0,00000 0,00000 288.913,91846 0,00069 0,00000H12 73,80952 0,00000 244.253,23808 0,00002 38.590,509H13 0,00000 0,00000 0,00000 0,00000 0,00000H14 0,00000 0,00000 0,00000 0,00000 0,00000H15 0,00000 0,00000 0,00000 0,00000 0,00000H16 0,00000 0,00000 1.520,41404 0,00078 0,00000H17 215,02367 0,00000 0,00000 0,00000 0,00000H18 181,19817 0,00000 0,00000 0,00000 0,00320H19 0,00000 0,00000 0,00000 0,00000 0,00000H20 0,00000 0,00000 0,00000 0,00000 0,00000H21 0,00000 0,00000 0,00000 0,00000 0,00000H22 0,00000 0,00000 0,00000 0,00001 0,00000H23 127,60490 21,26383 0,00000 179.257,68956 0,00000H24 0,00000 0,00000 0,00000 0,00000 0,00000H25 0,00000 31,17930 0,00000 9.534,87796 0,00000H26 0,00000 0,00000 0,00000 0,00000 0,00000H27 0,00000 0,00000 0,00000 0,00020 0,00000H28 0,00000 0,00000 0,00000 0,00000 0,00000H29 0,00000 0,00000 0,00000 0,00000 0,00000H30 0,00000 0,00000 508.453,71035 0,00010 33.271,843H31 0,00000 0,00000 0,00000 0,00000 0,00000H32 0,00000 0,00000 31.424,96312 0,00000 0,00000H33 0,00000 0,00000 0,00034 0,00000 0,00001H34 0,00000 0,00000 0,00000 0,00000 0,00000H35 0,00000 0,00000 0,00008 0,00000 0,00000H36 0,00000 0,00000 0,00002 0,00000 0,00000H37 0,00000 0,00000 0,00000 0,00000 0,00000H38 0,00000 0,00000 0,00000 0,00018 0,00000H39 0,00000 0,00000 0,00000 0,00009 0,00000H40 0,00000 0,00000 78.815,88905 0,00000 0,00000H41 0,00000 0,00000 0,00000 0,00000 0,00000H42 0,00000 0,00000 0,00000 0,00000 0,00000H43 0,00000 5,22366 0,00000 0,00000 0,00000H44 0,00000 11,84359 0,00000 272.459,05328 0,00000H45 0,00000 0,00000 0,00000 0,00000 0,00000H46 0,00000 0,00000 89.849,52534 48.552,84125 0,00000H47 0,00000 0,00000 204.941,47543 0,00000 0,00000H48 0,00000 9,26523 0,00000 0,00000 0,00000H49 0,00000 0,00000 15.249,83344 95.898,90513 0,00000H50 0,00000 50,25942 0,00000 0,00029 0,00000

21
Table 6. DEA input and output slacks compared with input and output level of hotels
Inputs DEA CCR input slacks Input level Slack/input ratio
Averages Averages %
Independent Hotels
Branded Hotels
Independent Hotels
Branded Hotels
Independent Hotels
Branded Hotels
Beds 55.20 0 503.44 488.72 10.96 0
Employees 5.24 3.06 89.40 127.32 5.87 2.40
Operational Cost (€) 21.387,50 37.149,41 2.315.532,24 3.945.414,72 0.92 0.94
Outputs DEA CCR output slacks Output level Slack/output ratio
Averages Averages %
Independent Hotels
Branded Hotels
Independent Hotels
Branded Hotels
Independent Hotels
Branded Hotels
Total Revenues (€) 7.551,70 16.676,43 3.125.910,48 5.278.502,48 0,24 0,31
Overnights 1.570,19 1.330,87 7.0316,48 8.1476,28 2,23 1,63
Top Related