


Languages
Pages
Legal


Alessandro FlamminiFood and Agriculture Organization of the United Nations
Brussels, 30 November 2011

FAO on algae‐based biofuelsAquatic Biofuels Working Group (ABWG)Informally established in Fall 2008
Scope:
Understand the current state of aquatic biofuels research and technologies and their relevance to being applied and managed indeveloping countries.Facilitating linkages between regional organizations, private sector and governments as well as promoting a north‐south and south‐south collaboration.Disseminate knowledge about bioenergy production from algae and fish waste and its suitability in poor areas to improve energy access. through networks, where appropriate.

FAO on algae‐based biofuels
Two working papers produced:
Algae‐based biofuels ‐ A Review of Challenges and Opportunities for Developing Countries
Algae‐based biofuels – Applications andCo‐products
Available at www.fao.org/bioenergy/aquaticbiofuels

ContextAgricultural production expected to increase by 70% by 2050 to meet future food demand (mainly through yield increase)
Fossil fuel prices expected to be higher and more volatile in the future
Agri‐food chain heavily dependent on energy, mainly indirect energy subsidies
FF prices pass‐throughfood prices and poor farmershighly exposed to price shocks
Trend comparison of oil price and cereals price index (Kim, 2010)

Becoming ‘energy‐smart’
In farming, (direct and indirect) energy is mainly needed for fertilizer production and as fuel for machineryAlso heat for drying and electricity are important, especially in rural areas

People without access to electricity compared with progress towards Universal
Energy Access by 2030 ‐
Source: Poor People’s Energy Outlook 2012
Developingcountries
Latin America
China and East
Asia
South AsiaSub‐Saharan
Africa

People without access to “modern fuels”
for cooking compared with Universal Energy
Access by 2030 ‐
Source: Poor People’s Energy Outlook 2012
Developingcountries
Latin America
China and East
Asia
SouthAsiaSub‐Saharan
Africa

Biofuel from algae?

Biofuel from algae?
Source: Aquafuels 2011

Biofuel from algae?
Source: IEA 2009
Burning of residues after extraction and heat recovered
No drying before oil extraction
Residues for biogas for CHP
N reuseAdditional heat from
transesterification residues

Biofuel from algae?
•
Raw oil• Raw oil
•
Biodiesel through
transesterification
•
Biodiesel through
transesterification
•
Ethanol 1G• Ethanol 1G
•
Ethanol 2G• Ethanol 2G
•
Biogas through
fermentation
•
Biogas through
fermentation
•
Pyrolysis oil• Pyrolysis oil
•
Syngas (CH4, H2) through
hydrothermal gasification
•
Syngas (CH4, H2) through
hydrothermal gasification
•
Bio‐Oil through
hydrothermal liquefaction
•
Bio‐Oil through
hydrothermal liquefaction
•
Biochar through
hydrothermal carbonization
•
Biochar through
hydrothermal carbonization
•
Gasification? OTHER?• Gasification? OTHER?

Just biofuel from algae?
Staple food
Pigments PUFAs
Polysaccharides
Livestock feed Fish and shellfish feed

Cheap nutrients from algaeFood item Protein content
per 100 g(g)
Cost per 100 g of protein(Rs)
Comparative ratio of cost of protein with Spirulina
Comparative ratio of cost of lysine with Spirulina
Comparative ratio cost of cystine with Spirulina
Comparative ratio cost of tryptophan with Spirulina
Spirulina 66 1.38 1 1 1 1
Egg 13.2 11.20 8.23 5.10 5.11 3.82
Milk (100 ml) 3.3 15.15 10.97 6.19 11.98 6.62
Cluster beans 3.2 31.25 22.64 14.67 26.13 15.09
Eggplant 1.4 57.14 41.41 44.45 78.52 19.48
Carrot 0.9 88.88 64.41 10.10 28.90 14.13
Potato 1.6 62.50 45.28 26.56 95.97 7.55
Onion 1.20 66.66 48.30 46.30 96.66 13.88
Mutton 18.50 16.21 11.75 6.31 26.45 1.68
Notes: Only the cost of protein from consumed foods other than staple food is compared here. The costs per unit of vitamin A, nicotinic acid, riboflawin, thiamin, vitamin B12 and iron are cheaper in Spirulina than from other sources. The protein content of Spirulina is based on a dry weight whereas the protein content of other food sources is reported on a wet weight basis.
Spirulina protein content compared with other staple foods in (vegetarian) South India, 1991 (Babu and Rajasekaran 1991)
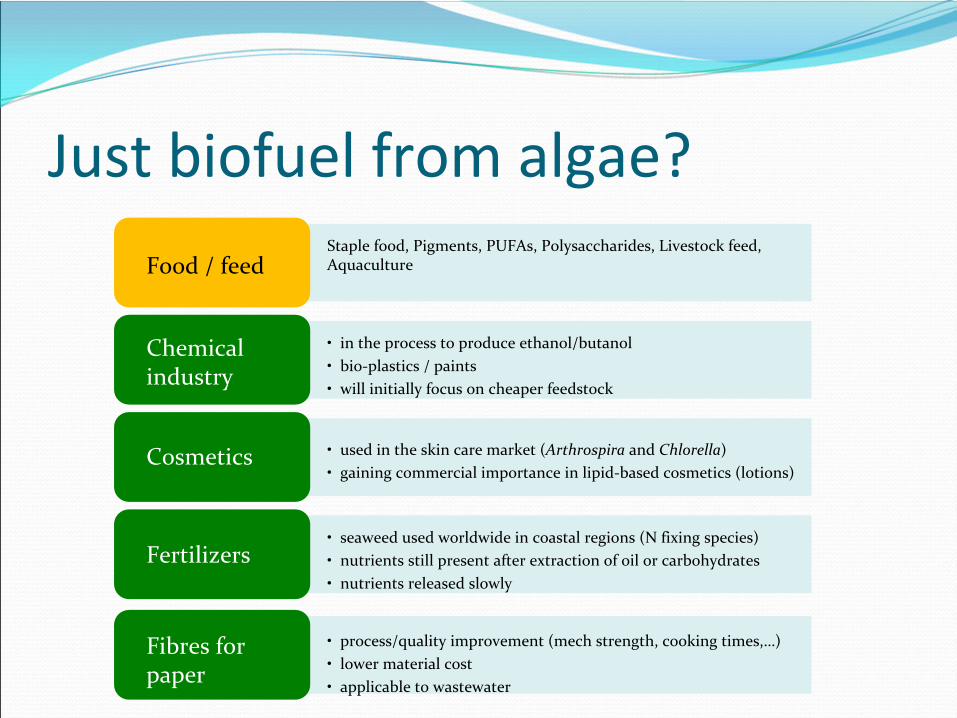
Just biofuel from algae?
Chemical industry• in the process to produce ethanol/butanol• bio‐plastics / paints• will initially focus on cheaper feedstock
Cosmetics • used in the skin care market (Arthrospira
and Chlorella)• gaining commercial importance in lipid‐based cosmetics (lotions)
Fertilizers• seaweed used worldwide in coastal regions (N fixing species)• nutrients still present after extraction of oil or carbohydrates• nutrients released slowly
Fibres for paper• process/quality improvement (mech strength, cooking times,…)• lower material cost• applicable to wastewater
Food / feedStaple food, Pigments, PUFAs, Polysaccharides, Livestock feed,
Aquaculture

Systems integration is keyMultiple resource use through the diversification of land use and production (e.g. systems that co‐produce fish, bioenergy, fertilizers. Mild conditions. Slower and more expensive)
Multiple resourceuse through the fullutilization
of
by‐products/residues
Integrated algal production concept with various co‐products (Khan, Rashmi et al. 2009)

Integrated systems / compatible marketsApplications Price / Kg biomass Market volume
Nutraceuticals (human consumption)
€ 100 €
60 million
Nutraceuticals (animal and fish feed)
€ 5-20 €
3-4 billion
Bulk chemicals € 1-5 > €
50 billion
Biofuels < €
0.40 > €
1 trillion
(Source: Wijffels 2008)
Wijffels, Barbosa et al. (2010) have chosen a random combination of microalgal products
with bulk‐scale market. Assuming 40% lipids, 50% proteins and 10% carbohydrates, a
quarter of the lipids is sold to the food and chemical industry for €2/kg, the rest for
biodiesel at €0.50/kg, soluble proteins (20%) for food at €5/kg, the rest (80%) for feed at
€0.75/kg.
Biorefinery yields €1.65 /kg algal biomass, relying solely on products with a low
market value and large market size. Markets should be compatible!
Potential markets

Developing countries experience•
Most commercial microalgae operations are located in China, Taiwan
and India.
•
In 1997 there were around 110
commercial producers of microalgae in the Asia Pacific region, with capacities ranging from 3 to 500 tons
/year.
•
Experiences in China, Taiwan, Thailand, Philippines, Indonesia, Myanmar, Vietnam, South Korea, Mexico, Chile, Cuba, Chad, South
Africa (mainly for food, fertilizers, aquaculture, wastewater treatment)No willingness to pay for ‘greener’
products!
Opportunities to adapt current production systems to bioenergy co‐production

Productivity
Source: Tredici 2010
World map of algae biomass productivity
(tons/ha/year) at 5% photosynthetic efficiency considering an energy content of 20 MJ/kg dry
biomass
≠
grow rate
40‐80 tons DW/ha/year

Two scenarios for
scale of operations
Open ponds(Limited no. of species)
FilamentousspeciesFish feed
Sun or no dryingMech. press
Algal biofuels plant
> 1000 ha (Um and Kim 2009)
Small‐scale, community
operated systemsSmall‐scale, community
operated systems
?
The future of ABB
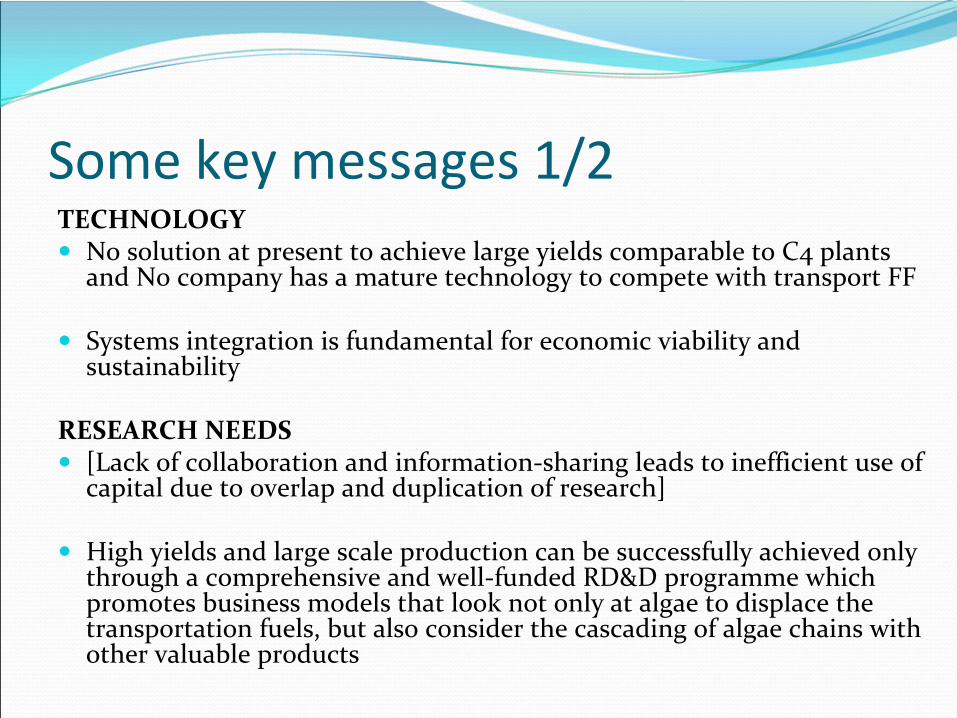
Some key messages 1/2TECHNOLOGY
No solution at present to achieve large yields comparable to C4 plants and No company has a mature technology to compete with transport FF
Systems integration is fundamental for economic viability and sustainability
RESEARCH NEEDS[Lack of collaboration and information‐sharing leads to inefficient use of capital due to overlap and duplication of research]
High yields and large scale production can be successfully achieved only through a comprehensive and well‐funded RD&D programme which promotes business models that look not only at algae to displace the transportation fuels, but also consider the cascading of algae chains with other valuable products

Some key messages 2/2ENTRY POINTS FOR DEVELOPING COUNTRIES
Where experience in algae cultivation exists, bioenergy co‐production can increase incomes (avoided cost)Small scale integrated systems to satisfy local needs, esp in rural areas
Top Related