


Languages
Pages
Legal

APS AVIATION INC.
TP 13318E
Prepared for
Transportation Development Centreon behalf of
Civil Aviation
Safety and SecurityTransport Canada
and
The Federal Aviation AdministrationWilliam J. Hughes Technical Centre
by
December 1998
Aircraft Ground De/Anti-icing Fluid Holdover Time Field Testing Program
for the 1997-98 Winter
Final Version 1.0
APS AVIATION INC.
TP 13318E
cm13
80/re
port/
hot_
subs
/ver
_3/M
AST
ER2.
DR
W
by
John D'Avirro,Michael Chaput,
Medhat Hanna, andAntoni Peters
December 1998
Aircraft Ground De/Anti-icing Fluid Holdover Time Field Testing Program
for the 1997-98 Winter
Final Version 1.0
PREFACE
X:\@APS ARCHIVE\CM1380 (TDC Deicing 1997-98)\REPORT\HOT_SUB\Final Version 1.0\Final Version 1.0.DOC Final Version 1.0, October 06 iii
PREFACE At the request of the Transportation Development Centre of Transport Canada, APS Aviation Inc. has undertaken a research program to further advance aircraft ground deicing/anti-icing technology. Specific objectives of the APS test program were: • To develop holdover time tables for new Type IV fluids and to validate
fluid-specific tables and SAE tables; • To determine the influence of fluid type, precipitation, and wind on location
and time to fluid failure initiation, and also failure progression on the Canadair Regional Jet and on high-wing turboprop commuter aircraft;
• To establish experimental data to support the development of a deicing only
table to serve as an industry guideline, and to evaluate freeze point temperature limits for fluids used as the first step of a two-step deicing operation;
• To establish conditions for which contamination due to anti-icing fluid failure
in freezing precipitation fails to flow from the wing of a jet transport aircraft when subjected to rotation speeds;
• To document the appearance of fluid failure and the characteristics of the
fluid at time of failure, through conduct of a series of tests on standard flat plates; and
• To determine the feasibility of examining the condition of aircraft wings prior
to takeoff through use of ice contamination sensor systems. The research activities of the program conducted on behalf of Transport Canada during the 1997-98 winter season are documented in separate reports. The titles of these reports are as follows: • TP 13314E Research on Aircraft Deicing Operations for the 1997-98 Winter; • TP 13315E Aircraft Deicing Fluid Freeze Point Buffer Requirements: Deicing
Only and First Step of Two-Step Deicing; • TP 13316E Contaminated Aircraft Takeoff Test for the 1997-98 Winter; • TP 13317E Characteristics of Aircraft Anti-Icing Fluids Subjected to
Precipitation; • TP 13318E Aircraft Ground De/Anti-icing Fluid Holdover Time Field Testing
Program for the 1997-98 Winter; and
PREFACE
X:\@APS ARCHIVE\CM1380 (TDC Deicing 1997-98)\REPORT\HOT_SUB\Final Version 1.0\Final Version 1.0.DOC Final Version 1.0, October 06 iv
• TP 13489E Deicing with a Mobile Infrared System. This report, TP 13318E addresses the following objective: • To conduct flat plate tests under conditions of natural snow and freezing
precipitation to record the holdover times, and to develop individual holdover time tables based on samples of new and previously qualified Type IV fluids under as wide a range of conditions as possible.
This objective was met by conducting tests on different Type IV fluids in simulated freezing precipitation at National Research Council Canada’s Climatic Engineering Facility in Ottawa, as well as tests in natural snow conditions at the APS test facility at Dorval Airport in Montreal. ACKNOWLEDGEMENTS Research has been funded by the Civil Aviation Group, Transport Canada, with support from the Federal Aviation Administration and US Airways Inc. This research program could not have been accomplished without the participation of many organizations. APS would therefore like to thank Transport Canada’s Transportation Development Centre, the U.S. Federal Aviation Administration, US Airways Inc., National Research Council Canada, Atmospheric Environment Services, and the fluid manufacturers for their contributions to, and assistance with, the program. Special thanks are extended to US Airways Inc., Air Canada, National Research Council Canada, Canadian Airlines International, Inter-Canadien, AéroMag 2000, Aéroport de Montreal, RVSI, Cox and Company Inc., KnightHawk, and Shell Aviation for provision of personnel and facilities, and for their co-operation on the test program. Union Carbide, Octagon, SPCA, Kilfrost, Clariant, and Inland Technologies Inc. are thanked for provision of fluids for testing. APS would also like to acknowledge the dedication of the research team, whose performance was crucial to the acquisition of hard data leading to the preparation of this document.
Transport Canada
Transports Canada PUBLICATION DATA FORM
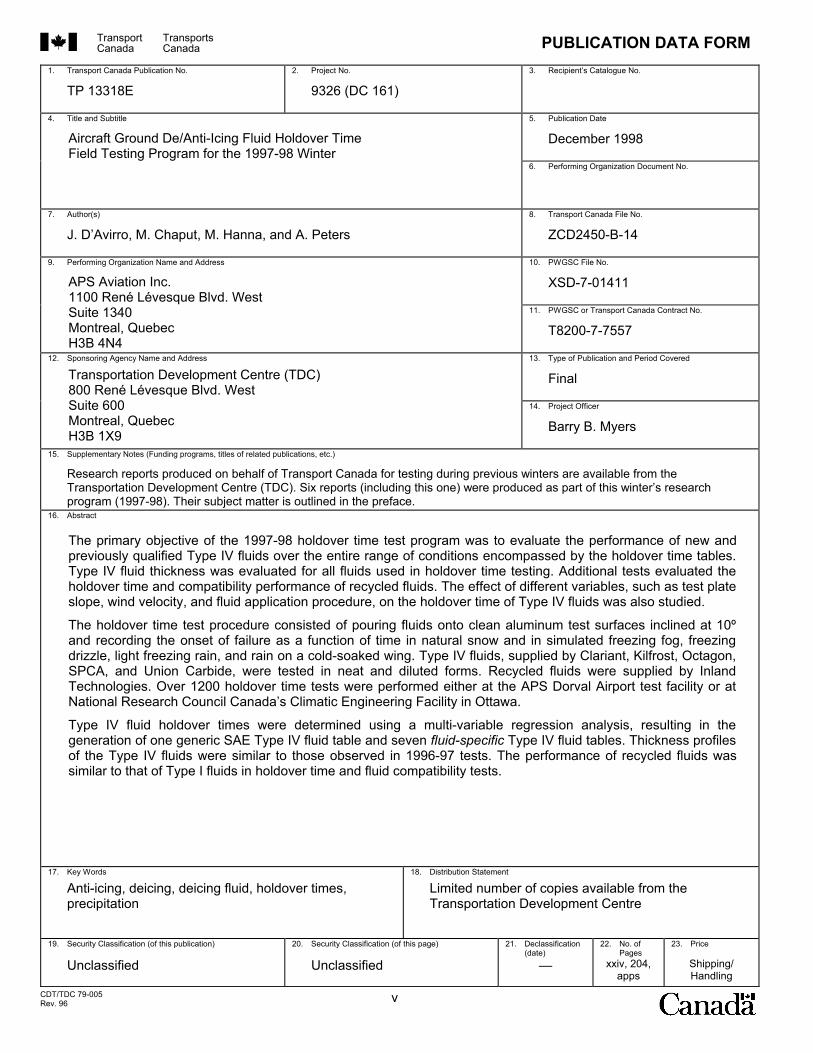
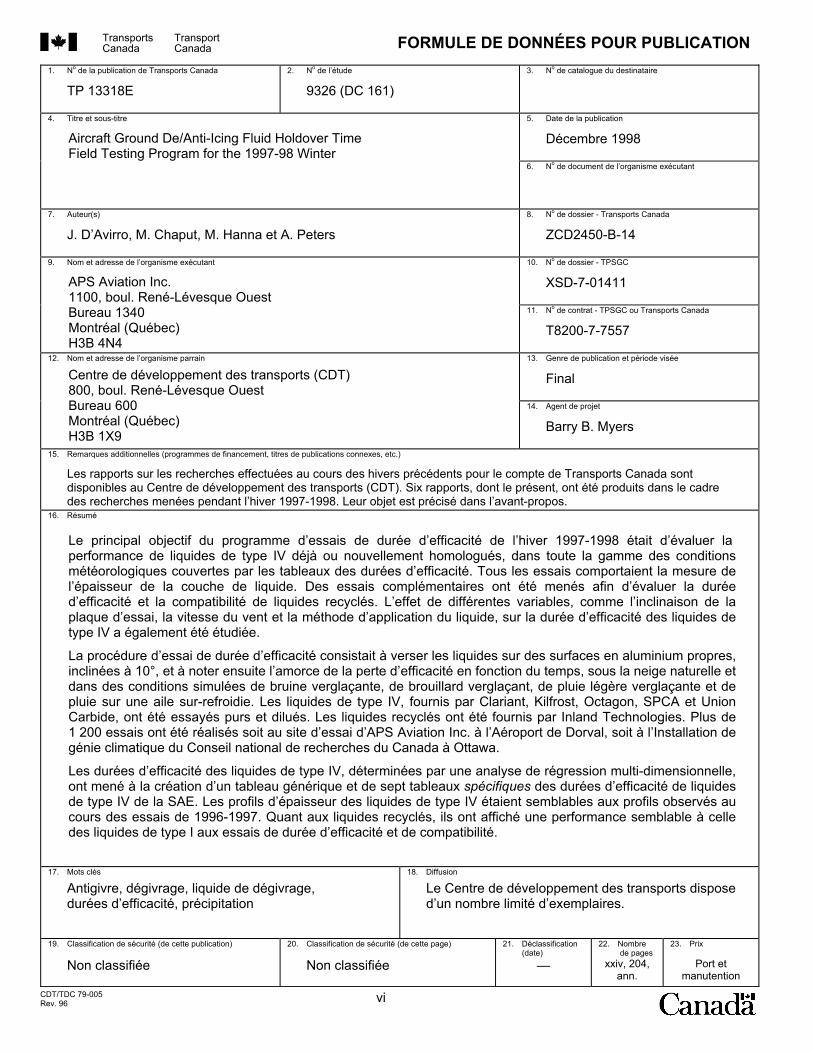
1. Transport Canada Publication No.
TP 13318E 2. Project No.
9326 (DC 161) 3. Recipient’s Catalogue No.
4. Title and Subtitle
5. Publication Date
December 1998
6. Performing Organization Document No.
7. Author(s)
J. D’Avirro, M. Chaput, M. Hanna, and A. Peters 8. Transport Canada File No.
ZCD2450-B-14
9. Performing Organization Name and Address 10. PWGSC File No.
XSD-7-01411
11. PWGSC or Transport Canada Contract No.
T8200-7-7557
12. Sponsoring Agency Name and Address 13. Type of Publication and Period Covered
Final
14. Project Officer
Barry B. Myers
15. Supplementary Notes (Funding programs, titles of related publications, etc.)
Research reports produced on behalf of Transport Canada for testing during previous winters are available from the Transportation Development Centre (TDC). Six reports (including this one) were produced as part of this winter’s research program (1997-98). Their subject matter is outlined in the preface.
16. Abstract
17. Key Words
Anti-icing, deicing, deicing fluid, holdover times, precipitation
18. Distribution Statement
Limited number of copies available from the Transportation Development Centre
19. Security Classification (of this publication)
Unclassified
20. Security Classification (of this page)
Unclassified
21. Declassification (date)
—
22. No. of Pages
xxiv, 204, apps
23. Price
Shipping/ Handling
CDT/TDC 79-005 Rev. 96 v
Aircraft Ground De/Anti-Icing Fluid Holdover Time Field Testing Program for the 1997-98 Winter
APS Aviation Inc. 1100 René Lévesque Blvd. West Suite 1340 Montreal, Quebec H3B 4N4
Transportation Development Centre (TDC) 800 René Lévesque Blvd. West Suite 600 Montreal, Quebec H3B 1X9
The primary objective of the 1997-98 holdover time test program was to evaluate the performance of new andpreviously qualified Type IV fluids over the entire range of conditions encompassed by the holdover time tables.Type IV fluid thickness was evaluated for all fluids used in holdover time testing. Additional tests evaluated theholdover time and compatibility performance of recycled fluids. The effect of different variables, such as test plate slope, wind velocity, and fluid application procedure, on the holdover time of Type IV fluids was also studied.
The holdover time test procedure consisted of pouring fluids onto clean aluminum test surfaces inclined at 10ºand recording the onset of failure as a function of time in natural snow and in simulated freezing fog, freezingdrizzle, light freezing rain, and rain on a cold-soaked wing. Type IV fluids, supplied by Clariant, Kilfrost, Octagon,SPCA, and Union Carbide, were tested in neat and diluted forms. Recycled fluids were supplied by InlandTechnologies. Over 1200 holdover time tests were performed either at the APS Dorval Airport test facility or atNational Research Council Canada’s Climatic Engineering Facility in Ottawa.
Type IV fluid holdover times were determined using a multi-variable regression analysis, resulting in the generation of one generic SAE Type IV fluid table and seven fluid-specific Type IV fluid tables. Thickness profiles of the Type IV fluids were similar to those observed in 1996-97 tests. The performance of recycled fluids wassimilar to that of Type I fluids in holdover time and fluid compatibility tests.
Transports Canada
Transport Canada FORMULE DE DONNÉES POUR PUBLICATION
1. No de la publication de Transports Canada
TP 13318E 2. No de l’étude
9326 (DC 161) 3. No de catalogue du destinataire
4. Titre et sous-titre
5. Date de la publication
Décembre 1998
6. No de document de l’organisme exécutant
7. Auteur(s)
J. D’Avirro, M. Chaput, M. Hanna et A. Peters 8. No de dossier - Transports Canada
ZCD2450-B-14
9. Nom et adresse de l’organisme exécutant 10. No de dossier - TPSGC
XSD-7-01411
11. No de contrat - TPSGC ou Transports Canada
T8200-7-7557
12. Nom et adresse de l’organisme parrain 13. Genre de publication et période visée
Final
14. Agent de projet
Barry B. Myers
15. Remarques additionnelles (programmes de financement, titres de publications connexes, etc.)
Les rapports sur les recherches effectuées au cours des hivers précédents pour le compte de Transports Canada sont disponibles au Centre de développement des transports (CDT). Six rapports, dont le présent, ont été produits dans le cadre des recherches menées pendant l’hiver 1997-1998. Leur objet est précisé dans l’avant-propos.
16. Résumé
17. Mots clés
Antigivre, dégivrage, liquide de dégivrage, durées d’efficacité, précipitation
18. Diffusion
Le Centre de développement des transports dispose d’un nombre limité d’exemplaires.
19. Classification de sécurité (de cette publication)
Non classifiée
20. Classification de sécurité (de cette page)
Non classifiée
21. Déclassification (date)
—
22. Nombre de pages
xxiv, 204, ann.
23. Prix
Port et manutention
CDT/TDC 79-005 Rev. 96 vi
Aircraft Ground De/Anti-Icing Fluid Holdover Time Field Testing Program for the 1997-98 Winter
APS Aviation Inc. 1100, boul. René-Lévesque Ouest Bureau 1340 Montréal (Québec) H3B 4N4
Centre de développement des transports (CDT) 800, boul. René-Lévesque Ouest Bureau 600 Montréal (Québec) H3B 1X9
Le principal objectif du programme d’essais de durée d’efficacité de l’hiver 1997-1998 était d’évaluer laperformance de liquides de type IV déjà ou nouvellement homologués, dans toute la gamme des conditionsmétéorologiques couvertes par les tableaux des durées d’efficacité. Tous les essais comportaient la mesure de l’épaisseur de la couche de liquide. Des essais complémentaires ont été menés afin d’évaluer la duréed’efficacité et la compatibilité de liquides recyclés. L’effet de différentes variables, comme l’inclinaison de laplaque d’essai, la vitesse du vent et la méthode d’application du liquide, sur la durée d’efficacité des liquides detype IV a également été étudiée.
La procédure d’essai de durée d’efficacité consistait à verser les liquides sur des surfaces en aluminium propres,inclinées à 10°, et à noter ensuite l’amorce de la perte d’efficacité en fonction du temps, sous la neige naturelle etdans des conditions simulées de bruine verglaçante, de brouillard verglaçant, de pluie légère verglaçante et depluie sur une aile sur-refroidie. Les liquides de type IV, fournis par Clariant, Kilfrost, Octagon, SPCA et UnionCarbide, ont été essayés purs et dilués. Les liquides recyclés ont été fournis par Inland Technologies. Plus de1 200 essais ont été réalisés soit au site d’essai d’APS Aviation Inc. à l’Aéroport de Dorval, soit à l’Installation de génie climatique du Conseil national de recherches du Canada à Ottawa.
Les durées d’efficacité des liquides de type IV, déterminées par une analyse de régression multi-dimensionnelle, ont mené à la création d’un tableau générique et de sept tableaux spécifiques des durées d’efficacité de liquides de type IV de la SAE. Les profils d’épaisseur des liquides de type IV étaient semblables aux profils observés aucours des essais de 1996-1997. Quant aux liquides recyclés, ils ont affiché une performance semblable à celledes liquides de type I aux essais de durée d’efficacité et de compatibilité.
EXECUTIVE SUMMARY
X:\@APS ARCHIVE\CM1380 (TDC Deicing 1997-98)\REPORT\HOT_SUB\Final Version 1.0\Final Version 1.0.DOC Final Version 1.0, October 06 vii
EXECUTIVE SUMMARY At the request of the Transportation Development Centre of Transport Canada, APS Aviation Inc. undertook a research program to further advance aircraft pre-flight deicing/anti-icing technology. Other related reports cover a number of the objectives of the test program. The primary objectives specifically addressed in this document were:
• To conduct flat plate tests under conditions of natural and simulated precipitation to record the holdover times, and to develop individual holdover time tables based on samples of new and previously qualified Type IV fluids supplied by the fluid manufacturers; and
• To conduct flat plate tests to validate fluid-specific and SAE tables that currently lack data.
The principal supplemental objectives addressed were:
• To evaluate the holdover time and compatibility performance of recycled fluids;
• To determine the effect of fluid temperature on the holdover time of Type IV fluids;
• To determine the influence of plate slope on the holdover time of Type IV fluids;
• To determine the influence of fluid application procedure on holdover time; and
• To determine the effect of wind on holdover time. The project involved the participation of several de/anti-icing fluid manufacturers, the Transportation Development Centre of Transport Canada, National Research Council Canada (NRC), the U.S. Federal Aviation Administration, and Atmospheric Environment Services (AES) of Environment Canada. Holdover time tests consist of pouring freezing point depressant fluids onto clean, flat, inclined, aircraft aluminum plates, which are exposed to an array of natural and artificially produced icing conditions. The elapsed time required to reach a pre-defined end condition is recorded. The end condition and the plate inclination are set according to SAE/ISO (Society of Automotive Engineers/International Organization for Standardization) G-12 Holdover Time Subcommittee guidelines. The variables measured include failure time, type of precipitation, rate of precipitation, total precipitation, visibility, wind speed, wind direction, ambient temperature, test surface temperature, fluid brand, fluid type, and fluid concentration.
EXECUTIVE SUMMARY
X:\@APS ARCHIVE\CM1380 (TDC Deicing 1997-98)\REPORT\HOT_SUB\Final Version 1.0\Final Version 1.0.DOC Final Version 1.0, October 06 viii
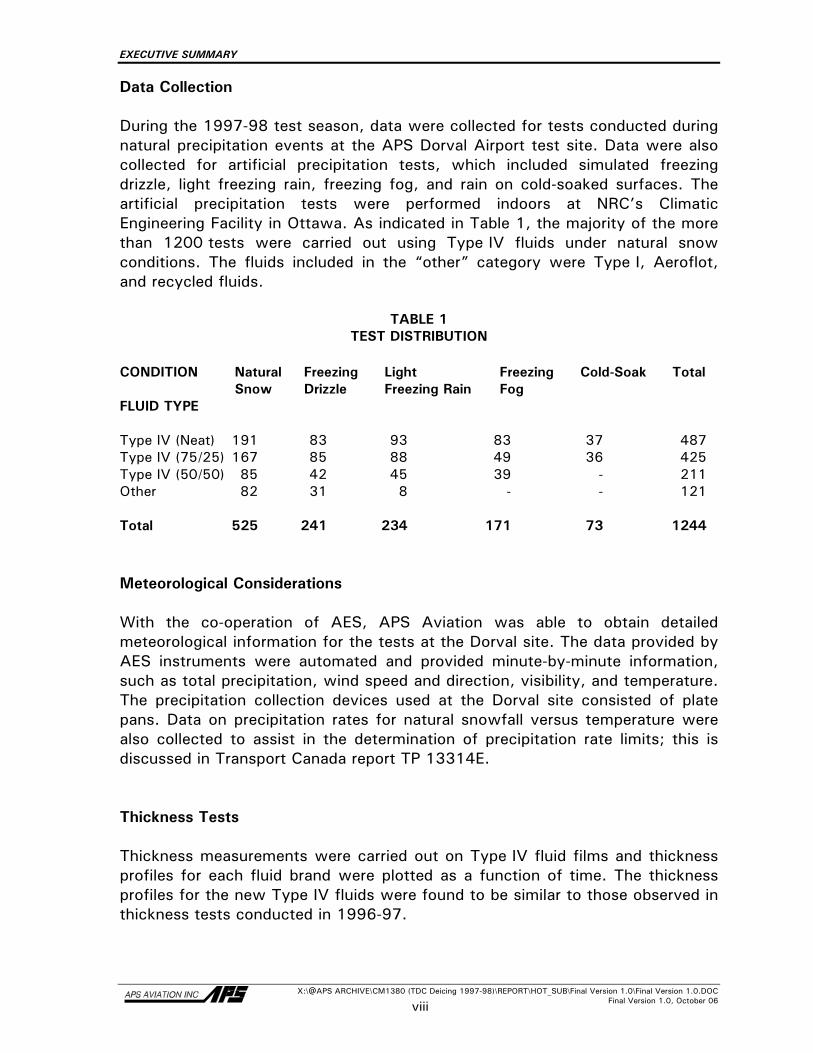
Data Collection During the 1997-98 test season, data were collected for tests conducted during natural precipitation events at the APS Dorval Airport test site. Data were also collected for artificial precipitation tests, which included simulated freezing drizzle, light freezing rain, freezing fog, and rain on cold-soaked surfaces. The artificial precipitation tests were performed indoors at NRC’s Climatic Engineering Facility in Ottawa. As indicated in Table 1, the majority of the more than 1200 tests were carried out using Type IV fluids under natural snow conditions. The fluids included in the “other” category were Type I, Aeroflot, and recycled fluids.
TABLE 1 TEST DISTRIBUTION
CONDITION Natural Freezing Light Freezing Cold-Soak Total Snow Drizzle Freezing Rain Fog FLUID TYPE Type IV (Neat) 191 83 93 83 37 487 Type IV (75/25) 167 85 88 49 36 425 Type IV (50/50) 85 42 45 39 - 211 Other 82 31 8 - - 121 Total 525 241 234 171 73 1244 Meteorological Considerations With the co-operation of AES, APS Aviation was able to obtain detailed meteorological information for the tests at the Dorval site. The data provided by AES instruments were automated and provided minute-by-minute information, such as total precipitation, wind speed and direction, visibility, and temperature. The precipitation collection devices used at the Dorval site consisted of plate pans. Data on precipitation rates for natural snowfall versus temperature were also collected to assist in the determination of precipitation rate limits; this is discussed in Transport Canada report TP 13314E. Thickness Tests Thickness measurements were carried out on Type IV fluid films and thickness profiles for each fluid brand were plotted as a function of time. The thickness profiles for the new Type IV fluids were found to be similar to those observed in thickness tests conducted in 1996-97.
EXECUTIVE SUMMARY
X:\@APS ARCHIVE\CM1380 (TDC Deicing 1997-98)\REPORT\HOT_SUB\Final Version 1.0\Final Version 1.0.DOC Final Version 1.0, October 06 ix
Holdover Time Tests Holdover time tables were developed for seven SAE-qualified Type IV fluids. From the Type IV fluid holdover time tables, a generic SAE holdover time table, consisting of cells containing the worst-performing fluid holdover times, was also developed. For the seven fluid-specific Type IV fluid holdover time tables, the categories of snow, freezing drizzle, and light freezing rain adopted the holdover times determined by using the regression analysis of the data collected for each specific fluid. The remaining categories adopted holdover times identical to the generic SAE table values. No Type III tests were performed because no Type III fluids were available during the past season. The current Type III holdover time table is not valid, since the numbers within the table were generated using a fluid that is no longer commercially available. No changes were made to the current Type I fluid holdover times. Two reductions were made to Type II fluid holdover times. These changes were made to prevent any Type II fluid holdover times from being longer than the Type IV SAE table holdover times. Supplementary Tests Recycled fluids were subjected to holdover time and fluid compatibility tests, and demonstrated similar performance levels to those of Type I fluids. A limited number of holdover time tests conducted with a fluid provided by Aeroflot revealed similar performance levels to those of commercial Type I fluids. Several variables, such as plate slope, fluid application procedure, fluid temperature at application, wind velocity, test surface finish, and fluid viscosity, were studied and deemed to affect the holdover time of Type IV fluids to varying degrees. The most significant effect on holdover time (up to a 50 percent reduction) was observed in holdover time tests conducted with heated Type IV fluids. Because of insufficient test data, no other concrete conclusions were possible when studying other variables.
EXECUTIVE SUMMARY
X:\@APS ARCHIVE\CM1380 (TDC Deicing 1997-98)\REPORT\HOT_SUB\Final Version 1.0\Final Version 1.0.DOC Final Version 1.0, October 06 x
Recommendations Recommendations relating to procedures and equipment, holdover time tests, and supplementary tests are based on this year's tests and results.
SOMMAIRE
X:\@APS ARCHIVE\CM1380 (TDC Deicing 1997-98)\REPORT\HOT_SUB\Final Version 1.0\Final Version 1.0.DOC Final Version 1.0, October 06 xi
SOMMAIRE À la demande du Centre de développement des transports de Transports Canada, APS Aviation Inc. a entrepris un programme de recherche qui vise à faire progresser la technologie de dégivrage et de protection antigivre des avions au sol. Plusieurs des objectifs assignés à ce programme sont traités dans une série de rapports déjà publiés. Les grands objectifs de la présente recherche étaient les suivants :
• mener des essais sur plaques planes sous précipitations naturelles et artificielles afin d’enregistrer la durée d’efficacité de liquides, et produire des tableaux individuels des durées d’efficacité à partir des résultats obtenus avec des échantillons de liquides de type IV déjà ou nouvellement homologués, fournis par les fabricants des liquides;
• mener des essais sur plaques planes afin de valider les tableaux spécifiques et les tableaux produits par la SAE pour lesquels les données sont actuellement insuffisantes.
D’autres objectifs étaient également poursuivis, soit :
• évaluer la durée d’efficacité et la compatibilité de liquides recyclés;
• déterminer l’effet de la température du liquide sur la durée d’efficacité des liquides de type IV;
• déterminer l’influence de l’inclinaison de la plaque d’essai sur la durée d’efficacité des liquides de type IV;
• déterminer l’influence de la méthode d’application du liquide sur la durée d’efficacité de celui-ci;
• déterminer l’effet du vent sur la durée d’efficacité.
Ont participé au projet plusieurs fabricants de liquides dégivrants/antigivre, le Centre de développement des transports de Transports Canada, le Conseil national de recherches du Canada, la Federal Aviation Administration des États-Unis et le Service de l’environnement atmosphérique (SEA) d’Environnement Canada. Les essais de durée d’efficacité consistent à verser les liquides abaisseurs du point de congélation sur des plaques en aluminium d’aéronef planes, propres et inclinées, à les exposer à diverses formes de précipitations givrantes naturelles et artificielles, et à mesurer le temps écoulé jusqu’à un état final prédéfini. L’état final et l’inclinaison de la plaque sont établis conformément aux spécifications du Sous-comité G-12 SAE/ISO (Society of Automotive Engineers/Organisation internationale de normalisation) sur les durées d’efficacité.
SOMMAIRE
X:\@APS ARCHIVE\CM1380 (TDC Deicing 1997-98)\REPORT\HOT_SUB\Final Version 1.0\Final Version 1.0.DOC Final Version 1.0, October 06 xii
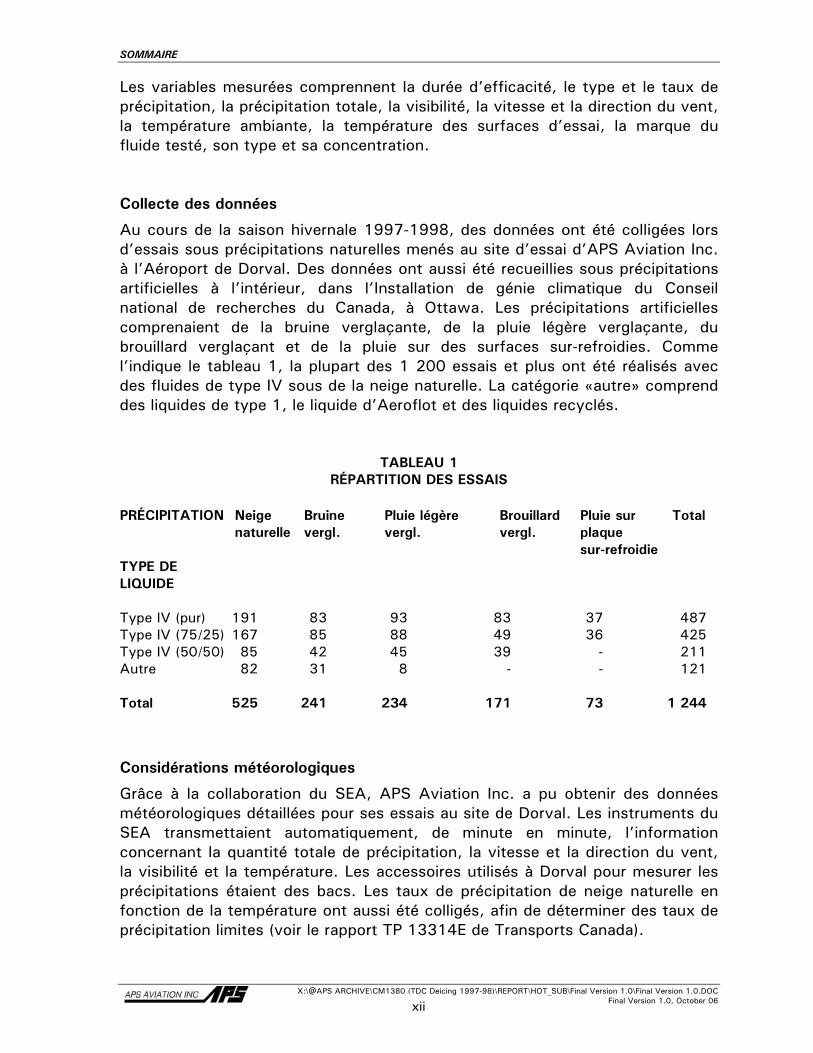
Les variables mesurées comprennent la durée d’efficacité, le type et le taux de précipitation, la précipitation totale, la visibilité, la vitesse et la direction du vent, la température ambiante, la température des surfaces d’essai, la marque du fluide testé, son type et sa concentration. Collecte des données
Au cours de la saison hivernale 1997-1998, des données ont été colligées lors d’essais sous précipitations naturelles menés au site d’essai d’APS Aviation Inc. à l’Aéroport de Dorval. Des données ont aussi été recueillies sous précipitations artificielles à l’intérieur, dans l’Installation de génie climatique du Conseil national de recherches du Canada, à Ottawa. Les précipitations artificielles comprenaient de la bruine verglaçante, de la pluie légère verglaçante, du brouillard verglaçant et de la pluie sur des surfaces sur-refroidies. Comme l’indique le tableau 1, la plupart des 1 200 essais et plus ont été réalisés avec des fluides de type IV sous de la neige naturelle. La catégorie «autre» comprend des liquides de type 1, le liquide d’Aeroflot et des liquides recyclés.
TABLEAU 1 RÉPARTITION DES ESSAIS
PRÉCIPITATION Neige Bruine Pluie légère Brouillard Pluie sur Total naturelle vergl. vergl. vergl. plaque sur-refroidie TYPE DE LIQUIDE Type IV (pur) 191 83 93 83 37 487 Type IV (75/25) 167 85 88 49 36 425 Type IV (50/50) 85 42 45 39 - 211 Autre 82 31 8 - - 121 Total 525 241 234 171 73 1 244 Considérations météorologiques
Grâce à la collaboration du SEA, APS Aviation Inc. a pu obtenir des données météorologiques détaillées pour ses essais au site de Dorval. Les instruments du SEA transmettaient automatiquement, de minute en minute, l’information concernant la quantité totale de précipitation, la vitesse et la direction du vent, la visibilité et la température. Les accessoires utilisés à Dorval pour mesurer les précipitations étaient des bacs. Les taux de précipitation de neige naturelle en fonction de la température ont aussi été colligés, afin de déterminer des taux de précipitation limites (voir le rapport TP 13314E de Transports Canada).
SOMMAIRE
X:\@APS ARCHIVE\CM1380 (TDC Deicing 1997-98)\REPORT\HOT_SUB\Final Version 1.0\Final Version 1.0.DOC Final Version 1.0, October 06 xiii
Essais d’épaisseur L’épaisseur des couches de liquides de type IV a été mesurée et des courbes de l’épaisseur en fonction du temps ont été tracées pour chaque marque de liquide. Les courbes d’épaisseur des nouveaux liquides de type IV se sont avérées semblables à celles obtenues lors des essais menés en 1996-1997. Essais de durée d’efficacité Des tableaux des durées d’efficacité ont été produits pour sept liquides de type IV homologués par la SAE. À partir de ces tableaux, un tableau générique de la SAE a été constitué, dans lequel figurent les durées d’efficacité du liquide le moins performant. Les durées d’efficacité qui composent chacun des sept tableaux spécifiques ont été établies au terme de l’analyse de régression des résultats d’essai de chacun des liquides, pour les catégories neige, bruine verglaçante et pluie légère verglaçante. Pour les autres catégories, les durées d’efficacité étaient identiques aux valeurs du tableau générique de la SAE. Aucun liquide de type III n’a été essayé car il n’existait alors sur le marché aucun liquide de ce type. À noter que le tableau actuel des durées d’efficacité des liquides de type III n’est pas valide, car il a été produit à l’aide d’un liquide disparu du marché. Aucun changement n’a été apporté aux durées d’efficacité des liquides de type I. Deux changements à la baisse ont été apportés aux durées d’efficacité des liquides de type II. Ces changements visent à faire en sorte que la durée d’efficacité d’un liquide de type II ne puisse jamais dépasser les durées d’efficacité du tableau de la SAE pour les liquides de type IV. Essais complémentaires Des liquides recyclés soumis à des essais de durée d’efficacité et de compatibilité ont affiché des niveaux de performance semblables à ceux des liquides de type I. Un petit nombre d’essais de durée d’efficacité effectués à l’aide d’un liquide fourni par Aeroflot ont révélé des niveaux de performance semblables à ceux des liquides de type I offerts sur le marché.
SOMMAIRE
X:\@APS ARCHIVE\CM1380 (TDC Deicing 1997-98)\REPORT\HOT_SUB\Final Version 1.0\Final Version 1.0.DOC Final Version 1.0, October 06 xiv
Plusieurs variables, comme l’inclinaison de la plaque, la méthode d’application du liquide, la température du liquide au moment de son application, la vitesse du vent, le fini de la surface d’essai et la viscosité du fluide, ont été mesurées. Elles se sont révélées influer à des degrés variables sur la durée d’efficacité des liquides de type IV. C’est avec des liquides de type IV chauffés qu’a été observé l’effet le plus puissant sur la durée d’efficacité (diminution jusqu’à 50 p. 100); mais en raison de l’insuffisance de données d’essai, aucune autre conclusion n’a pu être dégagée de l’étude des autres variables. Recommandations Les essais de cette année et leurs résultats ont donné lieu à des recommandations touchant les procédures et le matériel d’essai, les essais de durée d’efficacité, et les essais complémentaires.
TABLE OF CONTENTS
X:\@APS ARCHIVE\CM1380 (TDC Deicing 1997-98)\REPORT\HOT_SUB\Final Version 1.0\Final Version 1.0.DOC Final Version 1.0, October 06 xv
CONTENTS 1. INTRODUCTION ....................................................................................................... 1
1.1 Holdover Time Tables ................................................................................................. 2 1.2 Objectives ................................................................................................................. 8 1.3 Report Format............................................................................................................ 8
2. METHODOLOGY ...................................................................................................... 9
2.1 Definition of Weather Conditions ................................................................................. 9 2.1.1 Snow ....................................................................................................... 9 2.1.2 Freezing Drizzle........................................................................................ 11 2.1.3 Freezing Rain........................................................................................... 11 2.1.4 Freezing Fog............................................................................................ 13
2.2 Test Sites.................................................................................................................14 2.3 Test Conditions.........................................................................................................15
2.3.1 Droplet Size and Rate of Precipitation......................................................... 15 2.3.2 Median Volume Diameter of Raindrops ....................................................... 18 2.3.3 Characteristics of Precipitation Produced .................................................... 19
2.4 Equipment ................................................................................................................21 2.5 Test Procedures ........................................................................................................26
2.5.1 Test Protocol........................................................................................... 26 2.5.2 End Condition Definitions .......................................................................... 27
2.6 Data Forms...............................................................................................................28 2.7 Fluids .......................................................................................................................32
2.7.1 General................................................................................................... 32 2.7.2 Fluid Tested ............................................................................................ 35 2.7.3 Evolution of Type IV Fluids........................................................................ 35
2.8 Personnel .................................................................................................................37 2.9 Analysis Methodology................................................................................................38
2.9.1 General................................................................................................... 38 2.9.2 Description of Data Ranges and Precipitation Definitions............................... 38 2.9.3 Protocol for the Determination of Holdover Times ........................................ 42
3. DESCRIPTION OF DATA.......................................................................................... 57
3.1 Dorval Natural Snow Tests.........................................................................................57 3.1.1 Data Acquisition ...................................................................................... 57 3.1.2 Test Location and Fluids Tested................................................................. 59 3.1.3 Distribution of Average Precipitation Rates.................................................. 59 3.1.4 Distribution of Other Meteorological Conditions ........................................... 59
3.2 Freezing Drizzle and Light Freezing Rain Tests ..............................................................66 3.2.1 Data Acquisition ...................................................................................... 66 3.2.2 Test Location and Fluids Tested................................................................. 66 3.2.3 Distribution of Average Precipitation Rates.................................................. 66 3.2.4 Distribution of Other Meteorological Conditions ........................................... 66
3.3 Simulated Freezing Fog Tests .....................................................................................72 3.3.1 Data Acquisition ...................................................................................... 72 3.3.2 Test Location and Fluids Tested................................................................. 72 3.3.3 Distribution of Average Precipitation Rates.................................................. 72 3.3.4 Distribution of Tests by Air Temperature..................................................... 72
3.4 Simulated Rain on Cold-Soaked Surface Tests..............................................................76 3.4.1 Data Acquisition ...................................................................................... 76 3.4.2 Test Location and Fluids Tested................................................................. 76 3.4.3 Distribution of Average Precipitation Rates.................................................. 76 3.4.4 Distribution of Tests by Average Surface Temperature ................................. 76
TABLE OF CONTENTS
X:\@APS ARCHIVE\CM1380 (TDC Deicing 1997-98)\REPORT\HOT_SUB\Final Version 1.0\Final Version 1.0.DOC Final Version 1.0, October 06 xvi
4. FLUID THICKNESS TESTS ON FLAT PLATES............................................................. 79 4.1 General Procedures and Stabilized Neat Fluid Profiles ....................................................79 4.2 Dilution Effect...........................................................................................................85 4.3 Tank Heating Effect...................................................................................................86
5. HOLDOVER TIME TABLES, RESULTS, AND DISCUSSIONS.......................................... 89
5.1 Background ..............................................................................................................89 5.2 Type IV Fluids...........................................................................................................93
5.2.1 Natural Snow .......................................................................................... 93 5.2.2 Freezing Drizzle...................................................................................... 105 5.2.3 Light Freezing Rain................................................................................. 114 5.2.4 Freezing Fog.......................................................................................... 125 5.2.5 Rain on a Cold-Soaked Wing.................................................................... 133
5.3 Type III Fluid Holdover Time Tests ............................................................................137 5.4 Type I Fluid Holdover Time Tests ..............................................................................138 5.5 Type II Fluid Holdover Time Tests .............................................................................141 5.6 Official and Proposed Holdover Time Tables for 1998-99............................................143
6. SUPPLEMENTARY TESTS...................................................................................... 155
6.1 Natural Freezing Precipitation Tests Excluding Snow...................................................155 6.2 Evaluation of Recycled Fluids....................................................................................161
6.2.1 Holdover Time ....................................................................................... 161 6.2.2 Compatibility Tests ................................................................................ 163 6.2.3 Thickness Tests..................................................................................... 174 6.2.4 Negative Buffer Deicing Fluid Tests / Deicing Only Fluid Tests ..................... 174
6.3 Evaluation of Snow-Making Capability at National Research Council Canada Climatic Engineering Facility .....................................................................................175
6.3.1 Background ........................................................................................... 175 6.3.2 Objective .............................................................................................. 175 6.3.3 Procedure ............................................................................................. 175 6.3.4 Results ................................................................................................. 176
6.4 Evaluation of Aeroflot Fluid ......................................................................................178 6.5 Influence of Plate Slope on Holdover Time .................................................................180
6.5.1 Effect of Surface Finish on Holdover Time................................................. 182 6.6 Influence of Application Procedure on Holdover Time..................................................183 6.7 Influence of Type IV Fluid Temperature on Holdover Time ...........................................185 6.8 Influence of Wind on Holdover Time..........................................................................187 6.9 Influence of Fluid Viscosity on Holdover Time ............................................................189 6.10 Escaped Precipitation: What and Why?......................................................................192
7. CONCLUSIONS .................................................................................................... 198
7.1 Holdover Time Determination ...................................................................................198 7.1.1 Type IV Fluids ....................................................................................... 198 7.1.2 Type III Fluids ........................................................................................ 199 7.1.3 Type I Fluids.......................................................................................... 199 7.1.4 Type II Fluids......................................................................................... 199
7.2 SUPPLEMENTARY TESTS........................................................................................200 7.2.1 Evaluation of Recycled Fluids................................................................... 200 7.2.2 Evaluation of the Snow-Making Capability of NRC’s CEF............................. 200 7.2.3 Aeroflot Fluid ........................................................................................ 200 7.2.4 Influence of Plate Slope on Holdover Time ................................................ 200 7.2.5 Influence of Application Procedure on Holdover Time ................................. 201 7.2.6 Influence of Type IV Fluid Temperature on Holdover Time........................... 201 7.2.7 Influence of Wind on Holdover Time......................................................... 201 7.2.8 Influence of Fluid Viscosity on Holdover Time............................................ 201
TABLE OF CONTENTS
X:\@APS ARCHIVE\CM1380 (TDC Deicing 1997-98)\REPORT\HOT_SUB\Final Version 1.0\Final Version 1.0.DOC Final Version 1.0, October 06 xvii
8. RECOMMENDATIONS........................................................................................... 202
8.1 Holdover Time Tests................................................................................................202 8.2 Test Procedures and Equipment................................................................................202
8.2.1 Procedures ............................................................................................ 202 8.2.2 Equipment............................................................................................. 203
8.3 Supplementary Tests...............................................................................................203 8.3.1 Evaluation of Snow-Making at NRC’s CEF................................................. 203 8.3.2 Influence of Application Procedure on Holdover Time ................................. 203 8.3.3 Influence of Wind on Holdover Time......................................................... 203 8.3.4 Influence of Fluid Viscosity on Holdover Time............................................ 203 8.3.5 Escaped Precipitation.............................................................................. 204
TABLE OF CONTENTS
X:\@APS ARCHIVE\CM1380 (TDC Deicing 1997-98)\REPORT\HOT_SUB\Final Version 1.0\Final Version 1.0.DOC Final Version 1.0, October 06 xviii
LIST OF APPENDICES A Terms of Reference – Work Statement B APS Test Plan and Procedures for Dorval Natural Precipitation Flat Plate Testing C Detailed Plan of NRC Cold Chamber Testing D Listing of Flat Plate Tests Conducted during 1997-98 E Evaluation of Type IV Test Data Using Regression Method for Winter 1997-98 F Statistical Multi-Variable Regression Analysis G Official Transport Canada Holdover Time Tables for Use during Winter 1998-99 H Official FAA Holdover Time Tables for Use during Winter 1998-99 I Detailed References Related to Holdover Time Changes to Light Freezing Rain at -10ºC J Data from Tests of Artificial Snow at National Research Council Canada Climatic
Engineering Facility
LIST OF FIGURES, TABLES AND PHOTOS
X:\@APS ARCHIVE\CM1380 (TDC Deicing 1997-98)\REPORT\HOT_SUB\Final Version 1.0\Final Version 1.0.DOC Final Version 1.0, October 06 xix
LIST OF FIGURES 2.1 APS Test Site Location at Dorval Airport ..................................................................14 2.2 Droplet Size Pattern Produced at NRC – Freezing Drizzle ............................................17 2.3 Conversion of Spot Diameter to Drop Diameter .........................................................17 2.4 Flat Plate Test Set-up.............................................................................................22 2.5 Schematics of Plate Pan and Sealed Boxes ...............................................................23 2.6 Freeze Point of Ethylene-Based Glycol ......................................................................33 2.7 Freeze Point of Propylene-Based Glycol ....................................................................33 2.8 Data Range Used for Evaluation of Holdover Time Limits............................................39 2.9 Example of Regression Method on Log-Log Chart ......................................................43 2.10 Example of Regression Method on Standard Chart.....................................................43 2.1 View of Dorval Test Site and Associated Equipment ..................................................47 3.1 Number of Natural Snow Tests Conducted – 1997-98 Test Season at Dorval...............60 3.2 Distribution of Precipitation Rate – Type IV Fluids, Natural Snow Tests, 1997-98 .........61 3.3 Distribution of Air Temperature – Type IV Fluids, Natural Snow Tests, 1997-98 ...........63 3.4 Distribution of Wind Speed – Type IV Fluids, Natural Snow Tests, 1997-98 .................64 3.5 Comparison of Wind Direction to Platform Direction, Natural Snow Tests, 1997-98 ......65 3.6 Number of Simulated Freezing Drizzle and Light Freezing Rain Tests – 1997-98 Test Season.................................................................................................................67 3.7 Distribution of Precipitation Rate – Type I Fluids – Simulated Freezing Drizzle/Light Freezing Rain Tests, 1997-98 .................................................................................68 3.8 Distribution of Precipitation Rate – Recycled Fluids – Simulated Freezing Drizzle/Light
Freezing Rain Tests, 1997-98 .................................................................................68 3.9 Distribution of Precipitation Rate – Type IV Fluids, Simulated Freezing Drizzle/Light Freezing Rain Tests, 1997-98 .................................................................................69 3.10 Distribution of Air Temperature – Type I Fluids – Simulated Freezing Drizzle/Light Freezing Rain Tests, 1997-98 .................................................................................70 3.11 Distribution of Air Temperature – Recycled Fluids – Simulated Freezing Drizzle/Light
Freezing Rain Tests, 1997-98 .................................................................................70 3.12 Distribution of Air Temperature – Type IV Fluids – Simulated Freezing Drizzle/Light Freezing Rain Tests, 1997-98 .................................................................................71 3.13 Number of Simulated Freezing Fog Tests – 1997-98 Test Season ...............................73 3.14 Distribution of Precipitation Rate – Type IV Fluids – Simulated Freezing Fog Tests, 1997-98...............................................................................................................74 3.15 Distribution of Air Temperature – Type IV Fluids – Simulated Freezing Fog Tests, 1997-98...............................................................................................................75 3.16 Distribution of Precipitation Intensity – Type IV Fluids – Cold-Soak Box Tests, 1997-98 77 3.17 Distribution of Skin Temperature – Type IV Fluids – Cold-Soak Box Tests ....................78 4.1 Thickness Decay of Old Type IV Neat Fluids, 1995-96...............................................82 4.2 Thickness Decay of Type IV Neat Fluids, 1996-97 ....................................................82 4.3 Thickness Decay of Type IV Neat Fluids, 1997-98 ....................................................82 4.4 Stabilized Film Thickness of Various Type IV Fluids, Winter 1997-98 – OAT = -3 to 5ºC..................................................................................................................84 5.1 Effect of Fluid Brand and Rate of Precipitation on Failure Time – Type IV Neat (above 0ºC) – Natural Snow Conditions ...................................................................95 5.2 Effect of Fluid Brand and Rate of Precipitation on Failure Time – Type IV 75/25 (above 0ºC) – Natural Snow Conditions ...................................................................96 5.3 Effect of Fluid Brand and Rate of Precipitation on Failure Time – Type IV 50/50 (above 0ºC) – Natural Snow Conditions ...................................................................98 5.4 Effect of Fluid Brand and Rate of Precipitation on Failure Time – Type IV Neat (0 to -3ºC) – Natural Snow Conditions .....................................................................99 5.5 Effect of Fluid Brand and Rate of Precipitation on Failure Time – Type IV 75/25 (0 to -3ºC) – Natural Snow Conditions ................................................................... 100
LIST OF FIGURES, TABLES AND PHOTOS
X:\@APS ARCHIVE\CM1380 (TDC Deicing 1997-98)\REPORT\HOT_SUB\Final Version 1.0\Final Version 1.0.DOC Final Version 1.0, October 06 xx
5.6 Effect of Fluid Brand and Rate of Precipitation on Failure Time – Type IV 50/50 (0 to -3ºC) – Natural Snow Conditions ................................................................... 102 5.7 Effect of Fluid Brand and Rate of Precipitation on Failure Time – Type IV Neat (-3 to -14ºC) – Natural Snow Conditions ................................................................ 103 5.8 Effect of Fluid Brand and Rate of Precipitation on Failure Time – Type IV 75/25 (-3 to -14ºC) – Natural Snow Conditions ................................................................ 104 5.9 Effect of Fluid Brand and Rate of Precipitation on Failure Time – Type IV Neat (-14 to -25ºC) – Natural Snow Conditions .............................................................. 106 5.10 Effect of Fluid Brand and Rate of Precipitation on Failure Time – Type IV Neat – Freezing Drizzle at -3ºC, 1997-98.......................................................................... 107 5.11 Effect of Fluid Brand and Rate of Precipitation on Failure Time – Type IV 75/25 – Freezing Drizzle at -3ºC, 1997-98.......................................................................... 108 5.12 Effect of Fluid Brand and Rate of Precipitation on Failure Time – Type IV 50/50 – Freezing Drizzle at -3ºC, 1997-98.......................................................................... 109 5.13 Effect of Fluid Brand and Rate of Precipitation on Failure Time – Type IV Neat – Freezing Drizzle at -10ºC, 1997-98........................................................................ 110 5.14 Effect of Fluid Brand and Rate of Precipitation on Failure Time – Type IV 75/25 – Freezing Drizzle at -10ºC, 1997-98........................................................................ 111 5.15 Effect of Fluid Brand and Rate of Precipitation on Failure Time – Type IV Neat – Light
Freezing Rain at -3ºC, 1997-98............................................................................. 115 5.16 Effect of Fluid Brand and Rate of Precipitation on Failure Time – Type IV 75/25 – Light
Freezing Rain at –3ºC, 1997-98 ............................................................................ 116 5.17 Effect of Fluid Brand and Rate of Precipitation on Failure Time – Type IV 50/50 – Light
Freezing Rain at –3ºC, 1997-98 ............................................................................ 117 5.18 Effect of Fluid Brand and Rate of Precipitation on Failure Time – Type IV Neat – Light
Freezing Rain at -10ºC, 1997-98 ........................................................................... 118 5.19 Effect of Fluid Brand and Rate of Precipitation on Failure Time – Type IV 75/25 – Light
Freezing Rain at -10ºC, 1997-98 ........................................................................... 119 5.20 Effect of Fluid Brand and Rate of Precipitation on Failure Time – Type IV Neat at -3ºC – Simulated Freezing Fog, 1997-98 ....................................................................... 126 5.21 Effect of Fluid Brand and Rate of Precipitation on Failure Time – Type IV 75/25 at -3ºC – Simulated Freezing Fog, 1997-98................................................................ 127 5.22 Effect of Fluid Brand and Rate of Precipitation on Failure Time – Type IV 50/50 at -3ºC – Simulated Freezing Fog, 1997-98................................................................ 128 5.23 Effect of Fluid Brand and Rate of Precipitation on Failure Time – Type IV Neat at -14ºC – Simulated Freezing Fog, 1997-98 ....................................................................... 129 5.24 Effect of Fluid Brand and Rate of Precipitation on Failure Time – Type IV 75/25 at -14ºC – Simulated Freezing Fog, 1997-98.............................................................. 130 5.25 Effect of Fluid Brand and Rate of Precipitation on Failure Time – Type IV Neat at -25ºC – Simulated Freezing Fog, 1997-98.............................................................. 131 5.26 Effect of Fluid Brand and Rate of Precipitation on Failure Time – Type IV Neat – Rain on a Cold-Soaked Surface, 1997-98 ...................................................................... 134 5.27 Effect of Fluid Brand and Rate of Precipitation on Failure Time – Type IV 75/25 – Rain on a Cold-Soaked Surface, 1997-98 ...................................................................... 135 5.28 Effect of Fluid Brand and Rate of Precipitation on Failure Time – UCAR XL54 Type I –
Natural Snow Conditions, 1997-98........................................................................ 139 5.29 Effect of Fluid Brand and Rate of Precipitation on Failure Time –Octagon Type I – Natural Snow Conditions, 1997-98........................................................................ 140 6.1 Effect of Fluid Brand and Rate of Precipitation on Failure Time – Type IV Neat – Different Natural Precipitation Conditions, 1997-98................................................. 157 6.2 Effect of Fluid Brand and Rate of Precipitation on Failure Time – Type IV 75/25 – Different Natural Precipitation Conditions, 1997-98................................................. 158 6.3 Effect of Fluid Brand and Rate of Precipitation on Failure Time – Type IV 50/50 – Different Natural Precipitation Conditions, 1997-98................................................. 159
LIST OF FIGURES, TABLES AND PHOTOS
X:\@APS ARCHIVE\CM1380 (TDC Deicing 1997-98)\REPORT\HOT_SUB\Final Version 1.0\Final Version 1.0.DOC Final Version 1.0, October 06 xxi
6.4 Effect of Fluid Brand and Rate of Precipitation on Failure Time – Type I and Recycled Fluids – Different Natural Precipitation Conditions, 1997-98..................................... 160 6.5 Effect of Fluid Brand and Rate of Precipitation on Failure Time – Type I and Recycled Fluids – Natural Snow Conditions, 1997-98............................................................ 162 6.6 Effect of Fluid Brand and Rate of Precipitation on Failure Time – Type I and Recycled Fluids – Freezing Drizzle and Light Freezing Rain, 1997-98 ....................................... 164 6.7 Compatibility of Recycled Fluids with Type I – Simulated Freezing Drizzle, ................. 166 6.8 Compatibility of Recycled Fluids with Type I – Simulated Light Freezing Rain.............. 167 6.9 Compatibility of Recycled Fluids with Ethylene Type IV – Simulated Freezing Drizzle ... 170 6.10 Compatibility of Recycled Fluids with Ethylene Type IV – Simulated Light Freezing Rain171 6.11 Compatibility of Recycled Fluids with Propylene Type IV – Simulated Freezing Drizzle.. 172 6.12 Compatibility of Recycled Fluids with Propylene Type IV – Simulated Light Freezing Rain .................................................................................................................. 173 6.13 Effect of Temperature and Rate of Precipitation on Failure Time – Aeroflot – Natural Snow Conditions, 1997-98................................................................................... 179 6.14 Effect of Slope on Holdover Times – Light Freezing Rain at -10ºC ............................. 181 6.15 Effect of Slope on Holdover Times – Light Freezing Rain at -3ºC ............................... 181 6.16 APS Sprayer Tests – Light Freezing Rain at -3ºC ..................................................... 184 6.17 Effect of Fluid Temperature on Holdover Times – Light Freezing Rain at -3ºC............. 186 6.18 Effect of Wind on Holdover Times – Light Freezing Rain at -3ºC................................ 188 6.19 Effect of Viscosity on Holdover Time – Type IV Neat – Natural Snow Conditions........ 190 6.20 Effect of Viscosity on Holdover Time – Type IV Neat – Simulated Light Freezing Rain . 191 LIST OF TABLES 1.1 Summary of APS Holdover Time Testing Activities ......................................................3 1.2 SAE Type I Holdover Times Used during Winter 1997-98 .............................................4 1.3 SAE Type II Holdover Times Used during Winter 1997-98 ............................................4 1.4 SAE Type III Holdover Times Used during Winter 1997-98 ...........................................5 1.5 SAE Type IV Holdover Times Used during Winter 1997-98...........................................5 1.6 Fluid-Specific Type IV Holdover Times – Kilfrost ABC-S – Used during Winter 1997-98...6 1.7 Fluid-Specific Type IV Holdover Times – Octagon MaxFlight – Used during Winter 1997-98.................................................................................................................6 1.8 Fluid-Specific Type IV Holdover Times – Union Carbide Ultra+ – Used during Winter
1997-98.................................................................................................................7 1.9 Fluid-Specific Type IV Holdover Times – Clariant MPIV 1957 – Used during Winter
1997-98.................................................................................................................7 2.1 Definition of Weather Phenomena............................................................................10 2.2 Snow Visibility Chart .............................................................................................12 2.3 End Condition Data Form........................................................................................29 2.4 Meteo/Plate Pan Data Form ....................................................................................30 2.5 Precipitation Rate Measurement at CEF in Ottawa .....................................................31 2.6 Fluid Brix and Viscosity Values (1st Shipment) ...........................................................34 3.1 Summary of Tests Performed in 1997-98.................................................................58 4.1 Log of Fluid Thickness Tests...................................................................................80 5.1 Data Used for Evaluation of Holdover Times .............................................................91 5.2 SAE Type I Holdover Times .................................................................................. 142 5.3 SAE Type II Holdover Times.................................................................................. 142 5.4 New SAE Type IV 1998-99 Holdover Times ........................................................... 144 5.5 Fluid-Specific Type IV Holdover Times for 1998-99 – Clariant MPIV 1957 (1998-99).. 145 5.6 Fluid-Specific Type IV Holdover Times for 1998-99 – Clariant MPIV 2001 ................. 146 5.7 Fluid-Specific Type IV Holdover Times for 1998-99 – Kilfrost ABC-S......................... 147
LIST OF FIGURES, TABLES AND PHOTOS
X:\@APS ARCHIVE\CM1380 (TDC Deicing 1997-98)\REPORT\HOT_SUB\Final Version 1.0\Final Version 1.0.DOC Final Version 1.0, October 06 xxii
5.8 Fluid-Specific Type IV Holdover Times for 1998-99 – Octagon MaxFlight................... 148 5.9 Fluid-Specific Type IV Holdover Times for 1998-99 – SPCA AD-404......................... 149 5.10 Fluid-Specific Type IV Holdover Times for 1998-99 – SPCA AD-480......................... 150 5.11 Fluid-Specific Type IV Holdover Times for 1998-99 – Union Carbide Ultra+............... 151 LIST OF PHOTOS 2.1 View of Dorval Test Site and Associated Equipment ................................................. 47 2.2 Environment Canada’s Weather Observation Station at Dorval Airport ........................ 48 2.3 Outdoor View of NRC CEF..................................................................................... 48 2.4 Inside View of Small End of Climatic Engineering Facility........................................... 49 2.5 Inside View of Large End of Climatic Engineering Facility........................................... 49 2.6 Sprayer Assembly Used at NRC.............................................................................. 50 2.7 Sprayer Nozzle ..................................................................................................... 50 2.8 Optical Gauge by HSS to Measure Droplet Size ........................................................ 51 2.9 Example of Droplet Sizes Produced by NRC Spray System......................................... 51 2.10 Test Plates Mounted on a Stand............................................................................. 52 2.11 Collection Pans Used Indoors at NRC ...................................................................... 52 2.12 Cold-Soak Boxes Cooling Unit ................................................................................ 53 2.13 Misco Refractometer Used to Measure Freeze Point.................................................. 53 2.14 Hand-held RVSI Ice Detection Unit.......................................................................... 54 2.15 Spar/Cox Ice Detection Unit................................................................................... 55 2.16 Atmospheric Environment Services Automated Weather Station Instruments ............... 55 2.17 Hand-held Temperature Probe ................................................................................ 56 4.1 Setup for Thickness Test Inside APS Trailer at Dorval Airport .................................... 87 4.2 Double-Boiler System Used for Heating Type IV Fluid to 80ºC.................................... 87 5.1 Comparison of Fluid Samples Provided for Holdover Time Testing .............................152 5.2 Condition of Test Plates 14 Minutes following Ultra+ Application .............................153 6.1 Test Setup Showing Reduced Visibility during Snow Making.....................................193 6.2 Snow Spray Bar in Operation ................................................................................194 6.3 Test Setup with Flat Horizontal Plates on Pedestals .................................................195 6.4 Accumulated Snow Following Test ........................................................................195 6.5 Mobile Type IV Sprayer ........................................................................................196 6.6 Task Force Tip Nozzle ..........................................................................................196
GLOSSARY
X:\@APS ARCHIVE\CM1380 (TDC Deicing 1997-98)\REPORT\HOT_SUB\Final Version 1.0\Final Version 1.0.DOC Final Version 1.0, October 06 xxiii
GLOSSARY AES Atmospheric Environment Services AMIL Anti-icing Materials Icing Laboratory AMS Aerospace Material Specification APS APS Aviation Inc. CEF Climatic Engineering Facility C/FIMS Contamination/Fluid Integrity Monitoring System FAA Federal Aviation Administration HHET High Humidity Endurance Test HOT Holdover Time ISO International Organization for Standardization LWC Liquid Water Content MVD Median Volume Diameter NCAR National Center for Atmospheric Research NRC National Research Council Canada POSS Precipitation Occurrence Sensing System READAC Remote Environmental Automatic Data Acquisition Concept RVSI Robotic Vision System Inc. SAE Society of Automotive Engineers SMI Scientific Material International Inc. TDC Transportation Development Centre UCAR Union Carbide Corporation UQAC Université du Québec à Chicoutimi WSET Water Spray Endurance Test
xxiv
This page intentionally left blank.
1. INTRODUCTION
X:\@APS ARCHIVE\CM1380 (TDC Deicing 1997-98)\REPORT\HOT_SUB\Final Version 1.0\Final Version 1.0.DOC Final Version 1.0, October 06 1
1. INTRODUCTION
At the request of the Transportation Development Centre (TDC) of Transport Canada, APS Aviation Inc. undertook a research project to further advance ground aircraft de/anti-icing technology. This project involved the participation of TDC, Transport Canada, the U.S. Federal Aviation Administration, and several de/anti-icing fluid manufacturers. Aircraft ground deicing/anti-icing has been the subject of concentrated industry attention over the past decade due the occurrence of several fatal icing-related aircraft accidents. Recent attention has been placed upon the enhancement of anti-icing fluids in order to provide an extended period of protection against further contamination following initial deicing. This emphasis has led to the development of de/anti-icing fluid holdover time tables for use by aircraft operators and accepted by regulatory authorities. New anti-icing formulations continue to be developed by leading manufacturers with the specific objective of prolonging fluid holdover times without compromising the aerodynamic features of the airfoil. Flat plate tests, conducted in natural and simulated precipitation, are used to develop and substantiate fluid holdover time tables for current fluids and new formulations. Test procedures to measure duration of fluid protection against ice formation have evolved to a standard approach that has been followed by APS and others at a number of locations in previous years. Aircraft are deiced using heated Type I fluids. These fluids are excellent for the removal of existing contamination on aircraft wings; however, they provide limited protection against further ice accumulation. Anti-icing fluids are applied following aircraft deicing. Type II fluids are thicker and more viscous than Type I deicing fluids. They form a thicker layer on application and provide a longer duration of protection against further contamination. Type III is an anti-icing fluid developed with shear and flow properties designed for aircraft with slower rotation speeds. Type IV fluids are the latest generation of anti-icing fluids and are designed to provide the utmost in holdover time protection. The results of Type IV fluid tests conducted during the 1997-98 winter season constitute the major focus of this report. Eight Type IV fluids were tested during the 1997-98 winter season, including five new fluid formulations. Testing of these fluids has resulted in the development of holdover time tables. These tables provide guidelines for use in departure planning in adverse winter conditions and govern the holdover times for aircraft treated with a given fluid. A new data analysis protocol was developed in 1996-97 wherein failure data for each fluid brand, for each cell of the holdover time tables, were subject to a multi-variable regression treatment. Type IV fluid holdover times were
1. INTRODUCTION
X:\@APS ARCHIVE\CM1380 (TDC Deicing 1997-98)\REPORT\HOT_SUB\Final Version 1.0\Final Version 1.0.DOC Final Version 1.0, October 06 2
determined using this method of analysis, resulting in one generic SAE Type IV fluid table and several fluid-specific Type IV fluid tables. Over the past years, APS Aviation has completed substantial testing, on behalf of Transport Canada, relating to the determination of fluid holdover times and the substantiation of holdover time tables as well as to the research and development of deicing technology in general. A summary of the research relating to fluid holdover times is provided in Table 1.1.
1.1 Holdover Time Tables
The holdover time tables developed or in use for the 1997-98 winter season are shown in Tables 1.2 to 1.5: Table 1.2 is for Type I fluids; Table 1.3 is for Type II fluids; Table 1.4 is for Type III fluids; and Table 1.5 is the generic table for Type IV fluids. These tables contain the fluid holdover times that were provided to operators for use during the 1997-98 winter season. Each holdover time table is composed of cells, and each cell of the table contains a holdover time range which refers to a specific fluid type and dilution, temperature range, and category of precipitation. The time range in each cell is defined by a lower time and an upper time. These values represent the average failure time of the fluid at the upper and lower precipitation rate limits (defined in Subsection 2.9 for all categories of precipitation).
The holdover time tables shown in this section were first published in last year’s (winter 1996-97) holdover time report, Transport Canada report TP 13131E (1). Analysis of the Type IV data from 1996-97 indicated a need to develop fluid-specific holdover time tables in addition to a generic or worst case SAE fluid holdover time table. The generic SAE table encompasses the performance behaviour of all qualifying Type IV fluids. The fluid-specific approach was taken due to wide variations in the performance of the different Type IV fluids tested. The fluid-specific holdover time tables for four Type IV fluids, Kilfrost ABC-S, Octagon MaxFlight, Union Carbide Ultra+ and Hoechst MPIV 1957, tested during 1996-97, are shown in Tables 1.6 to 1.9. The primary effort of this year’s study was directed toward the comprehensive testing of five new Type IV fluids, as well as the retesting of three certified Type IV fluids from previous years. Extensive natural precipitation tests were conducted by APS Aviation at the Dorval Airport test site. These included snow and non-snow precipitation events. Simulated freezing drizzle, light freezing rain, freezing fog, and rain on a cold-soaked surface tests were conducted at the National Research Council Canada (NRC) Climatic Engineering Facility (CEF) in Ottawa. In total, 1 244 holdover time tests were conducted during the 1997-98 test season. The results of flat plate holdover time tests were presented to the SAE G-12 Holdover Time Subcommittee where they were reviewed and discussed; new holdover time
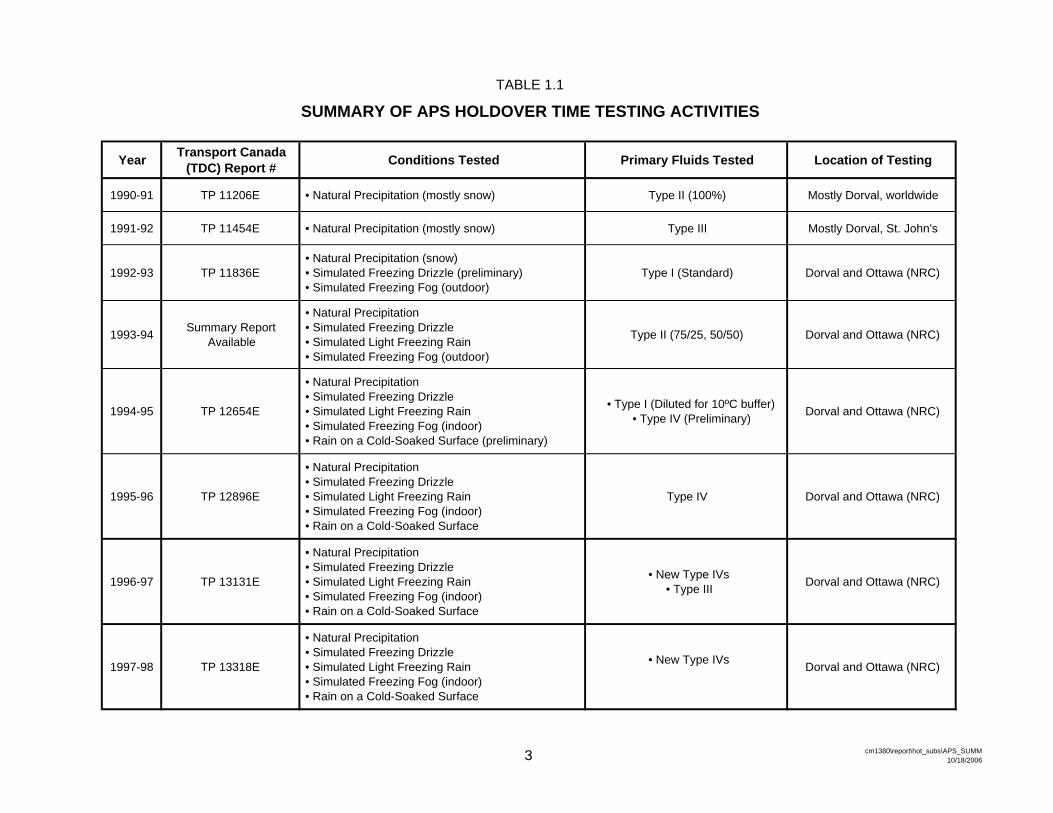
TABLE 1.1
SUMMARY OF APS HOLDOVER TIME TESTING ACTIVITIES
Year Transport Canada(TDC) Report # Conditions Tested Primary Fluids Tested Location of Testing
1990-91 TP 11206E • Natural Precipitation (mostly snow) Type II (100%) Mostly Dorval, worldwide
1991-92 TP 11454E • Natural Precipitation (mostly snow) Type III Mostly Dorval, St. John's
1992-93 TP 11836E • Natural Precipitation (snow) • Simulated Freezing Drizzle (preliminary) • Simulated Freezing Fog (outdoor)
Type I (Standard) Dorval and Ottawa (NRC)
1993-94 Summary ReportAvailable
• Natural Precipitation • Simulated Freezing Drizzle • Simulated Light Freezing Rain • Simulated Freezing Fog (outdoor)
Type II (75/25, 50/50) Dorval and Ottawa (NRC)
1994-95 TP 12654E
• Natural Precipitation • Simulated Freezing Drizzle • Simulated Light Freezing Rain • Simulated Freezing Fog (indoor) • Rain on a Cold-Soaked Surface (preliminary)
• Type I (Diluted for 10ºC buffer) • Type IV (Preliminary) Dorval and Ottawa (NRC)
1995-96 TP 12896E
• Natural Precipitation • Simulated Freezing Drizzle • Simulated Light Freezing Rain • Simulated Freezing Fog (indoor) • Rain on a Cold-Soaked Surface
Type IV Dorval and Ottawa (NRC)
1996-97 TP 13131E
• Natural Precipitation • Simulated Freezing Drizzle • Simulated Light Freezing Rain • Simulated Freezing Fog (indoor) • Rain on a Cold-Soaked Surface
• New Type IVs • Type III Dorval and Ottawa (NRC)
1997-98 TP 13318E
• Natural Precipitation • Simulated Freezing Drizzle • Simulated Light Freezing Rain • Simulated Freezing Fog (indoor) • Rain on a Cold-Soaked Surface
• New Type IVs Dorval and Ottawa (NRC)
3 cm1380\report\hot_subs\APS_SUMM10/18/2006
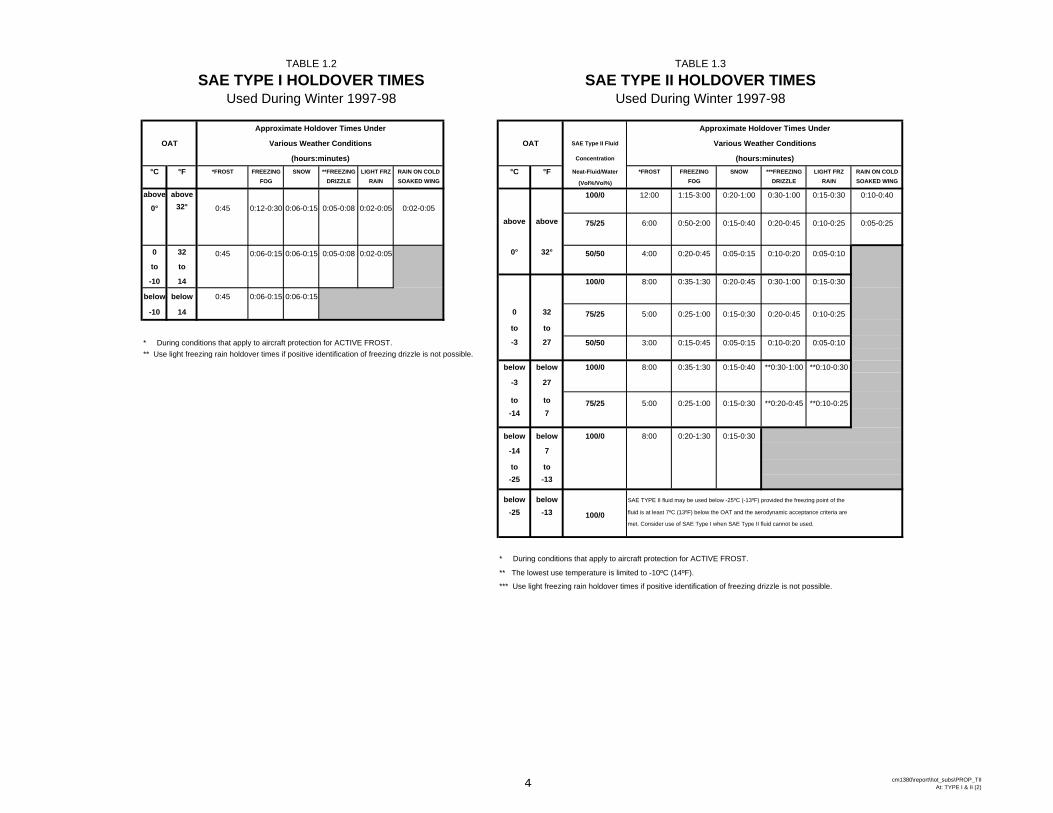
TABLE 1.2 TABLE 1.3
SAE TYPE I HOLDOVER TIMES SAE TYPE II HOLDOVER TIMESUsed During Winter 1997-98 Used During Winter 1997-98
Approximate Holdover Times Under Approximate Holdover Times Under
OAT Various Weather Conditions OAT SAE Type II Fluid Various Weather Conditions
(hours:minutes) Concentration (hours:minutes)°C °F *FROST FREEZING SNOW **FREEZING LIGHT FRZ RAIN ON COLD °C °F Neat-Fluid/Water *FROST FREEZING SNOW ***FREEZING LIGHT FRZ RAIN ON COLD
FOG DRIZZLE RAIN SOAKED WING (Vol%/Vol%) FOG DRIZZLE RAIN SOAKED WING
above above 100/0 12:00 1:15-3:00 0:20-1:00 0:30-1:00 0:15-0:30 0:10-0:40
0° 32° 0:45 0:12-0:30 0:06-0:15 0:05-0:08 0:02-0:05 0:02-0:05
above above 75/25 6:00 0:50-2:00 0:15-0:40 0:20-0:45 0:10-0:25 0:05-0:25
0 32 0:45 0:06-0:15 0:06-0:15 0:05-0:08 0:02-0:05 0° 32° 50/50 4:00 0:20-0:45 0:05-0:15 0:10-0:20 0:05-0:10
to to
-10 14 100/0 8:00 0:35-1:30 0:20-0:45 0:30-1:00 0:15-0:30
below below 0:45 0:06-0:15 0:06-0:15
-10 14 0 32 75/25 5:00 0:25-1:00 0:15-0:30 0:20-0:45 0:10-0:25
to to
* During conditions that apply to aircraft protection for ACTIVE FROST. -3 27 50/50 3:00 0:15-0:45 0:05-0:15 0:10-0:20 0:05-0:10** Use light freezing rain holdover times if positive identification of freezing drizzle is not possible.
below below 100/0 8:00 0:35-1:30 0:15-0:40 **0:30-1:00 **0:10-0:30
-3 27
to to 75/25 5:00 0:25-1:00 0:15-0:30 **0:20-0:45 **0:10-0:25-14 7
below below 100/0 8:00 0:20-1:30 0:15-0:30
-14 7
to to-25 -13
below below SAE TYPE II fluid may be used below -25ºC (-13ºF) provided the freezing point of the
-25 -13 100/0 fluid is at least 7ºC (13ºF) below the OAT and the aerodynamic acceptance criteria are
met. Consider use of SAE Type I when SAE Type II fluid cannot be used.
* During conditions that apply to aircraft protection for ACTIVE FROST.
** The lowest use temperature is limited to -10ºC (14ºF).
*** Use light freezing rain holdover times if positive identification of freezing drizzle is not possible.
4 cm1380\report\hot_subs\PROP_TIIAt: TYPE I & II (2)
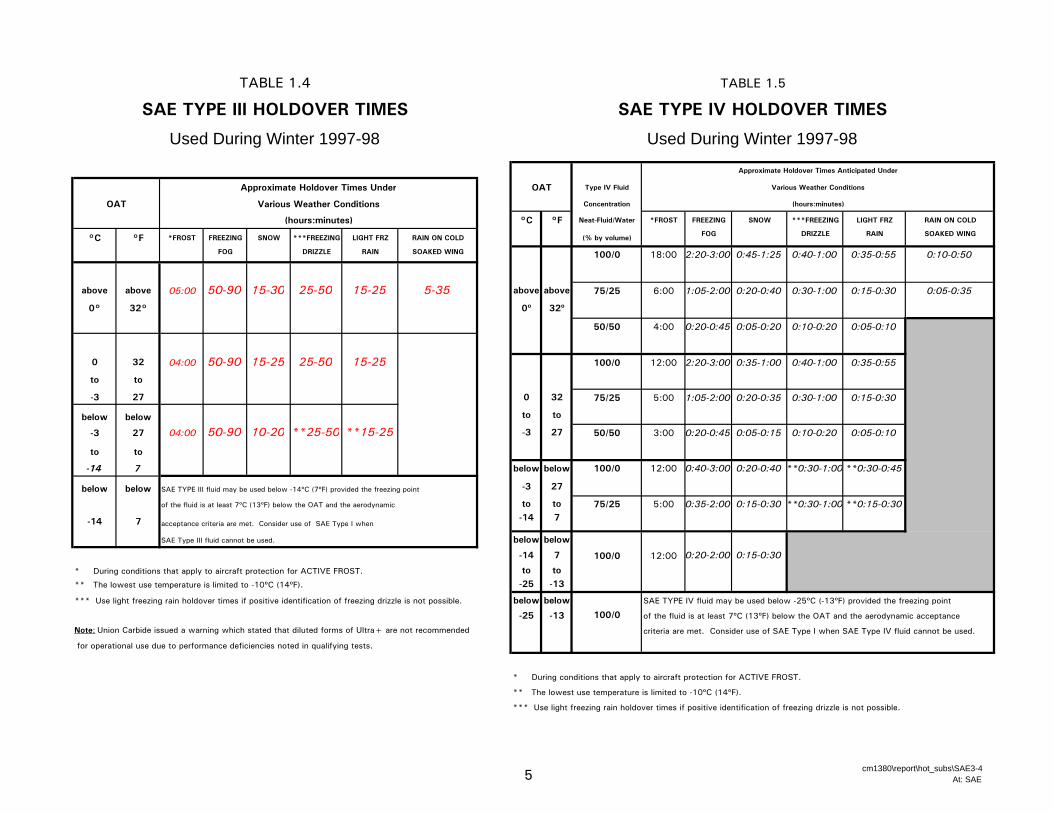
TABLE 1.4 TABLE 1.5
SAE TYPE III HOLDOVER TIMES SAE TYPE IV HOLDOVER TIMES
Used During Winter 1997-98
Approximate Holdover Times Anticipated Under
Approximate Holdover Times Under OAT Type IV Fluid Various Weather Conditions
OAT Various Weather Conditions Concentration (hours:minutes)
(hours:minutes) °C °F Neat-Fluid/Water *FROST FREEZING SNOW ***FREEZING LIGHT FRZ RAIN ON COLD
°C °F *FROST FREEZING SNOW ***FREEZING LIGHT FRZ RAIN ON COLD (% by volume) FOG DRIZZLE RAIN SOAKED WING
FOG DRIZZLE RAIN SOAKED WING 100/0 18:00 2:20-3:00 0:45-1:25 0:40-1:00 0:35-0:55 0:10-0:50
above above 05:00 50-90 15-30 25-50 15-25 5-35 above above 75/25 6:00 1:05-2:00 0:20-0:40 0:30-1:00 0:15-0:30 0:05-0:35
0° 32° 0º 32º
50/50 4:00 0:20-0:45 0:05-0:20 0:10-0:20 0:05-0:10
0 32 04:00 50-90 15-25 25-50 15-25 100/0 12:00 2:20-3:00 0:35-1:00 0:40-1:00 0:35-0:55
to to
-3 27 0 32 75/25 5:00 1:05-2:00 0:20-0:35 0:30-1:00 0:15-0:30
below below to to
-3 27 04:00 50-90 10-20 **25-50 **15-25 -3 27 50/50 3:00 0:20-0:45 0:05-0:15 0:10-0:20 0:05-0:10
to to
-14 7 below below 100/0 12:00 0:40-3:00 0:20-0:40 **0:30-1:00 **0:30-0:45
below below SAE TYPE III fluid may be used below -14ºC (7ºF) provided the freezing point -3 27
of the fluid is at least 7ºC (13ºF) below the OAT and the aerodynamic to to 75/25 5:00 0:35-2:00 0:15-0:30 **0:30-1:00 **0:15-0:30
-14 7 acceptance criteria are met. Consider use of SAE Type I when -14 7
SAE Type III fluid cannot be used. below below
-14 7 100/0 12:00 0:20-2:00 0:15-0:30
* During conditions that apply to aircraft protection for ACTIVE FROST. to to
** The lowest use temperature is limited to -10ºC (14ºF). -25 -13
*** Use light freezing rain holdover times if positive identification of freezing drizzle is not possible. below below SAE TYPE IV fluid may be used below -25ºC (-13ºF) provided the freezing point
-25 -13 100/0 of the fluid is at least 7ºC (13ºF) below the OAT and the aerodynamic acceptance
Note: Union Carbide issued a warning which stated that diluted forms of Ultra+ are not recommended criteria are met. Consider use of SAE Type I when SAE Type IV fluid cannot be used.
for operational use due to performance deficiencies noted in qualifying tests.
* During conditions that apply to aircraft protection for ACTIVE FROST.
** The lowest use temperature is limited to -10ºC (14ºF).
*** Use light freezing rain holdover times if positive identification of freezing drizzle is not possible.
Used During Winter 1997-98
5 cm1380\report\hot_subs\SAE3-4At: SAE
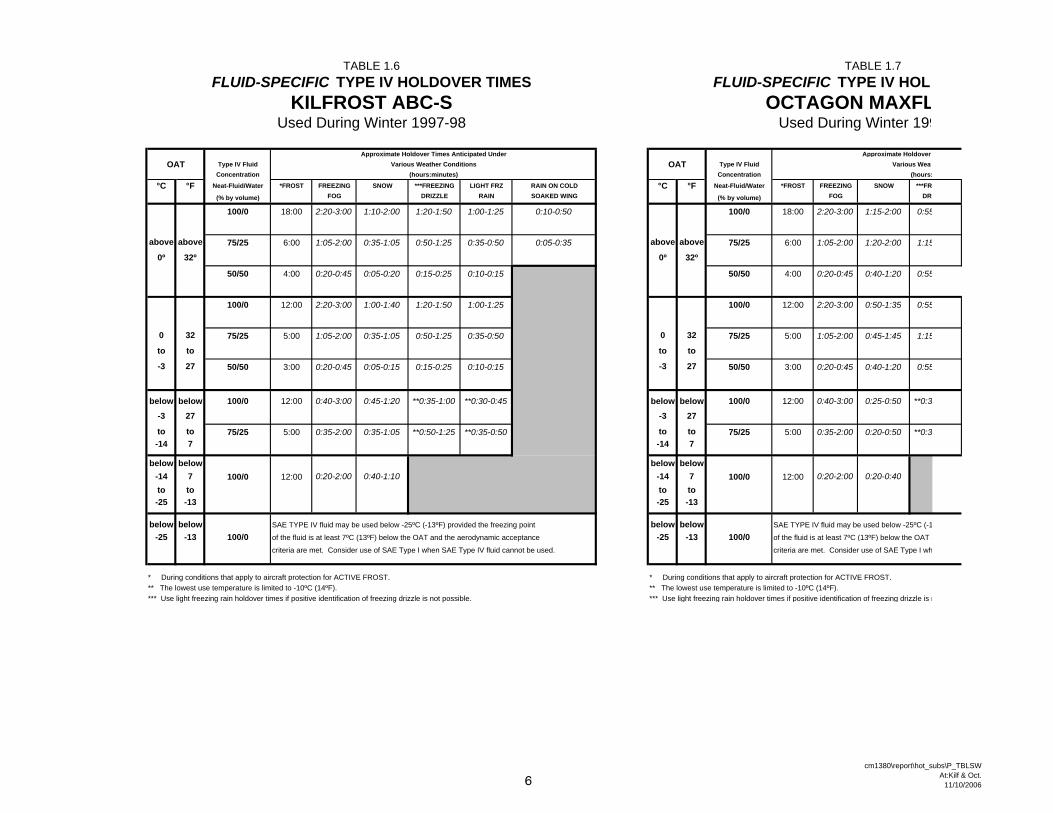
TABLE 1.6 TABLE 1.7FLUID-SPECIFIC TYPE IV HOLDOVER TIMES FLUID-SPECIFIC TYPE IV HOLD
KILFROST ABC-S OCTAGON MAXFLUsed During Winter 1997-98 Used During Winter 199
Approximate Holdover Times Anticipated Under Approximate Holdover OAT Type IV Fluid Various Weather Conditions OAT Type IV Fluid Various Weat
Concentration (hours:minutes) Concentration (hours:
°C °F Neat-Fluid/Water *FROST FREEZING SNOW ***FREEZING LIGHT FRZ RAIN ON COLD °C °F Neat-Fluid/Water *FROST FREEZING SNOW ***FR
(% by volume) FOG DRIZZLE RAIN SOAKED WING (% by volume) FOG DRI
100/0 18:00 2:20-3:00 1:10-2:00 1:20-1:50 1:00-1:25 0:10-0:50 100/0 18:00 2:20-3:00 1:15-2:00 0:55
above above 75/25 6:00 1:05-2:00 0:35-1:05 0:50-1:25 0:35-0:50 0:05-0:35 above above 75/25 6:00 1:05-2:00 1:20-2:00 1:15
0º 32º 0º 32º
50/50 4:00 0:20-0:45 0:05-0:20 0:15-0:25 0:10-0:15 50/50 4:00 0:20-0:45 0:40-1:20 0:55
100/0 12:00 2:20-3:00 1:00-1:40 1:20-1:50 1:00-1:25 100/0 12:00 2:20-3:00 0:50-1:35 0:55
0 32 75/25 5:00 1:05-2:00 0:35-1:05 0:50-1:25 0:35-0:50 0 32 75/25 5:00 1:05-2:00 0:45-1:45 1:15
to to to to
-3 27 50/50 3:00 0:20-0:45 0:05-0:15 0:15-0:25 0:10-0:15 -3 27 50/50 3:00 0:20-0:45 0:40-1:20 0:55
below below 100/0 12:00 0:40-3:00 0:45-1:20 **0:35-1:00 **0:30-0:45 below below 100/0 12:00 0:40-3:00 0:25-0:50 **0:3
-3 27 -3 27
to to 75/25 5:00 0:35-2:00 0:35-1:05 **0:50-1:25 **0:35-0:50 to to 75/25 5:00 0:35-2:00 0:20-0:50 **0:3-14 7 -14 7
below below below below-14 7 100/0 12:00 0:20-2:00 0:40-1:10 -14 7 100/0 12:00 0:20-2:00 0:20-0:40to to to to-25 -13 -25 -13
below below SAE TYPE IV fluid may be used below -25ºC (-13ºF) provided the freezing point below below SAE TYPE IV fluid may be used below -25ºC (-1
-25 -13 100/0 of the fluid is at least 7ºC (13ºF) below the OAT and the aerodynamic acceptance -25 -13 100/0 of the fluid is at least 7ºC (13ºF) below the OAT a
criteria are met. Consider use of SAE Type I when SAE Type IV fluid cannot be used. criteria are met. Consider use of SAE Type I wh
* During conditions that apply to aircraft protection for ACTIVE FROST. * During conditions that apply to aircraft protection for ACTIVE FROST.** The lowest use temperature is limited to -10ºC (14ºF). ** The lowest use temperature is limited to -10ºC (14ºF).*** Use light freezing rain holdover times if positive identification of freezing drizzle is not possible. *** Use light freezing rain holdover times if positive identification of freezing drizzle is n
6cm1380\report\hot_subs\P_TBLSW
At:Kilf & Oct.11/10/2006
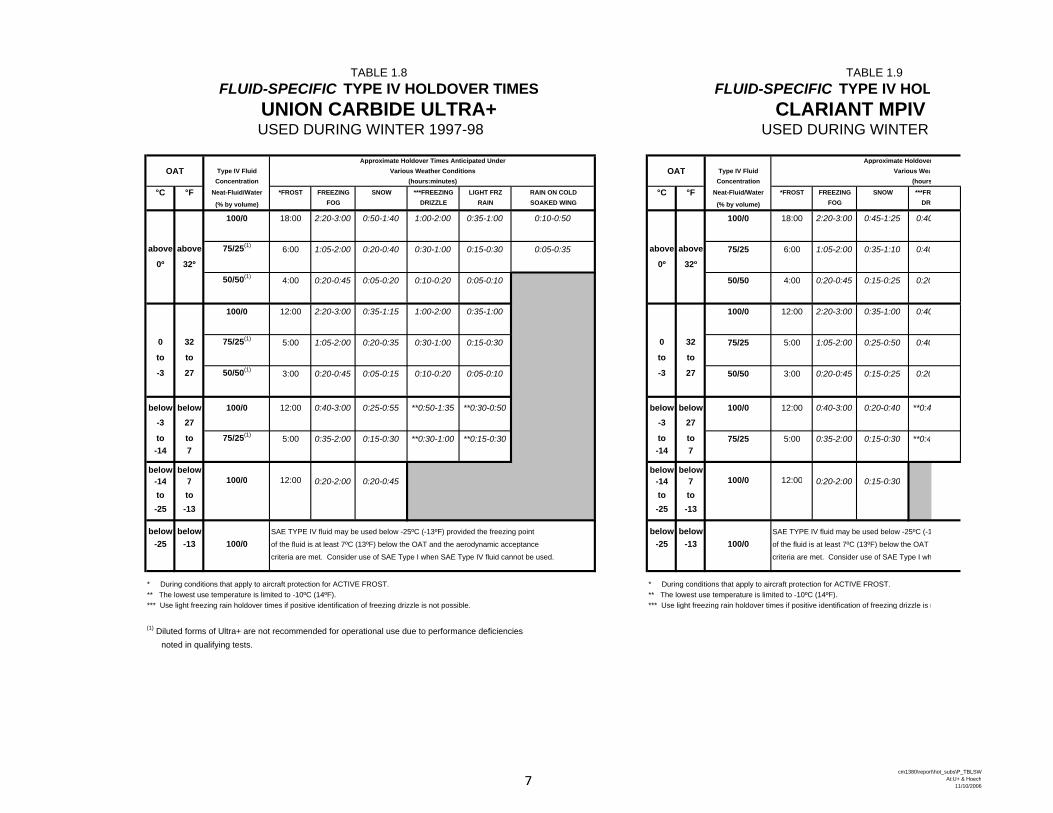
TABLE 1.8 TABLE 1.9FLUID-SPECIFIC TYPE IV HOLDOVER TIMES FLUID-SPECIFIC TYPE IV HOL
UNION CARBIDE ULTRA+ CLARIANT MPIV USED DURING WINTER 1997-98 USED DURING WINTER
Approximate Holdover Times Anticipated Under Approximate HoldoverOAT Type IV Fluid Various Weather Conditions OAT Type IV Fluid Various Wea
Concentration (hours:minutes) Concentration (hours
°C °F Neat-Fluid/Water *FROST FREEZING SNOW ***FREEZING LIGHT FRZ RAIN ON COLD °C °F Neat-Fluid/Water *FROST FREEZING SNOW ***FR
(% by volume) FOG DRIZZLE RAIN SOAKED WING (% by volume) FOG DRI
100/0 18:00 2:20-3:00 0:50-1:40 1:00-2:00 0:35-1:00 0:10-0:50 100/0 18:00 2:20-3:00 0:45-1:25 0:40
above above 75/25(1) 6:00 1:05-2:00 0:20-0:40 0:30-1:00 0:15-0:30 0:05-0:35 above above 75/25 6:00 1:05-2:00 0:35-1:10 0:40
0º 32º 0º 32º
50/50(1) 4:00 0:20-0:45 0:05-0:20 0:10-0:20 0:05-0:10 50/50 4:00 0:20-0:45 0:15-0:25 0:20
100/0 12:00 2:20-3:00 0:35-1:15 1:00-2:00 0:35-1:00 100/0 12:00 2:20-3:00 0:35-1:00 0:40
0 32 75/25(1) 5:00 1:05-2:00 0:20-0:35 0:30-1:00 0:15-0:30 0 32 75/25 5:00 1:05-2:00 0:25-0:50 0:40
to to to to
-3 27 50/50(1) 3:00 0:20-0:45 0:05-0:15 0:10-0:20 0:05-0:10 -3 27 50/50 3:00 0:20-0:45 0:15-0:25 0:20
below below 100/0 12:00 0:40-3:00 0:25-0:55 **0:50-1:35 **0:30-0:50 below below 100/0 12:00 0:40-3:00 0:20-0:40 **0:4
-3 27 -3 27
to to 75/25(1) 5:00 0:35-2:00 0:15-0:30 **0:30-1:00 **0:15-0:30 to to 75/25 5:00 0:35-2:00 0:15-0:30 **0:4-14 7 -14 7
below below below below-14 7 100/0 12:00 0:20-2:00 0:20-0:45 -14 7 100/0 12:00 0:20-2:00 0:15-0:30to to to to-25 -13 -25 -13
below below SAE TYPE IV fluid may be used below -25ºC (-13ºF) provided the freezing point below below SAE TYPE IV fluid may be used below -25ºC (-1
-25 -13 100/0 of the fluid is at least 7ºC (13ºF) below the OAT and the aerodynamic acceptance -25 -13 100/0 of the fluid is at least 7ºC (13ºF) below the OAT a
criteria are met. Consider use of SAE Type I when SAE Type IV fluid cannot be used. criteria are met. Consider use of SAE Type I wh
* During conditions that apply to aircraft protection for ACTIVE FROST. * During conditions that apply to aircraft protection for ACTIVE FROST.** The lowest use temperature is limited to -10ºC (14ºF). ** The lowest use temperature is limited to -10ºC (14ºF).*** Use light freezing rain holdover times if positive identification of freezing drizzle is not possible. *** Use light freezing rain holdover times if positive identification of freezing drizzle is n
(1) Diluted forms of Ultra+ are not recommended for operational use due to performance deficiencies noted in qualifying tests.
7cm1380\report\hot_subs\P_TBLSW
At:U+ & Hoech11/10/2006
1. INTRODUCTION
X:\@APS ARCHIVE\CM1380 (TDC Deicing 1997-98)\REPORT\HOT_SUB\Final Version 1.0\Final Version 1.0.DOC Final Version 1.0, October 06 8
tables based largely on this work were proposed by the Subcommittee and accepted by the full SAE G-12 Committee. Their use is to be implemented worldwide during the 1998-99 winter season. The tables are presented in Subsection 5.6. 1.2 Objectives The detailed objectives of the holdover time test program for the 1997-98 winter season are provided in the work statement (Appendix A). The primary objectives of the test program are summarized below: • Conduct flat plate tests under conditions of natural and simulated
precipitation to record the holdover times and to develop individual holdover time tables based on samples of new and previously qualified Type IV fluids supplied by the fluid manufacturers; and
• Conduct flat plate tests to validate fluid-specific and SAE tables that
currently lack sufficient supporting data.
1.3 Report Format
The following list provides short descriptions of the remaining sections of the report: • Section 2 describes the test conditions and methodologies used as well
as equipment and personnel requirements necessary to carry out testing;
• Section 3 describes the different conditions under which data were collected;
• Section 4 presents the results of fluid thickness tests conducted in periods of no precipitation and the results of these tests;
• Section 5 contains discussions of the data and results of holdover time testing. It also includes the most recently proposed holdover time tables and fluid-specific tables for use during the 1998-99 winter season;
• Section 6 presents information relating to supplementary tests performed during the winter 1997-98 test season along with results;
• Section 7 presents conclusions derived from the complete test program; and
• Section 8 lists recommendations for future testing.
2. METHODOLOGY 2.1 Definition of Weather Conditions
X:\@APS ARCHIVE\CM1380 (TDC Deicing 1997-98)\REPORT\HOT_SUB\Final Version 1.0\Final Version 1.0.DOC Final Version 1.0, October 06 9
2. METHODOLOGY
This chapter contains a description of the tests, equipment, and procedures used during the 1997-98 test season. It is divided into sections dealing with the definition of weather, test sites, test conditions, equipment, procedures, data forms, fluids, personnel, and analysis methodology.
2.1 Definition of Weather Conditions Holdover times (see Tables 1.2 to 1.9) are provided as a function of weather condition, fluid mixture, and outside air temperature. The objective of the winter test program was to substantiate these holdover times or develop new ones based on the most recent test data. Table 2.1 provides the definitions of most weather conditions experienced in winter operations, including the criteria used to determine precipitation intensity (light, moderate, heavy). This table was compiled by the National Center for Atmospheric Research (NCAR) from the Guide to Meteorological Instruments and Methods of Observation (2), the Glossary of Meteorology (3), and from WSOH # 7 Manual of Surface Weather Observations (4). Table 2.1 includes definitions for the weather conditions described in the holdover time tables illustrated in Section 1 (frost, freezing fog, snow, freezing drizzle, light freezing rain, and rain). Definitions for snow pellets, snow grains, hail, and ice pellets are also presented.
Test methodology to determine fluid failure times has included generally accepted upper and lower limits for precipitation rates for each type of precipitation. These limits were discussed in detail at a 1997 meeting of the SAE G-12 Holdover Time Subcommittee where standard definitions of upper and lower rate limits were approved. Those limits are documented and discussed in Subsection 2.9.
2.1.1 Snow
Table 2.1 contains the criteria historically used to estimate the intensity of snow. These criteria are based on horizontal visibility. Three intensity levels are defined as follows:
• Light Visibility is ≥ 1.0 km • Moderate Visibility is 0.5 km to<1.0 km • Heavy Visibility is < 0.5 km
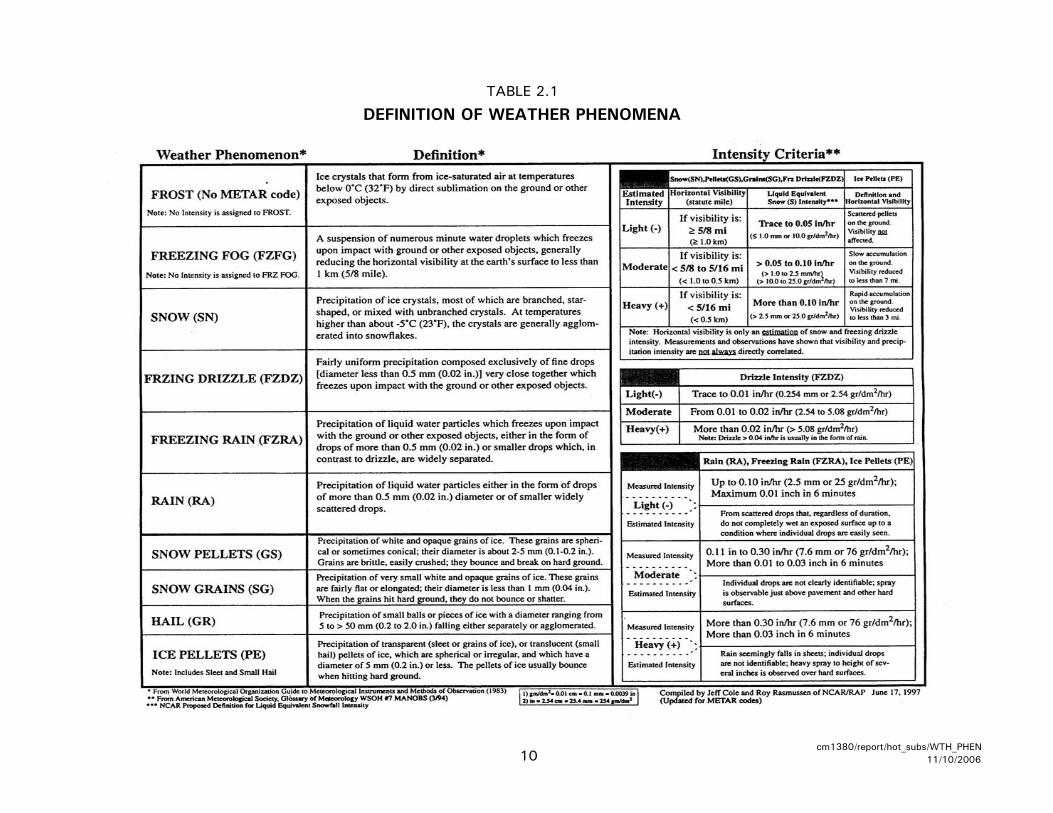
TABLE 2.1
DEFINITION OF WEATHER PHENOMENA
10cm1380/report/hot_subs/WTH_PHEN
11/10/2006
2. METHODOLOGY 2.1 Definition of Weather Conditions
X:\@APS ARCHIVE\CM1380 (TDC Deicing 1997-98)\REPORT\HOT_SUB\Final Version 1.0\Final Version 1.0.DOC Final Version 1.0, October 06 11
The reader is directed to the cautionary note that appears in Table 2.1; it states that visibility is only an indicator of snow intensity, and the two parameters are not always correlated. Table 2.2 was devised by NCAR and Transport Canada. This table is based on NCAR field data and theoretical work on classes of snow. NCAR has classified the snow data by crystal arrangement and temperature and has correlated this information with visibility measurements. The table is a more detailed scheme than the one outlined in Table 2.1. It gives visibility in distance for three snowfall intensities both in daylight and in darkness (night). Table 2.2 is considered to be more accurate and has been adopted by Transport Canada.
2.1.2 Freezing Drizzle
Freezing drizzle is composed of closely spaced fine water droplets with a diameter less than 0.5 mm (see Table 2.1). The intensity of freezing drizzle is estimated, as for snow, through the measurement of horizontal visibility. The holdover time table has one column for freezing drizzle, but Table 2.1 shows three intensity levels (light, moderate, and heavy). For example, under moderate freezing drizzle, the rate of precipitation should range between 2.5 and 5.1 g/dm²/h. For heavy freezing drizzle, the definition indicates that the intensity is greater than 5 g/dm²/h. Discussions between United Airlines, NCAR, and NRC led to the upper limit value of 12.7 g/dm²/h for freezing drizzle. This value was also used as the lower limit for light freezing rain. 2.1.3 Freezing Rain This form of precipitation exists either in the form of drops with diameters greater than 0.5 mm, or smaller drops which, in contrast to drizzle, are widely separated. For each of the three intensities of freezing rain given in Table 2.1, a visual description is supplied to provide a subjective guideline for the purpose of estimating rain intensity. However, the following definitions apply when an instrument is available to measure the intensity of precipitation:
• Light Precipitation rate is ≤25 g/dm²/h • Moderate Precipitation rate is >25 g/dm²/h but ≤76 g/dm²/h • Heavy Precipitation rate is >76 g/dm²/h
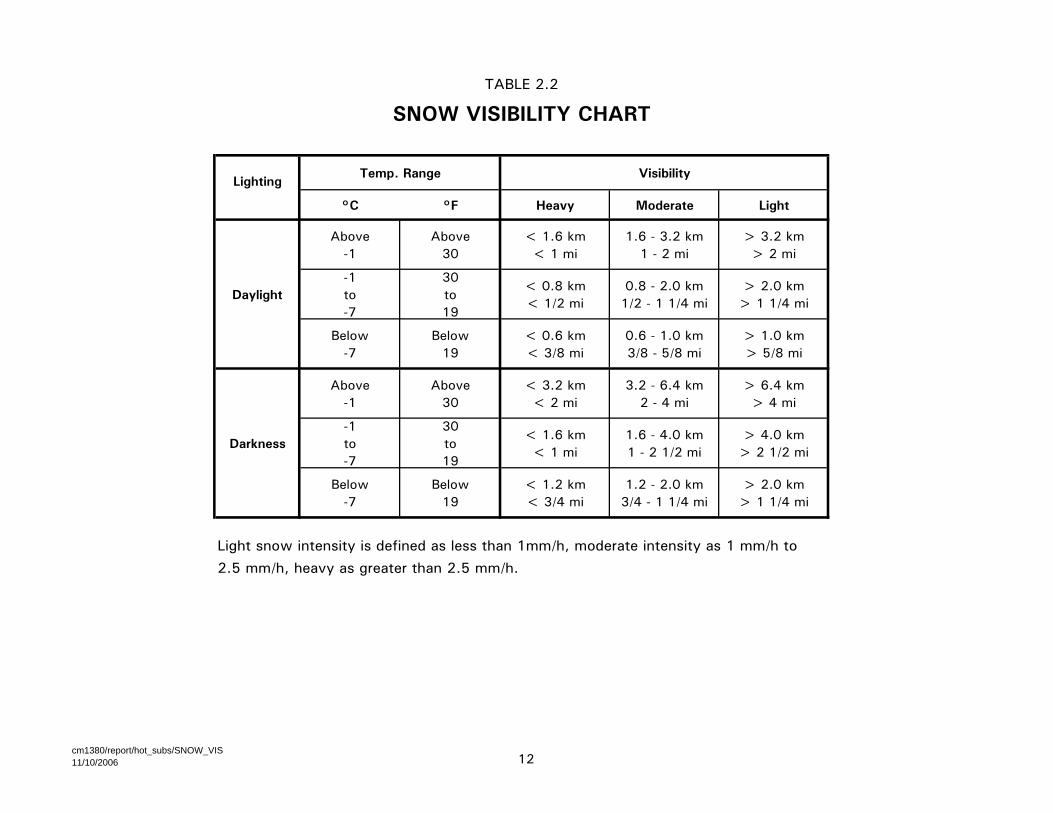
TABLE 2.2
SNOW VISIBILITY CHART
LightingTemp. Range Visibility
°C °F Heavy Moderate Light
Above-1
Above30
< 1.6 km< 1 mi
1.6 - 3.2 km1 - 2 mi
> 3.2 km> 2 mi
Daylight-1to-7
30to19
< 0.8 km< 1/2 mi
0.8 - 2.0 km1/2 - 1 1/4 mi
> 2.0 km> 1 1/4 mi
Below-7
Below19
< 0.6 km< 3/8 mi
0.6 - 1.0 km3/8 - 5/8 mi
> 1.0 km> 5/8 mi
Above-1
Above30
< 3.2 km< 2 mi
3.2 - 6.4 km2 - 4 mi
> 6.4 km> 4 mi
Darkness-1to-7
30to19
< 1.6 km< 1 mi
1.6 - 4.0 km1 - 2 1/2 mi
> 4.0 km> 2 1/2 mi
Below-7
Below19
< 1.2 km< 3/4 mi
1.2 - 2.0 km3/4 - 1 1/4 mi
> 2.0 km> 1 1/4 mi
Light snow intensity is defined as less than 1mm/h, moderate intensity as 1 mm/h to 2.5 mm/h, heavy as greater than 2.5 mm/h.
cm1380/report/hot_subs/SNOW_VIS11/10/2006 12
2. METHODOLOGY 2.1 Definition of Weather Conditions
X:\@APS ARCHIVE\CM1380 (TDC Deicing 1997-98)\REPORT\HOT_SUB\Final Version 1.0\Final Version 1.0.DOC Final Version 1.0, October 06 13
2.1.4 Freezing Fog
Freezing fog is defined as suspended minute water droplets which freeze upon impact with the ground or exposed objects. Table 2.1 does not provide any indication of intensity or liquid water content of the fog other than that the horizontal visibility is reduced to less than 1 km.
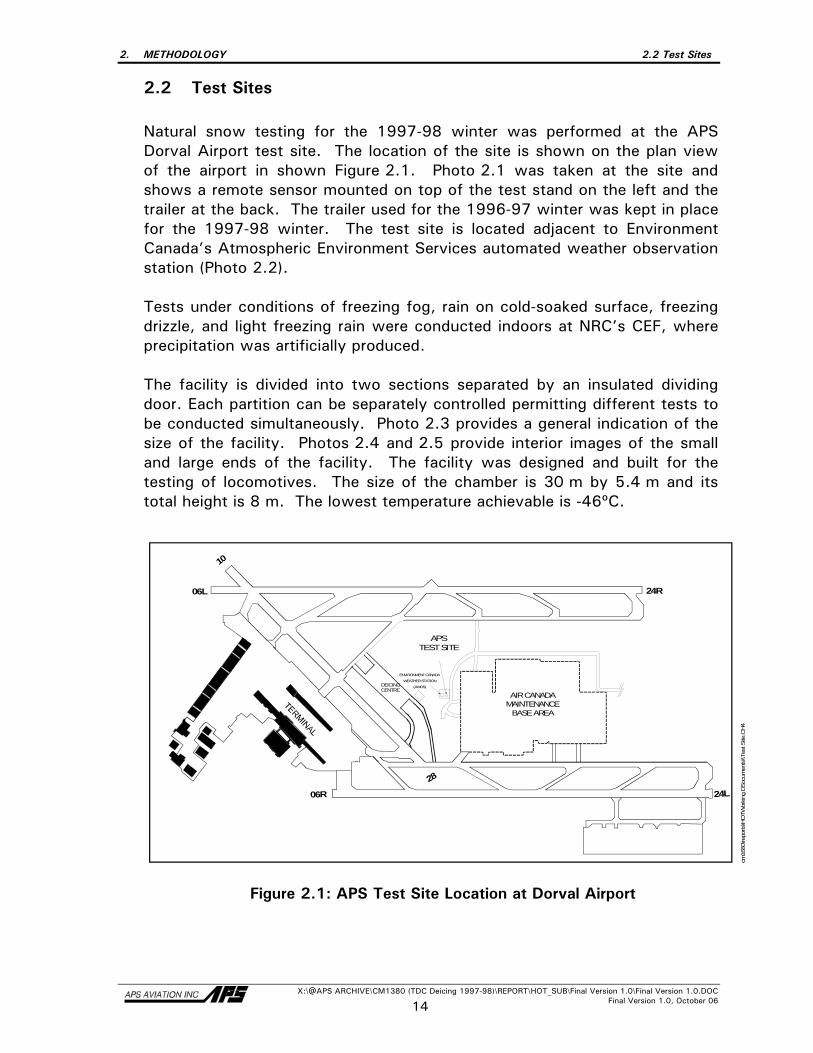
2. METHODOLOGY 2.2 Test Sites
X:\@APS ARCHIVE\CM1380 (TDC Deicing 1997-98)\REPORT\HOT_SUB\Final Version 1.0\Final Version 1.0.DOC Final Version 1.0, October 06 14
2.2 Test Sites Natural snow testing for the 1997-98 winter was performed at the APS Dorval Airport test site. The location of the site is shown on the plan view of the airport in shown Figure 2.1. Photo 2.1 was taken at the site and shows a remote sensor mounted on top of the test stand on the left and the trailer at the back. The trailer used for the 1996-97 winter was kept in place for the 1997-98 winter. The test site is located adjacent to Environment Canada’s Atmospheric Environment Services automated weather observation station (Photo 2.2).
Tests under conditions of freezing fog, rain on cold-soaked surface, freezing drizzle, and light freezing rain were conducted indoors at NRC’s CEF, where precipitation was artificially produced.
The facility is divided into two sections separated by an insulated dividing door. Each partition can be separately controlled permitting different tests to be conducted simultaneously. Photo 2.3 provides a general indication of the size of the facility. Photos 2.4 and 2.5 provide interior images of the small and large ends of the facility. The facility was designed and built for the testing of locomotives. The size of the chamber is 30 m by 5.4 m and its total height is 8 m. The lowest temperature achievable is -46ºC.
Figure 2.1: APS Test Site Location at Dorval Airport
cm16
80\re
ports
\HO
TWor
king
DSo
cum
ents
\\Tes
t Site
.CH
4
06L
10
28
06R
24R
24L
AIR CANADAMAINTENANCE
BASE AREA
APSTEST SITE
ENVIRONMENT CANADA
WEATHER STATION
(AWOS)DEICINGCENTRE
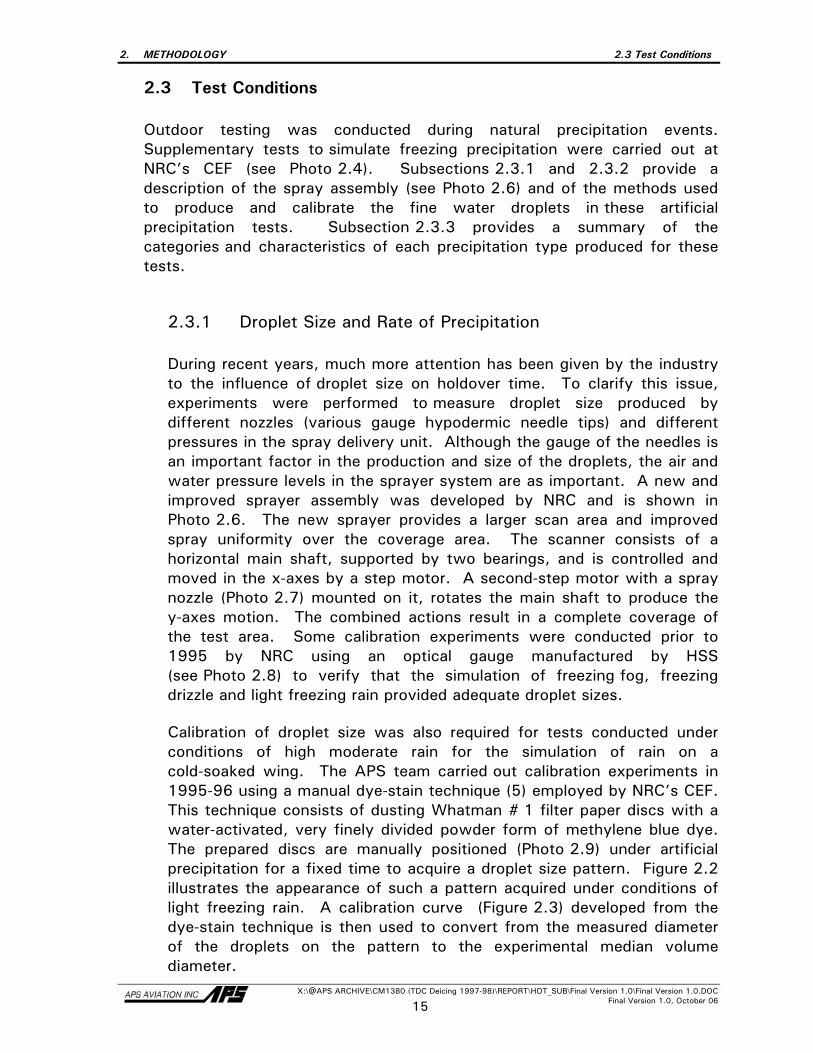
2. METHODOLOGY 2.3 Test Conditions
X:\@APS ARCHIVE\CM1380 (TDC Deicing 1997-98)\REPORT\HOT_SUB\Final Version 1.0\Final Version 1.0.DOC Final Version 1.0, October 06 15
2.3 Test Conditions
Outdoor testing was conducted during natural precipitation events. Supplementary tests to simulate freezing precipitation were carried out at NRC’s CEF (see Photo 2.4). Subsections 2.3.1 and 2.3.2 provide a description of the spray assembly (see Photo 2.6) and of the methods used to produce and calibrate the fine water droplets in these artificial precipitation tests. Subsection 2.3.3 provides a summary of the categories and characteristics of each precipitation type produced for these tests.
2.3.1 Droplet Size and Rate of Precipitation
During recent years, much more attention has been given by the industry to the influence of droplet size on holdover time. To clarify this issue, experiments were performed to measure droplet size produced by different nozzles (various gauge hypodermic needle tips) and different pressures in the spray delivery unit. Although the gauge of the needles is an important factor in the production and size of the droplets, the air and water pressure levels in the sprayer system are as important. A new and improved sprayer assembly was developed by NRC and is shown in Photo 2.6. The new sprayer provides a larger scan area and improved spray uniformity over the coverage area. The scanner consists of a horizontal main shaft, supported by two bearings, and is controlled and moved in the x-axes by a step motor. A second-step motor with a spray nozzle (Photo 2.7) mounted on it, rotates the main shaft to produce the y-axes motion. The combined actions result in a complete coverage of the test area. Some calibration experiments were conducted prior to 1995 by NRC using an optical gauge manufactured by HSS (see Photo 2.8) to verify that the simulation of freezing fog, freezing drizzle and light freezing rain provided adequate droplet sizes. Calibration of droplet size was also required for tests conducted under conditions of high moderate rain for the simulation of rain on a cold-soaked wing. The APS team carried out calibration experiments in 1995-96 using a manual dye-stain technique (5) employed by NRC’s CEF. This technique consists of dusting Whatman # 1 filter paper discs with a water-activated, very finely divided powder form of methylene blue dye. The prepared discs are manually positioned (Photo 2.9) under artificial precipitation for a fixed time to acquire a droplet size pattern. Figure 2.2 illustrates the appearance of such a pattern acquired under conditions of light freezing rain. A calibration curve (Figure 2.3) developed from the dye-stain technique is then used to convert from the measured diameter of the droplets on the pattern to the experimental median volume diameter.
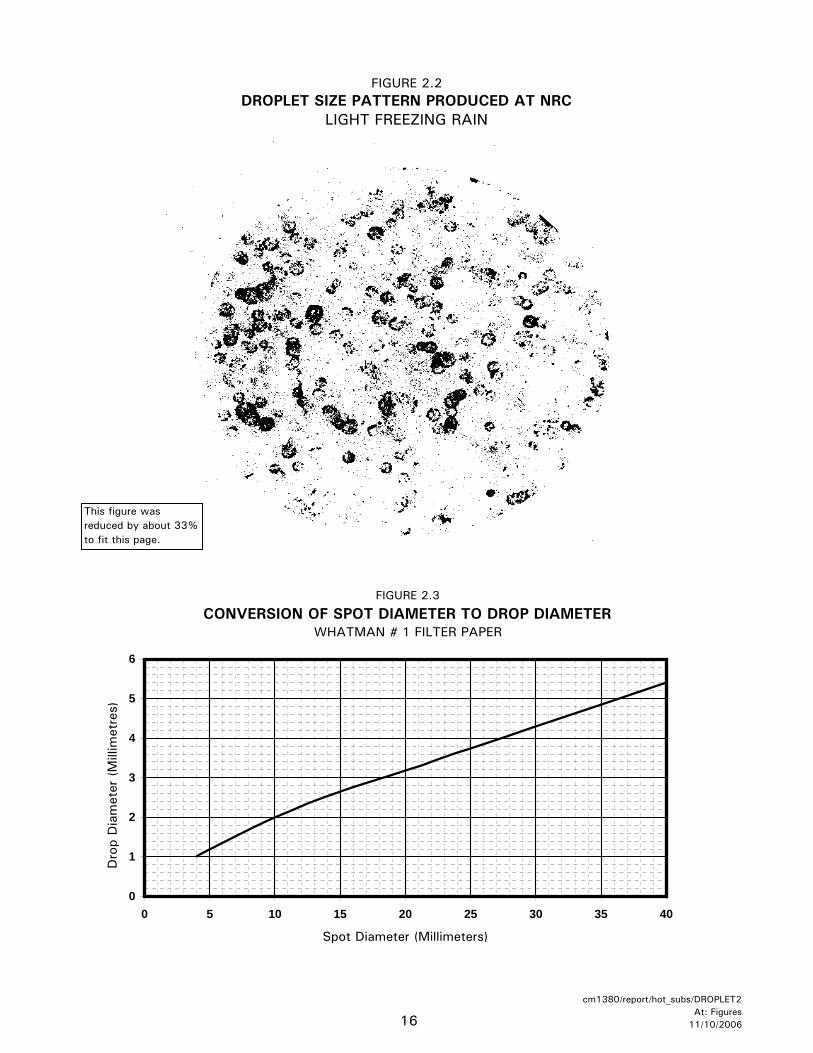
FIGURE 2.2DROPLET SIZE PATTERN PRODUCED AT NRC
LIGHT FREEZING RAIN
FIGURE 2.3
CONVERSION OF SPOT DIAMETER TO DROP DIAMETERWHATMAN # 1 FILTER PAPER
0
1
2
3
4
5
6
0 5 10 15 20 25 30 35 40
Spot Diameter (Millimeters)
Dro
p D
iam
eter
(M
illim
etre
s)
This figure was reduced by about 33% to fit this page.
16
cm1380/report/hot_subs/DROPLET2At: Figures
11/10/2006
2. METHODOLOGY 2.3 Test Conditions
X:\@APS ARCHIVE\CM1380 (TDC Deicing 1997-98)\REPORT\HOT_SUB\Final Version 1.0\Final Version 1.0.DOC Final Version 1.0, October 06 17
To determine whether droplets produced in the cold chamber resembled droplets from natural precipitation, a test was conducted during natural light freezing rain conditions. The droplet sizes were measured and compared to the droplet sizes of simulated light freezing rain tests conducted at NRC. The results of these tests are shown below:
For the outdoor test: Location: Dorval Airport Precipitation: Natural Light Freezing Rain Precipitation Rate: 20 g/dm²/h Calibrated MVD: 1.0 mm For the indoor test: Location: National Research Council Precipitation: Simulated Light Freezing Rain Precipitation Rate: 25 g/dm²/h Calibrated MVD: 1.0 mm The median volume diameter for both natural and simulated light freezing rain was 1 mm. 2.3.2 Median Volume Diameter of Raindrops The median volume diameter (MVD) of a rain droplet has been researched by NRC and found to be related to the precipitation rate as follows:
MVD = (rate/10) 0.23
where the MVD is in mm and the rate of precipitation is in g/dm²/h. At 25 g/dm²/h, this equation gives an MVD of 1.2 mm, and at 76 g/dm²/h the MVD is 1.6 mm. The theoretical median volume diameters for rain at various rates were determined based upon this equation. These values are listed below beside the experimental MVDs for each precipitation condition.
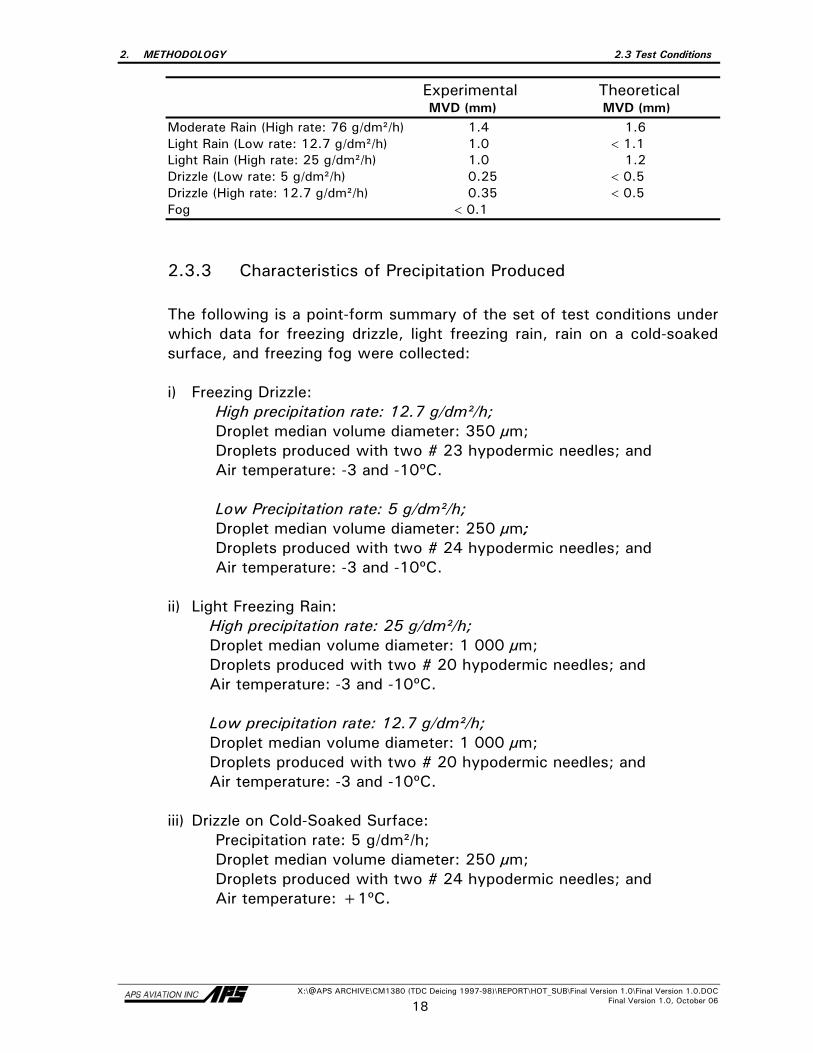
2. METHODOLOGY 2.3 Test Conditions
X:\@APS ARCHIVE\CM1380 (TDC Deicing 1997-98)\REPORT\HOT_SUB\Final Version 1.0\Final Version 1.0.DOC Final Version 1.0, October 06 18
Experimental Theoretical MVD (mm) MVD (mm) Moderate Rain (High rate: 76 g/dm²/h) 1.4 1.6 Light Rain (Low rate: 12.7 g/dm²/h) 1.0 < 1.1 Light Rain (High rate: 25 g/dm²/h) 1.0 1.2 Drizzle (Low rate: 5 g/dm²/h) 0.25 < 0.5 Drizzle (High rate: 12.7 g/dm²/h) 0.35 < 0.5 Fog < 0.1
2.3.3 Characteristics of Precipitation Produced
The following is a point-form summary of the set of test conditions under which data for freezing drizzle, light freezing rain, rain on a cold-soaked surface, and freezing fog were collected:
i) Freezing Drizzle:
High precipitation rate: 12.7 g/dm²/h; Droplet median volume diameter: 350 µm; Droplets produced with two # 23 hypodermic needles; and Air temperature: -3 and -10ºC. Low Precipitation rate: 5 g/dm²/h; Droplet median volume diameter: 250 µm; Droplets produced with two # 24 hypodermic needles; and Air temperature: -3 and -10ºC.
ii) Light Freezing Rain: High precipitation rate: 25 g/dm²/h; Droplet median volume diameter: 1 000 µm; Droplets produced with two # 20 hypodermic needles; and Air temperature: -3 and -10ºC. Low precipitation rate: 12.7 g/dm²/h; Droplet median volume diameter: 1 000 µm; Droplets produced with two # 20 hypodermic needles; and Air temperature: -3 and -10ºC.
iii) Drizzle on Cold-Soaked Surface: Precipitation rate: 5 g/dm²/h; Droplet median volume diameter: 250 µm; Droplets produced with two # 24 hypodermic needles; and Air temperature: +1ºC.
2. METHODOLOGY 2.3 Test Conditions
X:\@APS ARCHIVE\CM1380 (TDC Deicing 1997-98)\REPORT\HOT_SUB\Final Version 1.0\Final Version 1.0.DOC Final Version 1.0, October 06 19
iv) Moderate Rain on Cold-Soaked Surface: Precipitation rate: 76 g/dm²/h; Droplet median volume diameter: 1 400 µm; Droplets produced with two # 17 hypodermic needles; and Air temperature: +1ºC.
v) Freezing Fog: Precipitation rate: 2 and 5 g/dm²/h; Droplet median volume diameter: 30 µm; and Air temperature: -3°C, -14°C and -25ºC.
2. METHODOLOGY 2.4 Equipment
X:\@APS ARCHIVE\CM1380 (TDC Deicing 1997-98)\REPORT\HOT_SUB\Final Version 1.0\Final Version 1.0.DOC Final Version 1.0, October 06 20
2.4 Equipment Figure 2.4 shows a schematic of the stand used for testing. For natural snow tests, six test plates are normally mounted on the stand, inclined at a 10º slope. Each plate represents a flat plate test. Figure 2.4 also depicts the size and surface markings of a standard flat plate. Three parallel lines are positioned at 2.5 cm (1 in.), 15 cm (6 in.) and 30 cm (12 in.) from the top of the plate. The plates were marked with 15 cross hairs used in determining whether end conditions (see Subsection 2.5.2 for definition) were achieved. Photo 2.10, taken outdoors at Dorval, shows six test plates mounted on a stand; two plates (u and w) are equipped with AlliedSignal Contaminant/Fluid Integrity Monitoring System (C/FIMS) ice detection sensors mounted at the 15 cm line. For simulated freezing precipitation tests at NRC, 12 plates were mounted on the stand, marked 1 to 12, as shown in Figure 2.4. Figure 2.5 shows the collection (plate) pan which is of the same size as a standard plate and which is used for measuring amounts of precipitation for the outdoor tests. Photo 2.11 shows the collection pans used for measuring precipitation rates indoors at NRC. A new snow gauge, CR21X, was made available to measure precipitation in the 1996-97 winter season, but did not give accurate results since it was not shielded. This season, the instrument was shielded and provided improved gauge output resolution over instrumentation used in previous seasons. A detailed analysis of the results obtained from the CR21X snow gauge is presented in Transport Canada report TP 13314E (6). Sealed boxes (7.5 cm deep) were used for simulating a cold-soaked wing (see Figure 2.5). The top of the cold-soak box consists of an aluminum flat plate identical to the standard flat plate. A box shaped reservoir is welded to the bottom of the plate. The volume (depth) of the reservoir was selected based upon the analysis contained in the related Transport Canada report TP 12899E (7). The fluid cooling unit, devised and constructed by APS personnel, used liquid nitrogen as a refrigerant and is shown in Photo 2.12. The unit was required to cool the glycol used to fill the cold-soak boxes. A mixer was added to the unit to stir the glycol inside the cooling unit to prevent excessive temperature gradients inside the cooling unit. The freeze point of fluid sample collected from the plate was measured using a hand-held refractometer with a Brix-scale. Photo 2.13 shows the Misco refractometer.
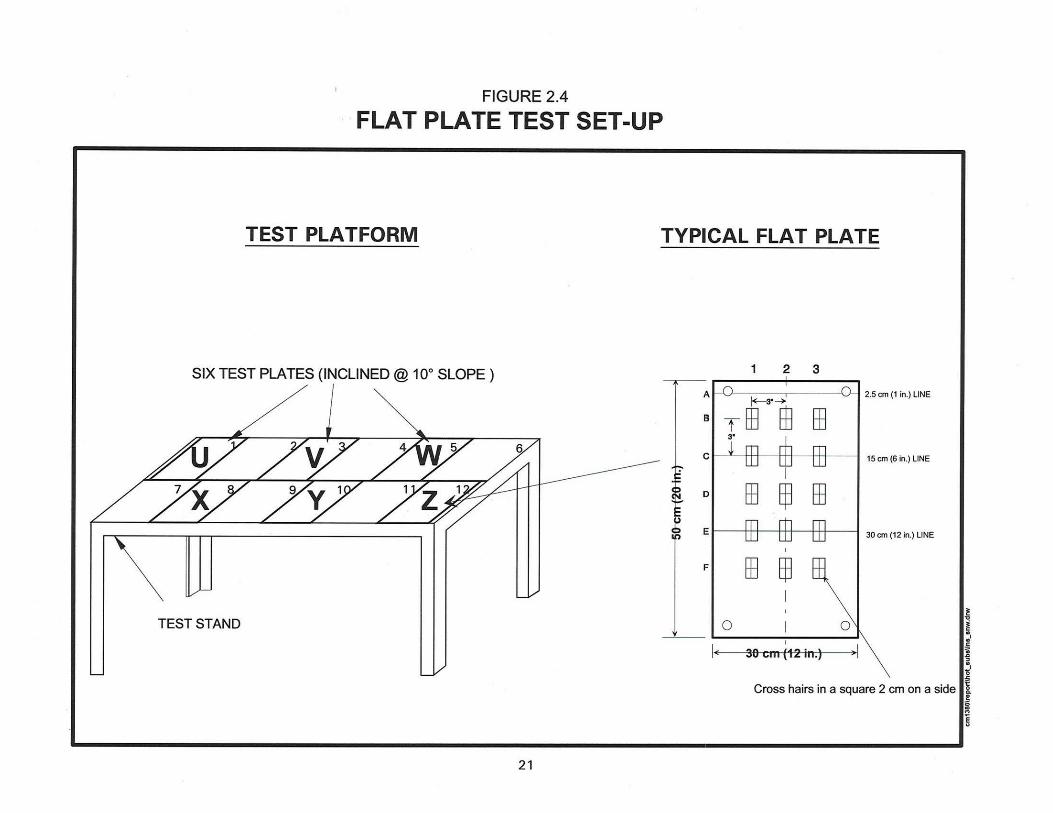
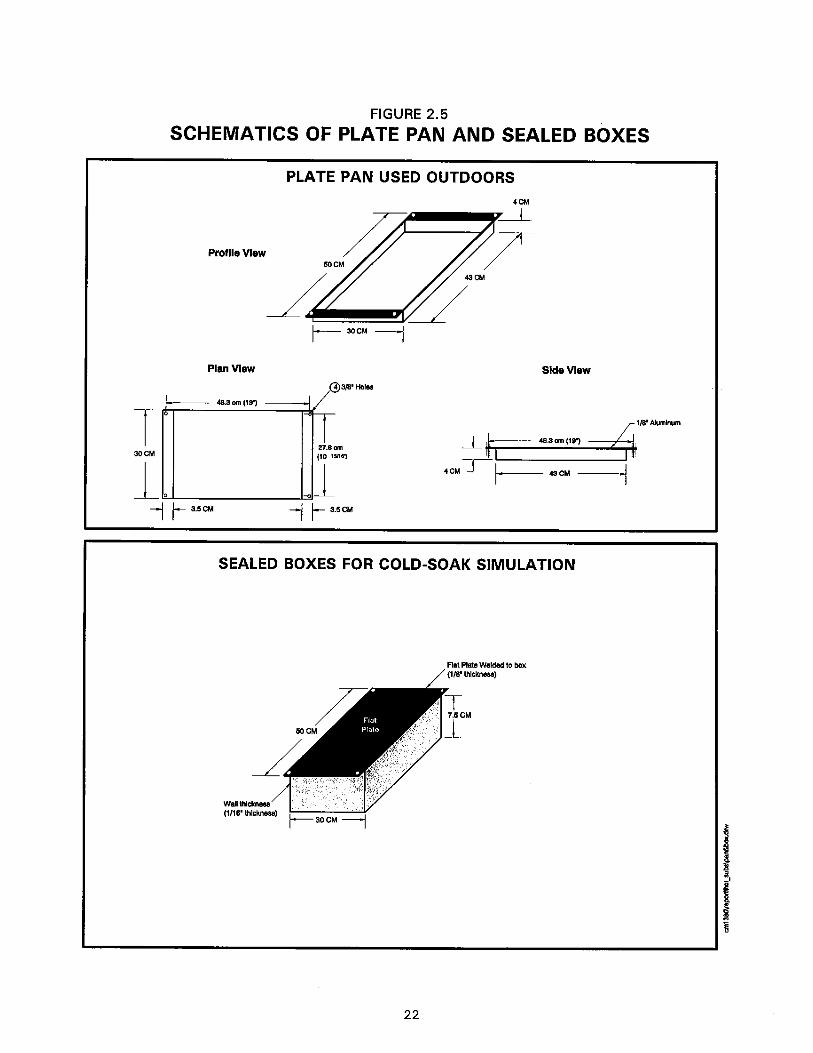
2. METHODOLOGY 2.4 Equipment
X:\@APS ARCHIVE\CM1380 (TDC Deicing 1997-98)\REPORT\HOT_SUB\Final Version 1.0\Final Version 1.0.DOC Final Version 1.0, October 06 23
Equipment to measure temperature, wind speed and wind direction was purchased several years ago (see Photo 2.1). Additional measurement of these parameters is provided by Environment Canada’s equipment seen in Photo 2.2.
Ice sensors used during natural snow outdoor tests, and at NRC’s CEF in the 1997-98 season, included: four C/FIMS from AlliedSignal, two optical area sensors by Robotic Vision System Inc. (RVSI) (the portable one is shown in Photo 2.14), and one optical sensor by Spar/Cox, shown in Photo 2.15. The Spar/Cox sensor was made available only at the end of the 1997-98 winter season, but was used for testing at NRC.
In addition to the data collected using the meteorological equipment at the APS Dorval site, data from Environment Canada’s automated weather observation equipment, located on a lot adjacent to the test site, were made available. The end of Appendix B shows a typical listing of the data provided by the Remote Environmental Automatic Data Acquisition Concept (READAC). This information was acquired from Atmospheric Environment Services magnetically on a minute-by-minute basis for the entire winter. The READAC equipment provides an indispensable means of monitoring meteorological conditions for test programs such as this. It consists of the following instruments:
i) Relative Humidity Gauge and Thermometer. ii) Anemometer and wind vane at a 10 m height.
iii) Precipitation Occurrence Sensing System (POSS): The POSS system
(instrument at rear of Photo 2.16) consists mainly of a Doppler radar set with a transmitter and a receiver as separate units (bi-static set-up).
The system is aimed at an area a few centimetres above it where it measures the rate of fall of hydrometers. The Doppler frequency shift of the returned signal provides the precipitation type, and the power spectrum of the returned signal provides a measure of the intensity (light, moderate or heavy) of precipitation. The output of the system consists of the start time, stop time, type, and intensity of precipitation.
iv) Precipitation Gauge: The READAC precipitation gauge (instrument at
right of Photo 2.16) is a modified Belfort weighing gauge. A bucket is attached to a spring balance and cable pulley arrangement connected to a rotating shaft. The degree of shaft rotation corresponds to the amount of accumulated precipitation in the bucket. The total amount of precipitation is the only value returned
2. METHODOLOGY 2.4 Equipment
X:\@APS ARCHIVE\CM1380 (TDC Deicing 1997-98)\REPORT\HOT_SUB\Final Version 1.0\Final Version 1.0.DOC Final Version 1.0, October 06 24
by the precipitation gauge arrangement. The gauge accuracy is subject to thermal expansion and contraction of the weighing mechanism. It is also affected by freezing precipitation that accumulates on the sides of the gauge and melts later on, which results in delayed and therefore erroneous output. The gauge output resolution is 0.5 mm (liquid water equivalent).
v) Belfort Forward Scattermeter: The Belfort Forward Scattermeter
(instrument at left of Photo 2.16) provides an estimate of visibility. The system consists of a Zenon bulb transmitter and a receiver both at an angle of 22ºC below the horizontal aimed at a 0.02 m³ sample volume of air 2.5 m above the ground. The transmitter illuminates the sample volume of air. The receiver measures the amount of light scattering off the aerosols present in the sample volume of air. The measurement is inversely proportional to visibility. The instrument output scale is in units of miles. The measurements output by the instrument at any time are the time averaged signal envelopes from the previous ten minutes of monitoring.
2. METHODOLOGY 2.5 Test Procedures
X:\@APS ARCHIVE\CM1380 (TDC Deicing 1997-98)\REPORT\HOT_SUB\Final Version 1.0\Final Version 1.0.DOC Final Version 1.0, October 06 25
2.5 Test Procedures
Tests consisted of pouring deicing or anti-icing fluids directly onto clean test panels (exposed to various winter precipitation conditions) and recording the elapsed time for each cross hair to fail until the test panels reached the defined end condition (see Subsection 2.5.2 below).
2.5.1 Test Protocol
For the tests at Dorval, a test stand contained six test plates, each plate representing a flat plate test. During each run with six plates, three different fluids were tested in duplicate. The procedure for the natural snow flat plate tests was developed by the SAE G-12 Holdover Time Subcommittee. The procedure was slightly updated according to the recommendations in Transport Canada report TP 13131E (1). The major changes this year were: i) The precipitation rate measurement frequency was increased from
once every 15 minutes to once every 10 minutes in normal conditions and once every 5 minutes in periods of high precipitation intensity;
ii) The start and end times of precipitation rate collected period were
recorded in hours, minutes, and seconds rather than just in hours and minutes; and
iii) A sample of fluid was collected subsequent to failure on each plate,
and the freeze point of the fluid was measured.
The major steps in the natural snow flat plate test procedure are:
i) Synchronize all timepieces; ii) Clean panels and start; iii) Apply (pour) fluids (on) to test panels. Type I fluids are at room
temperature (15ºC to 20ºC). Type II and Type IV fluid are at ambient temperature. Fluids are poured using a single-step fluid application;
iv) Record cross hair end condition times; v) Continue testing until at least five cross hairs or 1/3 of the plate have
failed; vi) Measure the refractive index of fluid over the fifth failed cross hair; vii) Record weather conditions; and viii) Clean panels and restart.
2. METHODOLOGY 2.5 Test Procedures
X:\@APS ARCHIVE\CM1380 (TDC Deicing 1997-98)\REPORT\HOT_SUB\Final Version 1.0\Final Version 1.0.DOC Final Version 1.0, October 06 26
The complete details of the actual test procedures are provided in Appendix B. Appendix C contains the procedure used for testing at NRC’s CEF for freezing drizzle, light freezing rain, freezing fog, and cold-soaked surface rain tests. For simulated freezing drizzle and light freezing rain conditions, two tests were conducted for each Type IV fluid, at the upper and lower precipitation rate limits, and at -3°C and -10°C. Additional tests were performed if the two tests conducted showed significant differences in holdover time. Rain on cold-soaked wing tests were conducted using cold-soak boxes at NRC’s CEF. The ambient temperature was set at +1ºC. The box reservoirs were filled with freezing point depressant fluid and cooled to below -10ºC using a custom-made cryostat that uses liquid nitrogen as the refrigerant. All box surfaces were insulated with 2.5 cm thick rigid Styrofoam sheeting. Top surface temperatures were recorded throughout the test using thermistors and/or hand-held temperature probes (see Photo 2.17).
2.5.2 End Condition Definitions
The procedure and the determination of the end condition evolved from the experiences of various test programs from previous winter seasons. Plate failure time is the time required for the end condition to be achieved. This occurs when the accumulating precipitation fails to be absorbed or ice forms at any five of the cross hair marks on the panels. A cross hair is considered failed: • If there is a visible accumulation of snow bridging on top of the fluid at
the cross hair when viewed from the front. There should be an indication that the fluid can no longer deice or absorb the precipitation at this point; or
• When precipitation or frosting produces a loss of gloss (i.e. dulling of
the surface reflectivity) at any cross hair, or when ice (or dry snow) has formed or accumulated on the cross hair (look for ice crystals). This condition is only applicable during light freezing rain, freezing drizzle, ice pellets, freezing fog, rain on a cold-soaked surface, or during mixtures of snow, light freezing rain, freezing drizzle, and ice pellets.
2. METHODOLOGY 2.6 Data Forms
X:\@APS ARCHIVE\CM1380 (TDC Deicing 1997-98)\REPORT\HOT_SUB\Final Version 1.0\Final Version 1.0.DOC Final Version 1.0, October 06 27
2.6 Data Forms Two data forms were used to manually record data at Dorval during the 1997-98 winter season. The form used to record fluid failure times for each cross hair on the plates is shown in Table 2.3. The second form (Table 2.4) is used to record data relating to meteorological conditions during tests. One half of the form is designated for plate pan precipitation rate measurements, and the rest of the page is reserved for documentation of meteorological conditions and any changes to them that may occur during tests. It has been observed that the placement (positioning) of collection pans on the stand is more critical for laboratory tests than for outdoor tests. In the laboratory, the rate of precipitation over a plate is reproducible from test to test, but is different from plate to plate. For outdoor tests, the opposite is true. The rate of precipitation is the same from plate to plate, but is not reproducible from test to test. Consequently a special procedure was developed to measure precipitation rates at NRC’s CEF, supported by a unique data form (Table 2.5).
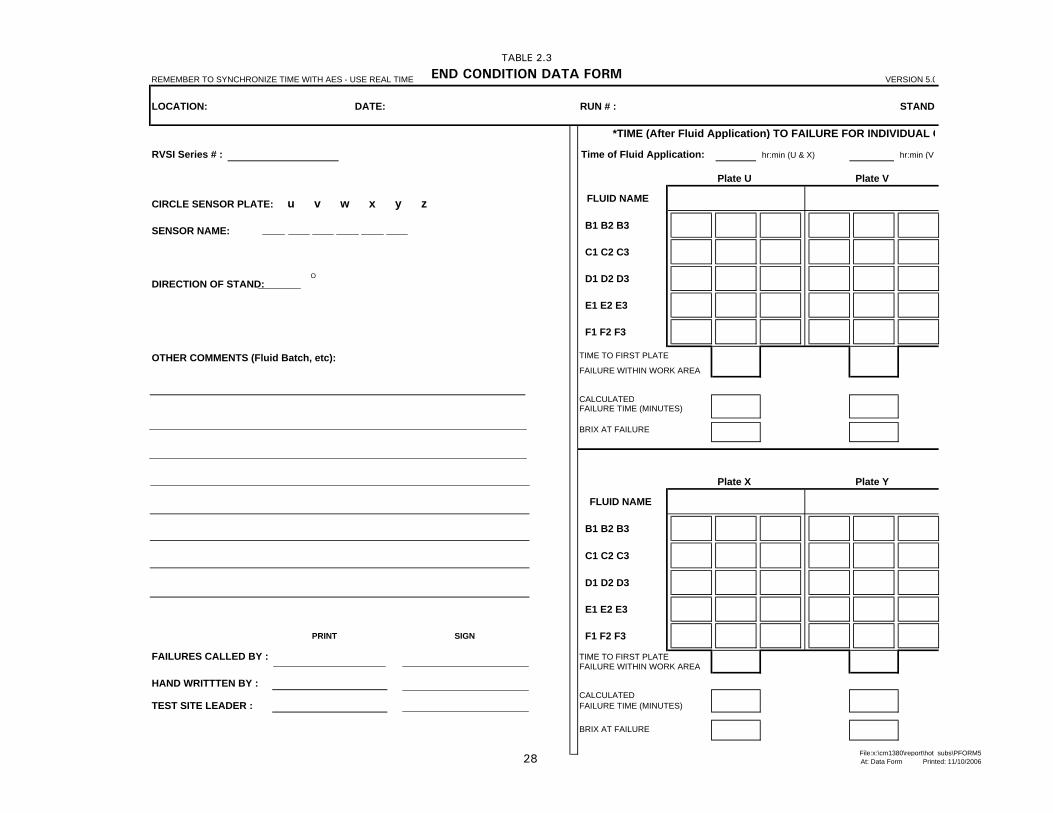
TABLE 2.3
END CONDITION DATA FORMREMEMBER TO SYNCHRONIZE TIME WITH AES - USE REAL TIME VERSION 5.0
LOCATION: DATE: RUN # : STAND
*TIME (After Fluid Application) TO FAILURE FOR INDIVIDUAL C
RVSI Series # : Time of Fluid Application: hr:min (U & X) hr:min (V
Plate U Plate V
CIRCLE SENSOR PLATE: u v w x y z FLUID NAME
SENSOR NAME: B1 B2 B3
C1 C2 C3
DIRECTION OF STAND: O D1 D2 D3
E1 E2 E3
F1 F2 F3
OTHER COMMENTS (Fluid Batch, etc): TIME TO FIRST PLATE
FAILURE WITHIN WORK AREA
CALCULATEDFAILURE TIME (MINUTES)
BRIX AT FAILURE
Plate X Plate Y
FLUID NAME
B1 B2 B3
C1 C2 C3
D1 D2 D3
E1 E2 E3
PRINT SIGN F1 F2 F3
FAILURES CALLED BY : TIME TO FIRST PLATEFAILURE WITHIN WORK AREA
HAND WRITTTEN BY :CALCULATED
TEST SITE LEADER : FAILURE TIME (MINUTES)
BRIX AT FAILURE
28 File:x:\cm1380\report\hot_subs\PFORM5 At: Data Form Printed: 11/10/2006
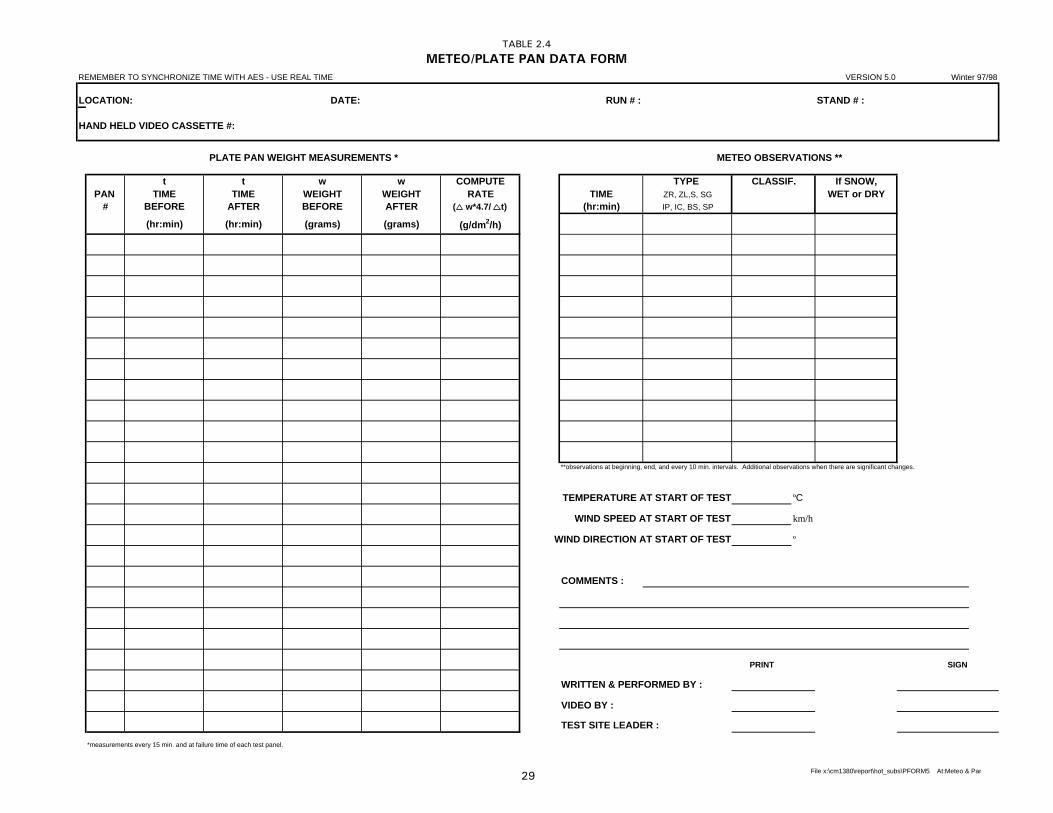
TABLE 2.4
METEO/PLATE PAN DATA FORMREMEMBER TO SYNCHRONIZE TIME WITH AES - USE REAL TIME VERSION 5.0 Winter 97/98
LOCATION: DATE: RUN # : STAND # :
HAND HELD VIDEO CASSETTE #:
PLATE PAN WEIGHT MEASUREMENTS * METEO OBSERVATIONS **
t t w w COMPUTE TYPE CLASSIF. If SNOW,PAN TIME TIME WEIGHT WEIGHT RATE TIME ZR, ZL,S, SG WET or DRY
# BEFORE AFTER BEFORE AFTER ( w*4.7/ t) (hr:min) IP, IC, BS, SP
(hr:min) (hr:min) (grams) (grams) (g/dm2/h)
**observations at beginning, end, and every 10 min. intervals. Additional observations when there are significant changes.
TEMPERATURE AT START OF TEST ºC
WIND SPEED AT START OF TEST km/h
WIND DIRECTION AT START OF TEST º
COMMENTS :
PRINT SIGN
WRITTEN & PERFORMED BY :
VIDEO BY :
TEST SITE LEADER :
*measurements every 15 min. and at failure time of each test panel.
29 File x:\cm1380\report\hot_subs\PFORM5 At:Meteo & Pan
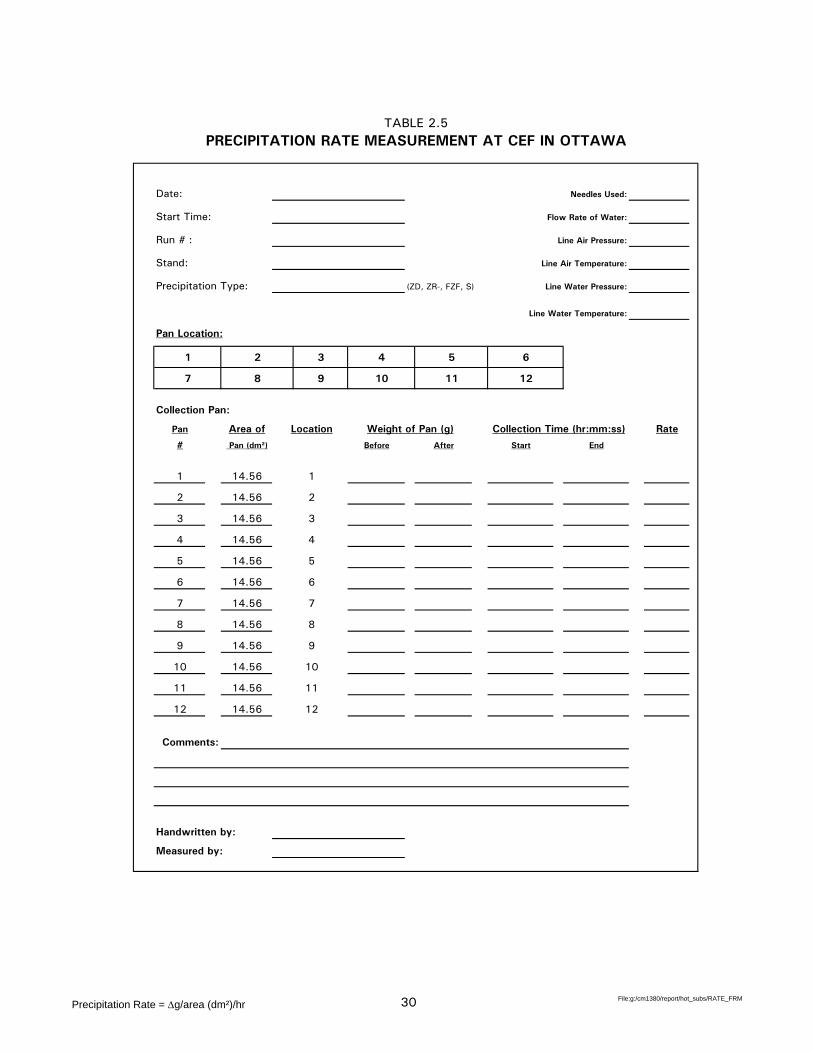
TABLE 2.5PRECIPITATION RATE MEASUREMENT AT CEF IN OTTAWA
Date: Needles Used:
Start Time: Flow Rate of Water:
Run # : Line Air Pressure:
Stand: Line Air Temperature:
Precipitation Type: (ZD, ZR-, FZF, S) Line Water Pressure:
Line Water Temperature:
Pan Location:
1 2 3 4 5 6
7 8 9 10 11 12
Collection Pan:
Pan Area of Location Weight of Pan (g) Collection Time (hr:mm:ss) Rate
# Pan (dm²) Before After Start End
1 14.56 1
2 14.56 2
3 14.56 3
4 14.56 4
5 14.56 5
6 14.56 6
7 14.56 7
8 14.56 8
9 14.56 9
10 14.56 10
11 14.56 11
12 14.56 12
Comments:
Handwritten by:
Measured by:
Precipitation Rate = Δg/area (dm²)/hr 30 File:g:/cm1380/report/hot_subs/RATE_FRM
2. METHODOLOGY 2.7 Fluids
X:\@APS ARCHIVE\CM1380 (TDC Deicing 1997-98)\REPORT\HOT_SUB\Final Version 1.0\Final Version 1.0.DOC Final Version 1.0, October 06 31
2.7 Fluids
2.7.1 General
During the 1997-98 test season, a few Type I fluid tests were conducted. Type I fluids are usually obtained from manufacturers in standard dilution forms. Each manufacturer sets its own concentration based on performance requirements and cost. For example, one manufacturer’s standard Type I fluid contains 57 percent glycol as delivered. These fluids are tested in their standard dilution forms and also in further diluted forms specific to particular test temperature requirements. The concentrations are adjusted by mixing with water and are verified by measurement of the resulting solution’s refractive index. The freezing point of a solution is concentration-dependent and is raised by decreasing the glycol concentration. If a given test is to be performed at 0ºC, the fluid concentration will be adjusted to freeze at -10ºC. This diluted solution is now said to either possess a 10ºC buffer or is buffered for 10ºC.
Type IV fluids contain a minimum of 50 percent glycol and are thickened by incorporating rheological additives to the fluid formulations. These additives cause fluids to assume a thicker film and to remain on the aircraft surfaces until the time of takeoff. The fluids are often delivered to air carriers in this form and are designated as neat (100%) fluids. Sometimes (mostly in Europe) neat Type IV fluids are mixed with water as follows:
• 75 percent of neat formulation and 25 percent water by volume. This
is designated Type IV 75/25; and • 50 percent neat formulation and 50 percent water by volume. This is
designated Type IV 50/50. Fluid freeze points were measured using a Misco Brix-scale refractometer. The fluid freeze point can be determined using conversion charts for Ethylene- and Propylene-based glycol as shown in Figures 2.6 and 2.7. These charts were plotted using Brix and freeze points provided by the fluid manufacturers. The Brix values for Type IV fluids tested are summarized in Table 2.6.
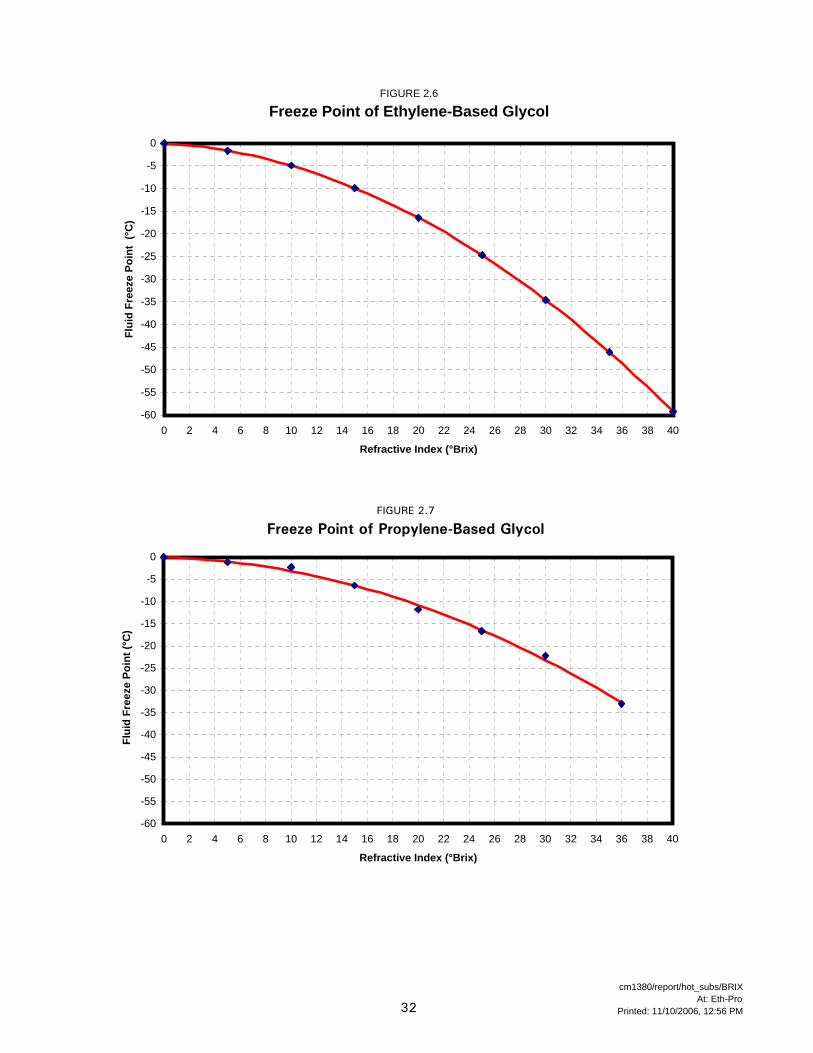
FIGURE 2.6
Freeze Point of Ethylene-Based Glycol
-60
-55
-50
-45
-40
-35
-30
-25
-20
-15
-10
-5
0
0 2 4 6 8 10 12 14 16 18 20 22 24 26 28 30 32 34 36 38 40
Refractive Index (°Brix)
Flui
d Fr
eeze
Poi
nt (
°C)
FIGURE 2.7
Freeze Point of Propylene-Based Glycol
-60
-55
-50
-45
-40
-35
-30
-25
-20
-15
-10
-5
0
0 2 4 6 8 10 12 14 16 18 20 22 24 26 28 30 32 34 36 38 40
Refractive Index (°Brix)
Flui
d Fr
eeze
Poi
nt (°
C)
32
cm1380/report/hot_subs/BRIXAt: Eth-Pro
Printed: 11/10/2006, 12:56 PM
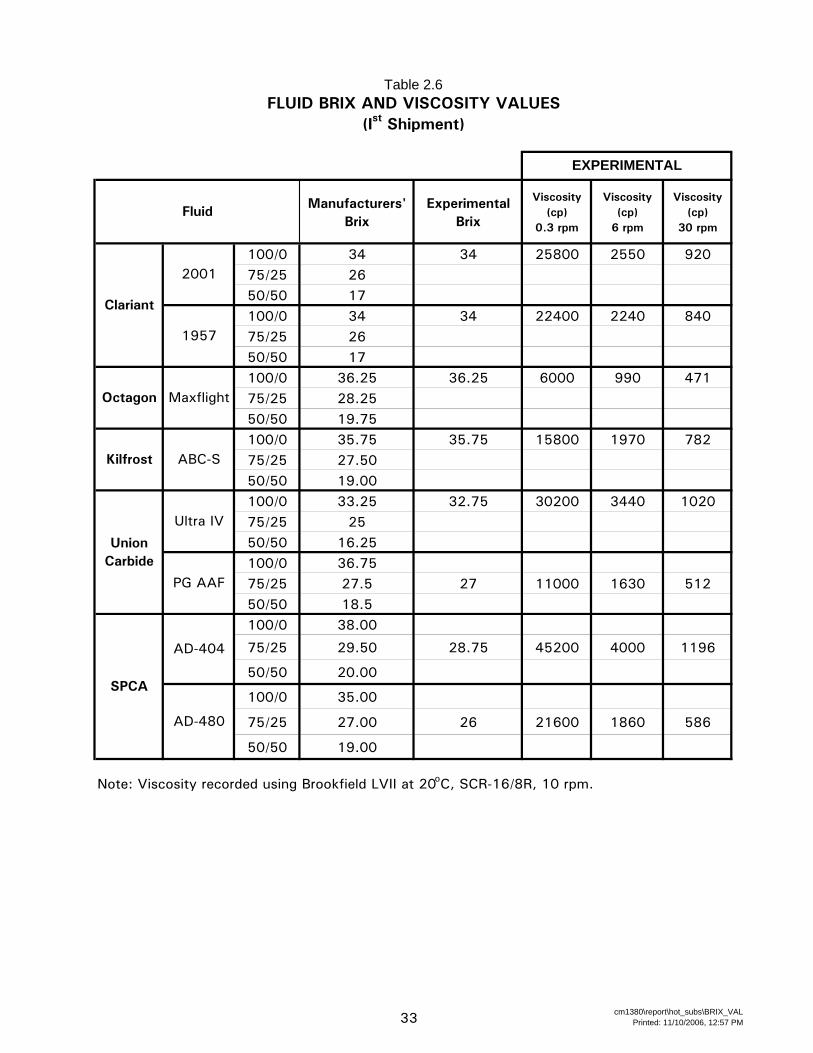
Manufacturers'Brix
ExperimentalBrix
Viscosity(cp)
0.3 rpm
Viscosity(cp)
6 rpm
Viscosity(cp)
30 rpm
100/0 34 34 25800 2550 92075/25 2650/50 17100/0 34 34 22400 2240 84075/25 2650/50 17100/0 36.25 36.25 6000 990 47175/25 28.2550/50 19.75100/0 35.75 35.75 15800 1970 78275/25 27.5050/50 19.00100/0 33.25 32.75 30200 3440 102075/25 2550/50 16.25100/0 36.7575/25 27.5 27 11000 1630 51250/50 18.5100/0 38.00
75/25 29.50 28.75 45200 4000 1196
50/50 20.00
100/0 35.00
75/25 27.00 26 21600 1860 586
50/50 19.00
Note: Viscosity recorded using Brookfield LVII at 20oC, SCR-16/8R, 10 rpm.
(Ist Shipment)
AD-404
AD-480
Ultra IV
PG AAF
Union Carbide
SPCA
EXPERIMENTAL
Table 2.6FLUID BRIX AND VISCOSITY VALUES
Maxflight
ABC-S
Octagon
Kilfrost
Fluid
Clariant
2001
1957
33 cm1380\report\hot_subs\BRIX_VALPrinted: 11/10/2006, 12:57 PM
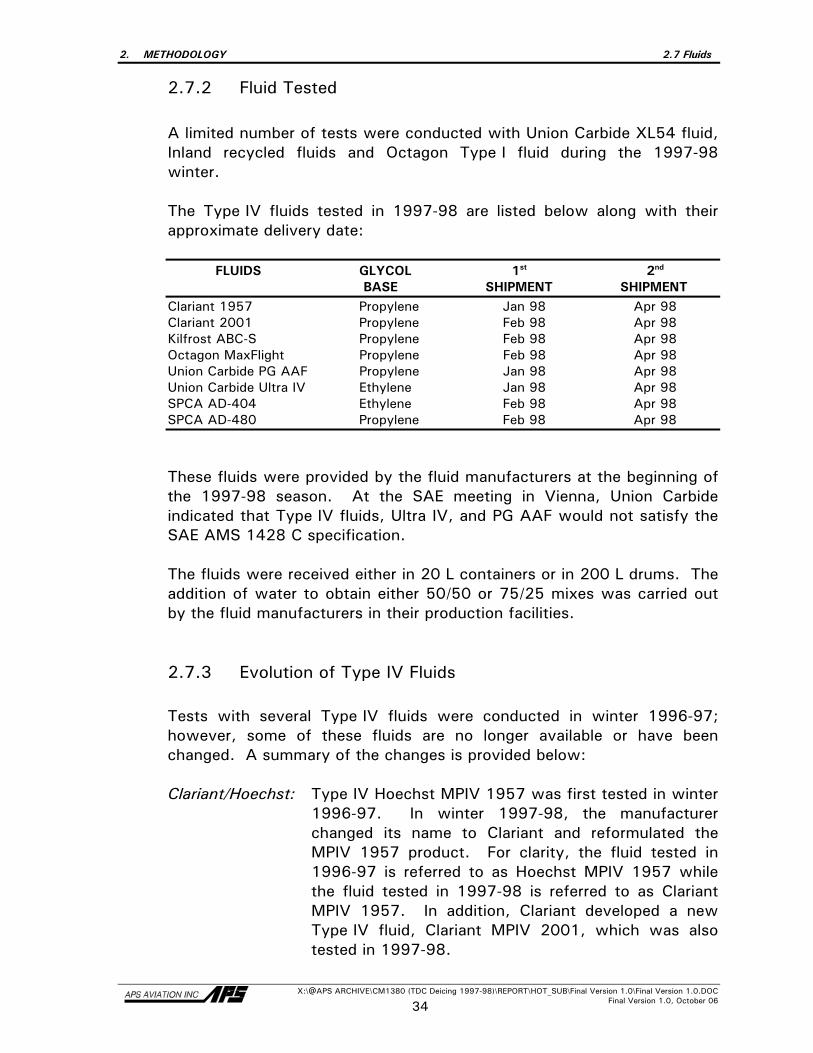
2. METHODOLOGY 2.7 Fluids
X:\@APS ARCHIVE\CM1380 (TDC Deicing 1997-98)\REPORT\HOT_SUB\Final Version 1.0\Final Version 1.0.DOC Final Version 1.0, October 06 34
2.7.2 Fluid Tested
A limited number of tests were conducted with Union Carbide XL54 fluid, Inland recycled fluids and Octagon Type I fluid during the 1997-98 winter. The Type IV fluids tested in 1997-98 are listed below along with their approximate delivery date:
FLUIDS GLYCOL 1st 2nd BASE SHIPMENT SHIPMENT Clariant 1957 Propylene Jan 98 Apr 98 Clariant 2001 Propylene Feb 98 Apr 98 Kilfrost ABC-S Propylene Feb 98 Apr 98 Octagon MaxFlight Propylene Feb 98 Apr 98 Union Carbide PG AAF Propylene Jan 98 Apr 98 Union Carbide Ultra IV Ethylene Jan 98 Apr 98 SPCA AD-404 Ethylene Feb 98 Apr 98 SPCA AD-480 Propylene Feb 98 Apr 98 These fluids were provided by the fluid manufacturers at the beginning of the 1997-98 season. At the SAE meeting in Vienna, Union Carbide indicated that Type IV fluids, Ultra IV, and PG AAF would not satisfy the SAE AMS 1428 C specification.
The fluids were received either in 20 L containers or in 200 L drums. The addition of water to obtain either 50/50 or 75/25 mixes was carried out by the fluid manufacturers in their production facilities.
2.7.3 Evolution of Type IV Fluids
Tests with several Type IV fluids were conducted in winter 1996-97; however, some of these fluids are no longer available or have been changed. A summary of the changes is provided below:
Clariant/Hoechst: Type IV Hoechst MPIV 1957 was first tested in winter
1996-97. In winter 1997-98, the manufacturer changed its name to Clariant and reformulated the MPIV 1957 product. For clarity, the fluid tested in 1996-97 is referred to as Hoechst MPIV 1957 while the fluid tested in 1997-98 is referred to as Clariant MPIV 1957. In addition, Clariant developed a new Type IV fluid, Clariant MPIV 2001, which was also tested in 1997-98.
2. METHODOLOGY 2.7 Fluids
X:\@APS ARCHIVE\CM1380 (TDC Deicing 1997-98)\REPORT\HOT_SUB\Final Version 1.0\Final Version 1.0.DOC Final Version 1.0, October 06 35
Union Carbide: UCAR Ultra+ was not approved in diluted forms.
Two new Union Carbide Type IV fluids, UCAR Ultra IV and UCAR PG AAF, were shipped and tested for the first time in January 1998. However, these new fluids did not satisfy SAE fluid specifications.
SPCA: SPCA AD-404 was first tested in winter 1995-96. A
new Type IV fluid SPCA AD-480, was shipped for the first time in 1998.
Type IV Octagon MaxFlight and Kilfrost ABC-S fluids were not reformulated.
Different viscosity samples of the same Type IV fluid brand were provided by some fluid manufacturers. This and the effect of viscosity on holdover time is discussed in detail in Subsection 5.1.
Fluid-specific holdover time tables were developed and are described in detail in Subsection 5.6.
2. METHODOLOGY 2.8 Personnel
X:\@APS ARCHIVE\CM1380 (TDC Deicing 1997-98)\REPORT\HOT_SUB\Final Version 1.0\Final Version 1.0.DOC Final Version 1.0, October 06 36
2.8 Personnel
The site at Dorval was staffed mainly by university students and supervised by APS staff. Depending on the rate and duration of precipitation, up to four test stands were in use at Dorval. To operate four test stands, nine testers with the following responsibilities (see Appendix B, Attachment III for details) were required.
Test Site Leader (1): Supervise and train site personnel, ensure site is
functional, and ensure that test procedures are adhered to. Video record fluid failure as required.
End Condition (4): Record end condition times for each cross hair.
Meteo (4): Record meteorological conditions during every test.
Prolonged precipitation events require backup personnel, so a fairly large number of students were trained to perform experiments. This personnel reservoir was also needed because the same individuals were not always available for tests due to other obligations. Due to the nature, scale, and schedule of the testing (both holdover time and full-scale), and the requirement to keep costs to a minimum, a pool of students was considered to be the best option for the manpower requirements of these tests. The utilization of personnel for the cold chamber tests was slightly different. To ensure that the cold chamber facility was used at all times, dedicated technicians were often assigned specific tasks. For example, fluids were prepared, mixed, cooled, and replenished after every test. During cold-soak testing, a technician ensured the cryostat was maintained in operational status and the cold-soak boxes were properly thermostatted. To ensure accurate precipitation rate measurements, the rate measurement procedure was automated and a technician was assigned the task of calculating and displaying printed summaries of the precipitation rates. A laptop computer and printer were dedicated for this process alone. To obtain consistent results from fluid failure calls, the same individual recorded the end conditions at the NRC freezing precipitation tests for the 1996-97 and 1997-98 test seasons. This individual, with pilot experience, was also available during all natural snow tests conducted at Dorval Airport and supervised most of the failure calls.
2. METHODOLOGY 2.9 Analysis Methodology
X:\@APS ARCHIVE\CM1380 (TDC Deicing 1997-98)\REPORT\HOT_SUB\Final Version 1.0\Final Version 1.0.DOC Final Version 1.0, October 06 37
2.9 Analysis Methodology
2.9.1 General
This section of the report describes the various categories of precipitation and the precipitation rate limits used during the course of holdover time testing, as well as the process of data analysis used in the evaluation of fluid holdover times.
2.9.2 Description of Data Ranges and Precipitation Definitions The test program developed to measure fluid failure times was carried out under four general categories of precipitation:
• Natural snow; • Freezing drizzle and light freezing rain; • Freezing fog; and • Rain on a cold-soaked surface.
Tests were conducted over temperature and precipitation rate ranges specific to each category of precipitation. A multi-variable regression procedure was used to evaluate fluid holdover times (first presented in Transport Canada report, TP 13131E (1)) and is based on the refinement of an equation for a curve that best represents the fluid failure time test data, and then the solution to that equation at the upper and lower limits of a defined precipitation range. To support this procedure, precipitation rate limits for each specific category of precipitation were defined, reviewed, and approved. The precipitation rate limits used for the evaluation of holdover times are represented schematically in Figure 2.8. Detailed definitions and explanations of the data types and ranges are described in Subsections 2.9.2.1 to 2.9.2.5. Meteorologically accepted definitions of these conditions are outlined in Table 2.1.
2.9.2.1 Natural snow
All fluid failure tests in snow were conducted in natural conditions at the APS Dorval Airport test site. Data were collected for precipitation rates ranging from less than 10 g/dm2/h to greater than 25 g/dm2/h; however, lower and upper holdover times for each cell in this column were determined at rates of 10 and 25 g/dm2/h, respectively.
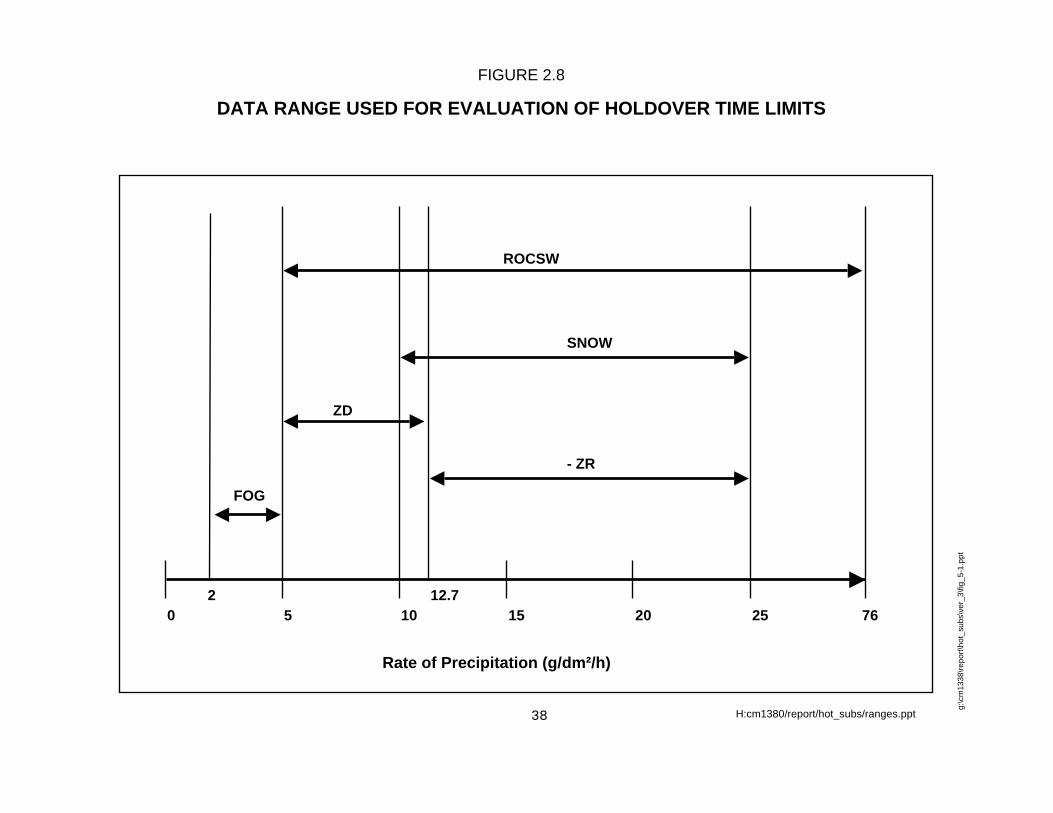
g:\c
m13
38\re
port\
hot_
subs
\ver
_3\fi
g_5-
1.pp
t
FIGURE 2.8
DATA RANGE USED FOR EVALUATION OF HOLDOVER TIME LIMITS
Rate of Precipitation (g/dm²/h)
0 5 10 15 20 25 76
FOG
ZD
12.7
- ZR
SNOW
ROCSW
2
H:cm1380/report/hot_subs/ranges.ppt38
2. METHODOLOGY 2.9 Analysis Methodology
X:\@APS ARCHIVE\CM1380 (TDC Deicing 1997-98)\REPORT\HOT_SUB\Final Version 1.0\Final Version 1.0.DOC Final Version 1.0, October 06 39
If precipitation rates less than the lower limit (light snow) are encountered, the upper time limit of the holdover time range can be selected for use. The upper precipitation rate limit (25 g/dm2/h) corresponds to the onset of heavy snow. Above this rate, it is standard practice to refer to the cautionary note included in the holdover time tables indicating that the time of protection will be shortened in heavy weather conditions (i.e., heavy precipitation or high moisture content).
2.9.2.2 Freezing drizzle
Freezing drizzle is considered to occur over the range of 0 to 12.7 g/dm2/h. The upper limit in this range, while not specifically defined in Table 2.1, has been adopted based on discussions with meteorological experts and operators on the SAE G-12 Holdover Time Subcommittee. The precipitation rate spectrum for freezing drizzle for test purposes is confined to rates between 5 and 12.7 g/dm2/h, inclusive. This range corresponds to heavy drizzle and has been chosen to provide aircraft operators with a greater margin of safety. A caution is included in the holdover time tables, indicating that if positive identification of freezing drizzle is not possible, the light freezing rain holdover time is recommended for use. 2.9.2.3 Light freezing rain
Freezing rain conditions as applied to the holdover time tables cover the range of precipitation rates from 12.7 to 25 g/dm2/h, inclusive. This range falls in the category of light freezing rain and is the only freezing rain category considered, as operations in periods of moderate or heavy freezing rain are deemed unsafe.
2.9.2.4 Freezing fog
The precipitation rate limits for freezing fog were arrived at with input from meteorologists from NRC, who helped define an important parameter in the study of fog referred to as Liquid Water Content (LWC). This quantity, expressed in density terms as the mass of water in grams contained in one cubic metre of air, can generally assume values in the range of 0.2 to 0.6 g/m3. The precipitation rate
2. METHODOLOGY 2.9 Analysis Methodology
X:\@APS ARCHIVE\CM1380 (TDC Deicing 1997-98)\REPORT\HOT_SUB\Final Version 1.0\Final Version 1.0.DOC Final Version 1.0, October 06 40
for fog, referred to as fog deposition or simply as deposition, is given by the empirical expression Deposition = LWC x Wind Velocity x Sin 10° x Collection Efficiency where the Sin 10° term accounts for the 10° inclination of the test plates into the direction of the wind. For a plate in fog with a 0.6 g/m3 LWC, a wind velocity of 6 km/h, and a collection efficiency of 80 percent, a deposition of 5 g/dm2/h is arrived at. For an aircraft taxiing at 12 km/h relative to the same wind in a 0.6 g/m3 LWC fog, a collection efficiency of 40 percent might be expected in this situation, and again a deposition rate equal to 5 g/dm2/h is achieved. The meteorological circumstances (LWC value and wind speed) and the speed and orientation of the airfoil relative to the wind (stationary or taxiing), contribute to uncertainties in the values that the variables in the equation can assume. A deposition range of 2 to 10 g/dm2/h is considered to be reasonable, and tests have been conducted in this range in previous years. The upper and lower holdover times for freezing fog were determined subjectively from the test data in previous years. It was agreed upon (at the 1997 Chicago SAE G-12 Holdover Time Subcommittee meeting) that the lower and upper holdover times for fog be evaluated at rates of 5 g/dm2/h and 2 g/dm2/h, respectively. However, it was felt in Vienna that 2 g/dm²/h was not indicative of low rate natural fog. As a result, the upper holdover times in each of the freezing fog cells of the holdover time tables were left untouched from previous years. 2.9.2.5 Rain on a cold-soaked surface Data used for the evaluation of holdover times for this category of precipitation were limited to precipitation rates ranging from 5 to 76 g/dm2/h, which encompasses drizzle (5 to 12.7 g/dm2/h), light rain (12.7 to 25 g/dm2/h), and moderate rain (25 to 76 g/dm2/h). The heavy rain category is covered by the cautionary note at the bottom of the holdover time table regarding heavy weather conditions.
2. METHODOLOGY 2.9 Analysis Methodology
X:\@APS ARCHIVE\CM1380 (TDC Deicing 1997-98)\REPORT\HOT_SUB\Final Version 1.0\Final Version 1.0.DOC Final Version 1.0, October 06 41
2.9.3 Protocol for the Determination of Holdover Times
Each cell in a holdover time table represents a range of time during which a fluid at a specified concentration will provide protection for a particular temperature range in a particular category of precipitation. Each holdover time table is composed of a maximum of 45 cells. Each cell contains a lower and upper time limit (except for frost) for a maximum of 81 time values. Cell holdover time values are determined by plotting failure time versus rate of precipitation and recording the failure time at two pre-selected rate limits. In previous years, several protocols were employed in the determination of holdover times. Due to the subjective natures of these different protocols, different interpretations of the data were possible. A multi-variable regression approach was subsequently devised in 1996-97 (see Transport Canada report TP 13131E (1)) and has been used to evaluate fluid holdover times for the past two test seasons.
2.9.3.1 Multi-variable regression protocol
Data corresponding to each cell in the holdover time table were assembled and sorted according to precipitation type, fluid manufacturer, dilution factor, and temperature range. The data for each fluid and each cell in the holdover time table were plotted. The data points on each plot were used to fit an equation of the form
t = cRaTb
where
t = Time (minutes), R = Rate of precipitation (g/dm2/h), T = Temperature (°C), and a,b,c = coefficients determined from the regression.
The coefficient c is a constant. The coefficients a and b give the rate and temperature dependency of the failure time, respectively. Plots of Log t versus Log R are shown in Figure 2.9. The plots contain data from two temperature ranges for one 50/50 Type IV fluid in natural snow conditions. The best-fit regression lines are superimposed onto the plot and were obtained from the analysis using the lowest temperatures in each of the temperature ranges, from which the data were chosen.
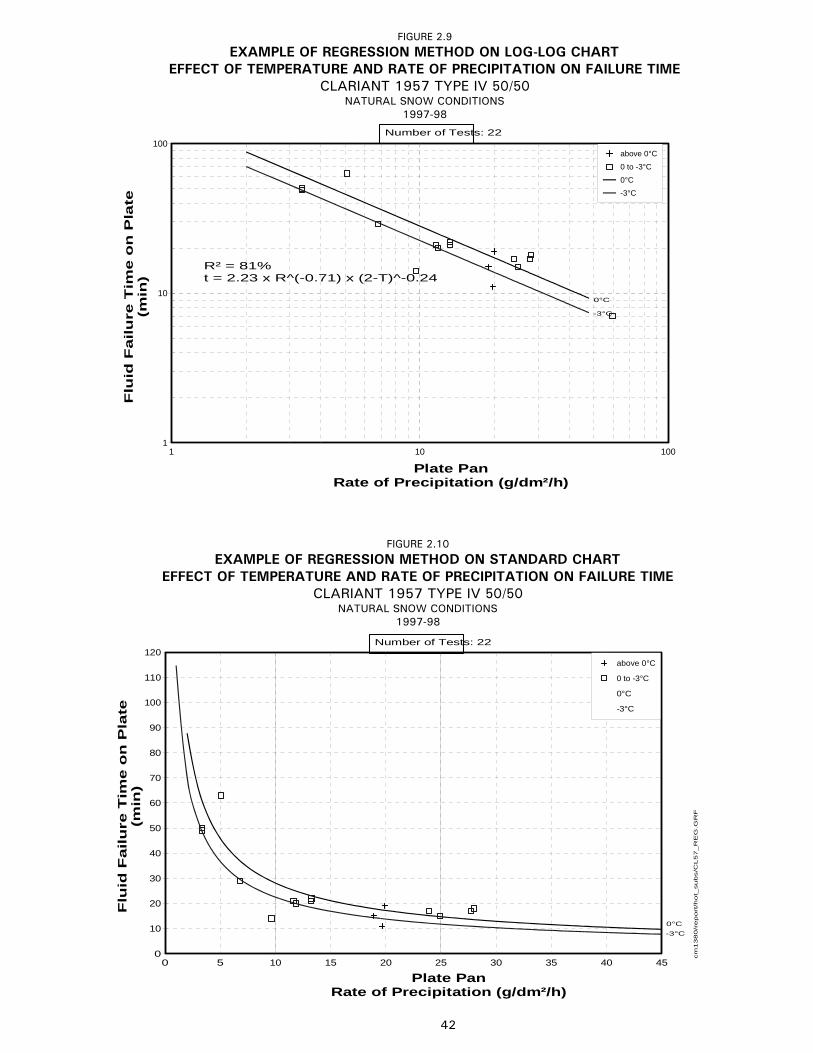
1
10
100
1 10 100
above 0°C
0 to -3°C
0°C-3°C
Number of Tests: 22
0°C
-3°C
0
10
20
30
40
50
60
70
80
90
100
110
120
0 5 10 15 20 25 30 35 40 45
above 0°C
0 to -3°C
0°C
-3°C
Flu
id F
ailu
re T
ime o
n P
late
(m
in)
Number of Tests: 22
0°C-3°C
cm
1380/r
eport
/hot_
subs/C
L57_R
EG
.GR
F
R² = 81%t = 2.23 x R^(-0.71) x (2-T)^-0.24
Flu
id F
ailu
re T
ime
on
Pla
te
(min
)
Plate PanRate of Precipitation (g/dm²/h)
Plate PanRate of Precipitation (g/dm²/h)
FIGURE 2.10EXAMPLE OF REGRESSION METHOD ON STANDARD CHART
EFFECT OF TEMPERATURE AND RATE OF PRECIPITATION ON FAILURE TIMECLARIANT 1957 TYPE IV 50/50
NATURAL SNOW CONDITIONS1997-98
FIGURE 2.9EXAMPLE OF REGRESSION METHOD ON LOG-LOG CHART
EFFECT OF TEMPERATURE AND RATE OF PRECIPITATION ON FAILURE TIMECLARIANT 1957 TYPE IV 50/50
NATURAL SNOW CONDITIONS1997-98
42
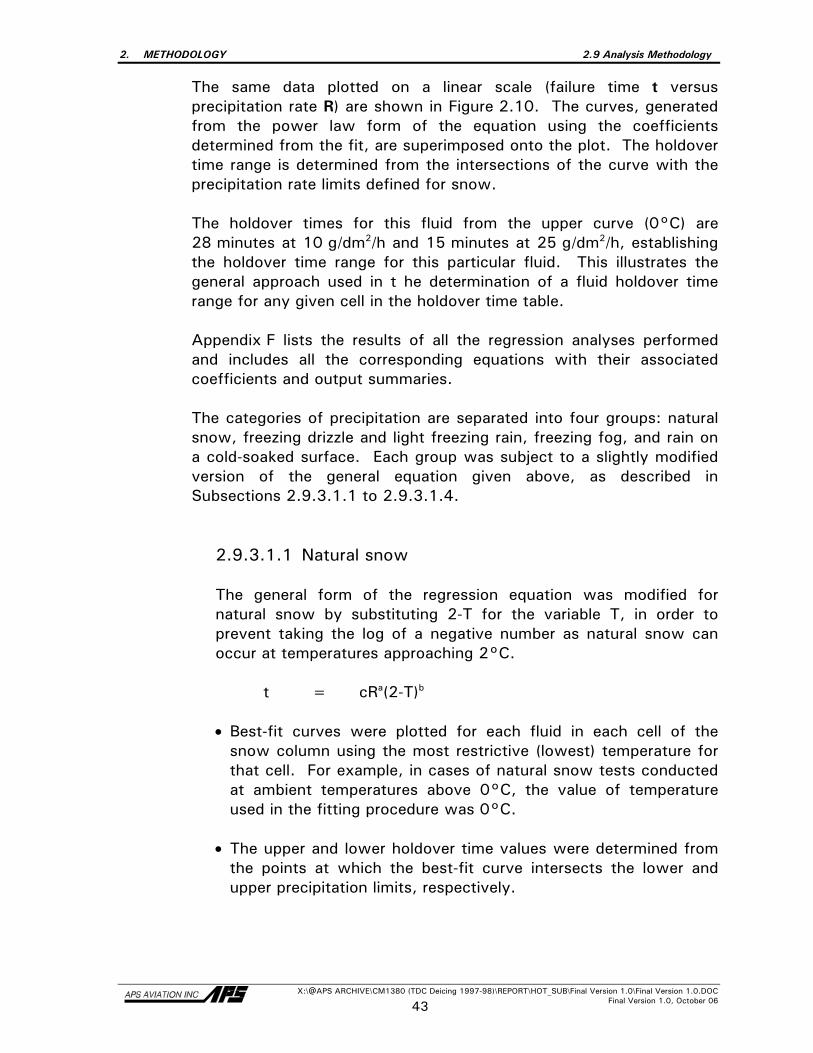
2. METHODOLOGY 2.9 Analysis Methodology
X:\@APS ARCHIVE\CM1380 (TDC Deicing 1997-98)\REPORT\HOT_SUB\Final Version 1.0\Final Version 1.0.DOC Final Version 1.0, October 06 43
The same data plotted on a linear scale (failure time t versus precipitation rate R) are shown in Figure 2.10. The curves, generated from the power law form of the equation using the coefficients determined from the fit, are superimposed onto the plot. The holdover time range is determined from the intersections of the curve with the precipitation rate limits defined for snow. The holdover times for this fluid from the upper curve (0°C) are 28 minutes at 10 g/dm2/h and 15 minutes at 25 g/dm2/h, establishing the holdover time range for this particular fluid. This illustrates the general approach used in t he determination of a fluid holdover time range for any given cell in the holdover time table. Appendix F lists the results of all the regression analyses performed and includes all the corresponding equations with their associated coefficients and output summaries. The categories of precipitation are separated into four groups: natural snow, freezing drizzle and light freezing rain, freezing fog, and rain on a cold-soaked surface. Each group was subject to a slightly modified version of the general equation given above, as described in Subsections 2.9.3.1.1 to 2.9.3.1.4.
2.9.3.1.1 Natural snow
The general form of the regression equation was modified for natural snow by substituting 2-T for the variable T, in order to prevent taking the log of a negative number as natural snow can occur at temperatures approaching 2°C. t = cRa(2-T)b • Best-fit curves were plotted for each fluid in each cell of the
snow column using the most restrictive (lowest) temperature for that cell. For example, in cases of natural snow tests conducted at ambient temperatures above 0°C, the value of temperature used in the fitting procedure was 0°C.
• The upper and lower holdover time values were determined from
the points at which the best-fit curve intersects the lower and upper precipitation limits, respectively.
2. METHODOLOGY 2.9 Analysis Methodology
X:\@APS ARCHIVE\CM1380 (TDC Deicing 1997-98)\REPORT\HOT_SUB\Final Version 1.0\Final Version 1.0.DOC Final Version 1.0, October 06 44
2.9.3.1.2 Light freezing rain and freezing drizzle
The modified equation used to treat the data in these categories of precipitation is given by the expression below: t = cRa • Tests in freezing drizzle and light freezing rain were conducted at
predetermined temperature limits (-3 and -10°C during the past year). The best-fit curves for data corresponding to a given cell in the holdover time table in these conditions were also obtained by using the most restrictive (lowest) cell range temperature.
• The exception to this was made for the case of the temperature
range above 0°C. Experiments for freezing drizzle and light freezing rain could not be performed artificially at temperatures above 0°C, and as such, the equation could not be calculated at the most restrictive temperature of 0°C. Therefore, holdover times for this temperature range were obtained by using the same values calculated at -3°C.
2.9.3.1.3 Simulated freezing fog
The same method used to evaluate freezing fog data in 1996-97 (see Transport Canada report TP 13131E (1)) was also used to evaluate this year’s freezing fog data. The equation used to treat data is given by the expression below: t = cRa Tb
2.9.3.1.4 Rain on a cold-soaked wing
The same method for the evaluation of holdover times in light freezing rain and freezing drizzle was used for this category of precipitation with the following exceptions: • Holdover times are based on the use of a cold-soak box with a
depth of 7.5 cm only;
• Cold-soak tests were conducted at +1°C, instead of +2°C used in previous years; and
• The range of times represents conditions of heavy drizzle, light freezing rain, and moderate rain.
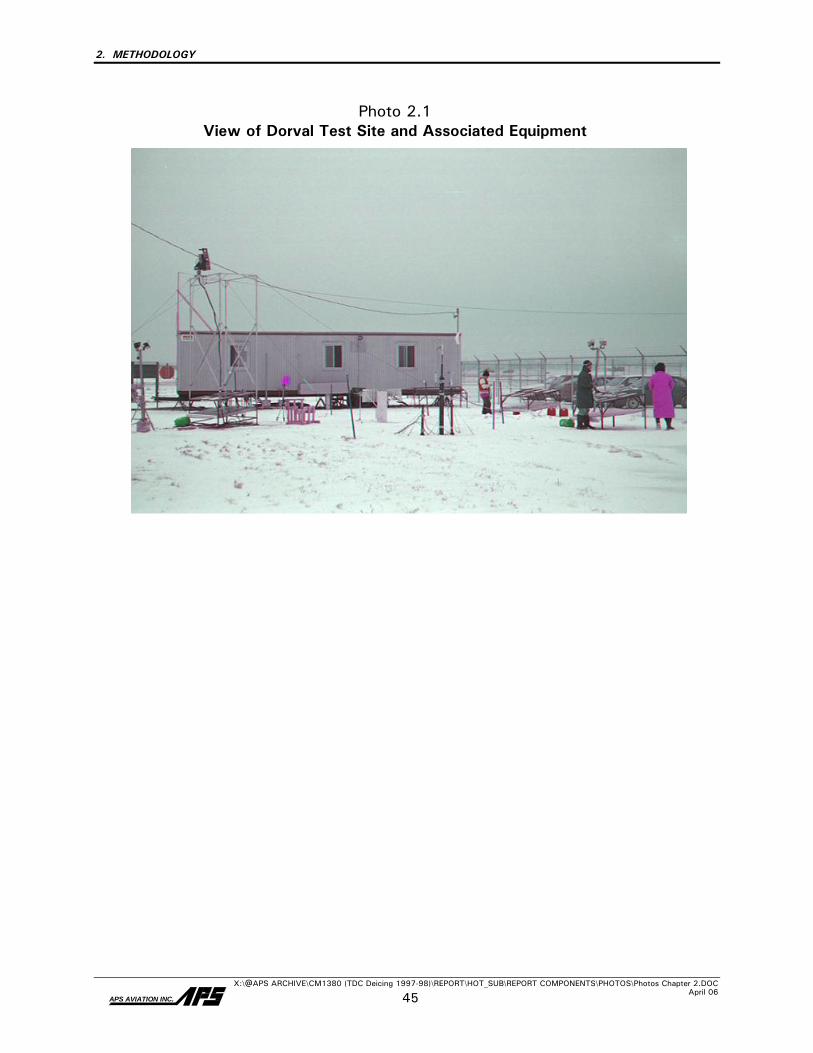
2. METHODOLOGY
X:\@APS ARCHIVE\CM1380 (TDC Deicing 1997-98)\REPORT\HOT_SUB\REPORT COMPONENTS\PHOTOS\Photos Chapter 2.DOC April 06
APS AVIATION INC. 45
Photo 2.1
View of Dorval Test Site and Associated Equipment
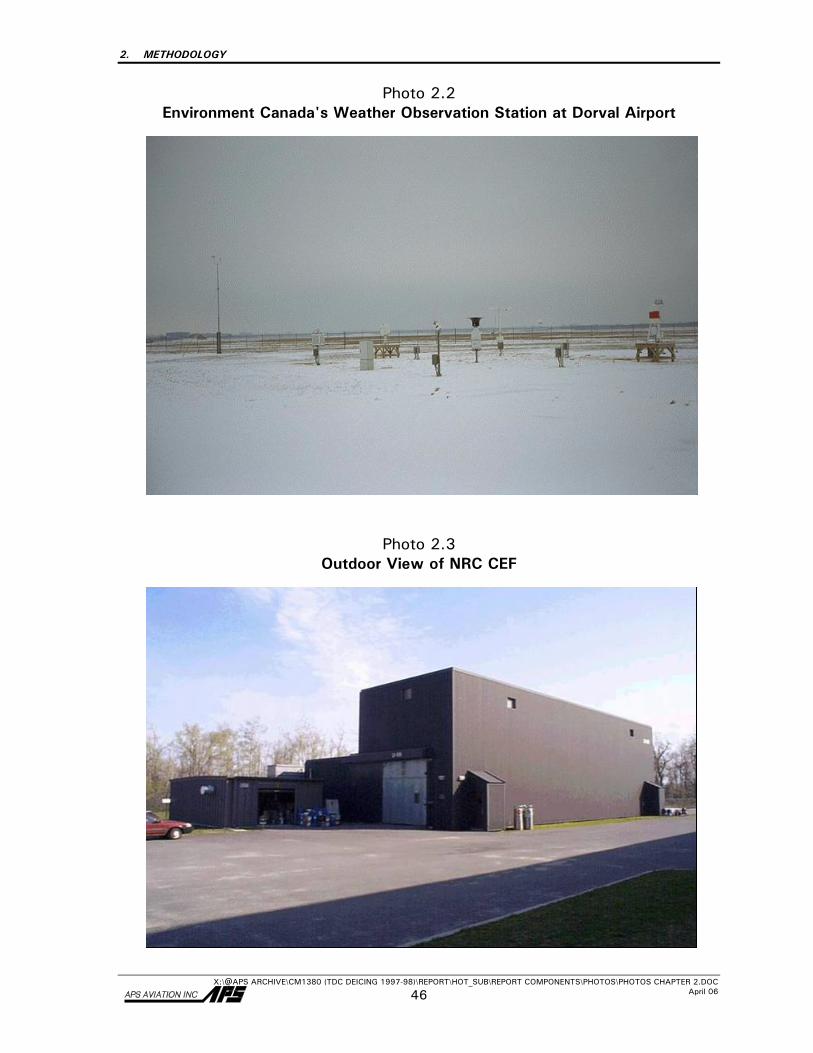
2. METHODOLOGY
X:\@APS ARCHIVE\CM1380 (TDC DEICING 1997-98)\REPORT\HOT_SUB\REPORT COMPONENTS\PHOTOS\PHOTOS CHAPTER 2.DOC April 06 46
Photo 2.2 Environment Canada's Weather Observation Station at Dorval Airport
Photo 2.3 Outdoor View of NRC CEF
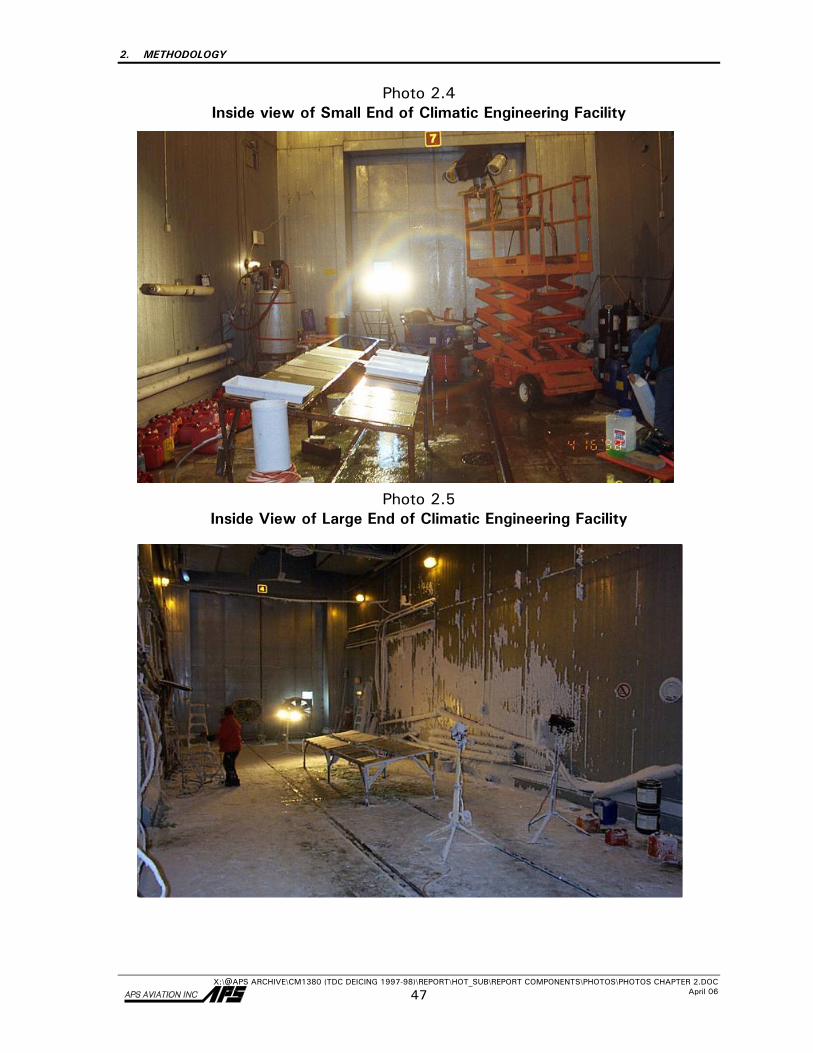
2. METHODOLOGY
X:\@APS ARCHIVE\CM1380 (TDC DEICING 1997-98)\REPORT\HOT_SUB\REPORT COMPONENTS\PHOTOS\PHOTOS CHAPTER 2.DOC April 06 47
Photo 2.4 Inside view of Small End of Climatic Engineering Facility
Photo 2.5 Inside View of Large End of Climatic Engineering Facility
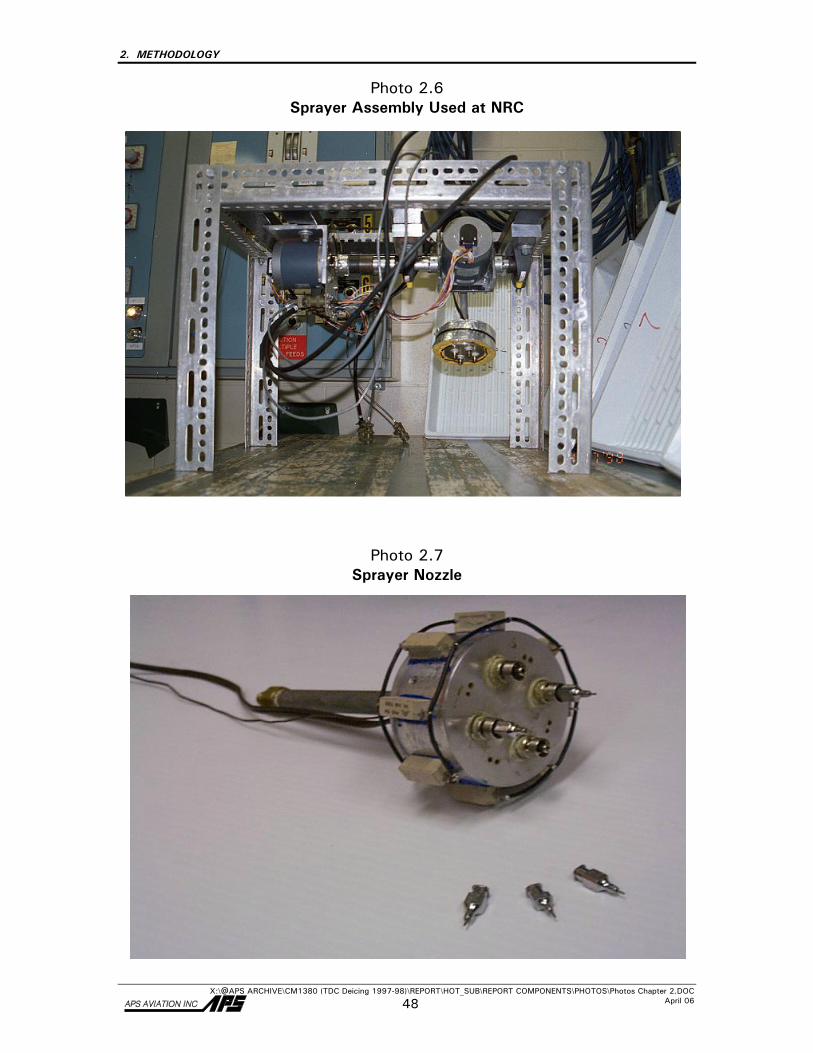
2. METHODOLOGY
X:\@APS ARCHIVE\CM1380 (TDC Deicing 1997-98)\REPORT\HOT_SUB\REPORT COMPONENTS\PHOTOS\Photos Chapter 2.DOC April 06 48
Photo 2.6 Sprayer Assembly Used at NRC
Photo 2.7 Sprayer Nozzle
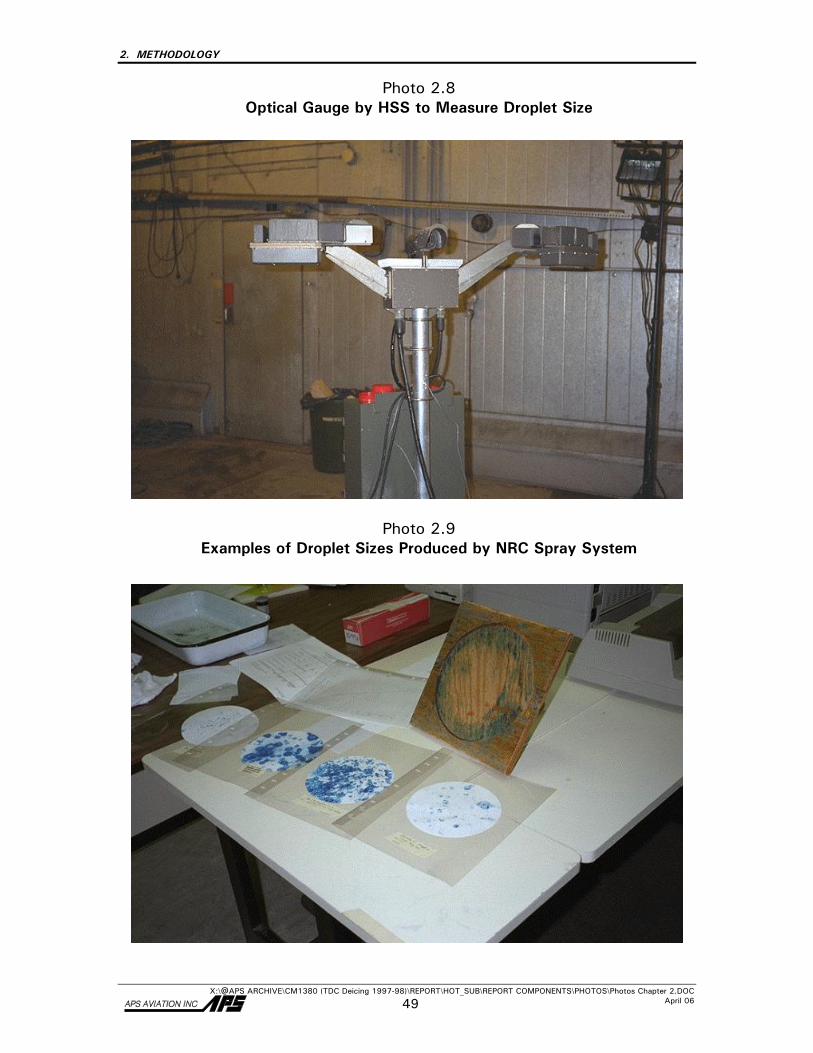
2. METHODOLOGY
X:\@APS ARCHIVE\CM1380 (TDC Deicing 1997-98)\REPORT\HOT_SUB\REPORT COMPONENTS\PHOTOS\Photos Chapter 2.DOC April 06 49
Photo 2.8 Optical Gauge by HSS to Measure Droplet Size
Photo 2.9 Examples of Droplet Sizes Produced by NRC Spray System
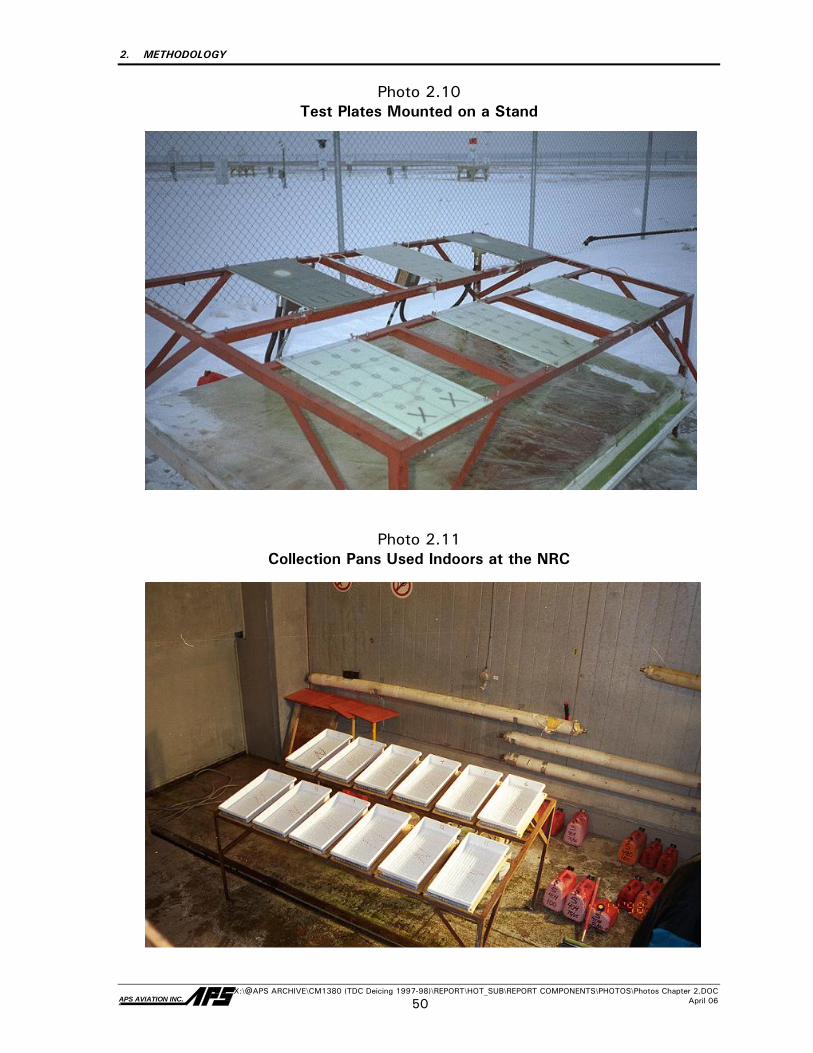
2. METHODOLOGY
X:\@APS ARCHIVE\CM1380 (TDC Deicing 1997-98)\REPORT\HOT_SUB\REPORT COMPONENTS\PHOTOS\Photos Chapter 2.DOC April 06 APS AVIATION INC. 50
Photo 2.10 Test Plates Mounted on a Stand
Photo 2.11 Collection Pans Used Indoors at the NRC
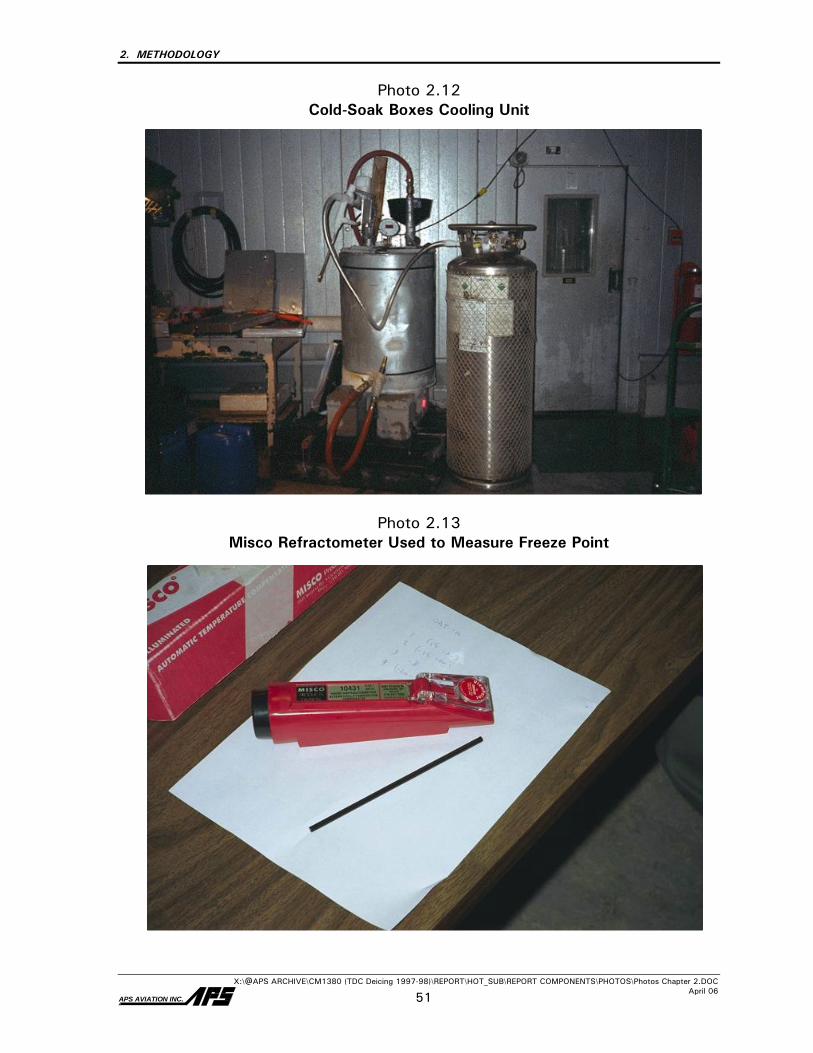
2. METHODOLOGY
X:\@APS ARCHIVE\CM1380 (TDC Deicing 1997-98)\REPORT\HOT_SUB\REPORT COMPONENTS\PHOTOS\Photos Chapter 2.DOC April 06 APS AVIATION INC. 51
Photo 2.12 Cold-Soak Boxes Cooling Unit
Photo 2.13 Misco Refractometer Used to Measure Freeze Point
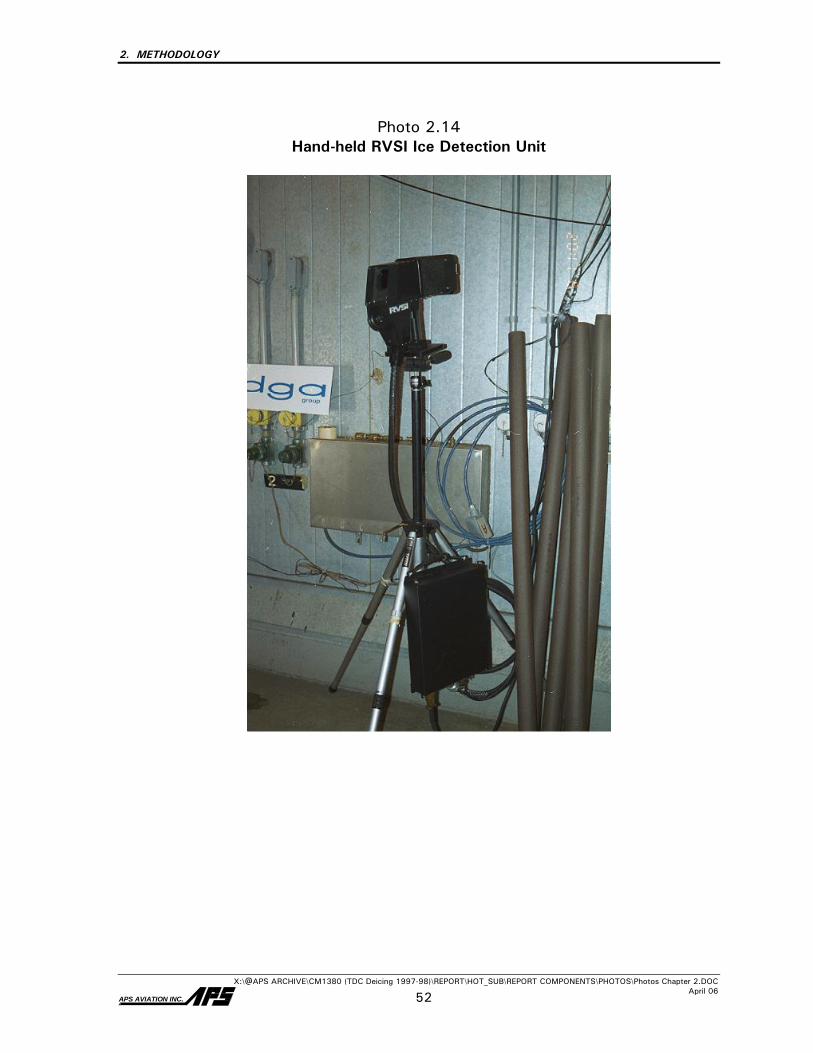
2. METHODOLOGY
X:\@APS ARCHIVE\CM1380 (TDC Deicing 1997-98)\REPORT\HOT_SUB\REPORT COMPONENTS\PHOTOS\Photos Chapter 2.DOC April 06 APS AVIATION INC. 52
Photo 2.14 Hand-held RVSI Ice Detection Unit
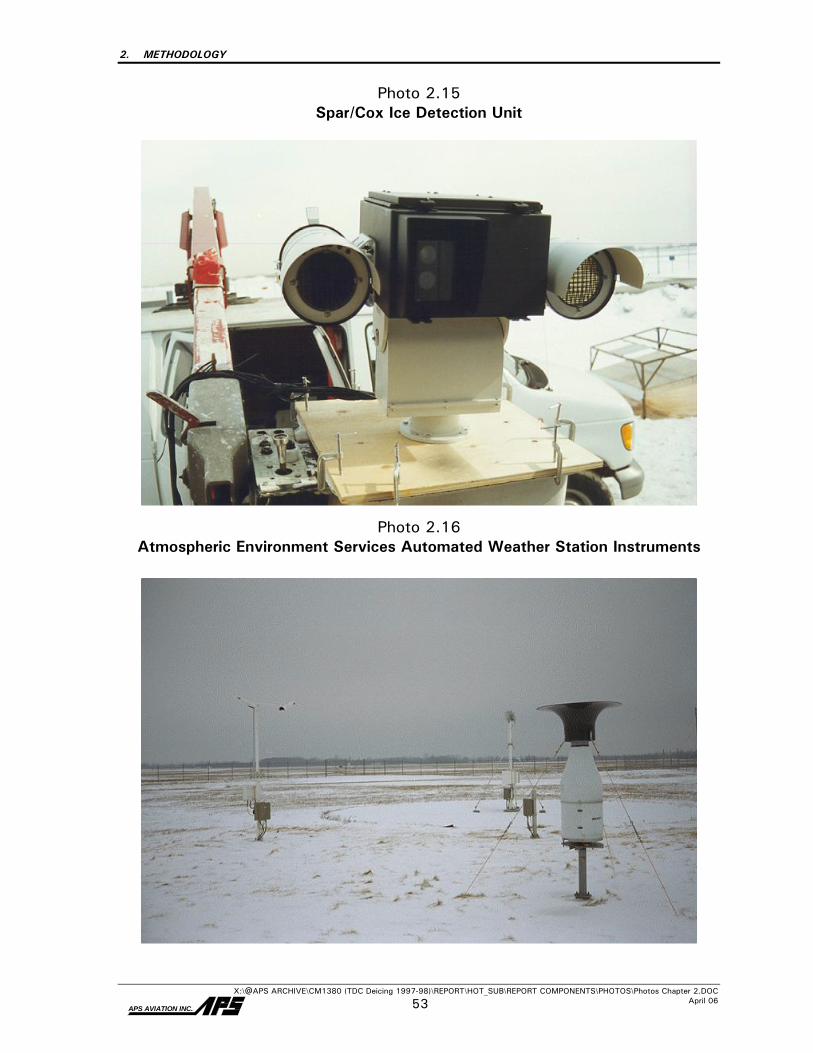
2. METHODOLOGY
X:\@APS ARCHIVE\CM1380 (TDC Deicing 1997-98)\REPORT\HOT_SUB\REPORT COMPONENTS\PHOTOS\Photos Chapter 2.DOC April 06
APS AVIATION INC. 53
Photo 2.15 Spar/Cox Ice Detection Unit
Photo 2.16 Atmospheric Environment Services Automated Weather Station Instruments
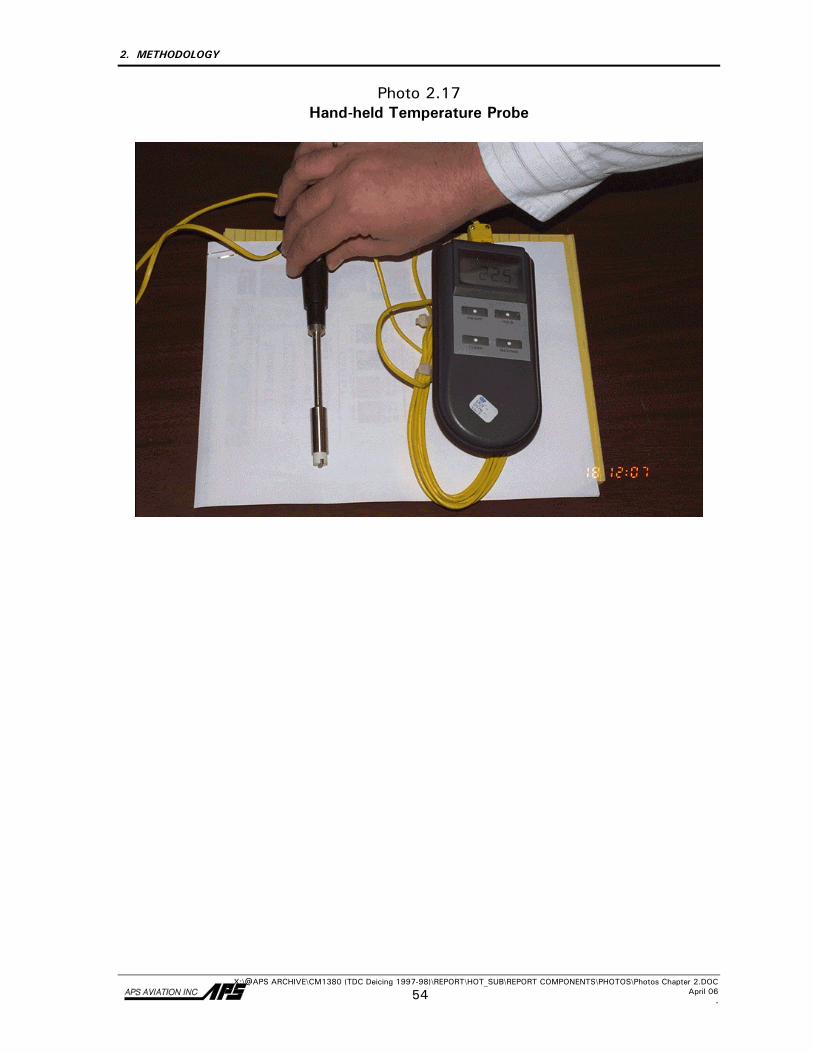
2. METHODOLOGY
X:\@APS ARCHIVE\CM1380 (TDC Deicing 1997-98)\REPORT\HOT_SUB\REPORT COMPONENTS\PHOTOS\Photos Chapter 2.DOC April 06 . 54
Photo 2.17 Hand-held Temperature Probe
3. DESCRIPTION OF DATA 3.1 Dorval Natural Snow Tests
X:\@APS ARCHIVE\CM1380 (TDC Deicing 1997-98)\REPORT\HOT_SUB\Final Version 1.0\Final Version 1.0.DOC Final Version 1.0, October 06 55
3. DESCRIPTION OF DATA
This section provides a summary of the number of tests conducted for natural snow, simulated light freezing rain and freezing drizzle, simulated freezing fog and cold-soaked boxes. Breakdowns are provided for quantity of tests performed versus fluid type and distributions of weather parameters such as temperature, precipitation rate, wind speed, and direction. Natural snow tests were conducted at the APS test site, located at Dorval Airport. A total of 525 usable tests were conducted on nine days over the 1997-98 winter season. Most of the tests were conducted in the months of February and March since most of Type IV fluids were received late in the season. Simulated light freezing rain, drizzle, fog and rain on cold-soak box tests were conducted at NRC’s CEF in Ottawa. A summary of the flat plate tests conducted at Dorval and at NRC is provided in Table 3.1.
3.1 Dorval Natural Snow Tests
3.1.1 Data Acquisition
The test plan developed for experiments to be conducted in natural snow conditions is described in Appendix B. During the 1997-98 test season, a total of 752 tests were conducted on flat plates at the APS test site at Dorval Airport. All of the 752 tests occurred during natural precipitation. Of this total, 525 data points were usable. A breakdown of data points collected is listed below.
# of Tests Usable 525 Fluid not failed (e.g. snow stopped) 130 Different precipitation (ZR-, ZD, IP, …) 75 Other (discontinued fluids) 22 Total tests conducted 752
The tests referred to as different precipitation above are tests carried out under natural freezing conditions other than snow and are described separately in Subsection 6.1.
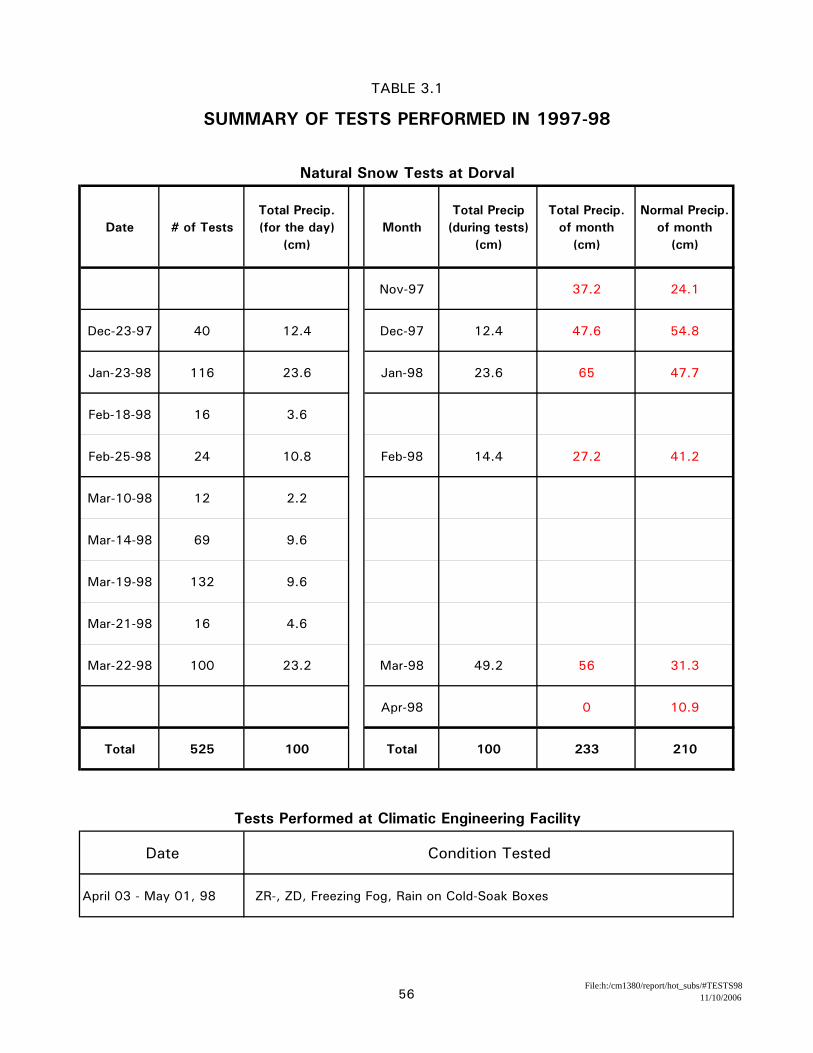
TABLE 3.1
SUMMARY OF TESTS PERFORMED IN 1997-98
Natural Snow Tests at Dorval
Date # of TestsTotal Precip. (for the day)
(cm) Month
Total Precip(during tests)
(cm)
Total Precip.of month
(cm)
Normal Precip.of month
(cm)
Nov-97 37.2 24.1
Dec-23-97 40 12.4 Dec-97 12.4 47.6 54.8
Jan-23-98 116 23.6 Jan-98 23.6 65 47.7
Feb-18-98 16 3.6
Feb-25-98 24 10.8 Feb-98 14.4 27.2 41.2
Mar-10-98 12 2.2
Mar-14-98 69 9.6
Mar-19-98 132 9.6
Mar-21-98 16 4.6
Mar-22-98 100 23.2 Mar-98 49.2 56 31.3
Apr-98 0 10.9
Total 525 100 Total 100 233 210
Tests Performed at Climatic Engineering Facility
Date Condition Tested
April 03 - May 01, 98 ZR-, ZD, Freezing Fog, Rain on Cold-Soak Boxes
56File:h:/cm1380/report/hot_subs/#TESTS98
11/10/2006
3. DESCRIPTION OF DATA 3.1 Dorval Natural Snow Tests
X:\@APS ARCHIVE\CM1380 (TDC Deicing 1997-98)\REPORT\HOT_SUB\Final Version 1.0\Final Version 1.0.DOC Final Version 1.0, October 06 57
The breakdown, by fluid type, of the 525 usable tests conducted is shown in Figure 3.1 and summarized below.
Fluid Type # of Tests Type IV Neat 191 Type IV 75/25 167 Type IV 50/50 85 Type I (standard) 24 Recycled Fluid 40 Aeroflot 18 Total Usable Tests 525
3.1.2 Test Location and Fluids Tested
The Type I and Type IV fluids tested at Dorval Airport were manufactured by Clariant, Kilfrost, Octagon, SPCA, and Union Carbide. In addition, a Russian fluid provided by Aeroflot and two recycled fluids developed by Inland Technologies were also tested. Figure 3.1 shows all fluid brands tested and the distributor by fluid type of tests. 3.1.3 Distribution of Average Precipitation Rates
Precipitation at Dorval was measured using plate pans, and two automated gauges from Environment Canada (READAC and CR21X). The rates of precipitation used in this report were computed using the plate pan method. Environment Canada gauges were used as a backup and also for evaluation of weather snow data, described in detail in Transport Canada report TP 13314E (6). The distribution of the average precipitation rate for the tests is summarized in Figure 3.2 for Type IV fluids.
3.1.4 Distribution of Other Meteorological Conditions
The air temperature, wind speed, and wind direction over the duration of the tests were obtained from the Environment Canada automated weather station (READAC). In previous years, these parameters were measured with instruments purchased by APS on behalf of Transport Canada. These instruments are still operational, and were used this year for weather monitoring purposes only.
3. DESCRIPTION OF DATA 3.1 Dorval Natural Snow Tests
X:\@APS ARCHIVE\CM1380 (TDC Deicing 1997-98)\REPORT\HOT_SUB\Final Version 1.0\Final Version 1.0.DOC Final Version 1.0, October 06 60
A summary of the distribution of the READAC measurements for each Type IV fluid test is illustrated in Figures 3.3 to 3.5 as follows: Figure 3.3 Distribution of Air Temperature for Type IV Fluids; Figure 3.4 Distribution of Wind Speed for Type IV Fluids; and Figure 3.5 Comparison of Wind Direction to Platform Direction.
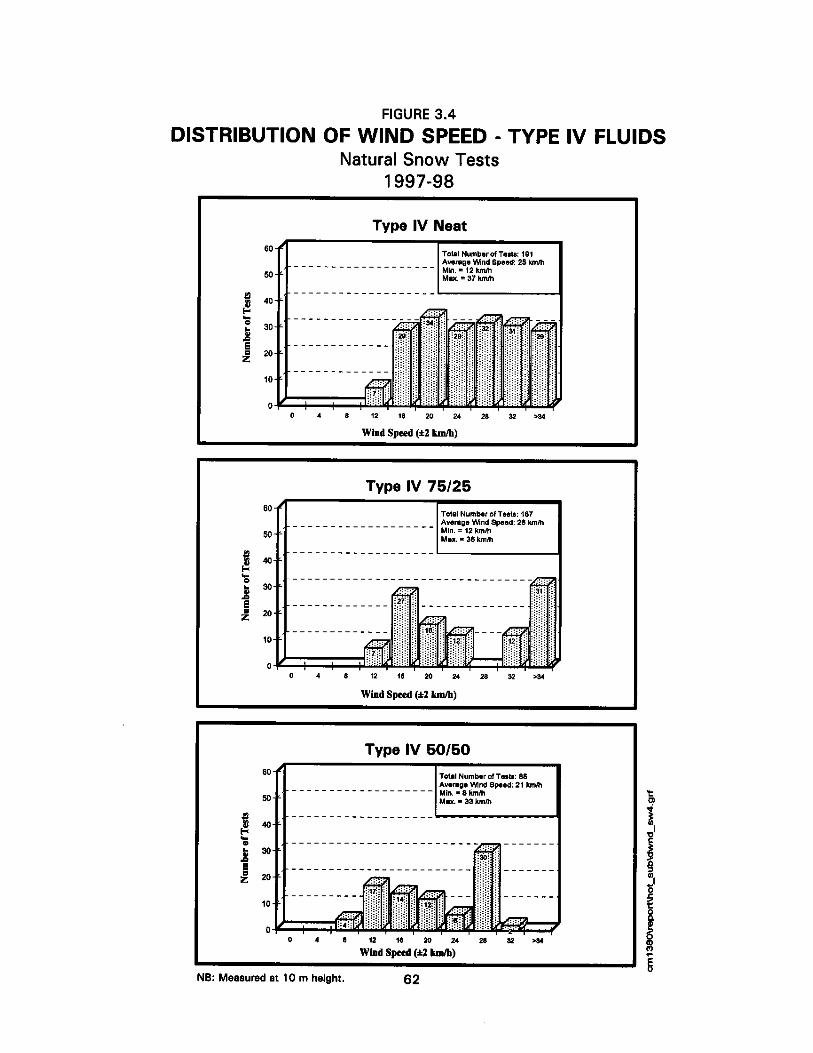
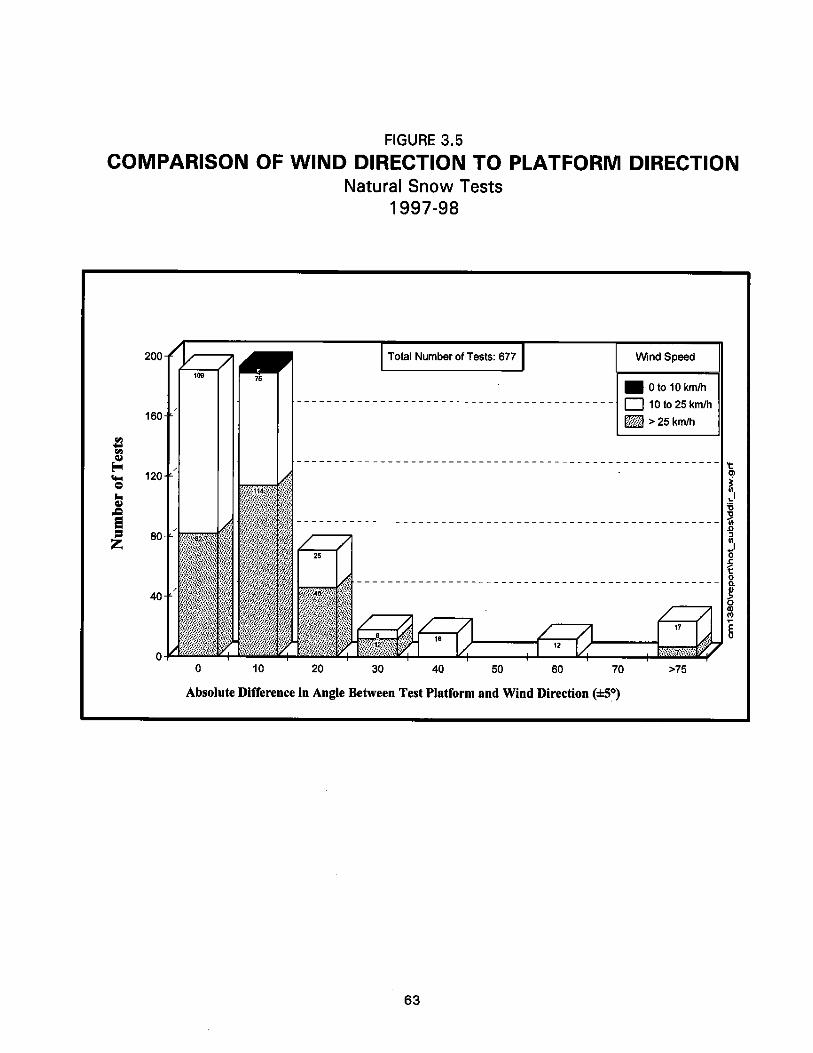
3. DESCRIPTION OF DATA 3.2 Simultaneous Freezing Drizzle and Light Freezing Rain Tests
X:\@APS ARCHIVE\CM1380 (TDC Deicing 1997-98)\REPORT\HOT_SUB\Final Version 1.0\Final Version 1.0.DOC Final Version 1.0, October 06 64
3.2 Freezing Drizzle and Light Freezing Rain Tests
3.2.1 Data Acquisition The test plan developed for experiments to be conducted in freezing drizzle and light freezing rain is described in Appendix C. A total of 241 freezing drizzle and 234 light freezing rain tests were carried out in the 1997-98 winter, as shown in Figure 3.6. 3.2.2 Test Location and Fluids Tested
All of the 475 freezing precipitation tests were conducted at NRC’s CEF in Ottawa. The fluids tested were supplied by Clariant, Kilfrost, Octagon, SPCA, Union Carbide, and Inland Technologies.
3.2.3 Distribution of Average Precipitation Rates Figures 3.7 to 3.9 show the distribution of average precipitation rates recorded for all fluids tested. As described in Section 2, the average precipitation rates for freezing drizzle and light freezing rain were computed from weight measurements taken with plate pans. The pans were positioned on the stand at every plate position before and after each run for a minimum of two 10-minute periods. In addition, an automated tipping bucket was positioned next to the test stand to measure precipitation for monitoring purposes to ensure consistent rates during the test period. All fluids were tested at the upper and lower precipitation rate limits. The limits were 5 and 13 g/dm²/h for freezing drizzle, and 13 and 25 g/dm²/h for light freezing rain. 3.2.4 Distribution of Other Meteorological Conditions
Air temperature was the only other meteorological factor that varied during the freezing drizzle and light freezing rain tests. The distribution of air temperatures is presented in Figures 3.10 to 3.12. Special tests with wind were conducted to study the effect of wind on holdover times; these tests are described in detail in Subsection 6.8.
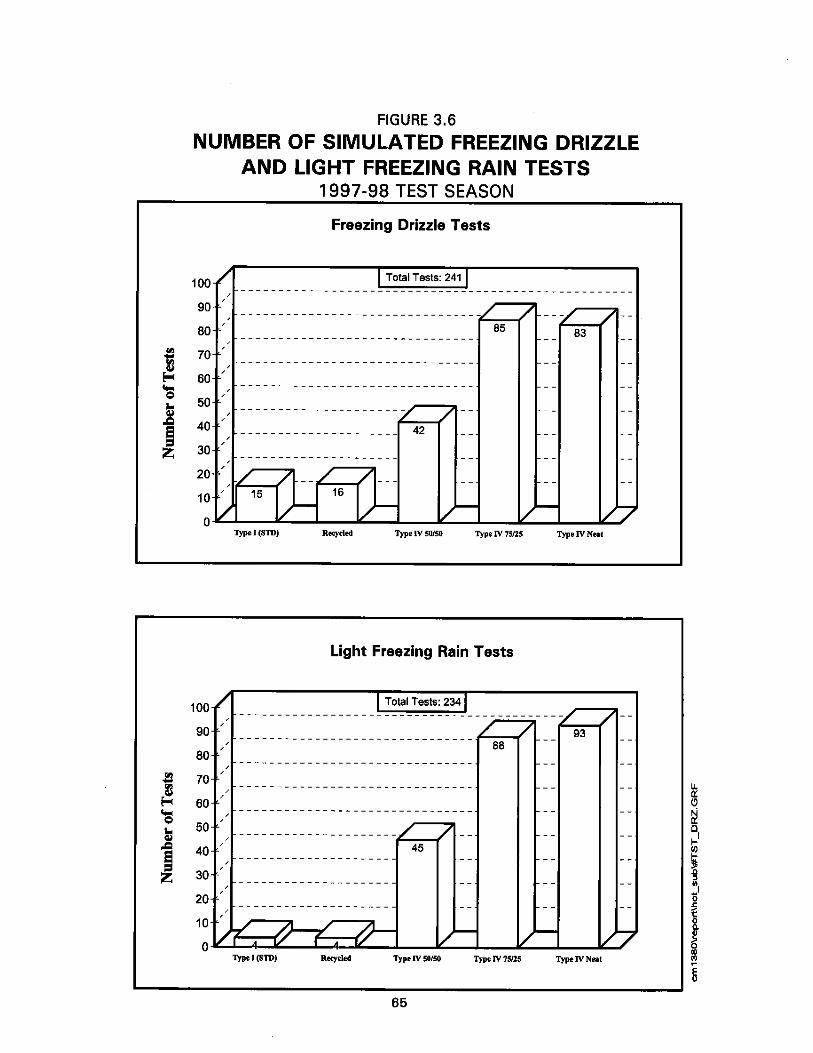
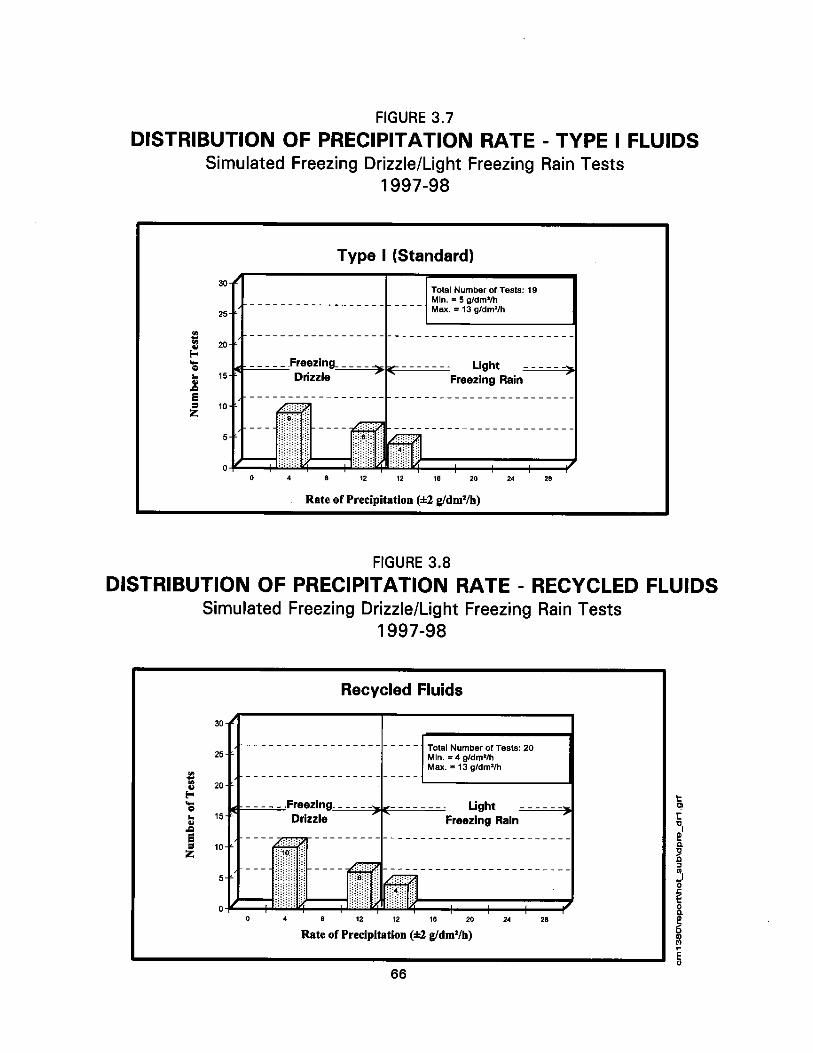
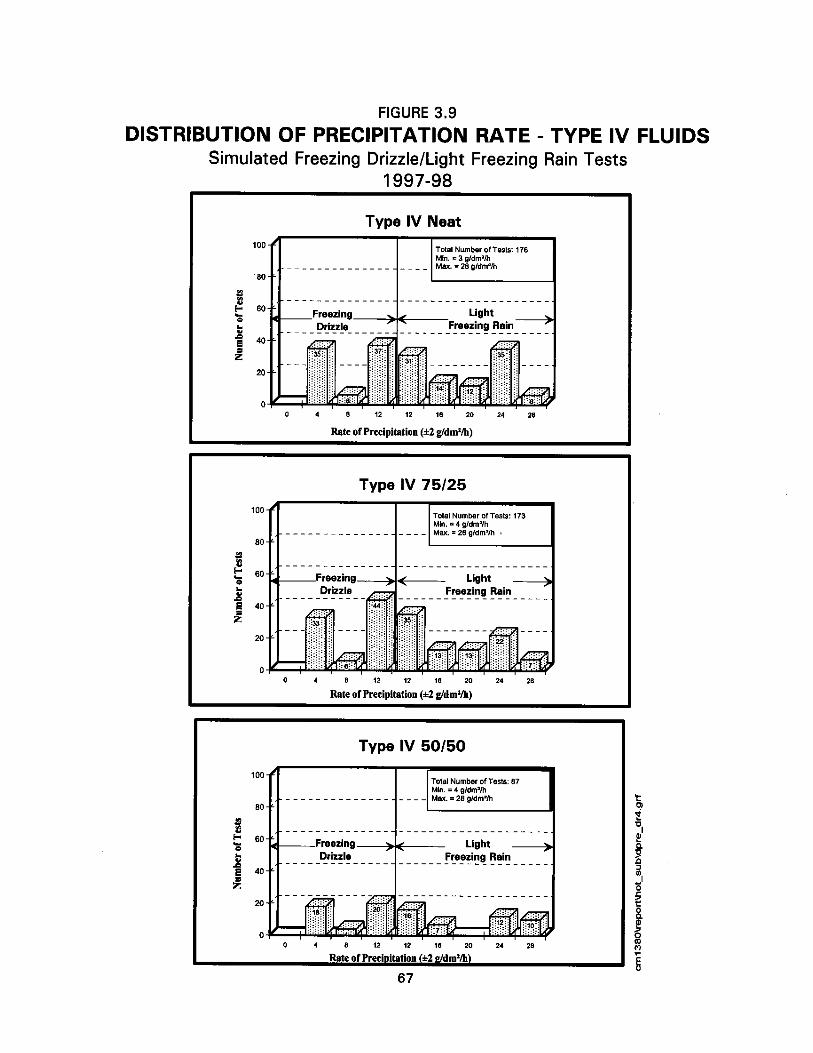
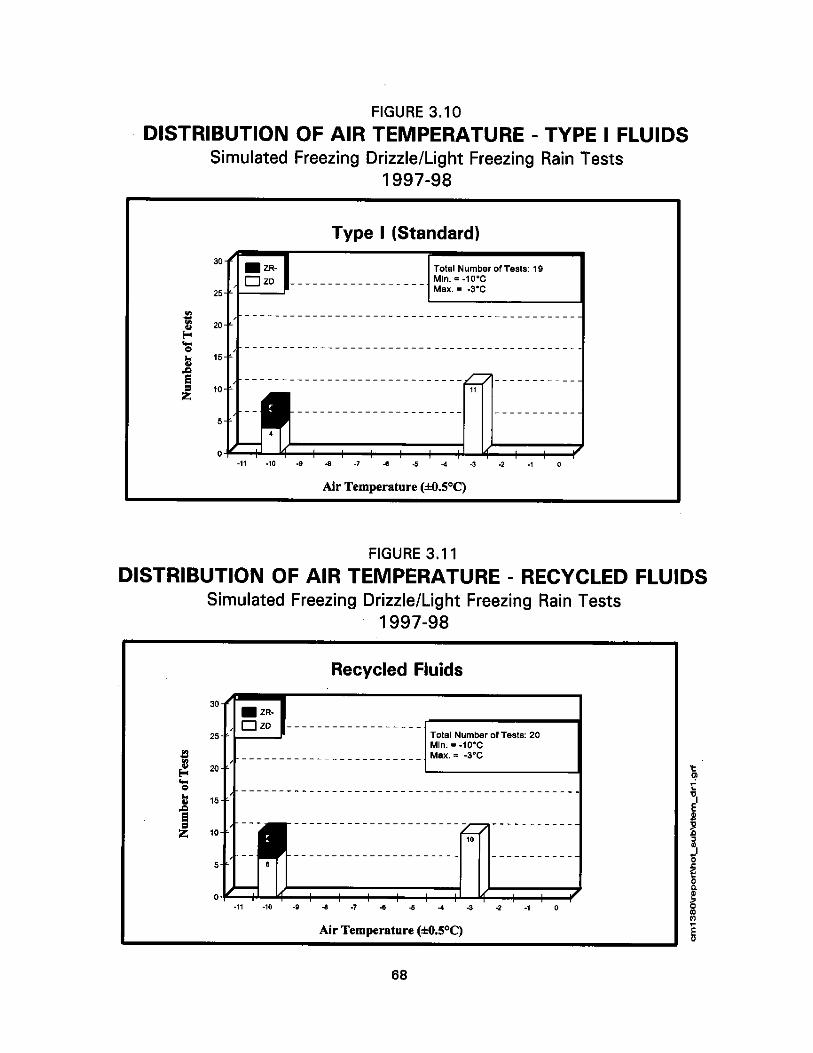
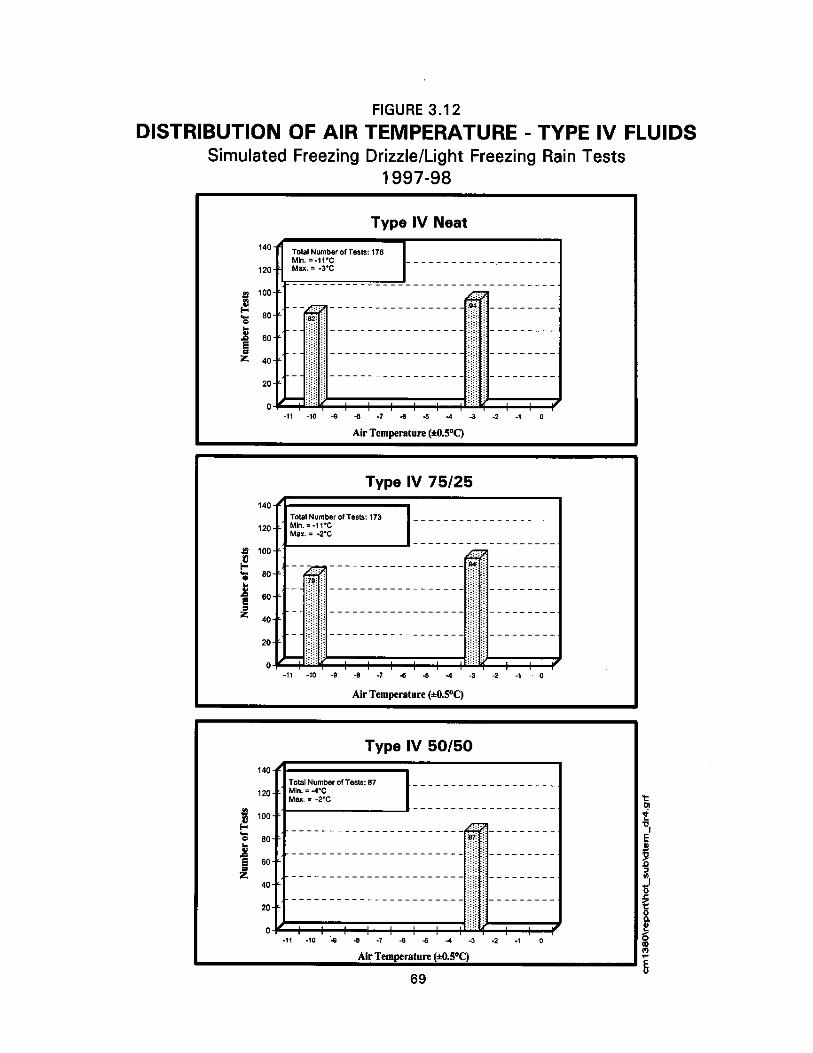
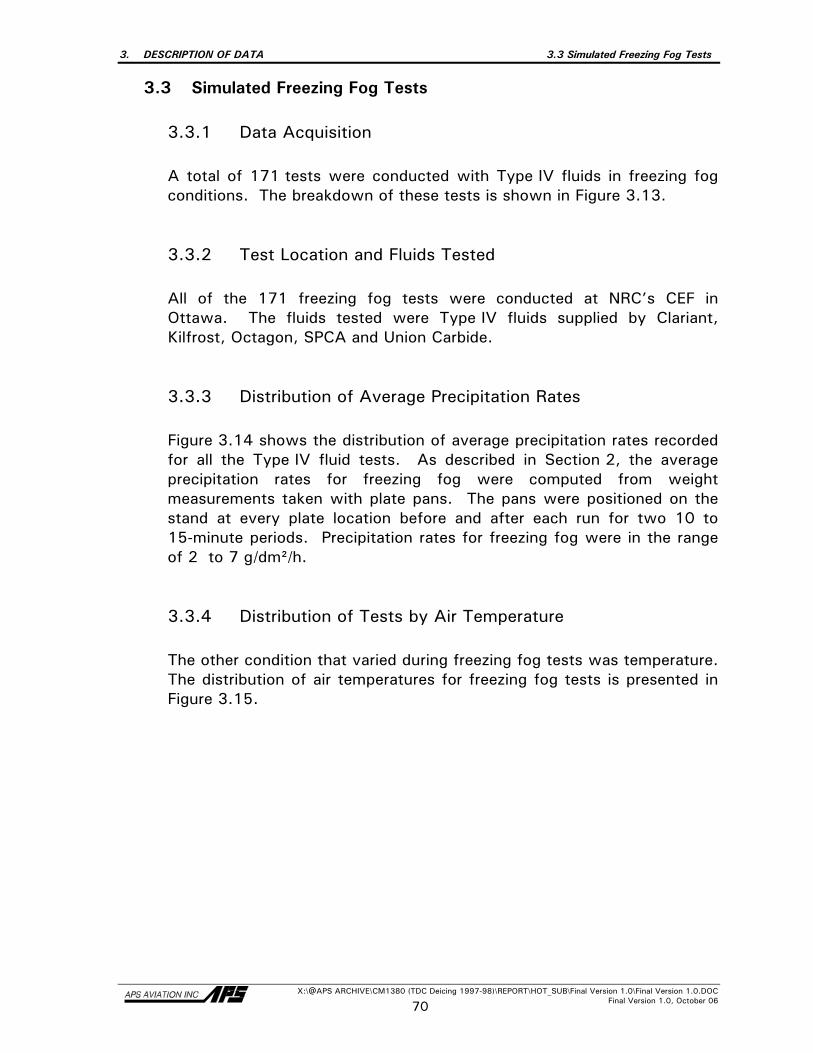
3. DESCRIPTION OF DATA 3.3 Simulated Freezing Fog Tests
X:\@APS ARCHIVE\CM1380 (TDC Deicing 1997-98)\REPORT\HOT_SUB\Final Version 1.0\Final Version 1.0.DOC Final Version 1.0, October 06 70
3.3 Simulated Freezing Fog Tests
3.3.1 Data Acquisition
A total of 171 tests were conducted with Type IV fluids in freezing fog conditions. The breakdown of these tests is shown in Figure 3.13. 3.3.2 Test Location and Fluids Tested All of the 171 freezing fog tests were conducted at NRC’s CEF in Ottawa. The fluids tested were Type IV fluids supplied by Clariant, Kilfrost, Octagon, SPCA and Union Carbide. 3.3.3 Distribution of Average Precipitation Rates Figure 3.14 shows the distribution of average precipitation rates recorded for all the Type IV fluid tests. As described in Section 2, the average precipitation rates for freezing fog were computed from weight measurements taken with plate pans. The pans were positioned on the stand at every plate location before and after each run for two 10 to 15-minute periods. Precipitation rates for freezing fog were in the range of 2 to 7 g/dm²/h. 3.3.4 Distribution of Tests by Air Temperature The other condition that varied during freezing fog tests was temperature. The distribution of air temperatures for freezing fog tests is presented in Figure 3.15.
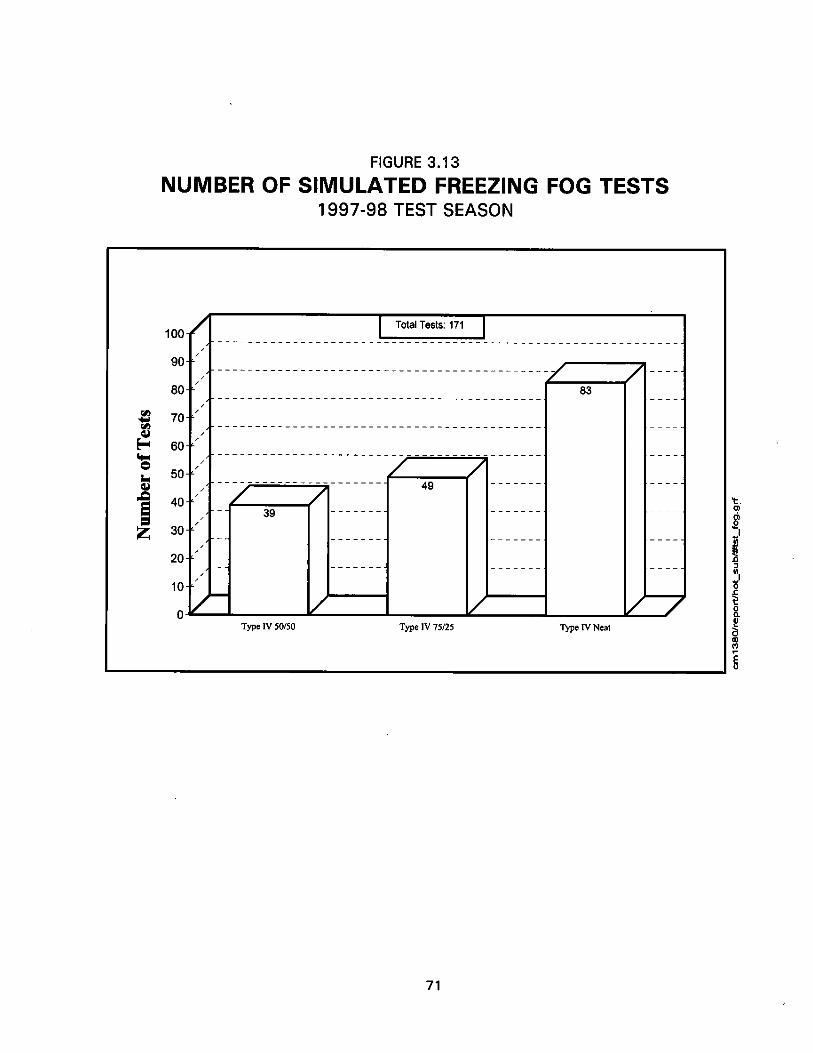
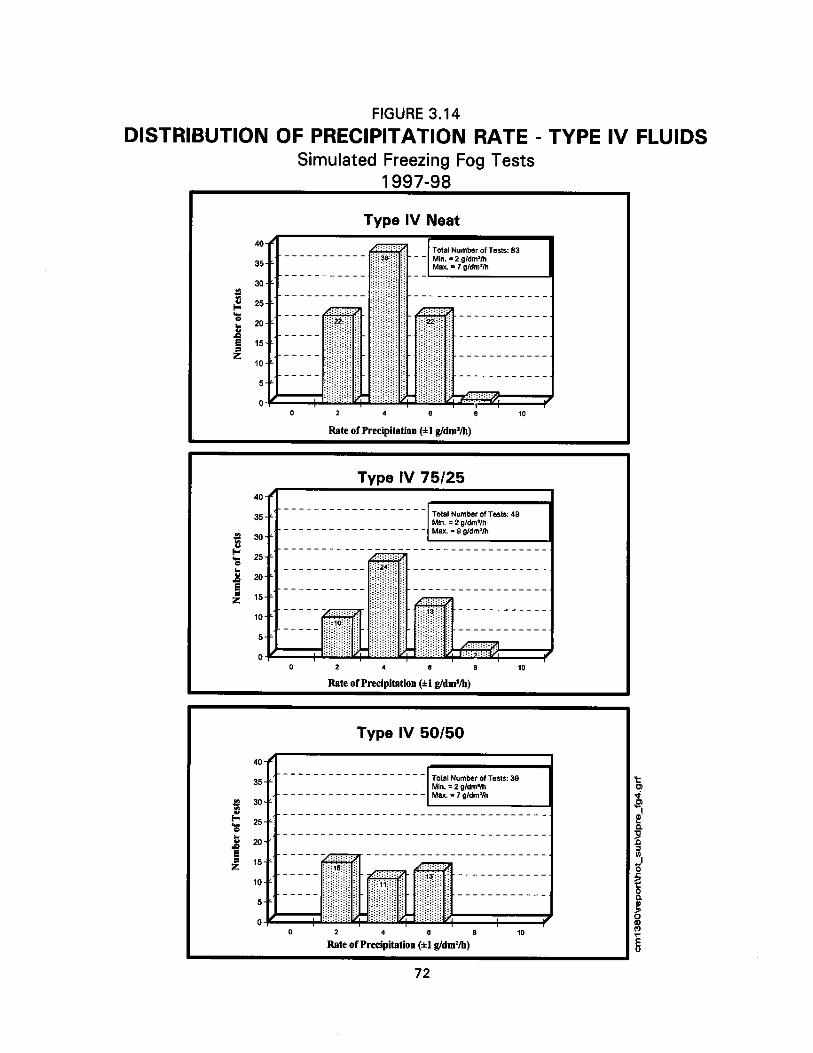
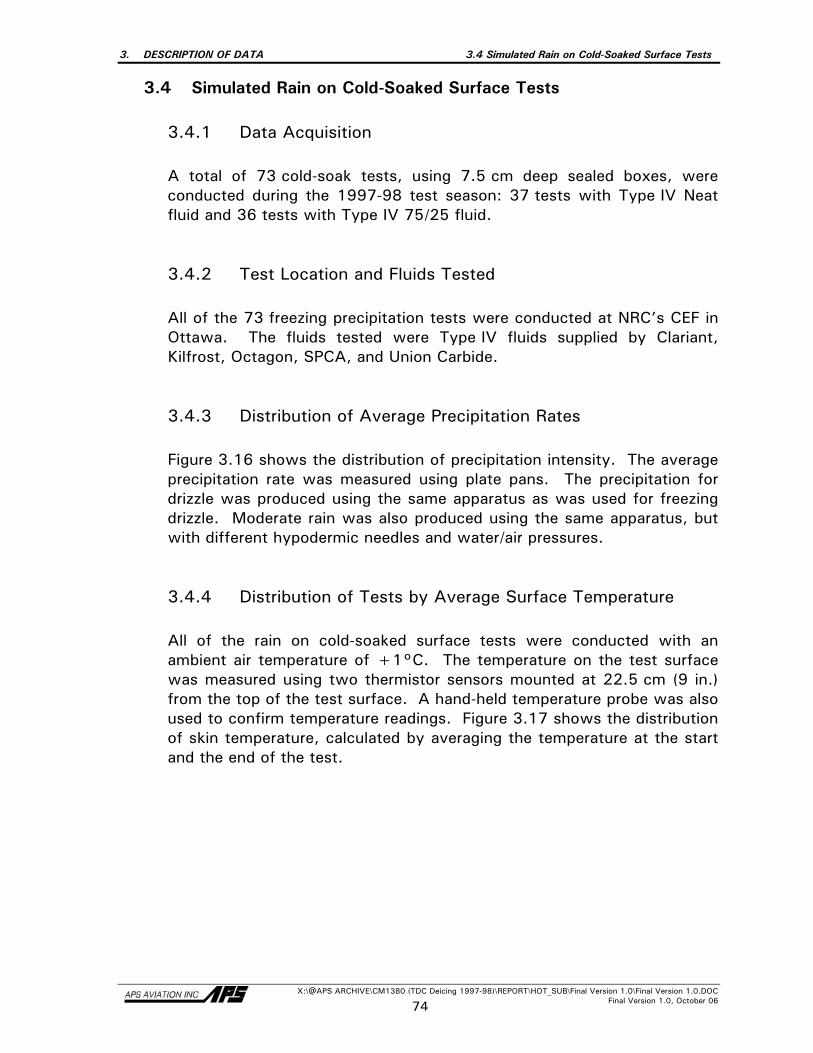
3. DESCRIPTION OF DATA 3.4 Simulated Rain on Cold-Soaked Surface Tests
X:\@APS ARCHIVE\CM1380 (TDC Deicing 1997-98)\REPORT\HOT_SUB\Final Version 1.0\Final Version 1.0.DOC Final Version 1.0, October 06 74
3.4 Simulated Rain on Cold-Soaked Surface Tests
3.4.1 Data Acquisition A total of 73 cold-soak tests, using 7.5 cm deep sealed boxes, were conducted during the 1997-98 test season: 37 tests with Type IV Neat fluid and 36 tests with Type IV 75/25 fluid. 3.4.2 Test Location and Fluids Tested All of the 73 freezing precipitation tests were conducted at NRC’s CEF in Ottawa. The fluids tested were Type IV fluids supplied by Clariant, Kilfrost, Octagon, SPCA, and Union Carbide. 3.4.3 Distribution of Average Precipitation Rates
Figure 3.16 shows the distribution of precipitation intensity. The average precipitation rate was measured using plate pans. The precipitation for drizzle was produced using the same apparatus as was used for freezing drizzle. Moderate rain was also produced using the same apparatus, but with different hypodermic needles and water/air pressures. 3.4.4 Distribution of Tests by Average Surface Temperature
All of the rain on cold-soaked surface tests were conducted with an
ambient air temperature of +1°C. The temperature on the test surface was measured using two thermistor sensors mounted at 22.5 cm (9 in.) from the top of the test surface. A hand-held temperature probe was also used to confirm temperature readings. Figure 3.17 shows the distribution of skin temperature, calculated by averaging the temperature at the start and the end of the test.
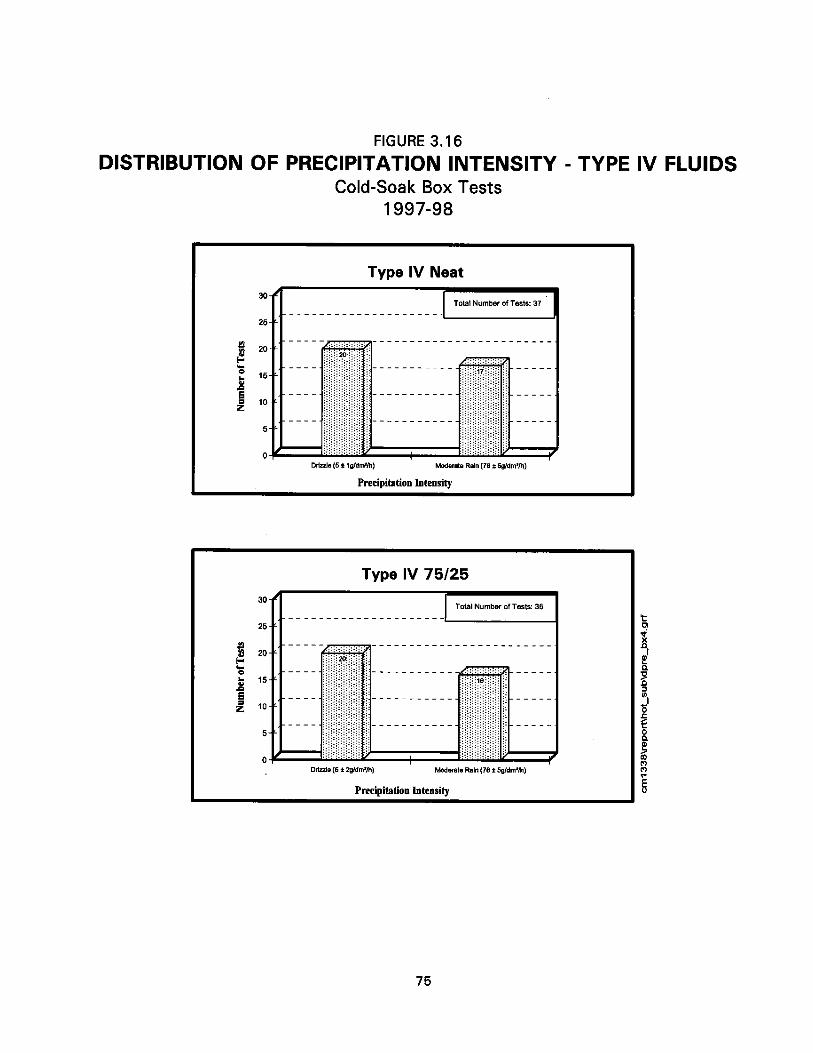
4. FLUID THICKNESS TESTS ON FLAT PLATES 4.1 General Procedures and Stabilised Neat Fluid Profiles
X:\@APS ARCHIVE\CM1380 (TDC Deicing 1997-98)\REPORT\HOT_SUB\Final Version 1.0\Final Version 1.0.DOC Final Version 1.0, October 06 77
4. FLUID THICKNESS TESTS ON FLAT PLATES
Type IV fluid thickness tests on flat plates were conducted at the APS site at Dorval Airport and at NRC’s CEF, on six occasions during the 1997-98 test season. The purpose of these tests was to measure film thickness profiles of new fluids and to investigate the extent to which heated Type IV fluids reduce holdover times. The listing of tests conducted is displayed in Table 4.1 and summarized below: Type IV Fluid # of Tests Neat 27 75/25 24 50/50 25 HOT Neat over HOT Type I 25 In addition, four thickness tests were conducted with recycled fluids and eight tests were performed to study the effect of ICE-EX on holdover times.
4.1 General Procedures and Stabilized Neat Fluid Profiles
Thickness measurements were taken at regular time intervals over a period of 30 minutes, at 15 cm (6") lines on the 10º flat plates. A complete description of the film thickness test procedure is reported in Transport Canada report TP 12900E (8). The tests at Dorval were conducted indoors (see Photo 4.1) to exclude environmental factors such as natural precipitation and wind. The Dorval tests were conducted at an ambient temperature of -8ºC. Thickness tests at NRC were conducted at ambient temperature of -3°C; a few tests were performed at different ambient temperatures, but for the purpose of this report, only tests conducted at -3°C are considered. Figure 4.1 illustrates the thickness decay at the 15 cm (6 in.) line of Type IV neat fluids tested during winter 1995-96. The results revealed that the Type IV fluids tested exhibited equivalent thickness profiles, and that fluid thickness started to stabilize after 10 minutes from the start of the test. Figure 4.2 shows thickness decay curves for fluids tested in the 1996-97 winter season. A comparison of thickness decay of Type IV fluids tested during winter 1996-97 shows that the thickness measurements of these neat Type IV fluids were significantly different from the 1995-96 Type IV fluids and also different from one another; Ultra+ and Kilfrost were more
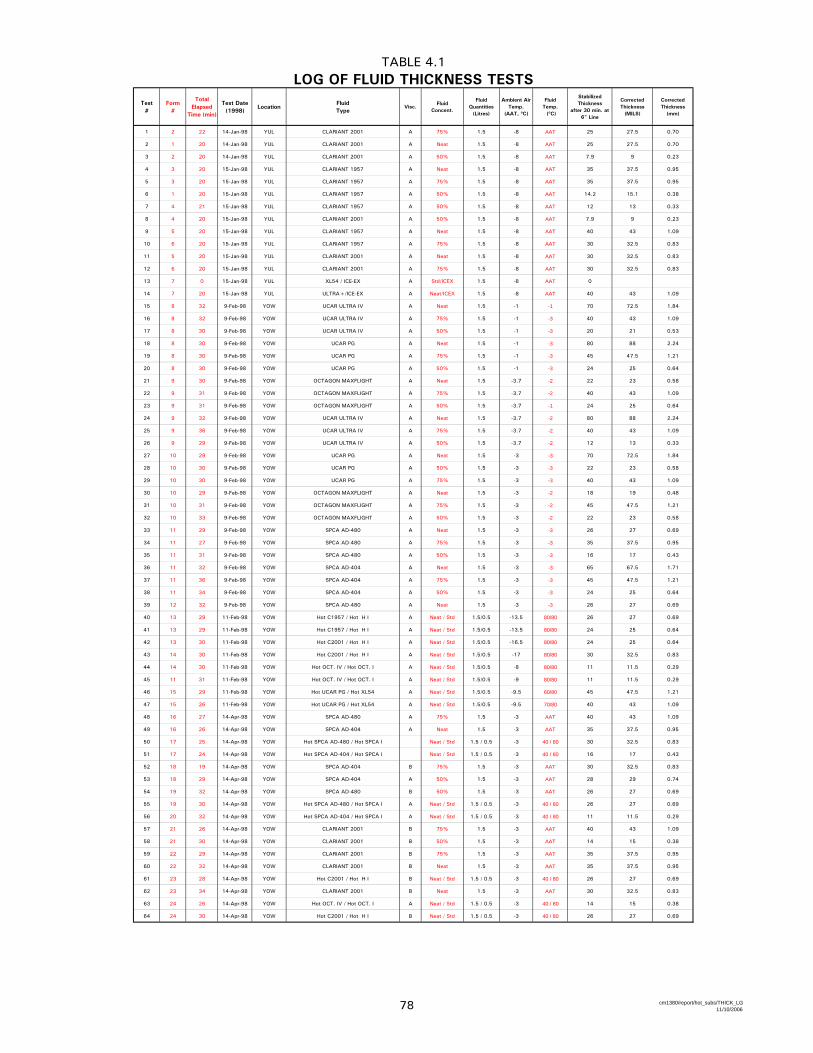
TABLE 4.1LOG OF FLUID THICKNESS TESTS
Test#
Form#
Total Elapsed
Time (min)
Test Date (1998)
LocationFluidType
Visc.Fluid
Concent.
FluidQuantities
(Litres)
Ambient Air Temp.
(AAT, ºC)
Fluid Temp. (ºC)
Stabilized Thickness
after 30 min. at 6" Line
Corrected Thickness
(MILS)
Corrected Thickness
(mm)
1 2 22 14-Jan-98 YUL CLARIANT 2001 A 75% 1.5 -8 AAT 25 27.5 0.70
2 1 20 14-Jan-98 YUL CLARIANT 2001 A Neat 1.5 -8 AAT 25 27.5 0.70
3 2 20 14-Jan-98 YUL CLARIANT 2001 A 50% 1.5 -8 AAT 7.9 9 0.23
4 3 20 15-Jan-98 YUL CLARIANT 1957 A Neat 1.5 -8 AAT 35 37.5 0.95
5 3 20 15-Jan-98 YUL CLARIANT 1957 A 75% 1.5 -8 AAT 35 37.5 0.95
6 1 20 15-Jan-98 YUL CLARIANT 1957 A 50% 1.5 -8 AAT 14.2 15.1 0.38
7 4 21 15-Jan-98 YUL CLARIANT 1957 A 50% 1.5 -8 AAT 12 13 0.33
8 4 20 15-Jan-98 YUL CLARIANT 2001 A 50% 1.5 -8 AAT 7.9 9 0.23
9 5 20 15-Jan-98 YUL CLARIANT 1957 A Neat 1.5 -8 AAT 40 43 1.09
10 6 20 15-Jan-98 YUL CLARIANT 1957 A 75% 1.5 -8 AAT 30 32.5 0.83
11 5 20 15-Jan-98 YUL CLARIANT 2001 A Neat 1.5 -8 AAT 30 32.5 0.83
12 6 20 15-Jan-98 YUL CLARIANT 2001 A 75% 1.5 -8 AAT 30 32.5 0.83
13 7 0 15-Jan-98 YUL XL54 / ICE-EX A Std/ICEX 1.5 -8 AAT 0
14 7 20 15-Jan-98 YUL ULTRA+/ICE-EX A Neat/ICEX 1.5 -8 AAT 40 43 1.09
15 8 32 9-Feb-98 YOW UCAR ULTRA IV A Neat 1.5 -1 -1 70 72.5 1.84
16 8 32 9-Feb-98 YOW UCAR ULTRA IV A 75% 1.5 -1 -3 40 43 1.09
17 8 30 9-Feb-98 YOW UCAR ULTRA IV A 50% 1.5 -1 -3 20 21 0.53
18 8 30 9-Feb-98 YOW UCAR PG A Neat 1.5 -1 -3 80 88 2.24
19 8 30 9-Feb-98 YOW UCAR PG A 75% 1.5 -1 -3 45 47.5 1.21
20 8 30 9-Feb-98 YOW UCAR PG A 50% 1.5 -1 -3 24 25 0.64
21 9 30 9-Feb-98 YOW OCTAGON MAXFLIGHT A Neat 1.5 -3.7 -2 22 23 0.58
22 9 31 9-Feb-98 YOW OCTAGON MAXFLIGHT A 75% 1.5 -3.7 -2 40 43 1.09
23 9 31 9-Feb-98 YOW OCTAGON MAXFLIGHT A 50% 1.5 -3.7 -1 24 25 0.64
24 9 32 9-Feb-98 YOW UCAR ULTRA IV A Neat 1.5 -3.7 -2 80 88 2.24
25 9 36 9-Feb-98 YOW UCAR ULTRA IV A 75% 1.5 -3.7 -2 40 43 1.09
26 9 29 9-Feb-98 YOW UCAR ULTRA IV A 50% 1.5 -3.7 -2 12 13 0.33
27 10 29 9-Feb-98 YOW UCAR PG A Neat 1.5 -3 -3 70 72.5 1.84
28 10 30 9-Feb-98 YOW UCAR PG A 50% 1.5 -3 -3 22 23 0.58
29 10 30 9-Feb-98 YOW UCAR PG A 75% 1.5 -3 -3 40 43 1.09
30 10 29 9-Feb-98 YOW OCTAGON MAXFLIGHT A Neat 1.5 -3 -2 18 19 0.48
31 10 31 9-Feb-98 YOW OCTAGON MAXFLIGHT A 75% 1.5 -3 -2 45 47.5 1.21
32 10 33 9-Feb-98 YOW OCTAGON MAXFLIGHT A 50% 1.5 -3 -2 22 23 0.58
33 11 29 9-Feb-98 YOW SPCA AD-480 A Neat 1.5 -3 -3 26 27 0.69
34 11 27 9-Feb-98 YOW SPCA AD-480 A 75% 1.5 -3 -3 35 37.5 0.95
35 11 31 9-Feb-98 YOW SPCA AD-480 A 50% 1.5 -3 -3 16 17 0.43
36 11 32 9-Feb-98 YOW SPCA AD-404 A Neat 1.5 -3 -3 65 67.5 1.71
37 11 36 9-Feb-98 YOW SPCA AD-404 A 75% 1.5 -3 -3 45 47.5 1.21
38 11 34 9-Feb-98 YOW SPCA AD-404 A 50% 1.5 -3 -3 24 25 0.64
39 12 32 9-Feb-98 YOW SPCA AD-480 A Neat 1.5 -3 -3 26 27 0.69
40 13 29 11-Feb-98 YOW Hot C1957 / Hot H I A Neat / Std 1.5/0.5 -13.5 80/80 26 27 0.69
41 13 29 11-Feb-98 YOW Hot C1957 / Hot H I A Neat / Std 1.5/0.5 -13.5 80/80 24 25 0.64
42 13 30 11-Feb-98 YOW Hot C2001 / Hot H I A Neat / Std 1.5/0.5 -16.5 80/80 24 25 0.64
43 14 30 11-Feb-98 YOW Hot C2001 / Hot H I A Neat / Std 1.5/0.5 -17 80/80 30 32.5 0.83
44 14 30 11-Feb-98 YOW Hot OCT. IV / Hot OCT. I A Neat / Std 1.5/0.5 -8 80/80 11 11.5 0.29
45 11 31 11-Feb-98 YOW Hot OCT. IV / Hot OCT. I A Neat / Std 1.5/0.5 -9 80/80 11 11.5 0.29
46 15 29 11-Feb-98 YOW Hot UCAR PG / Hot XL54 A Neat / Std 1.5/0.5 -9.5 60/80 45 47.5 1.21
47 15 26 11-Feb-98 YOW Hot UCAR PG / Hot XL54 A Neat / Std 1.5/0.5 -9.5 70/80 40 43 1.09
48 16 27 14-Apr-98 YOW SPCA AD-480 A 75% 1.5 -3 AAT 40 43 1.09
49 16 26 14-Apr-98 YOW SPCA AD-404 A Neat 1.5 -3 AAT 35 37.5 0.95
50 17 25 14-Apr-98 YOW Hot SPCA AD-480 / Hot SPCA I Neat / Std 1.5 / 0.5 -3 40 / 80 30 32.5 0.83
51 17 24 14-Apr-98 YOW Hot SPCA AD-404 / Hot SPCA I Neat / Std 1.5 / 0.5 -3 40 / 80 16 17 0.43
52 18 19 14-Apr-98 YOW SPCA AD-404 B 75% 1.5 -3 AAT 30 32.5 0.83
53 18 29 14-Apr-98 YOW SPCA AD-404 A 50% 1.5 -3 AAT 28 29 0.74
54 19 32 14-Apr-98 YOW SPCA AD-480 B 50% 1.5 -3 AAT 26 27 0.69
55 19 30 14-Apr-98 YOW Hot SPCA AD-480 / Hot SPCA I A Neat / Std 1.5 / 0.5 -3 40 / 80 26 27 0.69
56 20 32 14-Apr-98 YOW Hot SPCA AD-404 / Hot SPCA I A Neat / Std 1.5 / 0.5 -3 40 / 80 11 11.5 0.29
57 21 26 14-Apr-98 YOW CLARIANT 2001 B 75% 1.5 -3 AAT 40 43 1.09
58 21 30 14-Apr-98 YOW CLARIANT 2001 B 50% 1.5 -3 AAT 14 15 0.38
59 22 29 14-Apr-98 YOW CLARIANT 2001 B 75% 1.5 -3 AAT 35 37.5 0.95
60 22 32 14-Apr-98 YOW CLARIANT 2001 B Neat 1.5 -3 AAT 35 37.5 0.95
61 23 28 14-Apr-98 YOW Hot C2001 / Hot H I B Neat / Std 1.5 / 0.5 -3 40 / 80 26 27 0.69
62 23 34 14-Apr-98 YOW CLARIANT 2001 B Neat 1.5 -3 AAT 30 32.5 0.83
63 24 26 14-Apr-98 YOW Hot OCT. IV / Hot OCT. I A Neat / Std 1.5 / 0.5 -3 40 / 80 14 15 0.38
64 24 30 14-Apr-98 YOW Hot C2001 / Hot H I B Neat / Std 1.5 / 0.5 -3 40 / 80 26 27 0.69
78 cm1380/report/hot_subs/THICK_LG11/10/2006
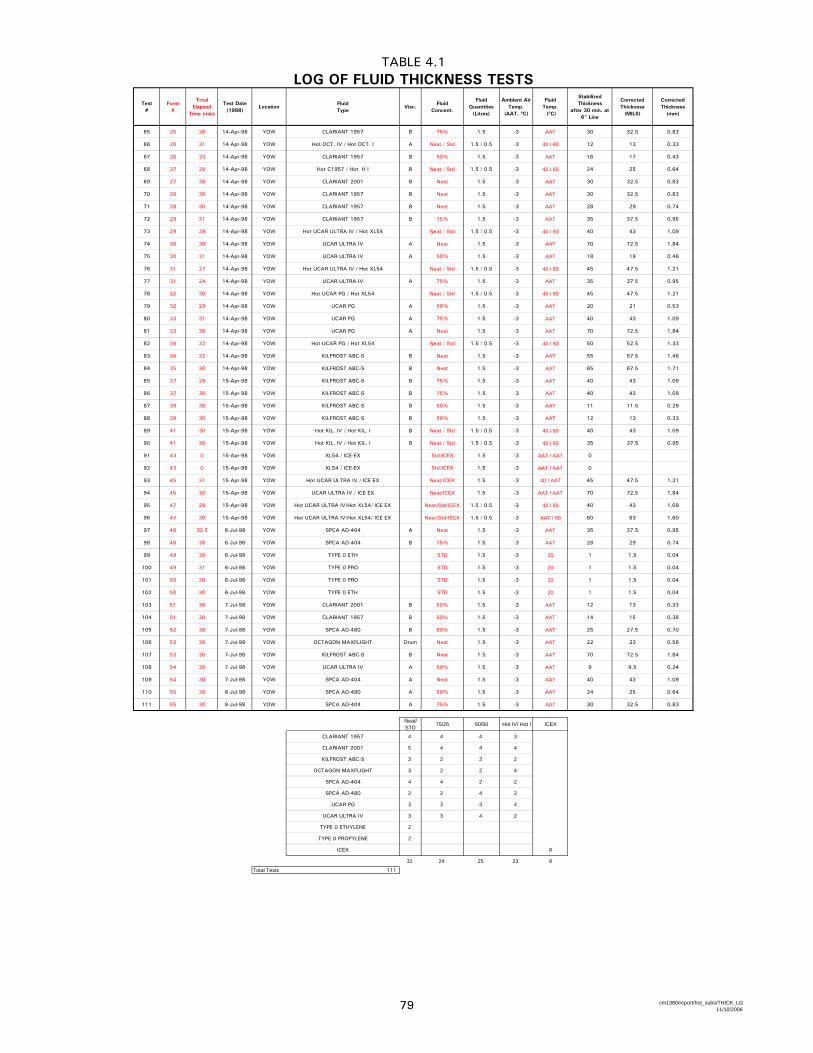
TABLE 4.1LOG OF FLUID THICKNESS TESTS
Test#
Form#
Total Elapsed
Time (min)
Test Date (1998)
LocationFluidType
Visc.Fluid
Concent.
FluidQuantities
(Litres)
Ambient Air Temp.
(AAT, ºC)
Fluid Temp. (ºC)
Stabilized Thickness
after 30 min. at 6" Line
Corrected Thickness
(MILS)
Corrected Thickness
(mm)
65 25 26 14-Apr-98 YOW CLARIANT 1957 B 75% 1.5 -3 AAT 30 32.5 0.83
66 26 31 14-Apr-98 YOW Hot OCT. IV / Hot OCT. I A Neat / Std 1.5 / 0.5 -3 40 / 80 12 13 0.33
67 26 33 14-Apr-98 YOW CLARIANT 1957 B 50% 1.5 -3 AAT 16 17 0.43
68 27 29 14-Apr-98 YOW Hot C1957 / Hot H I B Neat / Std 1.5 / 0.5 -3 40 / 80 24 25 0.64
69 27 30 14-Apr-98 YOW CLARIANT 2001 B Neat 1.5 -3 AAT 30 32.5 0.83
70 28 30 14-Apr-98 YOW CLARIANT 1957 B Neat 1.5 -3 AAT 30 32.5 0.83
71 28 30 14-Apr-98 YOW CLARIANT 1957 B Neat 1.5 -3 AAT 28 29 0.74
72 29 31 14-Apr-98 YOW CLARIANT 1957 B 75% 1.5 -3 AAT 35 37.5 0.95
73 29 29 14-Apr-98 YOW Hot UCAR ULTRA IV / Hot XL54 Neat / Std 1.5 / 0.5 -3 40 / 80 40 43 1.09
74 30 30 14-Apr-98 YOW UCAR ULTRA IV A Neat 1.5 -3 AAT 70 72.5 1.84
75 30 31 14-Apr-98 YOW UCAR ULTRA IV A 50% 1.5 -3 AAT 18 19 0.48
76 31 27 14-Apr-98 YOW Hot UCAR ULTRA IV / Hot XL54 Neat / Std 1.5 / 0.5 -3 40 / 80 45 47.5 1.21
77 31 24 14-Apr-98 YOW UCAR ULTRA IV A 75% 1.5 -3 AAT 35 37.5 0.95
78 32 30 14-Apr-98 YOW Hot UCAR PG / Hot XL54 Neat / Std 1.5 / 0.5 -3 40 / 80 45 47.5 1.21
79 32 29 14-Apr-98 YOW UCAR PG A 50% 1.5 -3 AAT 20 21 0.53
80 33 31 14-Apr-98 YOW UCAR PG A 75% 1.5 -3 AAT 40 43 1.09
81 33 30 14-Apr-98 YOW UCAR PG A Neat 1.5 -3 AAT 70 72.5 1.84
82 34 32 14-Apr-98 YOW Hot UCAR PG / Hot XL54 Neat / Std 1.5 / 0.5 -3 40 / 80 50 52.5 1.33
83 34 32 14-Apr-98 YOW KILFROST ABC-S B Neat 1.5 -3 AAT 55 57.5 1.46
84 35 30 14-Apr-98 YOW KILFROST ABC-S B Neat 1.5 -3 AAT 65 67.5 1.71
85 37 29 15-Apr-98 YOW KILFROST ABC-S B 75% 1.5 -3 AAT 40 43 1.09
86 37 30 15-Apr-98 YOW KILFROST ABC-S B 75% 1.5 -3 AAT 40 43 1.09
87 39 30 15-Apr-98 YOW KILFROST ABC-S B 50% 1.5 -3 AAT 11 11.5 0.29
88 39 30 15-Apr-98 YOW KILFROST ABC-S B 50% 1.5 -3 AAT 12 13 0.33
89 41 30 15-Apr-98 YOW Hot KIL. IV / Hot KIL. I B Neat / Std 1.5 / 0.5 -3 40 / 80 40 43 1.09
90 41 30 15-Apr-98 YOW Hot KIL. IV / Hot KIL. I B Neat / Std 1.5 / 0.5 -3 40 / 80 35 37.5 0.95
91 43 0 15-Apr-98 YOW XL54 / ICE-EX Std/ICEX 1.5 -3 AAT / AAT 0
92 43 0 15-Apr-98 YOW XL54 / ICE-EX Std/ICEX 1.5 -3 AAT / AAT 0
93 45 31 15-Apr-98 YOW Hot UCAR ULTRA IV / ICE EX Neat/ICEX 1.5 -3 40 / AAT 45 47.5 1.21
94 45 30 15-Apr-98 YOW UCAR ULTRA IV / ICE EX Neat/ICEX 1.5 -3 AAT / AAT 70 72.5 1.84
95 47 29 15-Apr-98 YOW Hot UCAR ULTRA IV/Hot XL54/ ICE EX Neat/Std/ICEX 1.5 / 0.5 -3 40 / 80 40 43 1.09
96 47 30 15-Apr-98 YOW Hot UCAR ULTRA IV/Hot XL54/ ICE EX Neat/Std/ICEX 1.5 / 0.5 -3 AAT / 80 60 63 1.60
97 48 30.5 6-Jul-98 YOW SPCA AD-404 A Neat 1.5 -3 AAT 35 37.5 0.95
98 48 38 6-Jul-98 YOW SPCA AD-404 B 75% 1.5 -3 AAT 28 29 0.74
99 49 30 6-Jul-98 YOW TYPE 0 ETH STD 1.5 -3 20 1 1.5 0.04
100 49 31 6-Jul-98 YOW TYPE 0 PRO STD 1.5 -3 20 1 1.5 0.04
101 50 30 6-Jul-98 YOW TYPE 0 PRO STD 1.5 -3 20 1 1.5 0.04
102 50 30 6-Jul-98 YOW TYPE 0 ETH STD 1.5 -3 20 1 1.5 0.04
103 51 30 7-Jul-98 YOW CLARIANT 2001 B 50% 1.5 -3 AAT 12 13 0.33
104 51 30 7-Jul-98 YOW CLARIANT 1957 B 50% 1.5 -3 AAT 14 15 0.38
105 52 30 7-Jul-98 YOW SPCA AD-480 B 50% 1.5 -3 AAT 25 27.5 0.70
106 53 30 7-Jul-98 YOW OCTAGON MAXFLIGHT Drum Neat 1.5 -3 AAT 22 23 0.58
107 53 30 7-Jul-98 YOW KILFROST ABC-S B Neat 1.5 -3 AAT 70 72.5 1.84
108 54 30 7-Jul-98 YOW UCAR ULTRA IV A 50% 1.5 -3 AAT 9 9.5 0.24
109 54 30 7-Jul-98 YOW SPCA AD-404 A Neat 1.5 -3 AAT 40 43 1.09
110 55 30 8-Jul-98 YOW SPCA AD-480 A 50% 1.5 -3 AAT 24 25 0.64
111 55 30 8-Jul-98 YOW SPCA AD-404 A 75% 1.5 -3 AAT 30 32.5 0.83
Neat/STD 75/25 50/50 Hot IV/ Hot I ICEX
CLARIANT 1957 4 4 4 3
CLARIANT 2001 5 4 4 4
KILFROST ABC-S 3 2 2 2
OCTAGON MAXFLIGHT 3 2 2 4
SPCA AD-404 4 4 2 2
SPCA AD-480 2 2 4 2
UCAR PG 3 3 3 4
UCAR ULTRA IV 3 3 4 2
TYPE 0 ETHYLENE 2
TYPE 0 PROPYLENE 2
ICEX 8
31 24 25 23 8
Total Tests 111
79 cm1380/report/hot_subs/THICK_LG11/10/2006
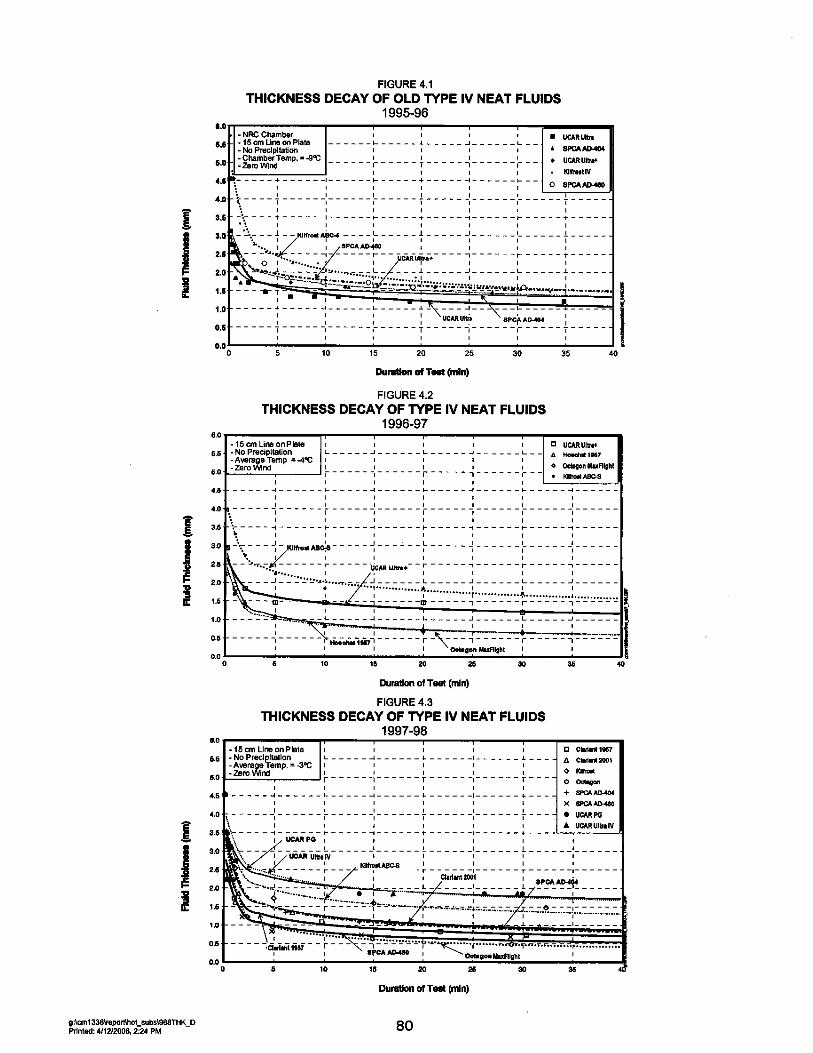
4. FLUID THICKNESS TESTS ON FLAT PLATES 4.1 General Procedures and Stabilised Neat Fluid Profiles
X:\@APS ARCHIVE\CM1380 (TDC Deicing 1997-98)\REPORT\HOT_SUB\Final Version 1.0\Final Version 1.0.DOC Final Version 1.0, October 06 81
than twice the thickness of Octagon and Hoechst MPIV 1957, after 30 minutes. Figure 4.3 shows thickness decay curves for fluids tested in the 1997-98 winter season. Most of the fluids tested follow the same thickness profile as previous years’ tests. UCAR Ultra IV and UCAR PG AAF, which did not satisfy SAE specifications, were almost twice the thickness of SPCA AD-404 and Clariant MPIV 2001, and almost four times the thickness of Octagon MaxFlight and SPCA AD-480.
Figure 4.4 shows eight bar graphs, each one corresponding to a specific Type IV fluid brand. Each bar gives the fluid thickness at the 15 cm line of a standard test plate, 30 minutes after fluid application. The number of tests used to produce each of the eight graphs is indicated in the small box (top centre) of each graph. Several tests were performed for each standard dilution (Neat, 75/25, and 50/50), as well as for two-step fluid applications. Results of thickness tests performed during the 1996-97 season were included for both Kilfrost ABC-S, and Octagon MaxFlight.
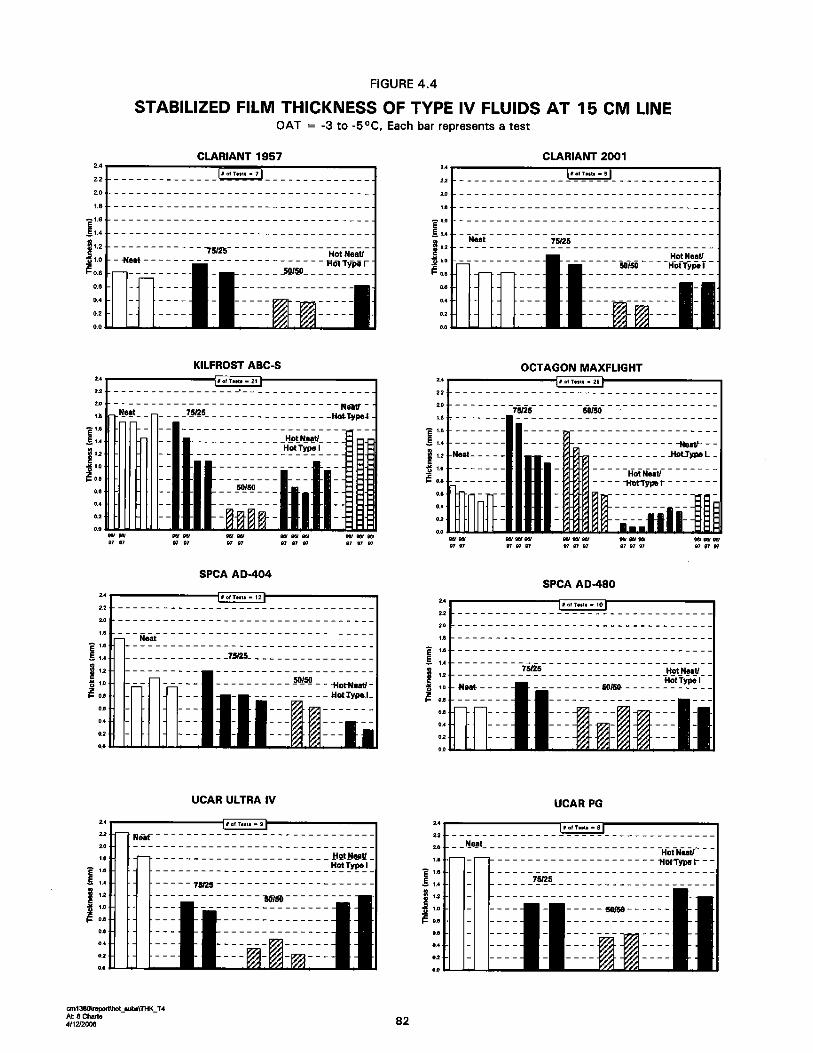
4. FLUID THICKNESS TESTS ON FLAT PLATES 4.2 Dilution Effect
X:\@APS ARCHIVE\CM1380 (TDC Deicing 1997-98)\REPORT\HOT_SUB\Final Version 1.0\Final Version 1.0.DOC Final Version 1.0, October 06 83
4.2 Dilution Effect
The following is a point-form summary of some observations from Figure 4.4. • Clariant MPIV 1957 and Clariant MPIV 2001 Type IV neat fluids showed
increased thickness in diluted form 75/25, but the 50/50 formulation showed a decrease;
• Kilfrost ABC-S 75/25 showed only a slight decrease in thickness. The
50/50 thickness of the mix decreased significantly; • Octagon Type IV fluid thickness increased two to three times when
diluted; • SPCA AD-404 75/25 and 50/50 both showed a slight decrease in
thickness; • SPCA AD-480 75/25 showed a slight increase in thickness; and • UCAR Ultra IV and UCAR PG AAF both showed a significant decrease in
thickness when diluted with water.
4. FLUID THICKNESS TESTS ON FLAT PLATES 4.3 Tank Heating Effect
X:\@APS ARCHIVE\CM1380 (TDC Deicing 1997-98)\REPORT\HOT_SUB\Final Version 1.0\Final Version 1.0.DOC Final Version 1.0, October 06 84
4.3 Tank Heating Effect During the 1996-97 full-scale aircraft tests, it was observed that the Type IV fluid sprayed by the airlines was in many cases hot. This was caused by the heat transferred to the Type IV tank from the heated Type I tank situated in close proximity. To study the effect of heat on Type IV fluids, several two-step fluid application tests were conducted in which the Type I and Type IV fluids were pre-heated to 80 and 40ºC, respectively. Type IV fluids were heated to 40ºC with 1000 W hot plate burners, using a double-boiler system (see Photo 4.2). The double-boiler system prevents any part of the fluid from exceeding temperatures greater than 100°C because the fluid and the first boiler are in contact with the water in the second boiler. It was found that most tests in which a heated Type IV fluid was applied over a heated Type I fluid a considerable decrease in thickness was observed relative to tests that were conducted with Type IV fluids at ambient temperatures. Consequently, potential reductions in holdover time protection can arise. This investigation is further detailed in Section 6.
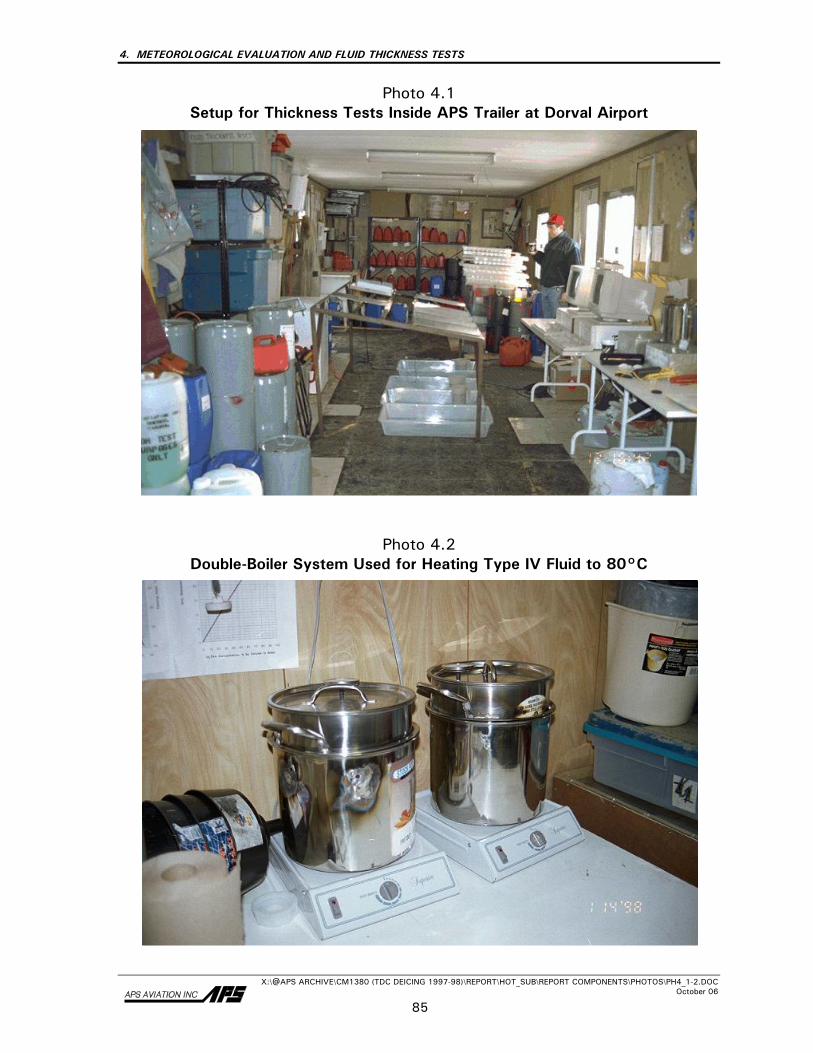
4. METEOROLOGICAL EVALUATION AND FLUID THICKNESS TESTS
X:\@APS ARCHIVE\CM1380 (TDC DEICING 1997-98)\REPORT\HOT_SUB\REPORT COMPONENTS\PHOTOS\PH4_1-2.DOC October 06
85
Photo 4.1 Setup for Thickness Tests Inside APS Trailer at Dorval Airport
Photo 4.2 Double-Boiler System Used for Heating Type IV Fluid to 80°C

86
This page intentionally left blank.
5. HOLDOVER TIME TABLES, RESULTS, AND DISCUSSIONS 5.1 Background
X:\@APS ARCHIVE\CM1380 (TDC Deicing 1997-98)\REPORT\HOT_SUB\Final Version 1.0\Final Version 1.0.DOC Final Version 1.0, October 06 87
5. HOLDOVER TIME TABLES, RESULTS, AND DISCUSSIONS
The methods used to evaluate the test data are reviewed in Subsection 2.9. In this section, the officially accepted holdover time tables are presented, and important findings are discussed. Beginning with Type IV fluid results in Subsection 5.2, the different categories of precipitation are presented one at a time, in a cell-by-cell fashion. Comments and discussions follow. Type III fluids are discussed in Subsection 5.3, Type I in Subsection 5.4, and Type II in Subsection 5.5. Subsection 5.6 presents all the holdover time tables, including the generic Type IV SAE holdover time table and all the Type IV fluid-specific tables. These are the tables proposed for worldwide use during the 1998-99 winter season.
5.1 Background Eight Type IV fluids were provided to APS for 1997-98 testing, including three fluids that had previously been tested: Kilfrost ABC-S, Octagon MaxFlight, and SPCA AD-404. Results of tests performed on these eight fluids were used to determine SAE holdover times for 1998-99. Two other certified fluids, Hoechst MPIV 1957 and Union Carbide Ultra +, were tested in 1996-97. Holdover time results of these fluids were also used in the determination of 1998-99 SAE holdover times. Clariant MPIV 1957 is a reformulation of the Hoechst MPIV 1957 fluid. Prior to the writing of this report, APS was notified that Hoechst MPIV 1957 was no longer commercially available. As a result, fluid-specific holdover times for MPIV 1957 fluid will be those solely of the new Clariant formulation. At the Workgroup meeting on Laboratory Methods to Derive Holdover Time Guidelines in Montreal in November 1997, it was decided that low viscosity fluid samples should be tested in future holdover time tests, as they represent the lowest on-wing viscosity expected in the field. This would result in more conservative holdover time values. Subsequently, APS requested that fluid manufacturers ship pre-sheared fluid representative of the lower end of the production viscosity range for 1997-98 test purposes. Following several holdover time test sessions at the Dorval site, the results for Kilfrost fluid were found to be inferior to those obtained in previous tests conducted with the same fluid. As a result, APS examined the different batches of fluid delivered by the manufacturers. The Kilfrost fluid was found to have a viscosity level below the production range for this fluid. In fact, the samples provided to APS were those of the 80-minute Kilfrost fluid. Examination of the viscosity levels of the other fluids revealed other inconsistencies. The fluid samples for Clariant MPIV 1957 and MPIV 2001
5. HOLDOVER TIME TABLES, RESULTS, AND DISCUSSIONS 5.1 Background
X:\@APS ARCHIVE\CM1380 (TDC Deicing 1997-98)\REPORT\HOT_SUB\Final Version 1.0\Final Version 1.0.DOC Final Version 1.0, October 06 88
were believed to be at the low end of the production range for these fluids. The remainder of the fluid samples provided to APS had viscosity levels representative of the mid-production range, not the lower end of the production range as requested. The normalized viscosity levels of the fluid samples sent to APS are shown at the bottom of Table 5.1. For example, the viscosity of the first Clariant MPIV 1957 sample was approximately 20 percent below the lower viscosity production limit for this fluid. The second Clariant MPIV 1957 sample had viscosity levels representative of mid-production range viscosity fluid.
Prior to the start of freezing drizzle, light freezing rain, freezing fog, and rain on a cold-soaked wing testing at NRC’s CEF in April 1998, APS requested that Kilfrost and Clariant provide mid-range viscosity fluids for these tests. This was done to ensure that all fluids were tested on an even basis. Comparative holdover time tests were performed using the first and second batches of Clariant and Kilfrost fluids. In general, the mid-viscosity batches of Kilfrost ABC-S and Clariant MPIV 1957 fluids outperformed the low-viscosity batches of the same fluids. The holdover time results of the two batches of Clariant MPIV 2001 were similar. It was later discovered that the original Clariant MPIV 2001 samples, which were thought to be at the lower end of the production viscosity range, were in fact representative of mid-range viscosity fluid.
The holdover time results obtained with one Type IV fluid were lower than those achieved with the same fluid in the previous year. A series of holdover time tests were subsequently performed to compare the holdover times of 1996-97 and 1997-98 fluid samples in light freezing rain. When pouring the fluids onto the flat plates, it was immediately noticed that the appearance of the samples was significantly different. The 1996-97 sample was translucent, while the 1997-98 sample was murky (see Photo 5.1). The holdover times of the 1997-98 sample were inferior to those of the 1996-97 sample in all dilutions.
The data sets used to analyse the results and generate regression curves for each fluid are shown in Table 5.1. • For SPCA AD-480, mid-production range viscosity samples were used for
all tests. • Due to a lack of data points for SPCA AD-404 in snow, 1995-96 and
1997-98 results were combined. For all other conditions with this fluid, a mid-range viscosity sample was tested.
FIGURE 5.1DATA USED FOR EVALUATION OF HOLDOVER TIMES
Cold Chamber
Outdoor Snow
Freezing Drizzle/ Freezing Rain
Freezing Fog Cold-Soaked
Wing
Ultra IV 1997-98 1997-98
SPCA AD-480 1997-98 1997-98
Clariant 2001 1997-98 1997-98 (mid-viscosity)
Clariant 1957 1997-98 1997-98 (mid-viscosity)
UCAR PG 1997-98 1997-98
Kilfrost ABC-S 1996-97 1997-98 (mid-viscosity)
Octagon MaxFlight 1996-97 1997-98
SPCA AD-404 1995-96 & 1997-98 1997-98
Viscosity* of Fluid SamplesShipped for 1997/98 Testing
-100
-80
-60
-40
-20
0
20
40
60
80
100
Cla
riant
195
7(L
ow V
isco
sity
)
Cla
riant
195
7(M
id V
isco
sity
)
Cla
riant
200
1(M
id V
isco
sity
)
Cla
riant
200
1(M
id V
isco
sity
)
Kilf
rost
AB
C-S
(Low
Vis
cosi
ty)
Kilf
rost
AB
C-S
(Mid
Vis
cosi
ty)
Oct
agon
IV
UC
AR
Ultr
a 4
UC
AR
PG
SP
CA
404
SP
CA
480
Manufa
cture
r's
Pro
duct
ion
Vis
cosi
ty r
ange
Natural SnowZR-, ZD, Zfog, CSW
* Based on best available manufacturer supplied
High
Low
89x:\cm1380\report\hot_subs\DATA_USD.ppt
5. HOLDOVER TIME TABLES, RESULTS, AND DISCUSSIONS 5.1 Background
X:\@APS ARCHIVE\CM1380 (TDC Deicing 1997-98)\REPORT\HOT_SUB\Final Version 1.0\Final Version 1.0.DOC Final Version 1.0, October 06 90
• For Clariant MPIV 1957, the sample used in natural snow tests was below the lower end of the production viscosity range. For all other tests with this fluid, a mid-production range viscosity fluid was used.
• For Clariant MPIV 2001, mid-production range viscosity samples were
used for all tests. • Kilfrost ABC-S snow tests were performed with a low viscosity sample.
In order not to penalize Kilfrost, the holdover time values for this fluid in snow were taken from the fluid-specific table developed for 1997-98 operations. A mid-production range viscosity sample was used for all other tests. The lowest of the 1997-98 and 1998-99 Kilfrost values in freezing drizzle and light freezing rain were selected for the new fluid-specific table for Kilfrost fluid.
• Due to a lack of data points for Octagon MaxFlight in snow, the holdover
time values for this fluid are those that appear in the 1997-98 Octagon fluid-specific table. A mid-viscosity sample was used for all other conditions. The lowest of the 1997-98 and 1998-99 Octagon values in freezing drizzle and light freezing rain were chosen and placed in the new Octagon fluid-specific table.
• Union Carbide Ultra+ was not tested extensively in 1997-98 and, as
such, the values in the fluid-specific table for Ultra+ are those from tests conducted in 1996-97.
5. HOLDOVER TIME TABLES, RESULTS AND DISCUSSIONS 5.2 Type IV Fluids
X:\@APS ARCHIVE\CM1380 (TDC Deicing 1997-98)\REPORT\HOT_SUB\Final Version 1.0\Final Version 1.0.DOC Final Version 1.0, October 06 91
5.2 Type IV Fluids Eight Type IV fluids from five different manufacturers were tested during the winter 1997-98 test season. After considerable discussion at the SAE G-12 meetings in Vienna, it was determined that two fluids, Union Carbide PG AAF and Union Carbide Ultra 4, did not meet all qualifying criteria. APS had conducted 383 fluid failure tests with these two fluids in all precipitation conditions prior to this finding. In total, eight different fluids, tested in 1996-97 and 1997-98, were used to develop the SAE holdover time table for Type IV fluid: Clariant MPIV 1957, Clariant MPIV 2001, Hoechst MPIV 1957, Kilfrost ABC-S, Octagon MaxFlight, SPCA AD-404, SPCA AD-480, and Union Carbide Ultra+.
5.2.1 Natural Snow
The natural snow holdover time data originated from tests conducted by APS at the Dorval Airport test facility. The fluid failure time versus precipitation rate data have been plotted either as a function of temperature or as a function of fluid brand (see Appendix E). The latter plot format lends itself more easily to the cell-by-cell presentation of results for each category of precipitation. It is used here to present the changes proposed to the holdover times and to allow direct comparison with the numbers obtained from the regression analyses.
The following section contains comparisons between last year’s and this year’s holdover time results in the snow column. They are arranged in tabular form and follow the sequence of temperature ranges as they appear in the holdover time tables, from top to bottom.
5.2.1.1 Changes to Type IV fluid holdover times for snow The tables are formatted to show columns containing the 1997-98 SAE, 1998-99 SAE, and the fluid-specific holdover times for 1997-98 and 1998-99 for each cell in the holdover time tables. The first horizontal set of values is the SAE and fluid-specific holdover times used in operations in 1997-98. The second set of values is the SAE and fluid-specific holdover times accepted for use in 1998-99. The underlined holdover time values in each of the tables indicate the fluids responsible for the SAE holdover time.
5. HOLDOVER TIME TABLES, RESULTS AND DISCUSSIONS 5.2 Type IV Fluids
X:\@APS ARCHIVE\CM1380 (TDC Deicing 1997-98)\REPORT\HOT_SUB\Final Version 1.0\Final Version 1.0.DOC Final Version 1.0, October 06 92
Due to space limitations, the following fluid codes are used in each of the tables:
Fluid Code Hoechst MPIV 1957 H-1957 Kilfrost ABC-S K-ABC-S Octagon MaxFlight Oct Max Union Carbide Ultra+ Ultra+ Clariant MPIV 1957 C-1957 Clariant MPIV 2001 C-2001 SPCA AD-404 S-404 SPCA AD-480 S-480
i) Neat fluid, above 0°C, snow (Figure 5.1)
1997-98 SAE H-1957 K-ABC-S Oct Max Ultra+ 0:45-1:25 0:45-1:25 1:10-2:00 1:15-2:00 0:50-1:40 1998-99 SAE C-1957 C-2001 K-ABC-S Oct Max Ultra+ (do not use) S-404 S-480 0:45-1:25 1:05-2:00 1:55-2:00 1:10-2:00 1:15-2:0 0:50-1:40 1:40-2:00 1:10-2:00
The SAE holdover time in this cell has not changed, and is based on the performance of a certified fluid tested last year. Once again, it was decided at the Vienna meeting that the SAE numbers would not be increased based on the results of current tests, since previously certified fluids with lower holdover times may still be in use. Several upper holdover times have been limited to two hours in order to prevent the appearance of excessively long holdover times in the holdover time tables.
ii) 75/25 fluid, above 0°C, snow (Figure 5.2)
1997-98 SAE H-1957 K-ABC-S Oct Max Ultra+ (do not use) 0:20-0:40 0:35-1:00 0:35-1:05 1:20-2:00 0:20-0:40 1998-99 SAE C-1957 C-2001 K-ABC-S Oct Max Ultra+ (do not use) S-404 S-480 0:20-0:40 0:45-1:25 0:50-1:25 0:35-1:05 1:20-2:00 0:50-1:50 1:00-1:55
Once again, the SAE holdover time numbers in this cell remain unchanged from last year, and are based on the results of diluted Ultra+ fluid, tested last year. Prior to the publication of the 1997-98 holdover time tables, Union Carbide transmitted a notice stating that diluted forms of Ultra+ were no longer recommended for operational use due to performance deficiencies noted in qualifying tests. Holdover times for dilutions of this fluid will continue to be presented in this report only for the purpose of identifying the fluid(s) responsible for the SAE holdover times. The
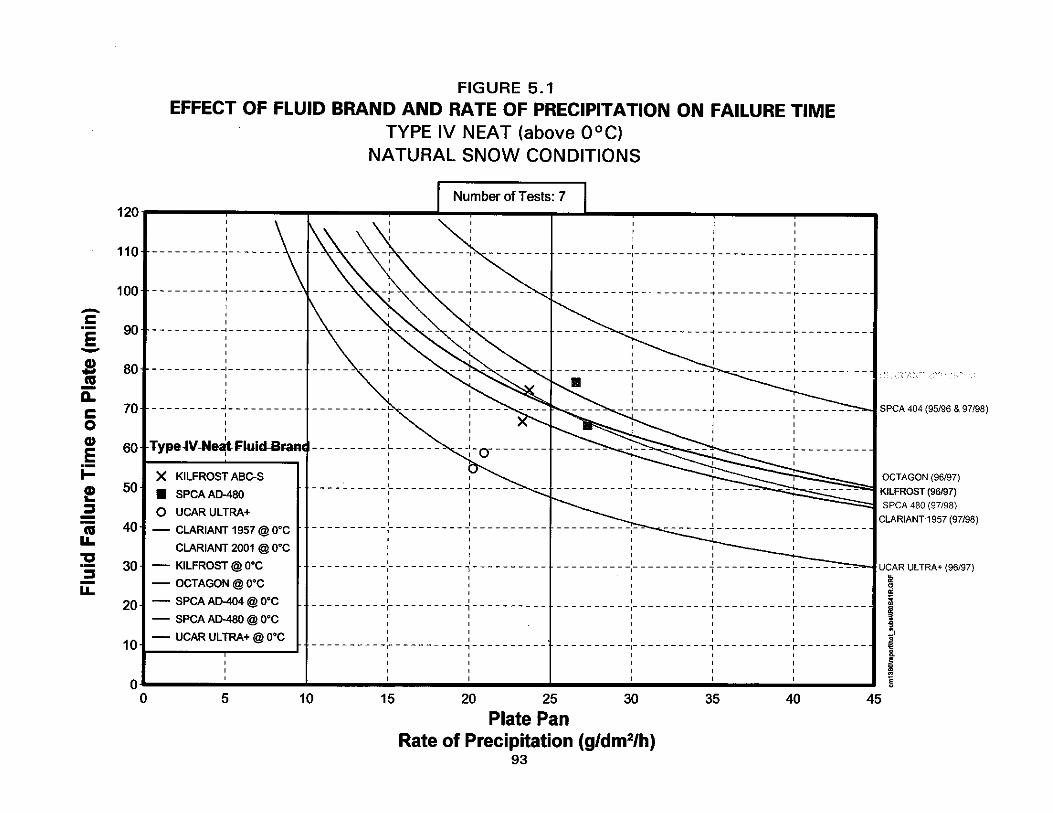
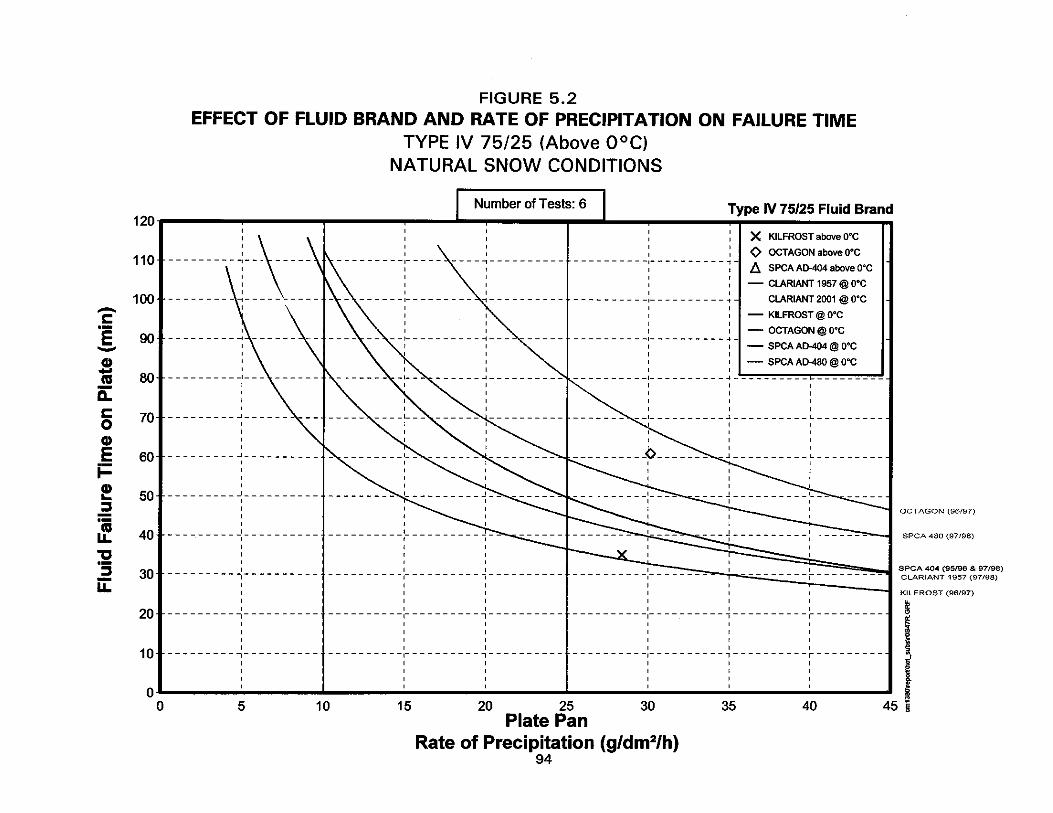
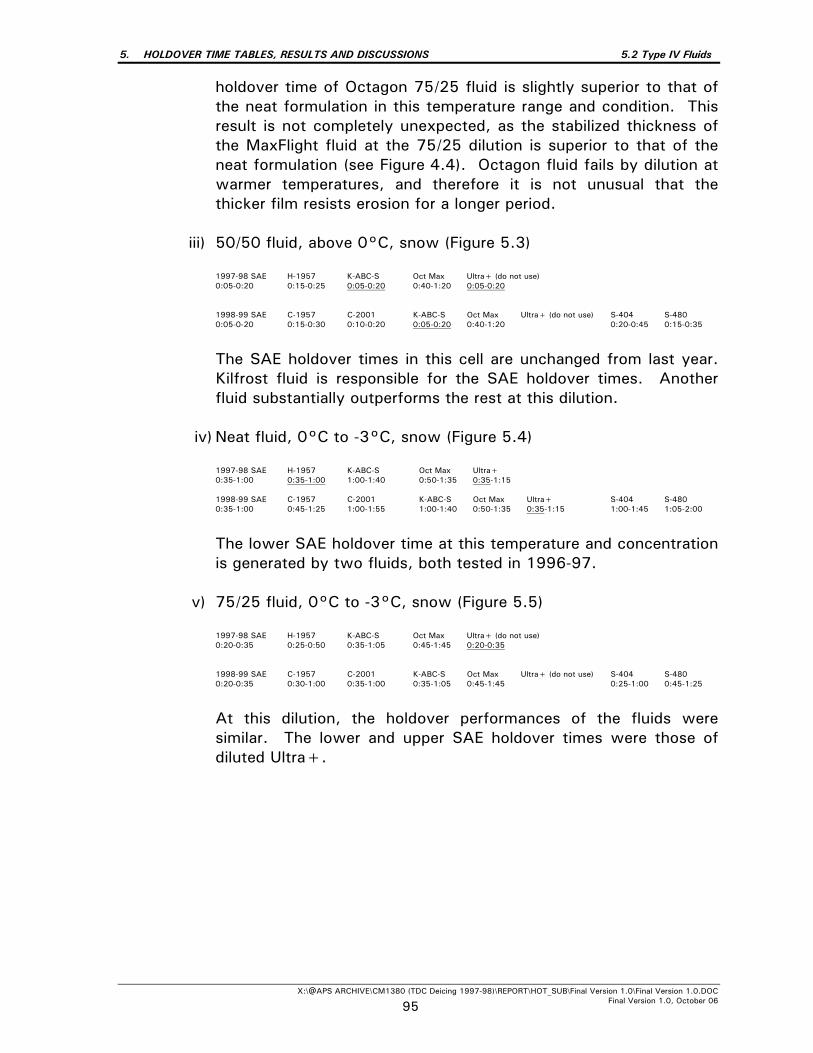
5. HOLDOVER TIME TABLES, RESULTS AND DISCUSSIONS 5.2 Type IV Fluids
X:\@APS ARCHIVE\CM1380 (TDC Deicing 1997-98)\REPORT\HOT_SUB\Final Version 1.0\Final Version 1.0.DOC Final Version 1.0, October 06 95
holdover time of Octagon 75/25 fluid is slightly superior to that of the neat formulation in this temperature range and condition. This result is not completely unexpected, as the stabilized thickness of the MaxFlight fluid at the 75/25 dilution is superior to that of the neat formulation (see Figure 4.4). Octagon fluid fails by dilution at warmer temperatures, and therefore it is not unusual that the thicker film resists erosion for a longer period.
iii) 50/50 fluid, above 0°C, snow (Figure 5.3) 1997-98 SAE H-1957 K-ABC-S Oct Max Ultra+ (do not use) 0:05-0:20 0:15-0:25 0:05-0:20 0:40-1:20 0:05-0:20 1998-99 SAE C-1957 C-2001 K-ABC-S Oct Max Ultra+ (do not use) S-404 S-480 0:05-0-20 0:15-0:30 0:10-0:20 0:05-0:20 0:40-1:20 0:20-0:45 0:15-0:35
The SAE holdover times in this cell are unchanged from last year. Kilfrost fluid is responsible for the SAE holdover times. Another fluid substantially outperforms the rest at this dilution.
iv) Neat fluid, 0°C to -3°C, snow (Figure 5.4) 1997-98 SAE H-1957 K-ABC-S Oct Max Ultra+ 0:35-1:00 0:35-1:00 1:00-1:40 0:50-1:35 0:35-1:15 1998-99 SAE C-1957 C-2001 K-ABC-S Oct Max Ultra+ S-404 S-480 0:35-1:00 0:45-1:25 1:00-1:55 1:00-1:40 0:50-1:35 0:35-1:15 1:00-1:45 1:05-2:00
The lower SAE holdover time at this temperature and concentration is generated by two fluids, both tested in 1996-97.
v) 75/25 fluid, 0°C to -3°C, snow (Figure 5.5) 1997-98 SAE H-1957 K-ABC-S Oct Max Ultra+ (do not use) 0:20-0:35 0:25-0:50 0:35-1:05 0:45-1:45 0:20-0:35 1998-99 SAE C-1957 C-2001 K-ABC-S Oct Max Ultra+ (do not use) S-404 S-480 0:20-0:35 0:30-1:00 0:35-1:00 0:35-1:05 0:45-1:45 0:25-1:00 0:45-1:25
At this dilution, the holdover performances of the fluids were similar. The lower and upper SAE holdover times were those of diluted Ultra+.
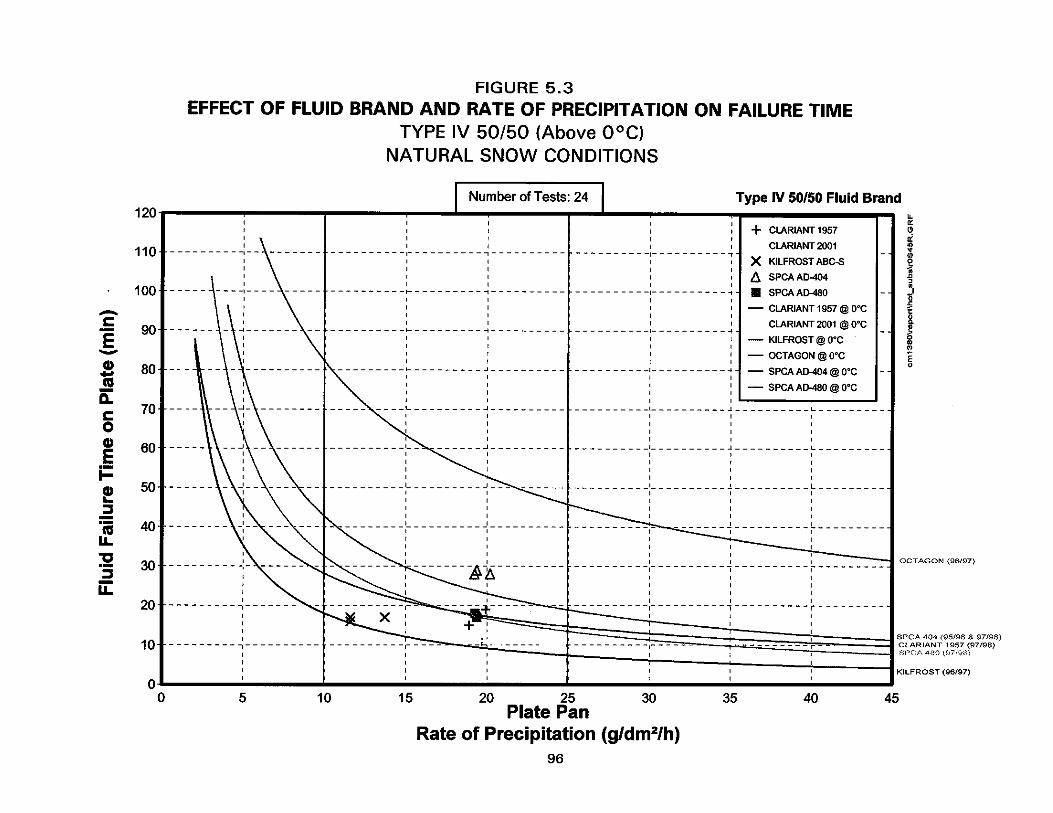
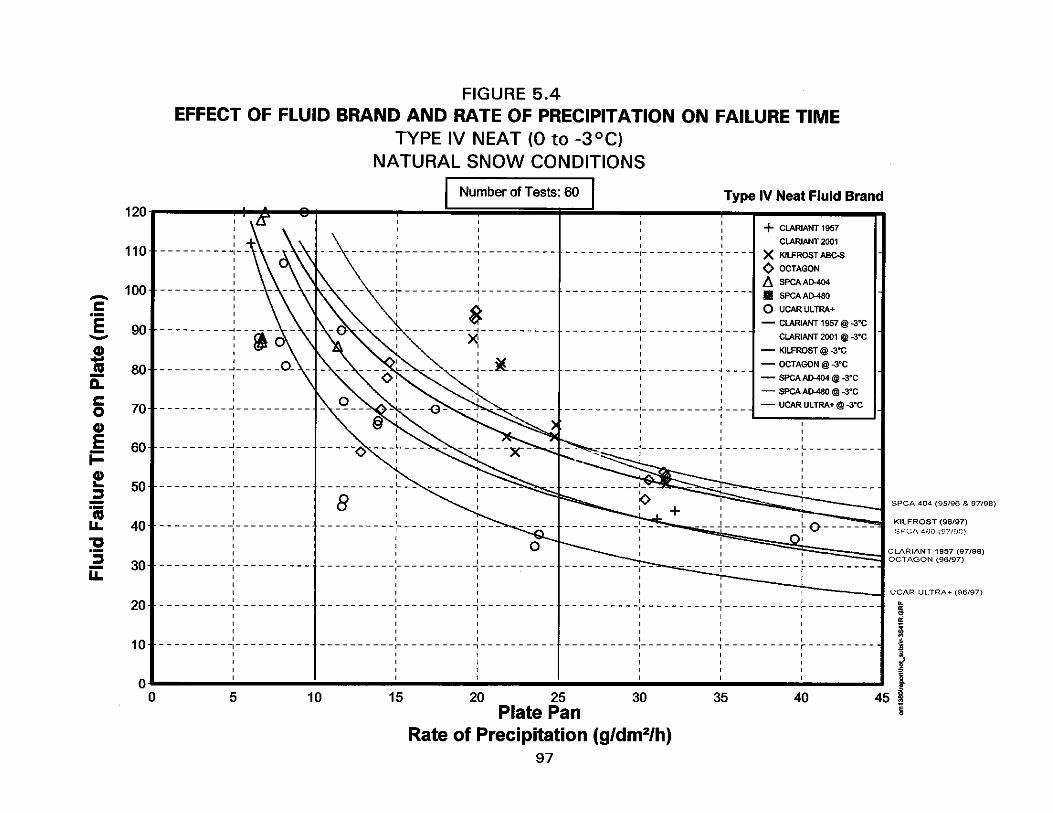
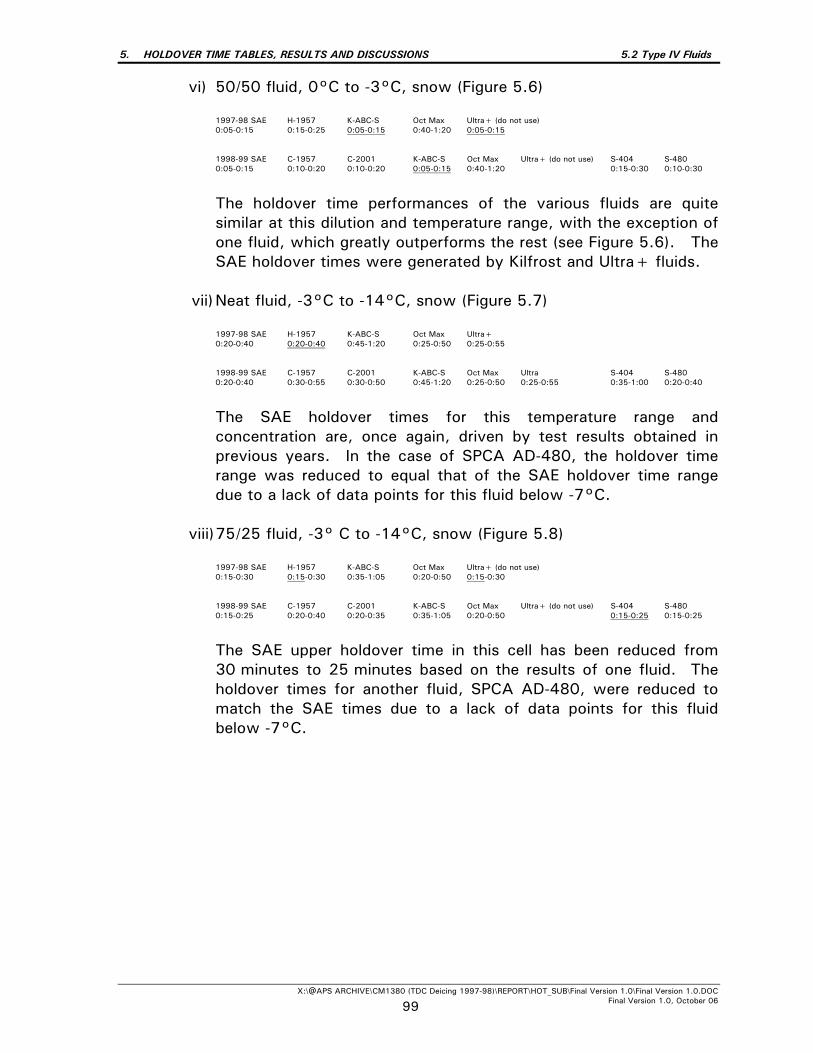
5. HOLDOVER TIME TABLES, RESULTS AND DISCUSSIONS 5.2 Type IV Fluids
X:\@APS ARCHIVE\CM1380 (TDC Deicing 1997-98)\REPORT\HOT_SUB\Final Version 1.0\Final Version 1.0.DOC Final Version 1.0, October 06 99
vi) 50/50 fluid, 0°C to -3°C, snow (Figure 5.6) 1997-98 SAE H-1957 K-ABC-S Oct Max Ultra+ (do not use) 0:05-0:15 0:15-0:25 0:05-0:15 0:40-1:20 0:05-0:15 1998-99 SAE C-1957 C-2001 K-ABC-S Oct Max Ultra+ (do not use) S-404 S-480 0:05-0:15 0:10-0:20 0:10-0:20 0:05-0:15 0:40-1:20 0:15-0:30 0:10-0:30
The holdover time performances of the various fluids are quite similar at this dilution and temperature range, with the exception of one fluid, which greatly outperforms the rest (see Figure 5.6). The SAE holdover times were generated by Kilfrost and Ultra+ fluids.
vii) Neat fluid, -3°C to -14°C, snow (Figure 5.7) 1997-98 SAE H-1957 K-ABC-S Oct Max Ultra+ 0:20-0:40 0:20-0:40 0:45-1:20 0:25-0:50 0:25-0:55 1998-99 SAE C-1957 C-2001 K-ABC-S Oct Max Ultra S-404 S-480 0:20-0:40 0:30-0:55 0:30-0:50 0:45-1:20 0:25-0:50 0:25-0:55 0:35-1:00 0:20-0:40
The SAE holdover times for this temperature range and concentration are, once again, driven by test results obtained in previous years. In the case of SPCA AD-480, the holdover time range was reduced to equal that of the SAE holdover time range due to a lack of data points for this fluid below -7°C.
viii) 75/25 fluid, -3° C to -14°C, snow (Figure 5.8) 1997-98 SAE H-1957 K-ABC-S Oct Max Ultra+ (do not use) 0:15-0:30 0:15-0:30 0:35-1:05 0:20-0:50 0:15-0:30 1998-99 SAE C-1957 C-2001 K-ABC-S Oct Max Ultra+ (do not use) S-404 S-480 0:15-0:25 0:20-0:40 0:20-0:35 0:35-1:05 0:20-0:50 0:15-0:25 0:15-0:25
The SAE upper holdover time in this cell has been reduced from 30 minutes to 25 minutes based on the results of one fluid. The holdover times for another fluid, SPCA AD-480, were reduced to match the SAE times due to a lack of data points for this fluid below -7°C.
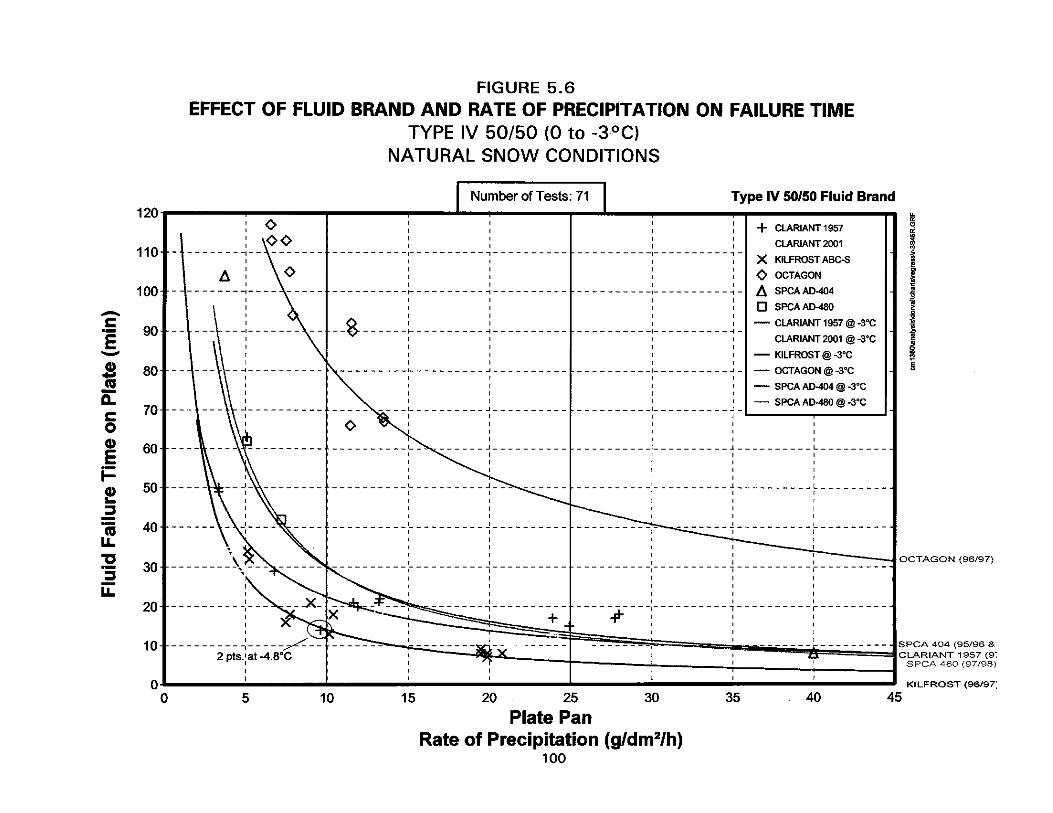
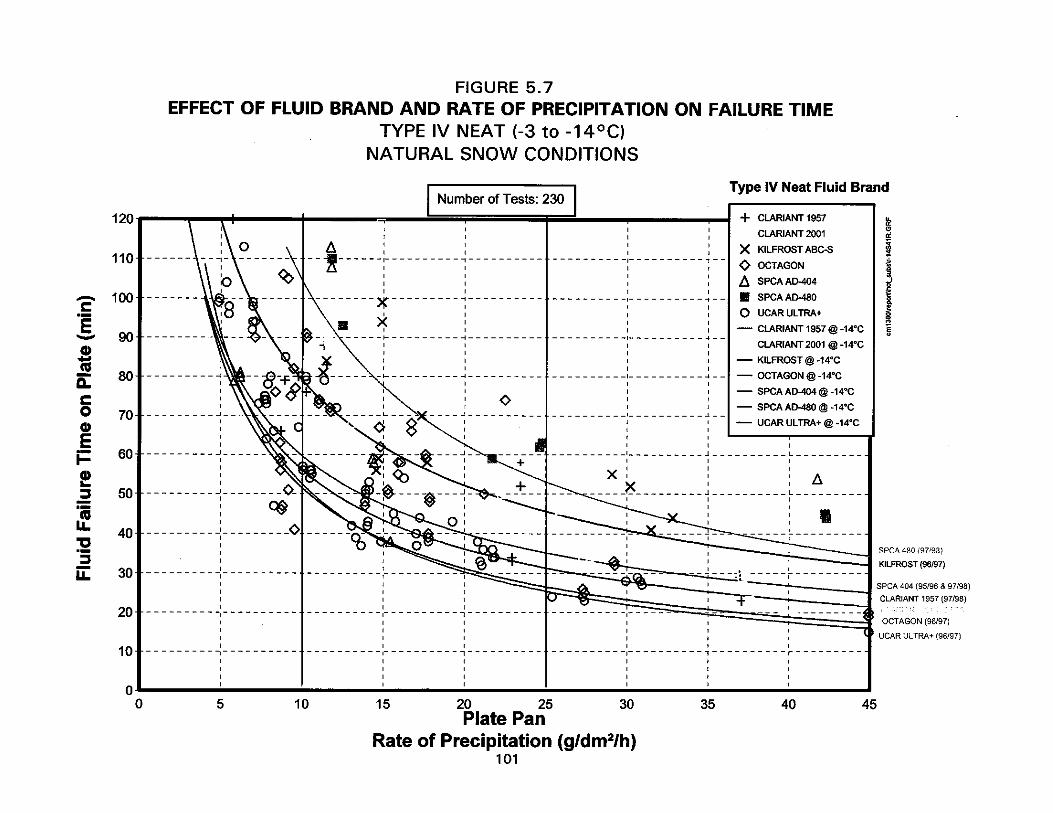
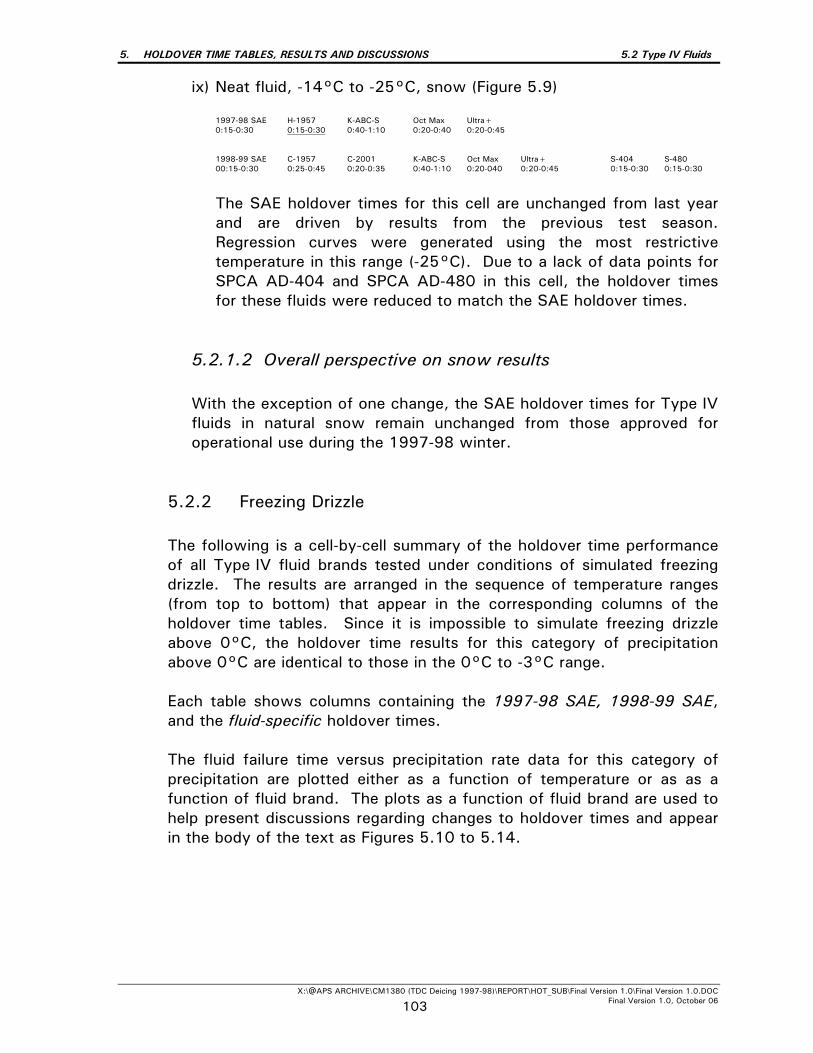
5. HOLDOVER TIME TABLES, RESULTS AND DISCUSSIONS 5.2 Type IV Fluids
X:\@APS ARCHIVE\CM1380 (TDC Deicing 1997-98)\REPORT\HOT_SUB\Final Version 1.0\Final Version 1.0.DOC Final Version 1.0, October 06 103
ix) Neat fluid, -14°C to -25°C, snow (Figure 5.9) 1997-98 SAE H-1957 K-ABC-S Oct Max Ultra+ 0:15-0:30 0:15-0:30 0:40-1:10 0:20-0:40 0:20-0:45 1998-99 SAE C-1957 C-2001 K-ABC-S Oct Max Ultra+ S-404 S-480 00:15-0:30 0:25-0:45 0:20-0:35 0:40-1:10 0:20-040 0:20-0:45 0:15-0:30 0:15-0:30
The SAE holdover times for this cell are unchanged from last year and are driven by results from the previous test season. Regression curves were generated using the most restrictive temperature in this range (-25°C). Due to a lack of data points for SPCA AD-404 and SPCA AD-480 in this cell, the holdover times for these fluids were reduced to match the SAE holdover times.
5.2.1.2 Overall perspective on snow results With the exception of one change, the SAE holdover times for Type IV fluids in natural snow remain unchanged from those approved for operational use during the 1997-98 winter.
5.2.2 Freezing Drizzle
The following is a cell-by-cell summary of the holdover time performance of all Type IV fluid brands tested under conditions of simulated freezing drizzle. The results are arranged in the sequence of temperature ranges (from top to bottom) that appear in the corresponding columns of the holdover time tables. Since it is impossible to simulate freezing drizzle above 0°C, the holdover time results for this category of precipitation above 0°C are identical to those in the 0°C to -3°C range. Each table shows columns containing the 1997-98 SAE, 1998-99 SAE, and the fluid-specific holdover times. The fluid failure time versus precipitation rate data for this category of precipitation are plotted either as a function of temperature or as as a function of fluid brand. The plots as a function of fluid brand are used to help present discussions regarding changes to holdover times and appear in the body of the text as Figures 5.10 to 5.14.
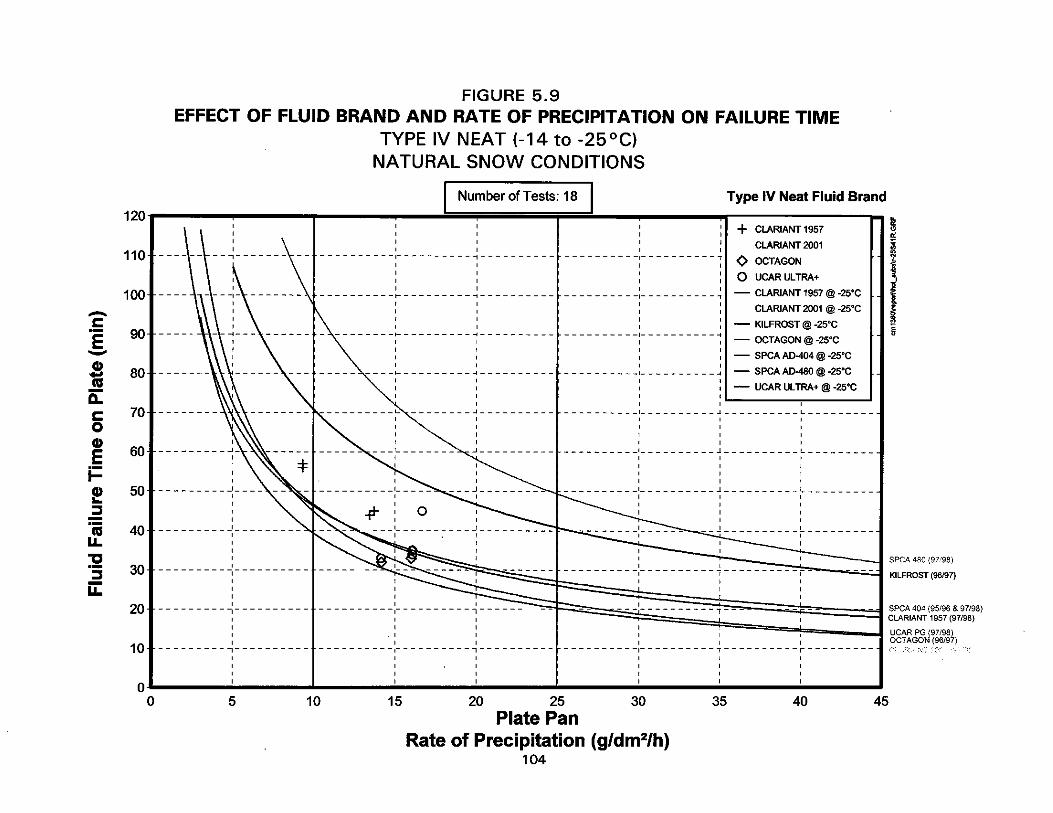
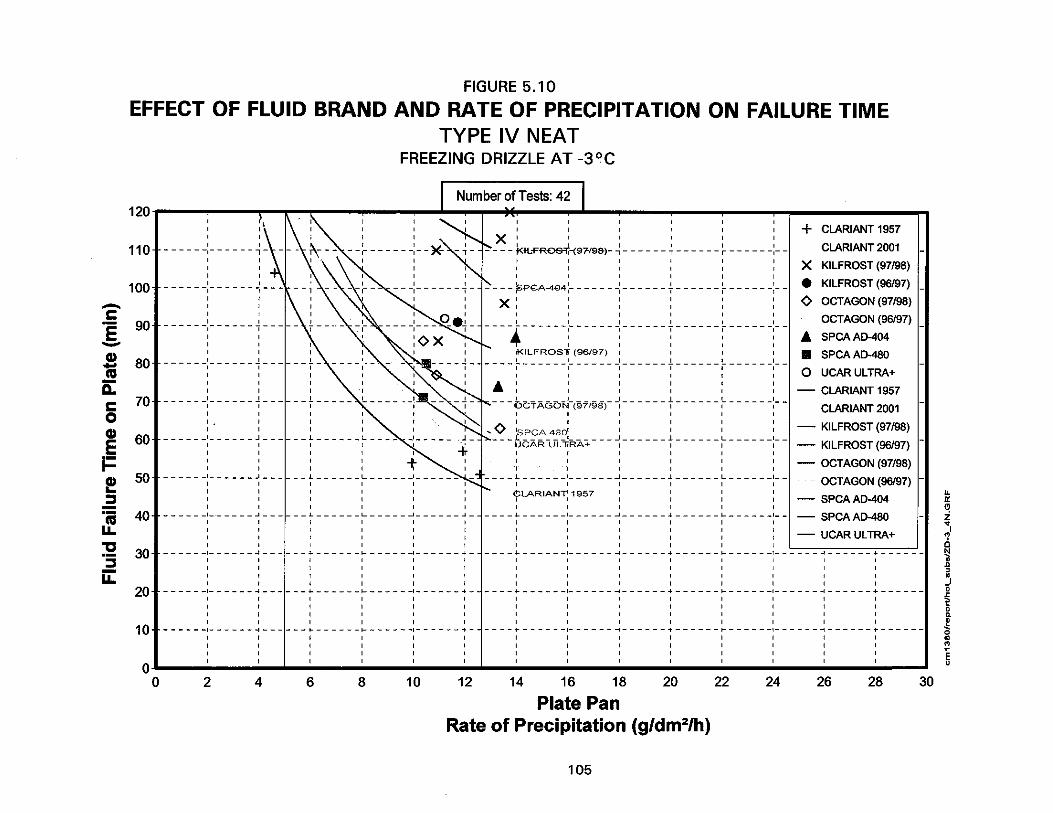
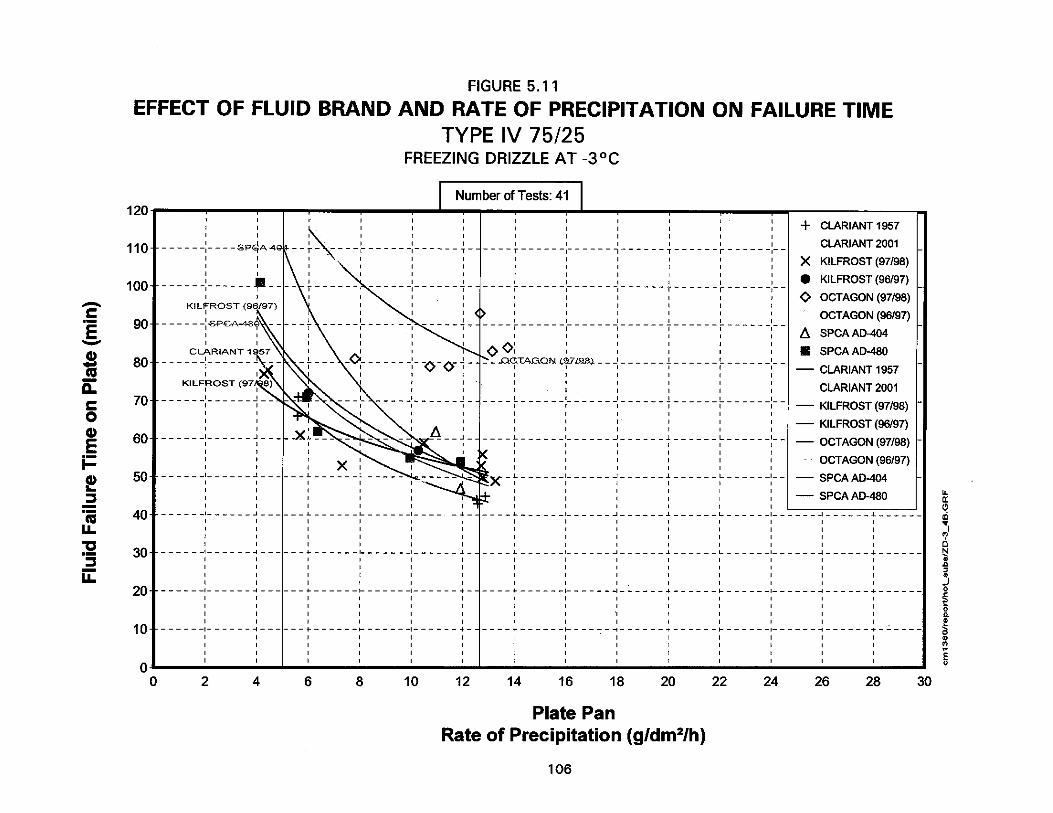
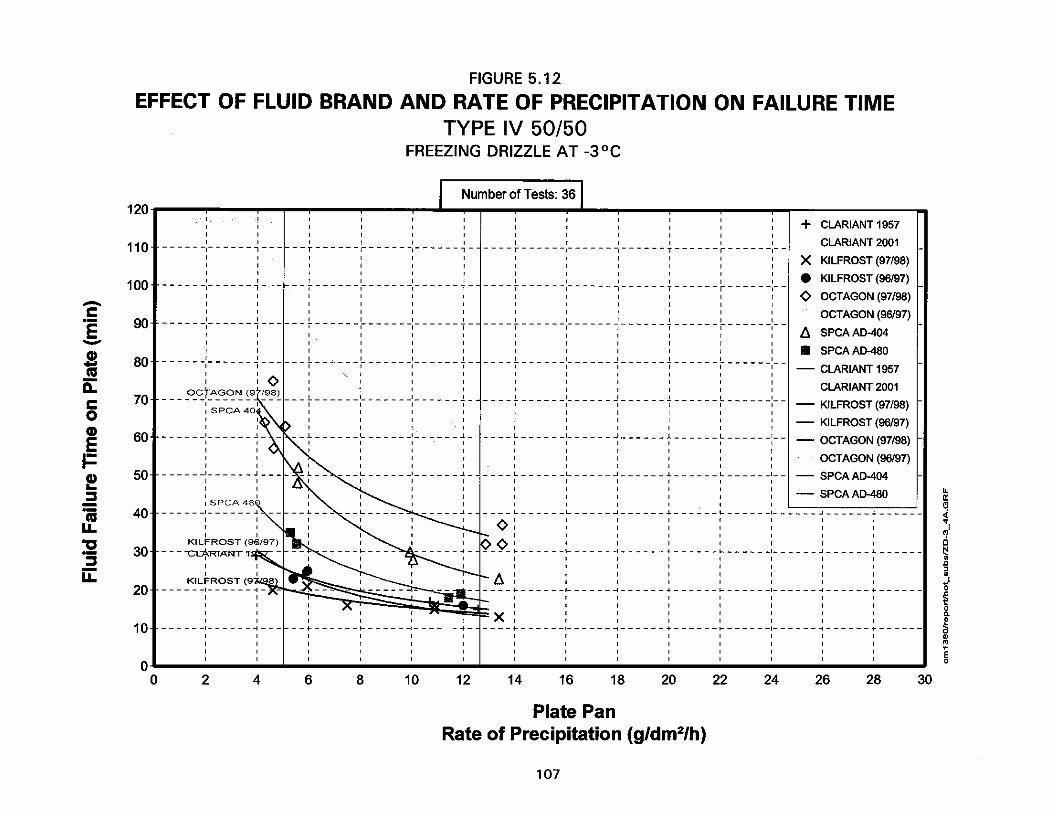
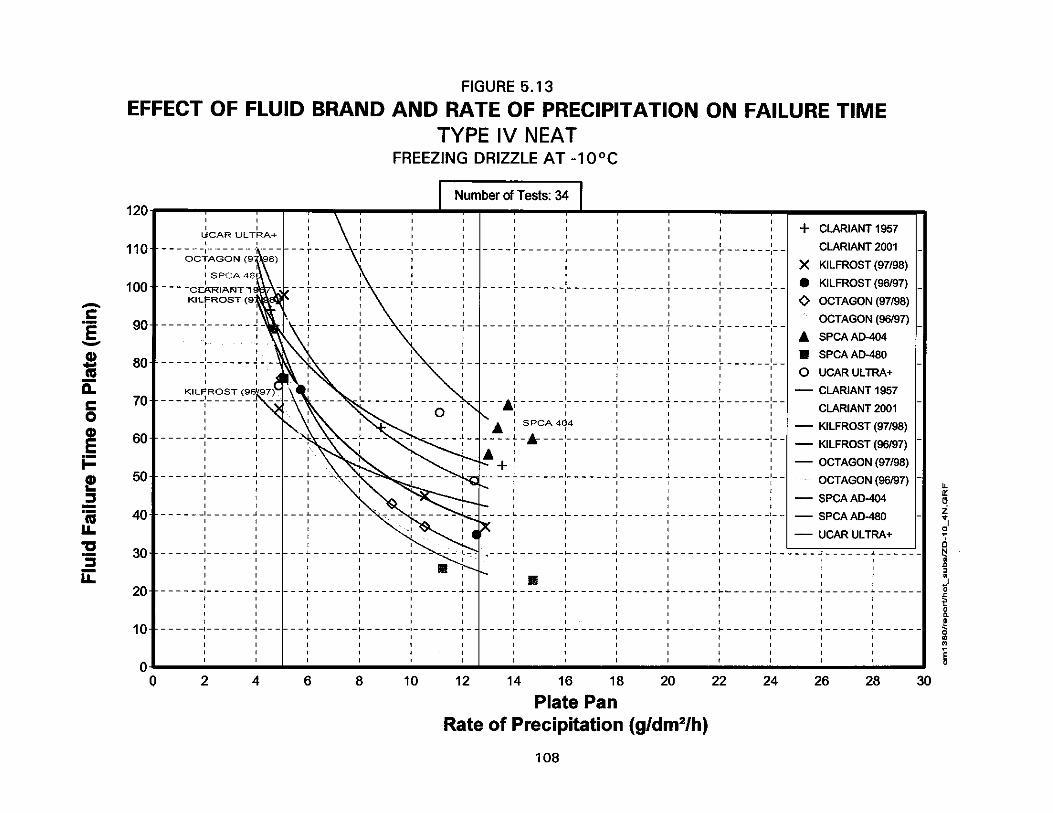
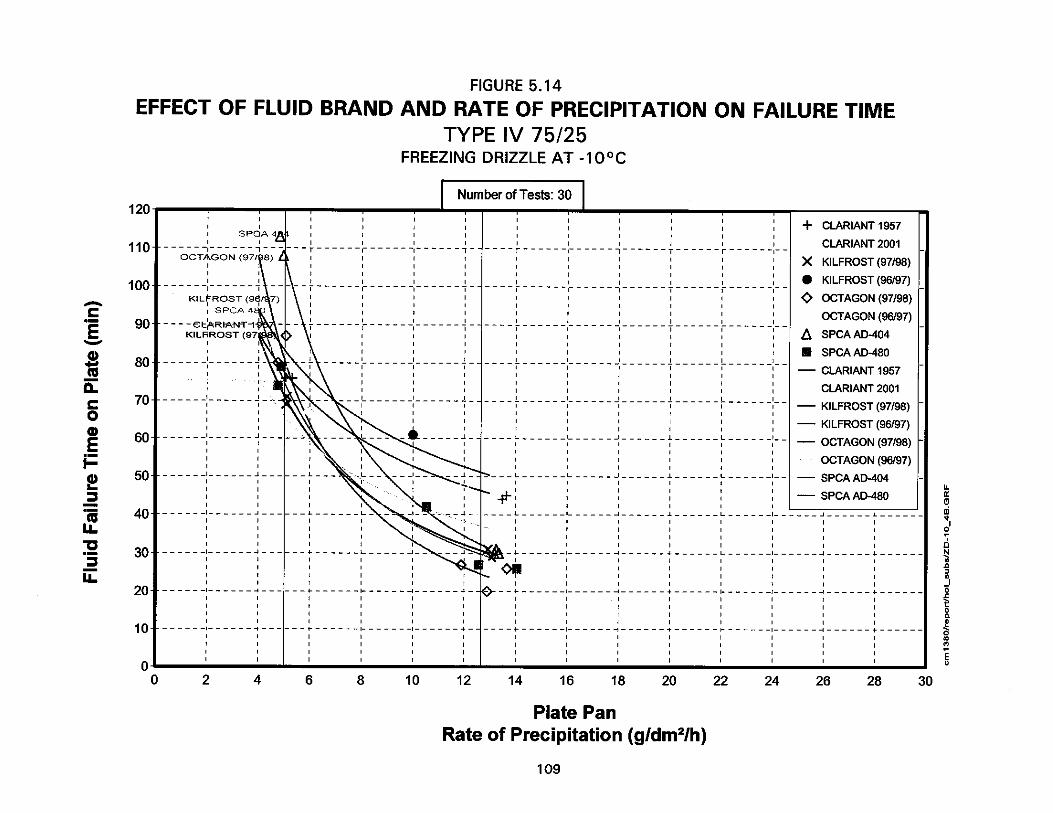
5. HOLDOVER TIME TABLES, RESULTS AND DISCUSSIONS 5.2 Type IV Fluids
X:\@APS ARCHIVE\CM1380 (TDC Deicing 1997-98)\REPORT\HOT_SUB\Final Version 1.0\Final Version 1.0.DOC Final Version 1.0, October 06 110
5.2.2.1 Changes to Type IV fluid holdover times for freezing drizzle
i) Neat fluid, above 0°C and 0 to -3°C, freezing drizzle (Figure 5.10)
1997-98 SAE H-1957 K-ABC-S Oct Max Ultra+ 0:40-1:00 0:40-1:00 1:20-1:50 0:55-2:00 1:00-2:00 1998-99 SAE C-1957 C-2001 K-ABC-S Oct Max Ultra+ S-404 S-480 0:40-1:00 0:50-1:40 0:55-1:55 1:20-1:50 0:55-2:00 1:00-2:00 1:40-2:00 1:05-2:00
The SAE holdover times in the two cells remain unchanged from last year. Note that holdover times for several fluids were rounded off at two hours (Figure 5.10).
ii) 75/25 fluid, above 0°C and 0 to -3°C, freezing drizzle (Figure 5.11) 1997-98 SAE H-1957 K-ABC-S Oct Max Ultra+ (do not use) 0:30-1:00 0:40-1:05 0:50-1:25 1:15-2:00 0:30-1:00 1998-99 SAE C-1957 C-2001 K-ABC-S Oct Max Ultra+ (do not use) S-404 S-480 0:30-1:00 0:45-1:15 0:35-1:10 0:50-1:10 1:15-2:00 0:50-1:50 0:50-1:20
All of the SAE holdover times remain unchanged in these two cells. The Kilfrost fluid has seen a reduction in the upper holdover time limit from last year. As a result, this lower number will appear in the fluid-specific table for this fluid.
iii) 50/50 fluid, above 0°C and 0°C to -3°C, freezing drizzle (Figure 5.12) 1997-98 SAE H-1957 K-ABC-S Oct Max Ultra+ (do not use) 0:10-0:20 0:20-0:35 0:15-0:25 0:55-1:40 0:10-0:20 1998-99 SAE C-1957 C-2001 K-ABC-S Oct Max Ultra+ (do not use) S-404 S-480 0:10-0:20 0:15-0:25 0:10-0:20 0:15-0:20 0:35-1:00 0:25-0:55 0:15-0:35
The SAE holdover times for these two cells remain unchanged from last year. The SAE values are based on the results of three different fluids. The holdover times for both Kilfrost and Octagon fluids have been reduced from last year’s results. This is due to differences in the batches provided to APS for test purposes. The lowest of the values will be included in the fluid-specific tables for these two fluids.
5. HOLDOVER TIME TABLES, RESULTS AND DISCUSSIONS 5.2 Type IV Fluids
X:\@APS ARCHIVE\CM1380 (TDC Deicing 1997-98)\REPORT\HOT_SUB\Final Version 1.0\Final Version 1.0.DOC Final Version 1.0, October 06 111
iv) Neat fluid, -3° C to -10°C, freezing drizzle (Figure 5.13) 1997-98 SAE H-1957 K-ABC-S Oct Max Ultra+ 0:30-1:00 0:40-1:00 0:35-1:00 0:30-1:10 0:50-1:35 1998-99 SAE C-1957 C-2001 K-ABC-S Oct Max Ultra+ S-404 S-480 0:25-1:00 0:55-1:25 0:55-1:35 0:35-1:00 0:30-1:10 0:50-1:35 1:05-2:00 0:25-1:20
The SAE lower limit holdover time for neat fluid in this temperature range for this precipitation type has been reduced from the previous SAE number. One fluid exhibits performance equal to the lower SAE number, while two fluids are responsible for the upper number.
v) 75/25 fluid, -3°C to -10°C, freezing drizzle (Figure 5.14) 1997-98 SAE H-1957 K-ABC-S Oct Max Ultra+ (do not use) 0:30-1:00 0:40-1:05 0:50-1:25 0:30-1:05 0:30-1:00 1998-99 SAE C-1957 C-2001 K-ABC-S Oct Max Ultra+ (do not use) S-404 S-480 0:25-1:00 0:45-1:15 0:40-1:10 0:30-1:10 0:25-1:05 0:30-1:45 0:30-1:15
The SAE lower holdover time for 75/25 fluid in freezing drizzle was reduced by five minutes based on the results of the Octagon fluid. The lower limit holdover time for this fluid has been reduced from the previous number, and this change will be reflected in the fluid-specific table. The upper holdover time limit remains unchanged even though the fluid responsible for the number should not be used in diluted form. Holdover time values for Kilfrost fluid have also diminished from those obtained in 1996-97.
5.2.2.2 Overall perspective on freezing drizzle results
Only two changes were made to the SAE holdover time table in freezing drizzle. All changes occurred in the -3°C to -10°C temperature range. Holdover times in these two cases were reduced slightly. The identification of failures at these lower temperatures in freezing drizzle (and light freezing rain) remains a concern because of differences in fluid formulations that cause the failure mechanisms to vary from one fluid to the next. A typical ethylene Type IV failure at -10°C occurs when the diluted fluid runs off the surface of the plate and its thickness is diminished until a thin layer of solidified precipitation has accumulated.
5. HOLDOVER TIME TABLES, RESULTS AND DISCUSSIONS 5.2 Type IV Fluids
X:\@APS ARCHIVE\CM1380 (TDC Deicing 1997-98)\REPORT\HOT_SUB\Final Version 1.0\Final Version 1.0.DOC Final Version 1.0, October 06 112
A typical propylene Type IV fluid fails by accumulation of precipitation in the upper fluid layers. The upper layers can flow, but damming of the failed surfaces eventually occurs, trapping the contamination in place. Failure occurs when 1/3 of the plate surface has accumulated contamination in the fluid. This situation is interpreted as a failure even though a considerable amount of unfailed fluid lies below the upper failed surface.
5.2.3 Light Freezing Rain The following is a cell-by-cell summary of the holdover time performance of all Type IV fluid brands tested under conditions of simulated light freezing rain. The results are arranged in the sequence of temperature ranges (from top to bottom) that appear in the corresponding columns of the holdover time tables. Since it is impossible to simulate freezing precipitation above 0°C, the holdover time results for this category of precipitation above 0°C are identical to those in the range of 0°C to -3°C. Each table shows the 1997-98 SAE, 1998-99 SAE, and the fluid-specific holdover times. The fluid failure time versus precipitation rate data for this category of precipitation are plotted either as a function of temperature or as as a function of fluid brand. The plots as a function of fluid brand are used to help present discussions regarding changes to holdover times and appear in the body of the text as Figures 5.15 to 5.19.
5.2.3.1 Changes to Type IV fluid holdover times for light freezing rain
i) Neat fluid, above 0°C and 0 to -3°C, light freezing rain
(Figure 5.15) 1997-98 SAE H-1957 K-ABC-S Oct Max Ultra+ 0:35-0:55 0:40-0:55 1:00-1:25 0:40-1:15 0:35-1:00 1998-99 SAE C-1957 C-2001 K-ABC-S Oct Max Ultra+ S-404 S-480 0:35-0:55 0:40-1:00 0:40-1:00 1:00-1:25 0:35-1:00 0:35-1:00 0:45-1:20 0:50-1:10
Two fluids are responsible for the lower 1998-99 SAE holdover time. Note that the Octagon results are different from those obtained last year. This is due to different batches of fluid received from the manufacturer. As a result, the lowest values will be displayed in the fluid-specific table for this fluid.
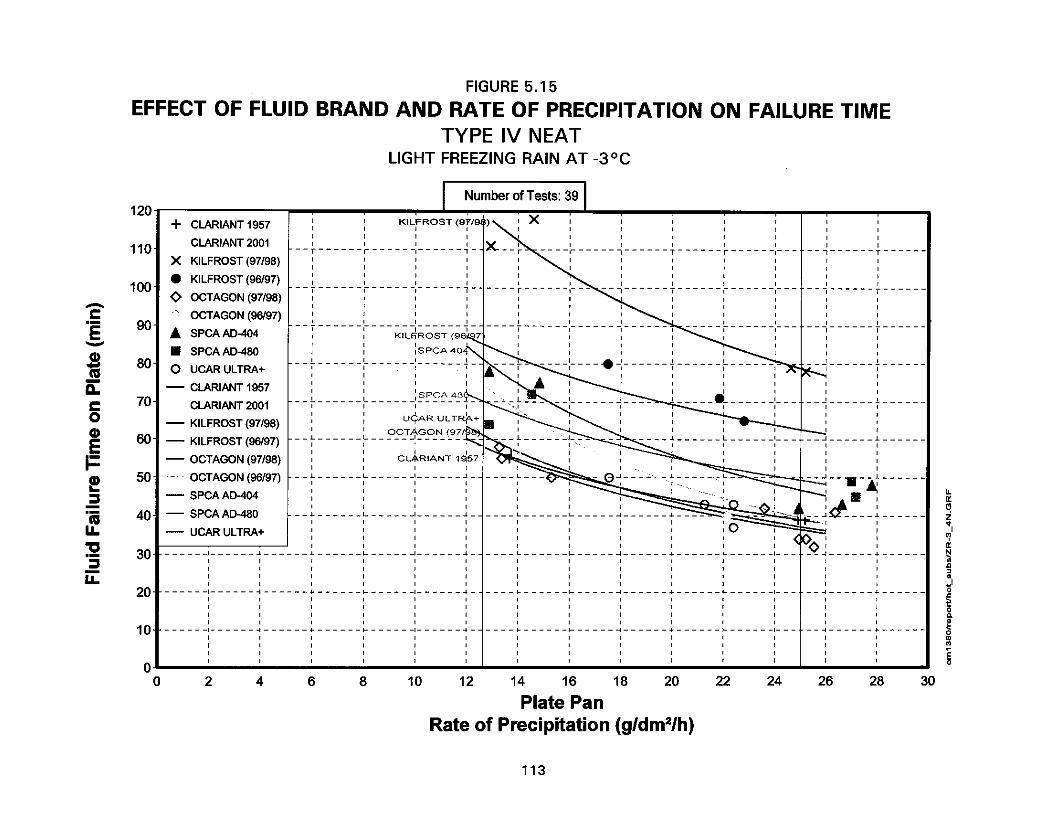
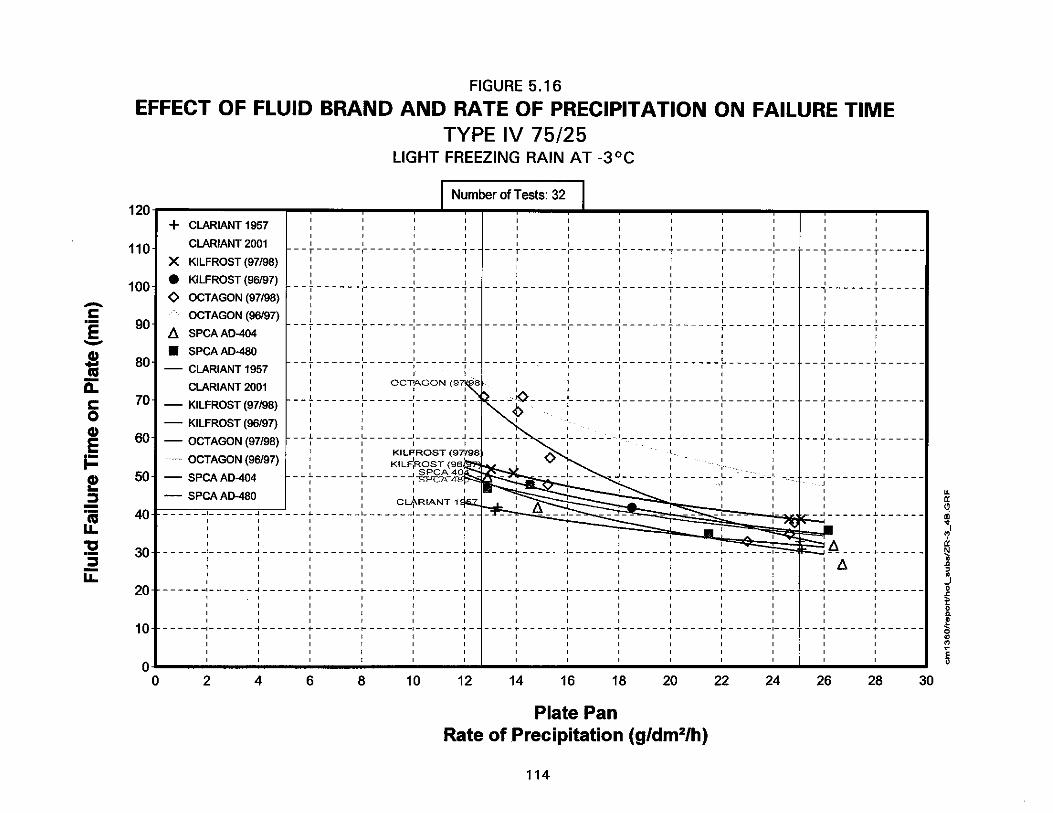
5. HOLDOVER TIME TABLES, RESULTS AND DISCUSSIONS 5.2 Type IV Fluids
X:\@APS ARCHIVE\CM1380 (TDC Deicing 1997-98)\REPORT\HOT_SUB\Final Version 1.0\Final Version 1.0.DOC Final Version 1.0, October 06 118
ii) 75/25 fluid, above 0°C and 0 to -3°C, light freezing rain (Figure 5.16) 1997-98 SAE H-1957 K-ABC-S Oct Max Ultra+ (do not use) 0:15-0:30 0:25-0:40 0:35-0:50 0:50-1:15 0:15-0:30 1998-99 SAE C-1957 C-2001 K-ABC-S Oct Max Ultra+ (do not use) S-404 S-480 0:15-0:30 0:30-0:40 0:25-0:35 0:35-0:50 0:35-1:10 0:30-0:50 0:35-0:50
The SAE holdover times remain unchanged in these two cells. Once again, the lowest of the Octagon fluid values will be included in the fluid-specific table.
iii) 50/50 fluid, above 0°C and 0 to -3°C, light freezing rain (Figure 5.17) 1997-98 SAE H-1957 K-ABC-S Oct Max Ultra+ (do not use) 0:05-0:10 0:15-0:20 0:10-0:15 0:30-0:55 0:05-0:10 1998-99 SAE C-1957 C-2001 K-ABC-S Oct Max Ultra+ (do not use) S-404 S-480 0:05-0:10 0:10--0:15 0:10-0:15 0:10-0:15 0:15-0:30 0:15-0:35 0:10-0:25
The SAE values have not changed in these two cells. However, the Octagon fluid at this dilution exhibited a 50 percent reduction in holdover time. The lower values will appear in the fluid-specific table.
iv) Neat fluid, -3° C to -10°C, light freezing rain (Figure 5.18) 1997-98 SAE H-1957 K-ABC-S Oct Max Ultra+ 0:30-0:45 0:30-0:50 0:30-0:45 0:30-0:55 0:30-0:50 1998-99 SAE C-1957 C-2001 K-ABC-S Oct Max Ultra+ S-404 S-480 0:15-0:30 0:30-0:45 0:30-0:45 0:20-0:40 0:20-0:40 0:30-0:50 0:35-1:20 0:20-0:40
The SAE lower and upper limit holdover times for neat fluid in this temperature range for this precipitation type have been reduced from the previous SAE numbers. The lowest numbers for Kilfrost and Octagon fluids will appear in the fluid-specific tables. At the May 1998 SAE G-12 meetings in Vienna, UQAC (AMIL) presented data suggesting that holdover times for three neat Type IV fluids in light freezing rain at -10°C were significantly lower than the 20 minutes suggested by APS Aviation. As a result, a recommendation to reduce the SAE holdover times in this cell to 15 to 30 minutes was sent out to the Holdover Time Subcommittee members by the co-chairmen. The suggested reduction in holdover time was based on a compromise between the APS and AMIL test data, and allowed for a more conservative number. The reduction went to ballot, and was accepted by the SAE G-12 Holdover Time Subcommittee.
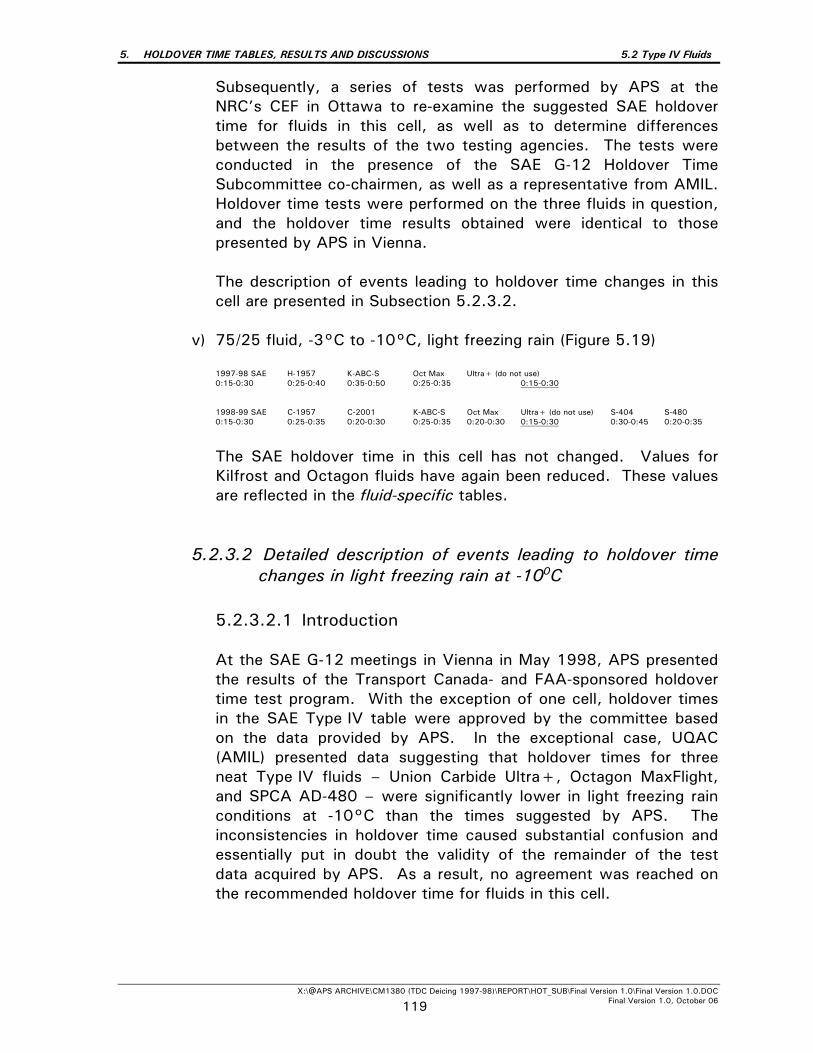
5. HOLDOVER TIME TABLES, RESULTS AND DISCUSSIONS 5.2 Type IV Fluids
X:\@APS ARCHIVE\CM1380 (TDC Deicing 1997-98)\REPORT\HOT_SUB\Final Version 1.0\Final Version 1.0.DOC Final Version 1.0, October 06 119
Subsequently, a series of tests was performed by APS at the NRC’s CEF in Ottawa to re-examine the suggested SAE holdover time for fluids in this cell, as well as to determine differences between the results of the two testing agencies. The tests were conducted in the presence of the SAE G-12 Holdover Time Subcommittee co-chairmen, as well as a representative from AMIL. Holdover time tests were performed on the three fluids in question, and the holdover time results obtained were identical to those presented by APS in Vienna. The description of events leading to holdover time changes in this cell are presented in Subsection 5.2.3.2.
v) 75/25 fluid, -3°C to -10°C, light freezing rain (Figure 5.19) 1997-98 SAE H-1957 K-ABC-S Oct Max Ultra+ (do not use) 0:15-0:30 0:25-0:40 0:35-0:50 0:25-0:35 0:15-0:30 1998-99 SAE C-1957 C-2001 K-ABC-S Oct Max Ultra+ (do not use) S-404 S-480 0:15-0:30 0:25-0:35 0:20-0:30 0:25-0:35 0:20-0:30 0:15-0:30 0:30-0:45 0:20-0:35
The SAE holdover time in this cell has not changed. Values for Kilfrost and Octagon fluids have again been reduced. These values are reflected in the fluid-specific tables.
5.2.3.2 Detailed description of events leading to holdover time changes in light freezing rain at -100C
5.2.3.2.1 Introduction At the SAE G-12 meetings in Vienna in May 1998, APS presented the results of the Transport Canada- and FAA-sponsored holdover time test program. With the exception of one cell, holdover times in the SAE Type IV table were approved by the committee based on the data provided by APS. In the exceptional case, UQAC (AMIL) presented data suggesting that holdover times for three neat Type IV fluids – Union Carbide Ultra+, Octagon MaxFlight, and SPCA AD-480 – were significantly lower in light freezing rain conditions at -10°C than the times suggested by APS. The inconsistencies in holdover time caused substantial confusion and essentially put in doubt the validity of the remainder of the test data acquired by APS. As a result, no agreement was reached on the recommended holdover time for fluids in this cell.
5. HOLDOVER TIME TABLES, RESULTS AND DISCUSSIONS 5.2 Type IV Fluids
X:\@APS ARCHIVE\CM1380 (TDC Deicing 1997-98)\REPORT\HOT_SUB\Final Version 1.0\Final Version 1.0.DOC Final Version 1.0, October 06 120
Following several hours of discussion, it was decided that the co-chairmen of the SAE G-12 Holdover Time Subcommittee would review the APS and AMIL test data for fluids in this cell and recommend a solution through a vote by SAE members. 5.2.3.2.2 Data APS presented a complete set of data in Vienna for all conditions and fluids. AMIL data for light freezing rain at -10°C were acquired using three fluids. Upon return from Vienna, the test specifications for both the APS and AMIL data were requested by the co-chairmen of the SAE G-12 Holdover Time Subcommittee. The APS test specifications are shown in Annex I-I (Appendix I), while the AMIL document can be found in Annex I-II. The holdover times obtained by APS and AMIL for the three fluids, in light freezing rain, at -10°C, and with rates of precipitation of 25 g/dm2/h, are shown below:
Fluid AMIL values APS values presented (mins) in Vienna (rounded) (mins) Octagon MaxFlight (100%) 7 20 SPCA AD-480 (100%) 7 20 Union Carbide Ultra+ (100%) 10 30
The test conditions were compared by the SAE G-12 Holdover Time Subcommittee co-chairmen, and were found to be identical or similar in most cases. The biggest difference was believed to be the method of calling failures employed by APS and AMIL. As a result of the wide variation in holdover times obtained by APS and AMIL, the co-chairmen of the SAE G-12 Holdover Time Subcommittee recommended that the holdover time value for Type IV fluids in this cell of the SAE Type IV fluid Holdover Time Table (light freezing rain, -3°C to -10°C) be reduced to 15 to 30 minutes. A recommendation was also made that subsequent testing be conducted to compare the AMIL and APS failure calls. The suggested reduction in holdover time in this cell was based primarily on a compromise between the APS and AMIL holdover time values. A ballot to approve the holdover time value in this cell was prepared by the SAE G-12 Holdover Time Subcommittee co-chairmen and was circulated to all those who attended the holdover time meetings in Vienna. A copy of this ballot appears in
5. HOLDOVER TIME TABLES, RESULTS AND DISCUSSIONS 5.2 Type IV Fluids
X:\@APS ARCHIVE\CM1380 (TDC Deicing 1997-98)\REPORT\HOT_SUB\Final Version 1.0\Final Version 1.0.DOC Final Version 1.0, October 06 121
Annex I-III (Appendix I). The 15-30 minute holdover time range for fluids in this cell was approved by the Subcommittee members. 5.2.3.2.3 Testing APS conducted a series of tests on July 10, 1998, at NRC’s CEF, to compare APS and AMIL failure calls for the three previously mentioned fluids in light freezing rain conditions at -10°C. The tests were conducted by APS personnel using standard test procedures and were witnessed by representatives from Transport Canada, the FAA, and AMIL. Spar/Cox and AlliedSignal C/FIMS ice detection equipment was also employed for these tests. A letter to the co-chairmen of the SAE G-12 Holdover Time Subcommittee, summarizing the results of the tests conducted on July 10, 1998, was prepared by APS and appears in Annex I-IV (Appendix I). The holdover time results for these tests are included in Table 1 of Annex I-IV. The two Ultra+ plates failed in 33 and 34 minutes, which is substantially longer than the AMIL failure time of 10 minutes. A photograph taken 14 minutes into the Ultra+ tests shows both plates to be clean of contamination at this time (see Photo 5.2). For the Octagon fluid, the two plates failed in 19 and 20 minutes. AMIL claimed that failure occurred after 7 minutes for this fluid. Finally, the SPCA AD-480 plates failed in 16 and 18 minutes. Once again, AMIL claimed that failure occurred after 7 minutes for this fluid. In all tests conducted with Octagon and SPCA fluids, it should also be noted that at the time when failure was observed by APS, all existing contamination on the plates was non-adhering and could easily be dislodged simply by blowing. The Octagon and SPCA fluid data points were added to the appropriate charts and appear in Figures 1 and 2 in Annex I-IV. In both cases, the data appear to be consistent with previous test results. No chart was produced for Ultra+, since this fluid was not tested during the 1997-98 test season. The new data points were also added to the regression analyses for each fluid. No changes in holdover time were due to their inclusion. The overall results of AMIL and APS tests are summarized below: Fluid AMIL APS regression APS regression values (rounded) values values presented in including tests witnessed by TDC, (min.) Vienna (min.) FAA, AMIL on July 10, 1998 (min.) Octagon MaxFlight (100%) 7 20 20 SPCA AD-480 (100%) 7 20 20 Union Carbide Ultra+ (100%) 10 30 30 (or more)
5. HOLDOVER TIME TABLES, RESULTS AND DISCUSSIONS 5.2 Type IV Fluids
X:\@APS ARCHIVE\CM1380 (TDC Deicing 1997-98)\REPORT\HOT_SUB\Final Version 1.0\Final Version 1.0.DOC Final Version 1.0, October 06 122
This test summary shows that the holdover time results presented by APS in Vienna were accurate and consistent. The C/FIMS sensor trace data for each of the six plate tests, along with a series of photographs documenting the entire test process are also included in this document and appear in Annex I-V (Appendix I).
5.2.3.2.4 Conclusion The final position of the co-chairmen of the SAE G-12 Holdover Time Subcommittee on this matter is included in Annex I-VI (Appendix I). In this document, it was stated that when appropriate failure criteria were applied, all of the fluids tested by APS exhibited holdover times in excess of the 15 minute lower holdover time limit for fluids in this cell. The holdover time values obtained by AMIL were not observed, and as such, disregarded. Based on the results of these tests, the holdover time range for Type IV fluids in light freezing rain at -10°C remains at 15 to 30 minutes. In summary: • The 1997-98 SAE holdover time for Type IV neat fluid in the
-3°C to -10°C cell was 30 to 45 minutes; • At the Vienna meeting, APS presented data suggesting the SAE
holdover times for use in 1998-99 be reduced for fluids in this cell to 20 to 40 minutes;
• AMIL presented data suggesting that the holdover times for
fluids in this cell were lower than those proposed by APS; and
• Based on a compromise between APS and AMIL test results, the holdover time range for Type IV neat fluids in light freezing rain at -10°C will be 15 to 30 minutes.
5.2.3.3 Overall perspective on light freezing rain results Only two changes were made to the SAE holdover time table regarding light freezing rain. The changes occurred in the -3°C to -10°C temperature range for neat fluid. The upper and lower limit holdover times in this case were reduced.
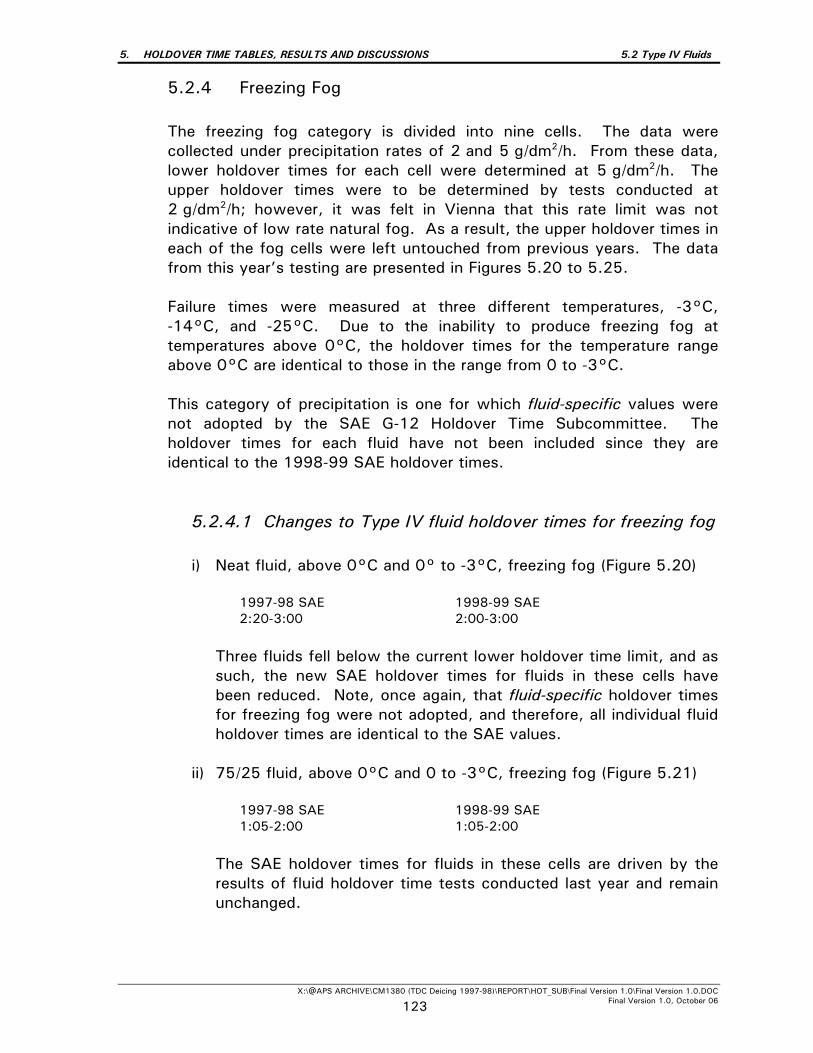
5. HOLDOVER TIME TABLES, RESULTS AND DISCUSSIONS 5.2 Type IV Fluids
X:\@APS ARCHIVE\CM1380 (TDC Deicing 1997-98)\REPORT\HOT_SUB\Final Version 1.0\Final Version 1.0.DOC Final Version 1.0, October 06 123
5.2.4 Freezing Fog The freezing fog category is divided into nine cells. The data were collected under precipitation rates of 2 and 5 g/dm2/h. From these data, lower holdover times for each cell were determined at 5 g/dm2/h. The upper holdover times were to be determined by tests conducted at 2 g/dm2/h; however, it was felt in Vienna that this rate limit was not indicative of low rate natural fog. As a result, the upper holdover times in each of the fog cells were left untouched from previous years. The data from this year’s testing are presented in Figures 5.20 to 5.25. Failure times were measured at three different temperatures, -3°C, -14°C, and -25°C. Due to the inability to produce freezing fog at temperatures above 0°C, the holdover times for the temperature range above 0°C are identical to those in the range from 0 to -3°C. This category of precipitation is one for which fluid-specific values were not adopted by the SAE G-12 Holdover Time Subcommittee. The holdover times for each fluid have not been included since they are identical to the 1998-99 SAE holdover times.
5.2.4.1 Changes to Type IV fluid holdover times for freezing fog i) Neat fluid, above 0°C and 0° to -3°C, freezing fog (Figure 5.20)
1997-98 SAE 1998-99 SAE 2:20-3:00 2:00-3:00
Three fluids fell below the current lower holdover time limit, and as such, the new SAE holdover times for fluids in these cells have been reduced. Note, once again, that fluid-specific holdover times for freezing fog were not adopted, and therefore, all individual fluid holdover times are identical to the SAE values.
ii) 75/25 fluid, above 0°C and 0 to -3°C, freezing fog (Figure 5.21)
1997-98 SAE 1998-99 SAE 1:05-2:00 1:05-2:00
The SAE holdover times for fluids in these cells are driven by the results of fluid holdover time tests conducted last year and remain unchanged.
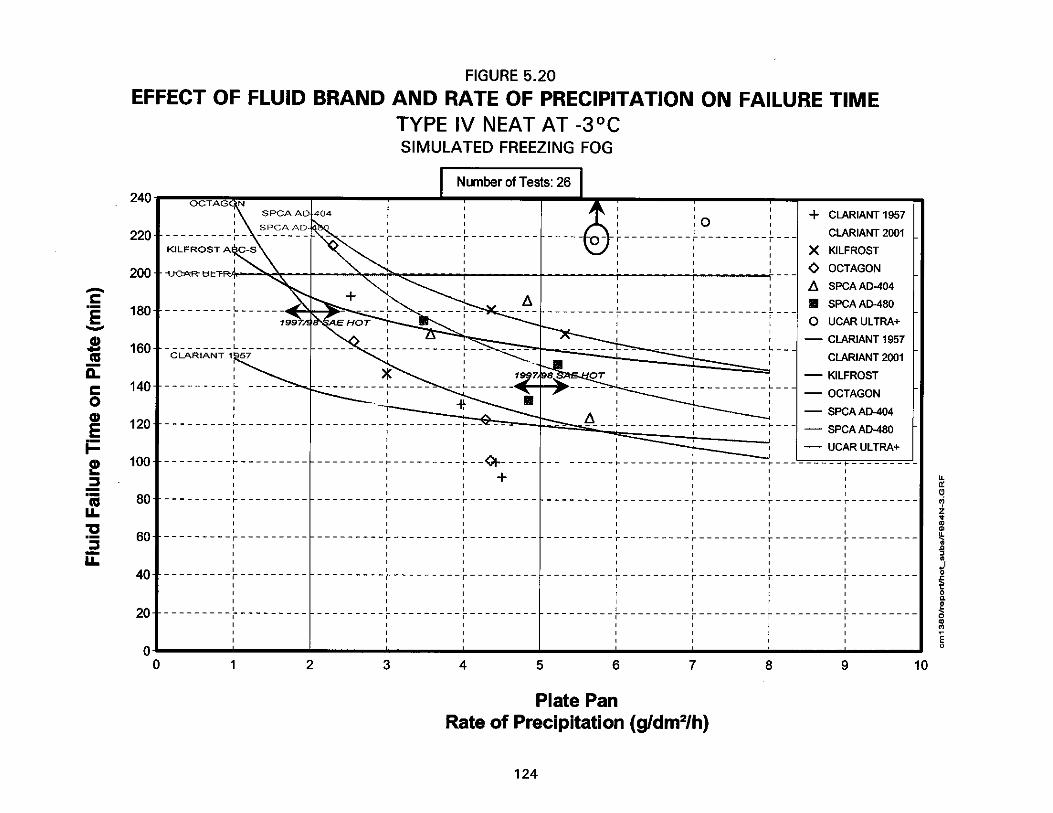
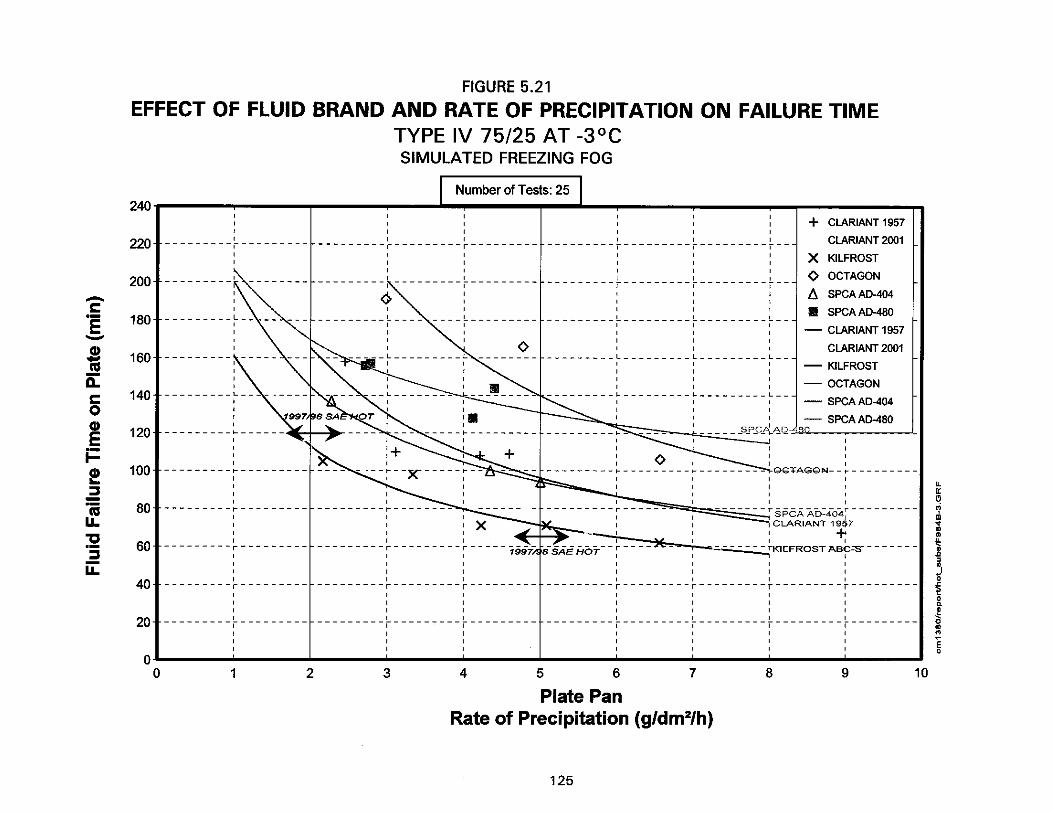
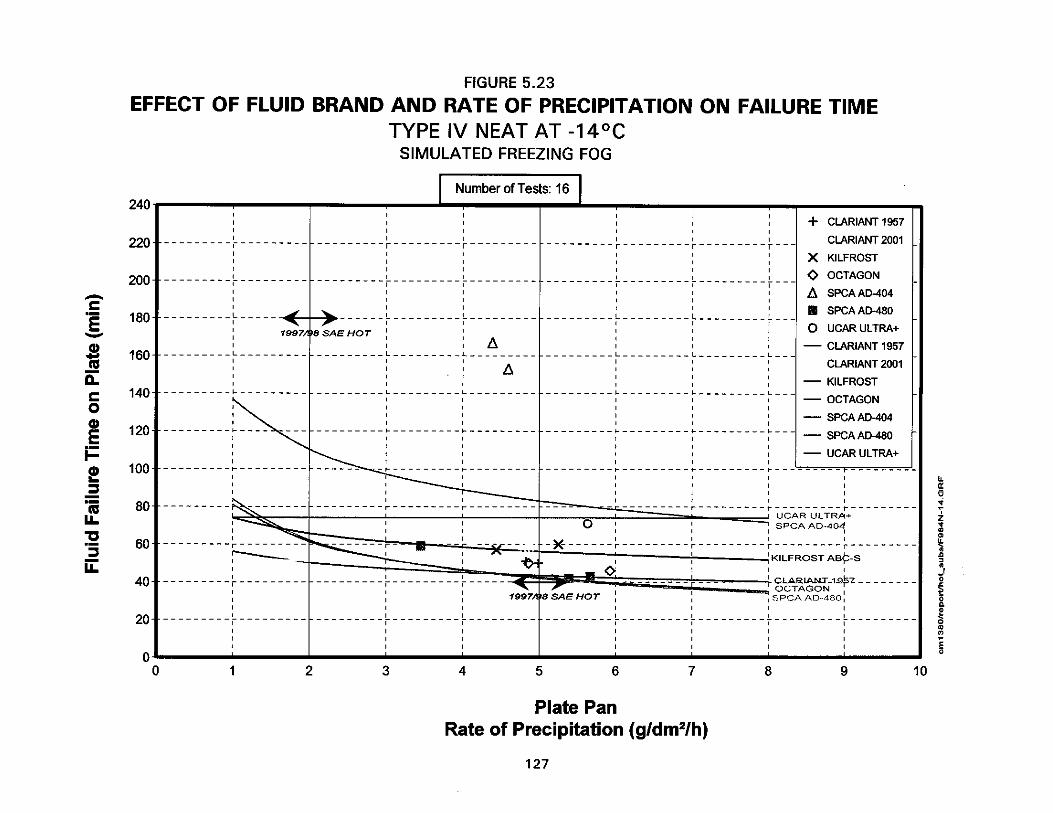
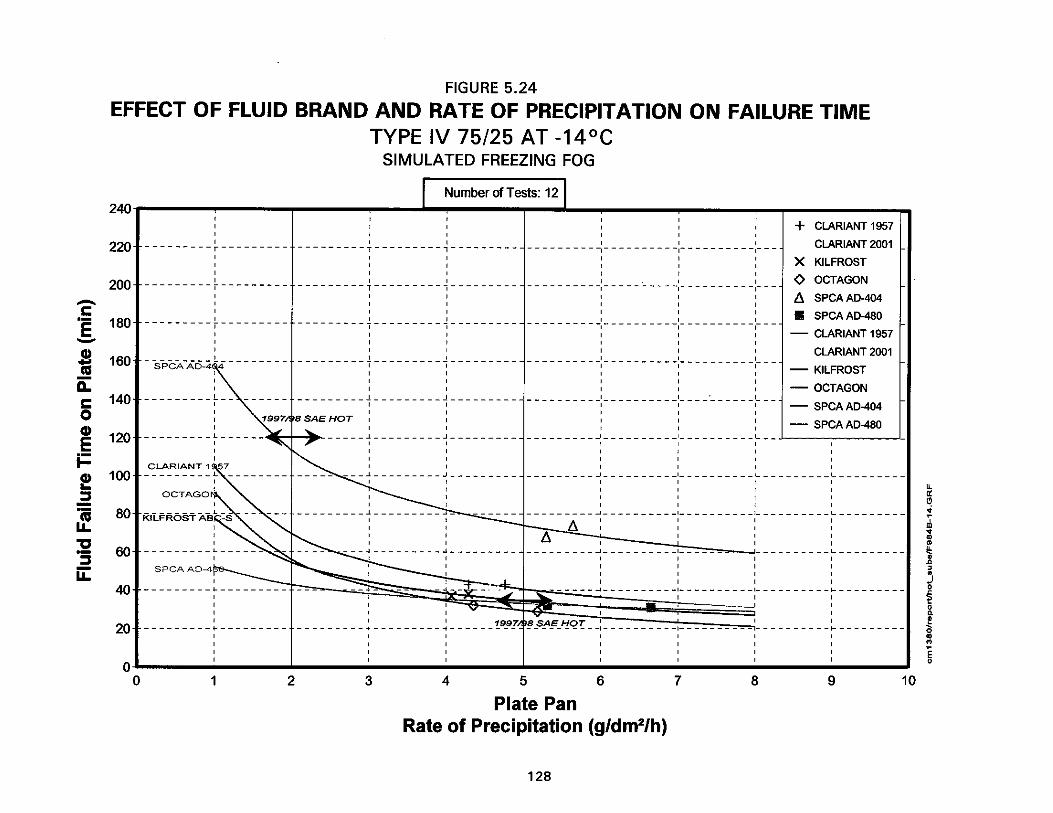
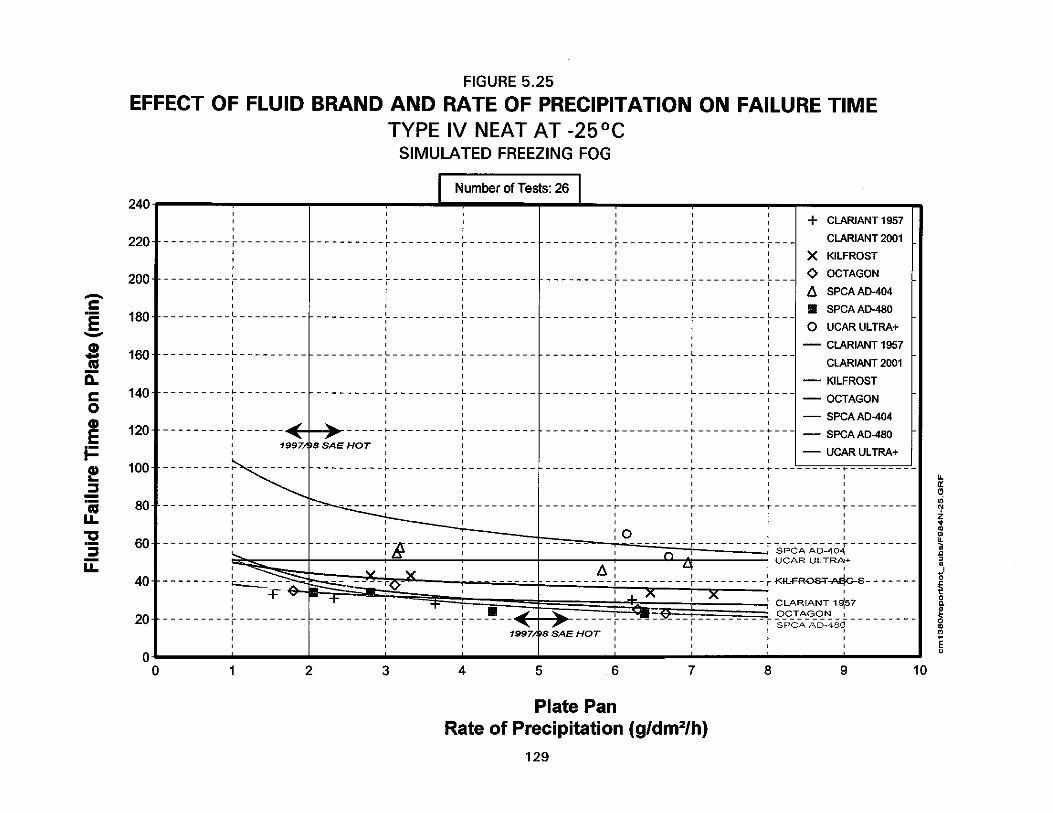
5. HOLDOVER TIME TABLES, RESULTS AND DISCUSSIONS 5.2 Type IV Fluids
X:\@APS ARCHIVE\CM1380 (TDC Deicing 1997-98)\REPORT\HOT_SUB\Final Version 1.0\Final Version 1.0.DOC Final Version 1.0, October 06 130
iii) 50/50 fluid, above 0°C and 0 to -3°C, freezing fog (Figure 5.22)
1998 SAE 1998-99 SAE 0:20-0:45 0:20-0:45
The SAE holdover times for fluids in these cells remain unchanged from last year.
iv) Neat fluid, -3 to -14°C, freezing fog (Figure 5.23)
1997-98 SAE 1998-99 SAE 0:40-3:00 0:40-3:00
The SAE holdover times for fluids in this cell remain unchanged.
v) 75/25 fluid, -3 to -14°C, freezing fog (Figure 5.24)
1997-98 SAE 1998-99 SAE 0:35-2:00 0:30-2:00
The lower SAE holdover time in this cell has been reduced by five minutes based on the results of one fluid. It should be noted that this same fluid was responsible for driving the lower limit holdover time in last year’s holdover time table. Differences in the fluid batches provided to APS for testing resulted in this reduction.
vi) Neat fluid, -14° to -25°C, freezing fog (Figure 5.25)
1997-98 SAE 1998-99 SAE 0:20-2:00 0:20-2:00
The SAE holdover time for fluids in this cell remain unchanged from last year.
5.2.4.2 Overall perspective on freezing fog results The upper holdover times for freezing fog were adopted from last year’s SAE Type IV fluid table (Table 1.5, Section 1). Only two changes were made to the lower holdover times, in each case a slight reduction, due in large part to differences in the fluid samples tested. The lower precipitation rate limit has not been agreed on. A solution is proposed in Sections 7 and 8.
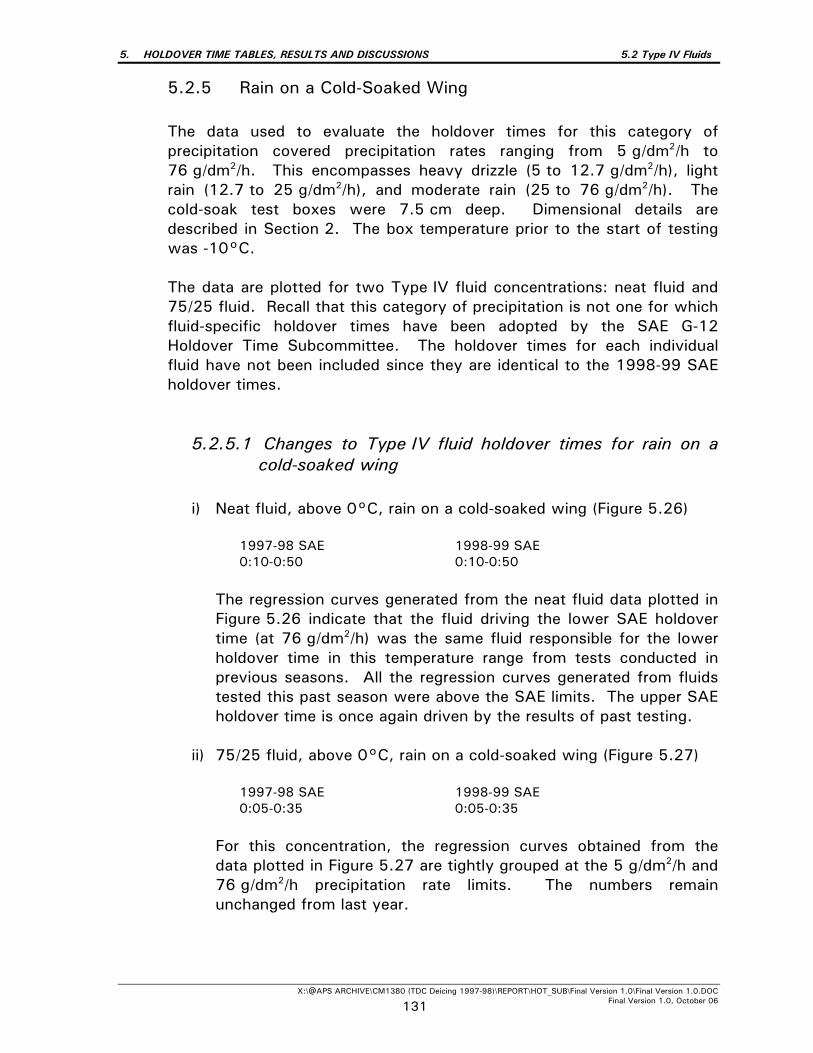
5. HOLDOVER TIME TABLES, RESULTS AND DISCUSSIONS 5.2 Type IV Fluids
X:\@APS ARCHIVE\CM1380 (TDC Deicing 1997-98)\REPORT\HOT_SUB\Final Version 1.0\Final Version 1.0.DOC Final Version 1.0, October 06 131
5.2.5 Rain on a Cold-Soaked Wing The data used to evaluate the holdover times for this category of precipitation covered precipitation rates ranging from 5 g/dm2/h to 76 g/dm2/h. This encompasses heavy drizzle (5 to 12.7 g/dm2/h), light rain (12.7 to 25 g/dm2/h), and moderate rain (25 to 76 g/dm2/h). The cold-soak test boxes were 7.5 cm deep. Dimensional details are described in Section 2. The box temperature prior to the start of testing was -10°C. The data are plotted for two Type IV fluid concentrations: neat fluid and 75/25 fluid. Recall that this category of precipitation is not one for which fluid-specific holdover times have been adopted by the SAE G-12 Holdover Time Subcommittee. The holdover times for each individual fluid have not been included since they are identical to the 1998-99 SAE holdover times.
5.2.5.1 Changes to Type IV fluid holdover times for rain on a cold-soaked wing
i) Neat fluid, above 0°C, rain on a cold-soaked wing (Figure 5.26)
1997-98 SAE 1998-99 SAE 0:10-0:50 0:10-0:50
The regression curves generated from the neat fluid data plotted in Figure 5.26 indicate that the fluid driving the lower SAE holdover time (at 76 g/dm2/h) was the same fluid responsible for the lower holdover time in this temperature range from tests conducted in previous seasons. All the regression curves generated from fluids tested this past season were above the SAE limits. The upper SAE holdover time is once again driven by the results of past testing.
ii) 75/25 fluid, above 0°C, rain on a cold-soaked wing (Figure 5.27)
1997-98 SAE 1998-99 SAE 0:05-0:35 0:05-0:35
For this concentration, the regression curves obtained from the data plotted in Figure 5.27 are tightly grouped at the 5 g/dm2/h and 76 g/dm2/h precipitation rate limits. The numbers remain unchanged from last year.
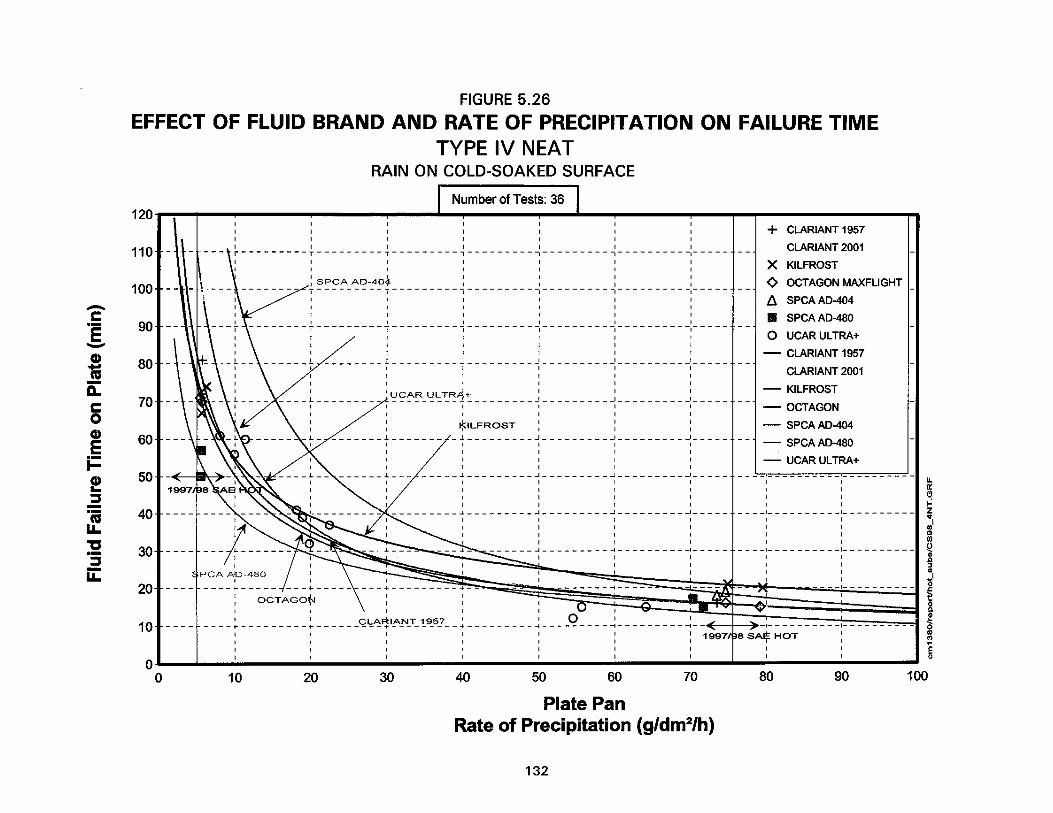
5. HOLDOVER TIME TABLES, RESULTS AND DISCUSSIONS 5.2 Type IV Fluids
X:\@APS ARCHIVE\CM1380 (TDC Deicing 1997-98)\REPORT\HOT_SUB\Final Version 1.0\Final Version 1.0.DOC Final Version 1.0, October 06 134
5.2.5.2 Overall perspective on rain on a cold-soaked wing results
No changes were made to the SAE holdover times in the rain on a cold-soaked wing condition. The data plotted in Figures 5.26 and 5.27 show a tight grouping of regression curves at the higher precipitation rate limit (once the Union Carbide Ultra IV and PG AAF curves have been removed), and provide confidence for the lower holdover time values adopted in each cell of this category. Considerable variations exist in the vicinity of the lower precipitation rate limit.
5. HOLDOVER TIME TABLES, RESULTS AND DISCUSSIONS 5.3 Type III Fluid Holdover Time Tests
X:\@APS ARCHIVE\CM1380 (TDC Deicing 1997-98)\REPORT\HOT_SUB\Final Version 1.0\Final Version 1.0.DOC Final Version 1.0, October 06 135
5.3 Type III Fluid Holdover Time Tests
Type III fluid is a thickened anti-icing fluid that exhibits shear, flow, and anti-icing properties that lie between Type I and Type IV fluids. The fluid was specifically designed for use on aircraft with lower rotation speeds. The earliest holdover time tests with Type III fluid were carried out during the 1991-92 test season (see Transport Canada report TP 11454E (9)). The next series of Type III fluid tests are documented in Transport Canada report TP 11836E (10). These data are somewhat obsolete, as the fluid tested is no longer commercially available. The Type III fluid data for the last report cited were combined with 75/25 Type IV fluid data and provided the basis for a proposed Type III fluid holdover time table, which first appeared in Transport Canada report TP 12896E (11). The latest Type III fluid test data were acquired during the 1996-97 test season using one fluid from one fluid manufacturer. The Type III fluid data were subject to the same regression method of analysis used to determine holdover times for Type IV fluids. The Type III fluid holdover table appears in Section 1 of this report (Table 1.4). The Type III fluid used in this latest testing has since been removed from the market.
No Type III fluids were available during the past test season, and therefore no testing of Type III fluids was performed by APS. As a result, the current Type III table is not valid, since the numbers within were substantiated using a fluid that is no longer available.
5. HOLDOVER TIME TABLES, RESULTS AND DISCUSSIONS 5.4 Type I Fluid
X:\@APS ARCHIVE\CM1380 (TDC Deicing 1997-98)\REPORT\HOT_SUB\Final Version 1.0\Final Version 1.0.DOC Final Version 1.0, October 06 136
5.4 Type I Fluid Holdover Time Tests Type I fluids are deicing fluids that are not thickened. They are used primarily to remove ice and snow from aircraft surfaces. They are applied at high pressures and elevated temperatures. These fluids do not offer the extended protection of thickened fluids, and so depending on weather conditions, anticipated taxi-times, or other pre-takeoff delays, an operator can choose to extend the time of fluid protection by application of Type II or Type IV anti-icing fluid on top of the Type I fluid. Although the Type I holdover time table has been substantiated by tests conducted in previous years, 24 Type I fluid failure tests were performed by APS during the 1997-98 test season during natural snow conditions. Tests were conducted for the purpose of training personnel to identify Type I plate failures in this condition. The data from the Type I tests conducted in 1997-98 are shown in Figures 5.28 and 5.29. All the data points are above the lower holdover time limit of six minutes for Type I fluids in natural snow.
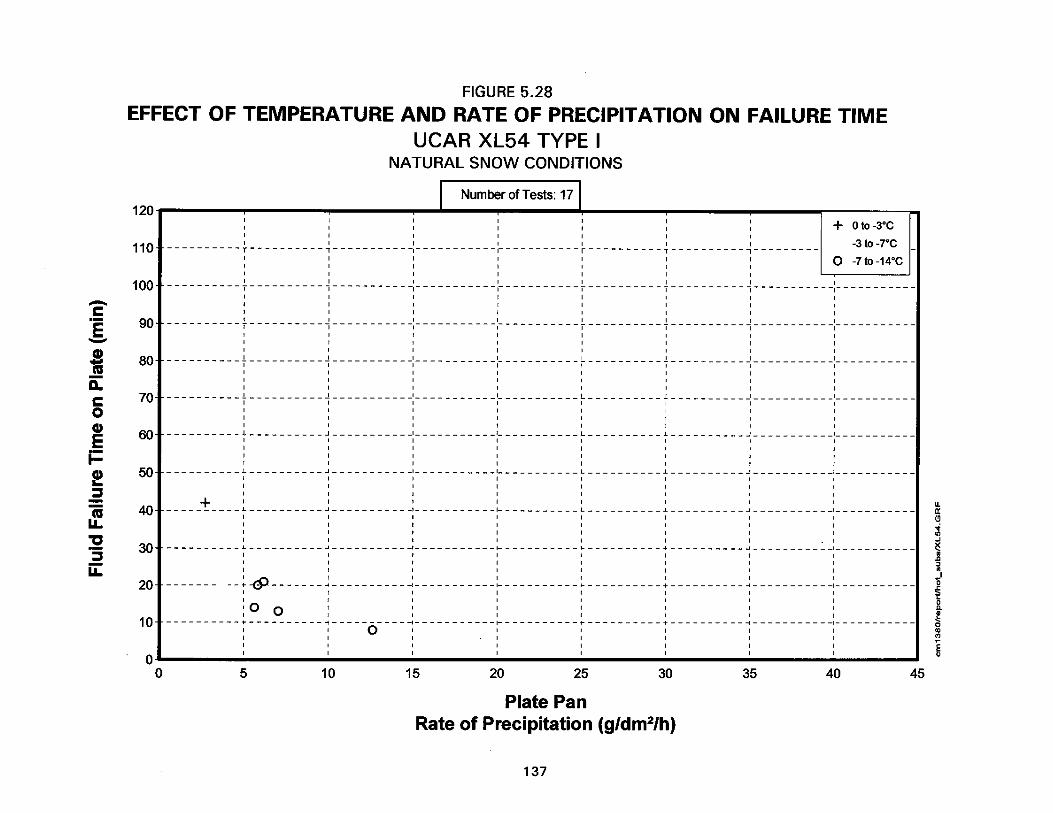
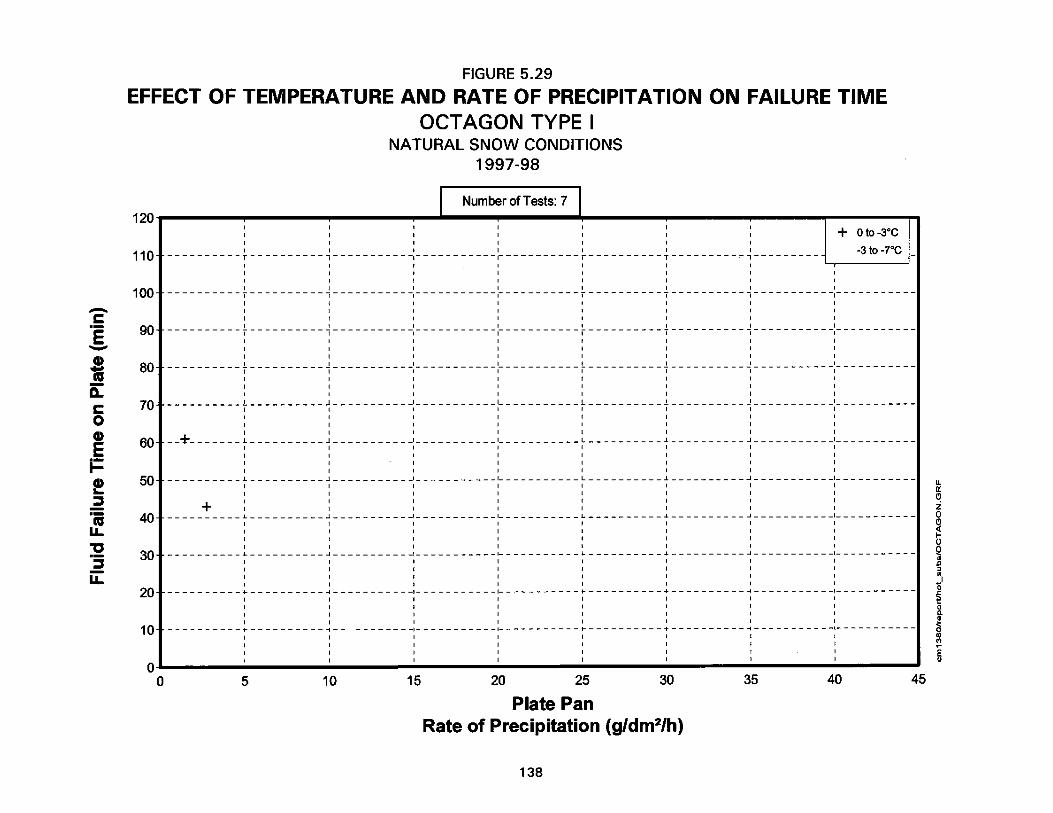
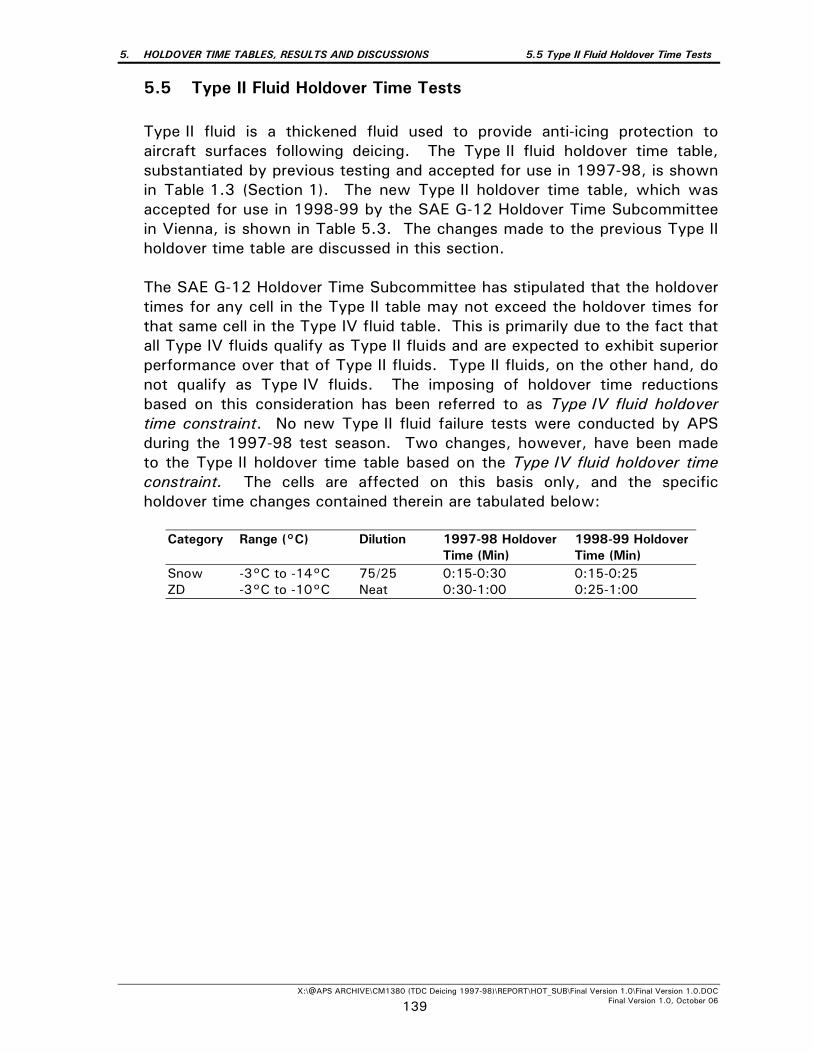
5. HOLDOVER TIME TABLES, RESULTS AND DISCUSSIONS 5.5 Type II Fluid Holdover Time Tests
X:\@APS ARCHIVE\CM1380 (TDC Deicing 1997-98)\REPORT\HOT_SUB\Final Version 1.0\Final Version 1.0.DOC Final Version 1.0, October 06 139
5.5 Type II Fluid Holdover Time Tests
Type II fluid is a thickened fluid used to provide anti-icing protection to aircraft surfaces following deicing. The Type II fluid holdover time table, substantiated by previous testing and accepted for use in 1997-98, is shown in Table 1.3 (Section 1). The new Type II holdover time table, which was accepted for use in 1998-99 by the SAE G-12 Holdover Time Subcommittee in Vienna, is shown in Table 5.3. The changes made to the previous Type II holdover time table are discussed in this section. The SAE G-12 Holdover Time Subcommittee has stipulated that the holdover times for any cell in the Type II table may not exceed the holdover times for that same cell in the Type IV fluid table. This is primarily due to the fact that all Type IV fluids qualify as Type II fluids and are expected to exhibit superior performance over that of Type II fluids. Type II fluids, on the other hand, do not qualify as Type IV fluids. The imposing of holdover time reductions based on this consideration has been referred to as Type IV fluid holdover time constraint. No new Type II fluid failure tests were conducted by APS during the 1997-98 test season. Two changes, however, have been made to the Type II holdover time table based on the Type IV fluid holdover time constraint. The cells are affected on this basis only, and the specific holdover time changes contained therein are tabulated below:
Category Range (°C) Dilution 1997-98 Holdover 1998-99 Holdover Time (Min) Time (Min) Snow -3°C to -14°C 75/25 0:15-0:30 0:15-0:25 ZD -3°C to -10°C Neat 0:30-1:00 0:25-1:00
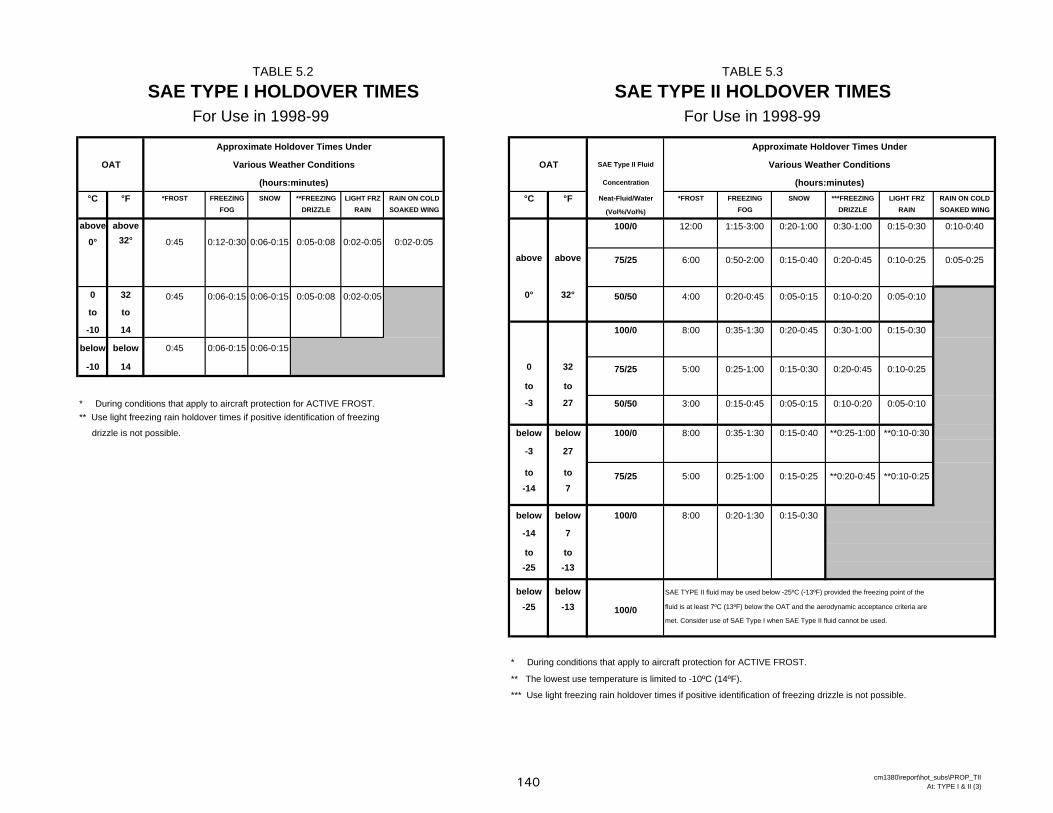
TABLE 5.2 TABLE 5.3
SAE TYPE I HOLDOVER TIMES SAE TYPE II HOLDOVER TIMES
Approximate Holdover Times Under Approximate Holdover Times Under
OAT Various Weather Conditions OAT SAE Type II Fluid Various Weather Conditions
(hours:minutes) Concentration (hours:minutes)
°C °F *FROST FREEZING SNOW **FREEZING LIGHT FRZ RAIN ON COLD °C °F Neat-Fluid/Water *FROST FREEZING SNOW ***FREEZING LIGHT FRZ RAIN ON COLDFOG DRIZZLE RAIN SOAKED WING (Vol%/Vol%) FOG DRIZZLE RAIN SOAKED WING
above above 100/0 12:00 1:15-3:00 0:20-1:00 0:30-1:00 0:15-0:30 0:10-0:40
0° 32° 0:45 0:12-0:30 0:06-0:15 0:05-0:08 0:02-0:05 0:02-0:05
above above 75/25 6:00 0:50-2:00 0:15-0:40 0:20-0:45 0:10-0:25 0:05-0:25
0 32 0:45 0:06-0:15 0:06-0:15 0:05-0:08 0:02-0:05 0° 32° 50/50 4:00 0:20-0:45 0:05-0:15 0:10-0:20 0:05-0:10
to to
-10 14 100/0 8:00 0:35-1:30 0:20-0:45 0:30-1:00 0:15-0:30
below below 0:45 0:06-0:15 0:06-0:15
-10 14 0 32 75/25 5:00 0:25-1:00 0:15-0:30 0:20-0:45 0:10-0:25
to to
* During conditions that apply to aircraft protection for ACTIVE FROST. -3 27 50/50 3:00 0:15-0:45 0:05-0:15 0:10-0:20 0:05-0:10** Use light freezing rain holdover times if positive identification of freezing
drizzle is not possible. below below 100/0 8:00 0:35-1:30 0:15-0:40 **0:25-1:00 **0:10-0:30
-3 27
to to 75/25 5:00 0:25-1:00 0:15-0:25 **0:20-0:45 **0:10-0:25-14 7
below below 100/0 8:00 0:20-1:30 0:15-0:30
-14 7
to to-25 -13
below below SAE TYPE II fluid may be used below -25ºC (-13ºF) provided the freezing point of the
-25 -13 100/0 fluid is at least 7ºC (13ºF) below the OAT and the aerodynamic acceptance criteria are
met. Consider use of SAE Type I when SAE Type II fluid cannot be used.
* During conditions that apply to aircraft protection for ACTIVE FROST.
** The lowest use temperature is limited to -10ºC (14ºF).
*** Use light freezing rain holdover times if positive identification of freezing drizzle is not possible.
For Use in 1998-99 For Use in 1998-99
140 cm1380\report\hot_subs\PROP_TIIAt: TYPE I & II (3)
5. HOLDOVER TIME TABLES, RESULTS AND DISCUSSIONS 5.6 Official and Proposed HOT Tables for 1998-99
X:\@APS ARCHIVE\CM1380 (TDC Deicing 1997-98)\REPORT\HOT_SUB\Final Version 1.0\Final Version 1.0.DOC Final Version 1.0, October 06 141
5.6 Official and Proposed Holdover Time Tables for 1998-99 The officially accepted SAE holdover time tables for Type I, Type II, and Type IV fluids are presented here. These tables are proposed for worldwide use during the 1998-99 winter season. Table 5.2 is the proposed and accepted holdover time table for Type I fluids. It is the result of material presented in Subsection 5.4. Table 5.3 is the proposed and accepted holdover time table for Type II fluids. It is the result of material presented in Subsection 5.5. There are eight Type IV fluid holdover time tables. The first, Table 5.4, is the new SAE Type IV fluid holdover time table. Tables 5.5 to 5.11 are the fluid-specific Type IV holdover time tables and correspond to Clariant MPIV 1957, Clariant MPIV 2001, Kilfrost ABC-S, Octagon MaxFlight, SPCA AD-404, SPCA AD-480, and Union Carbide Ultra+ fluids, respectively. These tables result from the material presented in Subsection 5.2. The Transport Canada and FAA versions of the SAE holdover time tables are found in Appendices G and H, respectively. This section includes the same tables but in a format that facilitates viewing of the individual holdover time cells. This format contains only a small portion of the notes listed at the bottom of the tables intended for official use.
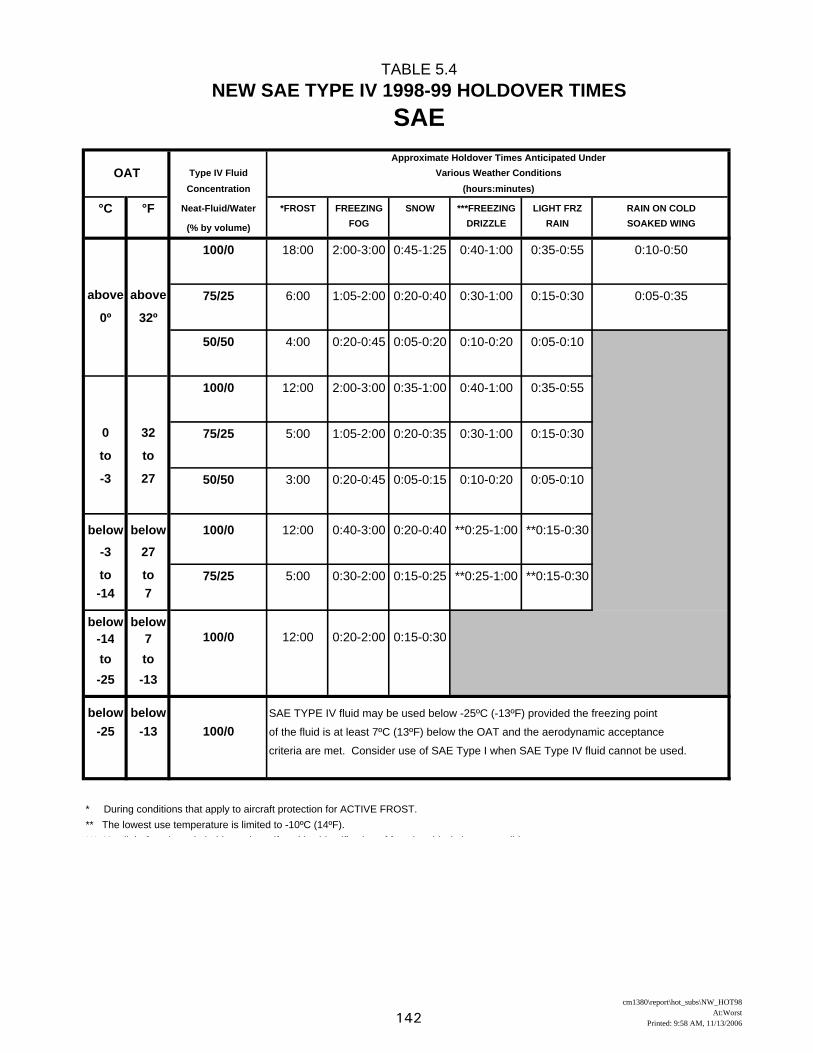
TABLE 5.4NEW SAE TYPE IV 1998-99 HOLDOVER TIMES
SAEApproximate Holdover Times Anticipated Under
OAT Type IV Fluid Various Weather ConditionsConcentration (hours:minutes)
°C °F Neat-Fluid/Water *FROST FREEZING SNOW ***FREEZING LIGHT FRZ RAIN ON COLD
(% by volume) FOG DRIZZLE RAIN SOAKED WING
100/0 18:00 2:00-3:00 0:45-1:25 0:40-1:00 0:35-0:55 0:10-0:50
above above 75/25 6:00 1:05-2:00 0:20-0:40 0:30-1:00 0:15-0:30 0:05-0:35
0º 32º
50/50 4:00 0:20-0:45 0:05-0:20 0:10-0:20 0:05-0:10
100/0 12:00 2:00-3:00 0:35-1:00 0:40-1:00 0:35-0:55
0 32 75/25 5:00 1:05-2:00 0:20-0:35 0:30-1:00 0:15-0:30
to to
-3 27 50/50 3:00 0:20-0:45 0:05-0:15 0:10-0:20 0:05-0:10
below below 100/0 12:00 0:40-3:00 0:20-0:40 **0:25-1:00 **0:15-0:30
-3 27
to to 75/25 5:00 0:30-2:00 0:15-0:25 **0:25-1:00 **0:15-0:30-14 7
below below-14 7 100/0 12:00 0:20-2:00 0:15-0:30
to to-25 -13
below below SAE TYPE IV fluid may be used below -25ºC (-13ºF) provided the freezing point
-25 -13 100/0 of the fluid is at least 7ºC (13ºF) below the OAT and the aerodynamic acceptance
criteria are met. Consider use of SAE Type I when SAE Type IV fluid cannot be used.
* During conditions that apply to aircraft protection for ACTIVE FROST.** The lowest use temperature is limited to -10ºC (14ºF).*** U li ht f i i h ld ti if iti id tifi ti f f i d i l i t ibl
142cm1380\report\hot_subs\NW_HOT98
At:Worst Printed: 9:58 AM, 11/13/2006
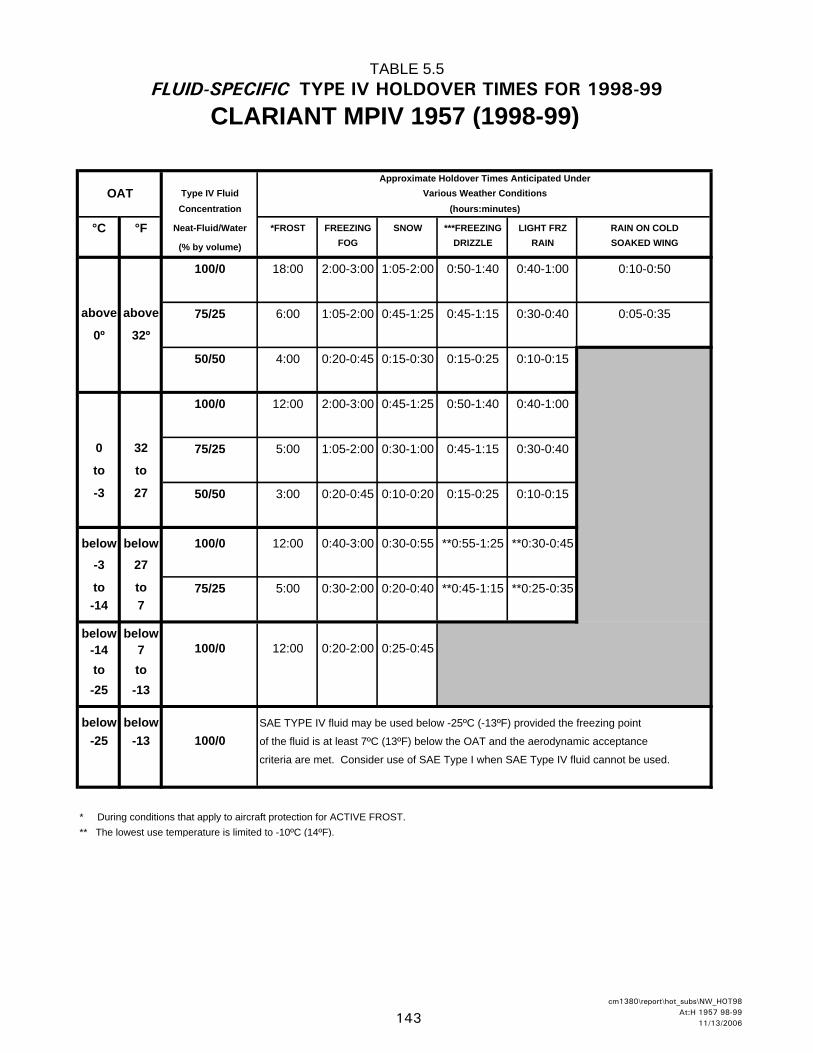
TABLE 5.5FLUID-SPECIFIC TYPE IV HOLDOVER TIMES FOR 1998-99
CLARIANT MPIV 1957 (1998-99)
Approximate Holdover Times Anticipated UnderOAT Type IV Fluid Various Weather Conditions
Concentration (hours:minutes)
°C °F Neat-Fluid/Water *FROST FREEZING SNOW ***FREEZING LIGHT FRZ RAIN ON COLD
(% by volume) FOG DRIZZLE RAIN SOAKED WING
100/0 18:00 2:00-3:00 1:05-2:00 0:50-1:40 0:40-1:00 0:10-0:50
above above 75/25 6:00 1:05-2:00 0:45-1:25 0:45-1:15 0:30-0:40 0:05-0:35
0º 32º
50/50 4:00 0:20-0:45 0:15-0:30 0:15-0:25 0:10-0:15
100/0 12:00 2:00-3:00 0:45-1:25 0:50-1:40 0:40-1:00
0 32 75/25 5:00 1:05-2:00 0:30-1:00 0:45-1:15 0:30-0:40
to to
-3 27 50/50 3:00 0:20-0:45 0:10-0:20 0:15-0:25 0:10-0:15
below below 100/0 12:00 0:40-3:00 0:30-0:55 **0:55-1:25 **0:30-0:45
-3 27
to to 75/25 5:00 0:30-2:00 0:20-0:40 **0:45-1:15 **0:25-0:35-14 7
below below-14 7 100/0 12:00 0:20-2:00 0:25-0:45
to to-25 -13
below below SAE TYPE IV fluid may be used below -25ºC (-13ºF) provided the freezing point
-25 -13 100/0 of the fluid is at least 7ºC (13ºF) below the OAT and the aerodynamic acceptance
criteria are met. Consider use of SAE Type I when SAE Type IV fluid cannot be used.
* During conditions that apply to aircraft protection for ACTIVE FROST.** The lowest use temperature is limited to -10ºC (14ºF).
143cm1380\report\hot_subs\NW_HOT98
At:H 1957 98-99 11/13/2006

TABLE 5.6FLUID-SPECIFIC TYPE IV HOLDOVER TIMES FOR 1998-99
CLARIANT MPIV 2001
Approximate Holdover Times Anticipated UnderOAT Type IV Fluid Various Weather Conditions
Concentration (hours:minutes)
°C °F Neat-Fluid/Water *FROST FREEZING SNOW ***FREEZING LIGHT FRZ RAIN ON COLD
(% by volume) FOG DRIZZLE RAIN SOAKED WING
100/0 18:00 2:00-3:00 1:55-2:00 0:55-1:55 0:40-1:00 0:10-0:50
above above 75/25 6:00 1:05-2:00 0:50-1:25 0:35-1:10 0:25-0:35 0:05-0:35
0º 32º
50/50 4:00 0:20-0:45 0:10-0:20 0:10-0:20 0:10-0:15
100/0 12:00 2:00-3:00 1:00-1:55 0:55-1:55 0:40-1:00
0 32 75/25 5:00 1:05-2:00 0:35-1:00 0:35-1:10 0:25-0:35
to to
-3 27 50/50 3:00 0:20-0:45 0:10-0:20 0:10-0:20 0:10-0:15
below below 100/0 12:00 0:40-3:00 0:30-0:50 **0:55-1:35 **0:30-0:45
-3 27
to to 75/25 5:00 0:30-2:00 0:20-0:35 **0:40-1:10 **0:20-0:30-14 7
below below-14 7 100/0 12:00 0:20-2:00 0:20-0:35
to to-25 -13
below below SAE TYPE IV fluid may be used below -25ºC (-13ºF) provided the freezing point
-25 -13 100/0 of the fluid is at least 7ºC (13ºF) below the OAT and the aerodynamic acceptance
criteria are met. Consider use of SAE Type I when SAE Type IV fluid cannot be used.
* During conditions that apply to aircraft protection for ACTIVE FROST.** The lowest use temperature is limited to -10ºC (14ºF).
144cm1380\report\hot_subs\NW_HOT98
At:H 2001 98-99 11/13/2006
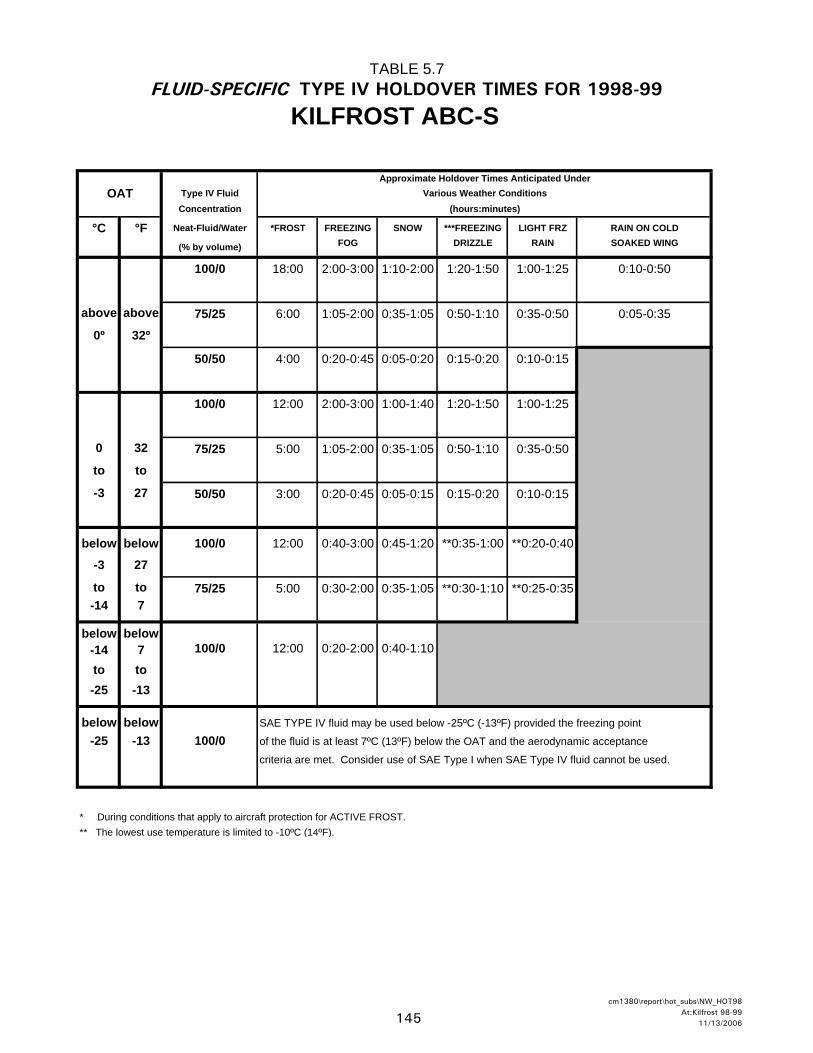
TABLE 5.7FLUID-SPECIFIC TYPE IV HOLDOVER TIMES FOR 1998-99
KILFROST ABC-S
Approximate Holdover Times Anticipated UnderOAT Type IV Fluid Various Weather Conditions
Concentration (hours:minutes)
°C °F Neat-Fluid/Water *FROST FREEZING SNOW ***FREEZING LIGHT FRZ RAIN ON COLD
(% by volume) FOG DRIZZLE RAIN SOAKED WING
100/0 18:00 2:00-3:00 1:10-2:00 1:20-1:50 1:00-1:25 0:10-0:50
above above 75/25 6:00 1:05-2:00 0:35-1:05 0:50-1:10 0:35-0:50 0:05-0:35
0º 32º
50/50 4:00 0:20-0:45 0:05-0:20 0:15-0:20 0:10-0:15
100/0 12:00 2:00-3:00 1:00-1:40 1:20-1:50 1:00-1:25
0 32 75/25 5:00 1:05-2:00 0:35-1:05 0:50-1:10 0:35-0:50
to to
-3 27 50/50 3:00 0:20-0:45 0:05-0:15 0:15-0:20 0:10-0:15
below below 100/0 12:00 0:40-3:00 0:45-1:20 **0:35-1:00 **0:20-0:40
-3 27
to to 75/25 5:00 0:30-2:00 0:35-1:05 **0:30-1:10 **0:25-0:35-14 7
below below-14 7 100/0 12:00 0:20-2:00 0:40-1:10
to to-25 -13
below below SAE TYPE IV fluid may be used below -25ºC (-13ºF) provided the freezing point
-25 -13 100/0 of the fluid is at least 7ºC (13ºF) below the OAT and the aerodynamic acceptance
criteria are met. Consider use of SAE Type I when SAE Type IV fluid cannot be used.
* During conditions that apply to aircraft protection for ACTIVE FROST.** The lowest use temperature is limited to -10ºC (14ºF).
145cm1380\report\hot_subs\NW_HOT98
At:Kilfrost 98-99 11/13/2006

TABLE 5.8FLUID-SPECIFIC TYPE IV HOLDOVER TIMES FOR 1998-99
OCTAGON MAXFLIGHT
Approximate Holdover Times Anticipated UnderOAT Type IV Fluid Various Weather Conditions
Concentration (hours:minutes)
°C °F Neat-Fluid/Water *FROST FREEZING SNOW ***FREEZING LIGHT FRZ RAIN ON COLD
(% by volume) FOG DRIZZLE RAIN SOAKED WING
100/0 18:00 2:00-3:00 1:15-2:00 0:55-2:00 0:35-1:00 0:10-0:50
above above 75/25 6:00 1:05-2:00 1:20-2:00 1:15-2:00 0:35-1:10 0:05-0:35
0º 32º
50/50 4:00 0:20-0:45 0:40-1:20 0:35-1:00 0:15-0:30
100/0 12:00 2:00-3:00 0:50-1:35 0:55-2:00 0:35-1:00
0 32 75/25 5:00 1:05-2:00 0:45-1:45 1:15-2:00 0:35-1:10
to to
-3 27 50/50 3:00 0:20-0:45 0:40-1:20 0:35-1:00 0:15-0:30
below below 100/0 12:00 0:40-3:00 0:25-0:50 **0:30-1:10 **0:20-0:40
-3 27
to to 75/25 5:00 0:30-2:00 0:20-0:50 **0:25-1:05 **0:20-0:30-14 7
below below-14 7 100/0 12:00 0:20-2:00 0:20-0:40
to to-25 -13
below below SAE TYPE IV fluid may be used below -25ºC (-13ºF) provided the freezing point
-25 -13 100/0 of the fluid is at least 7ºC (13ºF) below the OAT and the aerodynamic acceptance
criteria are met. Consider use of SAE Type I when SAE Type IV fluid cannot be used.
* During conditions that apply to aircraft protection for ACTIVE FROST.** The lowest use temperature is limited to -10ºC (14ºF).
146cm1380\report\hot_subs\NW_HOT98
At:Octagon 98-99 11/13/2006

TABLE 5.9FLUID-SPECIFIC TYPE IV HOLDOVER TIMES FOR 1998-99
SPCA AD-404
Approximate Holdover Times Anticipated UnderOAT Type IV Fluid Various Weather Conditions
Concentration (hours:minutes)
°C °F Neat-Fluid/Water *FROST FREEZING SNOW ***FREEZING LIGHT FRZ RAIN ON COLD
(% by volume) FOG DRIZZLE RAIN SOAKED WING
100/0 18:00 2:00-3:00 1:40-2:00 1:40-2:00 0:45-1:20 0:10-0:50
above above 75/25 6:00 1:05-2:00 0:50-1:45 0:50-1:50 0:30-0:50 0:05-0:35
0º 32º
50/50 4:00 0:20-0:45 0:20-0:45 0:25-0:55 0:15-0:35
100/0 12:00 2:00-3:00 1:00-1:45 1:40-2:00 0:45-1:20
0 32 75/25 5:00 1:05-2:00 0:25-1:00 0:50-1:50 0:30-0:50
to to
-3 27 50/50 3:00 0:20-0:45 0:15-0:30 0:25-0:55 0:15-0:35
below below 100/0 12:00 0:40-3:00 0:35-1:00 **1:05-2:00 **0:35-1:20
-3 27
to to 75/25 5:00 0:30-2:00 0:15-0:25 **0:30-1:45 **0:30-0:45-14 7
below below-14 7 100/0 12:00 0:20-2:00 0:15-0:30
to to-25 -13
below below SAE TYPE IV fluid may be used below -25ºC (-13ºF) provided the freezing point
-25 -13 100/0 of the fluid is at least 7ºC (13ºF) below the OAT and the aerodynamic acceptance
criteria are met. Consider use of SAE Type I when SAE Type IV fluid cannot be used.
* During conditions that apply to aircraft protection for ACTIVE FROST.** The lowest use temperature is limited to -10ºC (14ºF).
147cm1380\report\hot_subs\NW_HOT98
At:SPCA 404 98-99 11/13/2006
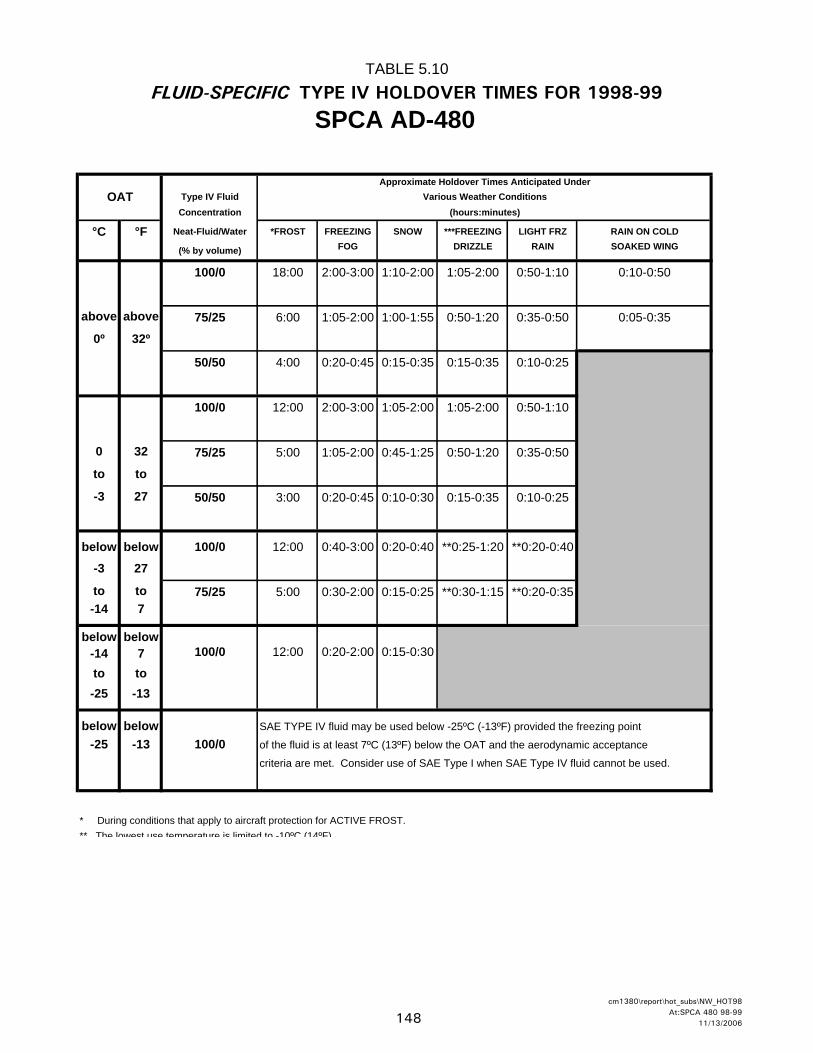
TABLE 5.10FLUID-SPECIFIC TYPE IV HOLDOVER TIMES FOR 1998-99
SPCA AD-480
Approximate Holdover Times Anticipated UnderOAT Type IV Fluid Various Weather Conditions
Concentration (hours:minutes)
°C °F Neat-Fluid/Water *FROST FREEZING SNOW ***FREEZING LIGHT FRZ RAIN ON COLD
(% by volume) FOG DRIZZLE RAIN SOAKED WING
100/0 18:00 2:00-3:00 1:10-2:00 1:05-2:00 0:50-1:10 0:10-0:50
above above 75/25 6:00 1:05-2:00 1:00-1:55 0:50-1:20 0:35-0:50 0:05-0:35
0º 32º
50/50 4:00 0:20-0:45 0:15-0:35 0:15-0:35 0:10-0:25
100/0 12:00 2:00-3:00 1:05-2:00 1:05-2:00 0:50-1:10
0 32 75/25 5:00 1:05-2:00 0:45-1:25 0:50-1:20 0:35-0:50
to to
-3 27 50/50 3:00 0:20-0:45 0:10-0:30 0:15-0:35 0:10-0:25
below below 100/0 12:00 0:40-3:00 0:20-0:40 **0:25-1:20 **0:20-0:40
-3 27
to to 75/25 5:00 0:30-2:00 0:15-0:25 **0:30-1:15 **0:20-0:35-14 7
below below-14 7 100/0 12:00 0:20-2:00 0:15-0:30
to to-25 -13
below below SAE TYPE IV fluid may be used below -25ºC (-13ºF) provided the freezing point
-25 -13 100/0 of the fluid is at least 7ºC (13ºF) below the OAT and the aerodynamic acceptance
criteria are met. Consider use of SAE Type I when SAE Type IV fluid cannot be used.
* During conditions that apply to aircraft protection for ACTIVE FROST.** The lowest use temperature is limited to -10ºC (14ºF)
148cm1380\report\hot_subs\NW_HOT98
At:SPCA 480 98-99 11/13/2006
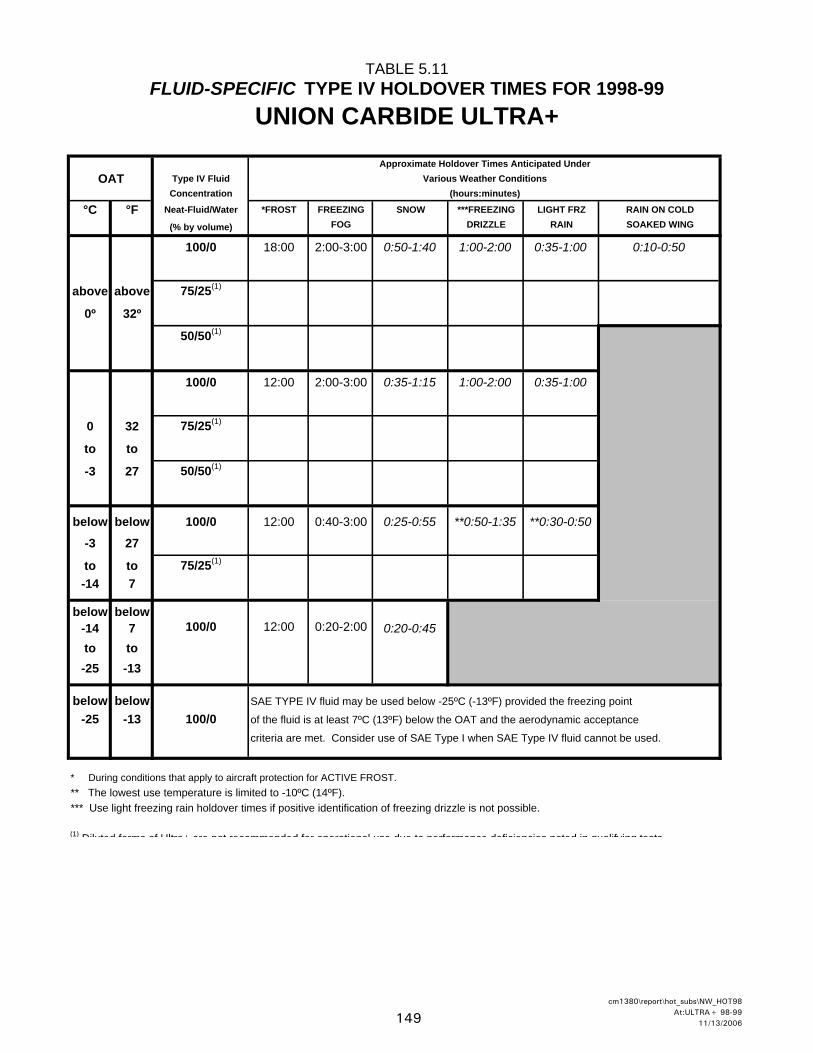
TABLE 5.11FLUID-SPECIFIC TYPE IV HOLDOVER TIMES FOR 1998-99
UNION CARBIDE ULTRA+Approximate Holdover Times Anticipated Under
OAT Type IV Fluid Various Weather ConditionsConcentration (hours:minutes)
°C °F Neat-Fluid/Water *FROST FREEZING SNOW ***FREEZING LIGHT FRZ RAIN ON COLD
(% by volume) FOG DRIZZLE RAIN SOAKED WING
100/0 18:00 2:00-3:00 0:50-1:40 1:00-2:00 0:35-1:00 0:10-0:50
above above 75/25(1)
0º 32º
50/50(1)
100/0 12:00 2:00-3:00 0:35-1:15 1:00-2:00 0:35-1:00
0 32 75/25(1)
to to
-3 27 50/50(1)
below below 100/0 12:00 0:40-3:00 0:25-0:55 **0:50-1:35 **0:30-0:50
-3 27
to to 75/25(1)
-14 7
below below-14 7 100/0 12:00 0:20-2:00 0:20-0:45to to-25 -13
below below SAE TYPE IV fluid may be used below -25ºC (-13ºF) provided the freezing point
-25 -13 100/0 of the fluid is at least 7ºC (13ºF) below the OAT and the aerodynamic acceptance
criteria are met. Consider use of SAE Type I when SAE Type IV fluid cannot be used.
* During conditions that apply to aircraft protection for ACTIVE FROST.** The lowest use temperature is limited to -10ºC (14ºF).*** Use light freezing rain holdover times if positive identification of freezing drizzle is not possible.
(1) Diluted forms of Ultra+ are not recommended for operational use due to performance deficiencies noted in qualifying tests
149cm1380\report\hot_subs\NW_HOT98
At:ULTRA+ 98-99 11/13/2006

150
This page intentionally left blank
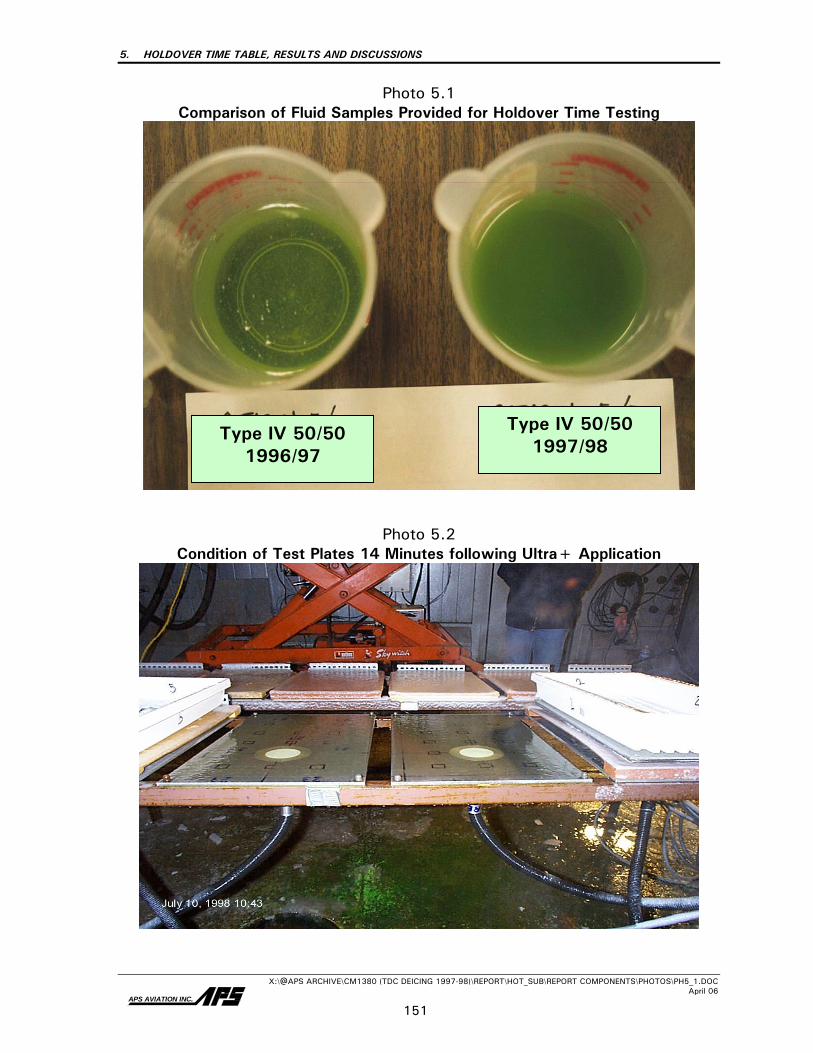
5. HOLDOVER TIME TABLE, RESULTS AND DISCUSSIONS
X:\@APS ARCHIVE\CM1380 (TDC DEICING 1997-98)\REPORT\HOT_SUB\REPORT COMPONENTS\PHOTOS\PH5_1.DOC April 06 APS AVIATION INC.
151
Photo 5.1 Comparison of Fluid Samples Provided for Holdover Time Testing
Photo 5.2
Condition of Test Plates 14 Minutes following Ultra+ Application
Type IV 50/50 1996/97
Type IV 50/50 1997/98

152
This page intentionally left blank.
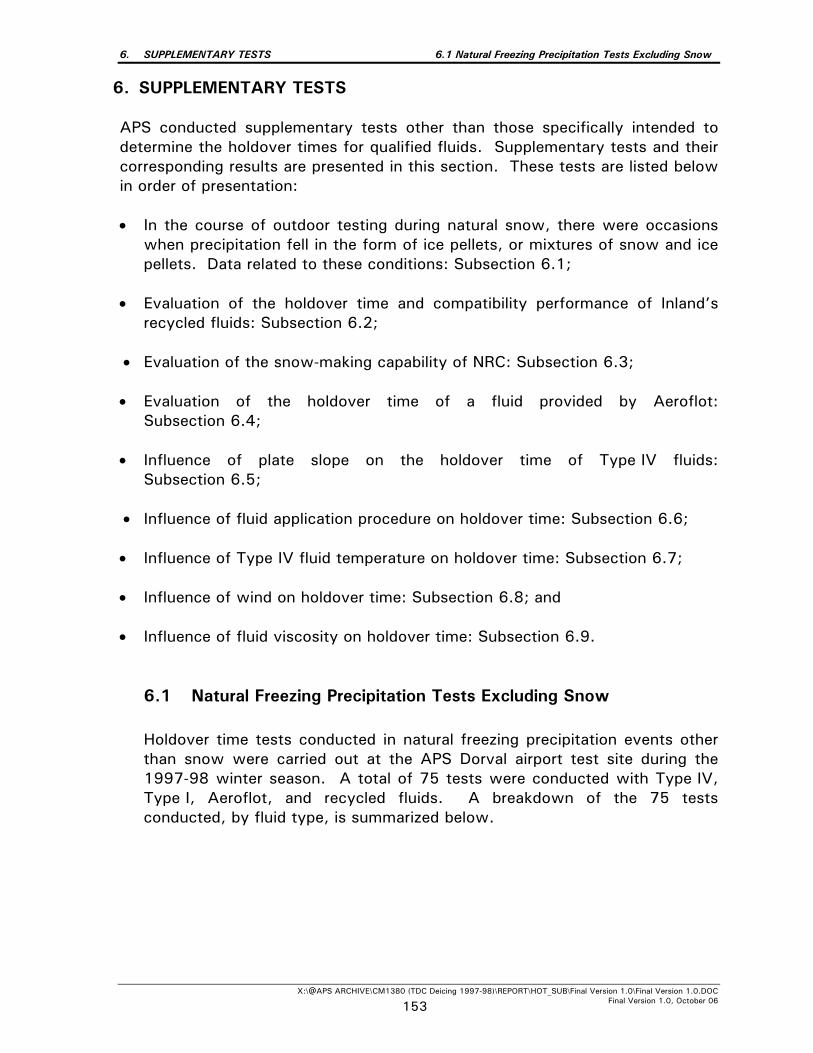
6. SUPPLEMENTARY TESTS 6.1 Natural Freezing Precipitation Tests Excluding Snow
X:\@APS ARCHIVE\CM1380 (TDC Deicing 1997-98)\REPORT\HOT_SUB\Final Version 1.0\Final Version 1.0.DOC Final Version 1.0, October 06 153
6. SUPPLEMENTARY TESTS APS conducted supplementary tests other than those specifically intended to determine the holdover times for qualified fluids. Supplementary tests and their corresponding results are presented in this section. These tests are listed below in order of presentation: • In the course of outdoor testing during natural snow, there were occasions
when precipitation fell in the form of ice pellets, or mixtures of snow and ice pellets. Data related to these conditions: Subsection 6.1;
• Evaluation of the holdover time and compatibility performance of Inland’s
recycled fluids: Subsection 6.2; • Evaluation of the snow-making capability of NRC: Subsection 6.3; • Evaluation of the holdover time of a fluid provided by Aeroflot:
Subsection 6.4; • Influence of plate slope on the holdover time of Type IV fluids:
Subsection 6.5; • Influence of fluid application procedure on holdover time: Subsection 6.6; • Influence of Type IV fluid temperature on holdover time: Subsection 6.7; • Influence of wind on holdover time: Subsection 6.8; and • Influence of fluid viscosity on holdover time: Subsection 6.9.
6.1 Natural Freezing Precipitation Tests Excluding Snow Holdover time tests conducted in natural freezing precipitation events other than snow were carried out at the APS Dorval airport test site during the 1997-98 winter season. A total of 75 tests were conducted with Type IV, Type I, Aeroflot, and recycled fluids. A breakdown of the 75 tests conducted, by fluid type, is summarized below.
6. SUPPLEMENTARY TESTS 6.1 Natural Freezing Precipitation Tests Excluding Snow
X:\@APS ARCHIVE\CM1380 (TDC Deicing 1997-98)\REPORT\HOT_SUB\Final Version 1.0\Final Version 1.0.DOC Final Version 1.0, October 06 154
Fluid Type # of Tests Type IV Neat 6 Type IV 75/25 25 Type IV 50/50 14 Type I (Standard) 12 Recycled Fluid 14 Aeroflot 14 TOTAL TESTS 75
Figures 6.1 to 6.3 contain Type IV fluid data plotted for three concentrations: neat, 75/25, and 50/50, respectively. Figure 6.4 contains the Aeroflot, Type I, and recycled fluid data. Only 58 tests were used for these plots; the remaining 17 tests were Union Carbide’s Ultra IV and PG AAF, which did not satisfy SAE specifications. A list of all the natural freezing precipitation tests conducted at Dorval airport is included in Appendix D. The 75 tests were conducted during conditions of ice pellets or mixtures of snow with ice pellets. A comparison between the fluid failure times recorded in these freezing precipitation events and the fluid-specific holdover time tables shows that the failure time data points, lying approximately between 10 and 25 g/dm²/h, satisfy the holdover times for the snow category. Only two tests conducted with SPCA AD-404 neat fluid at +1°C were slightly below the holdover time range. These points are plotted along with two data points for SPCA AD-480.
Due to the ambiguities related to calling failures in the ice pellet conditions, failure times cited in these data may exhibit wide variations. Although the fluid failure times cited generally fall between the upper and lower holdover time limits, snow holdover times may not be severe enough to match ice accumulation rates in certain ice pellet and related conditions. Additional data corresponding to similar tests carried out from 1991 to 1996 are compiled in Appendix F of Transport Canada report TP 12896E (11).
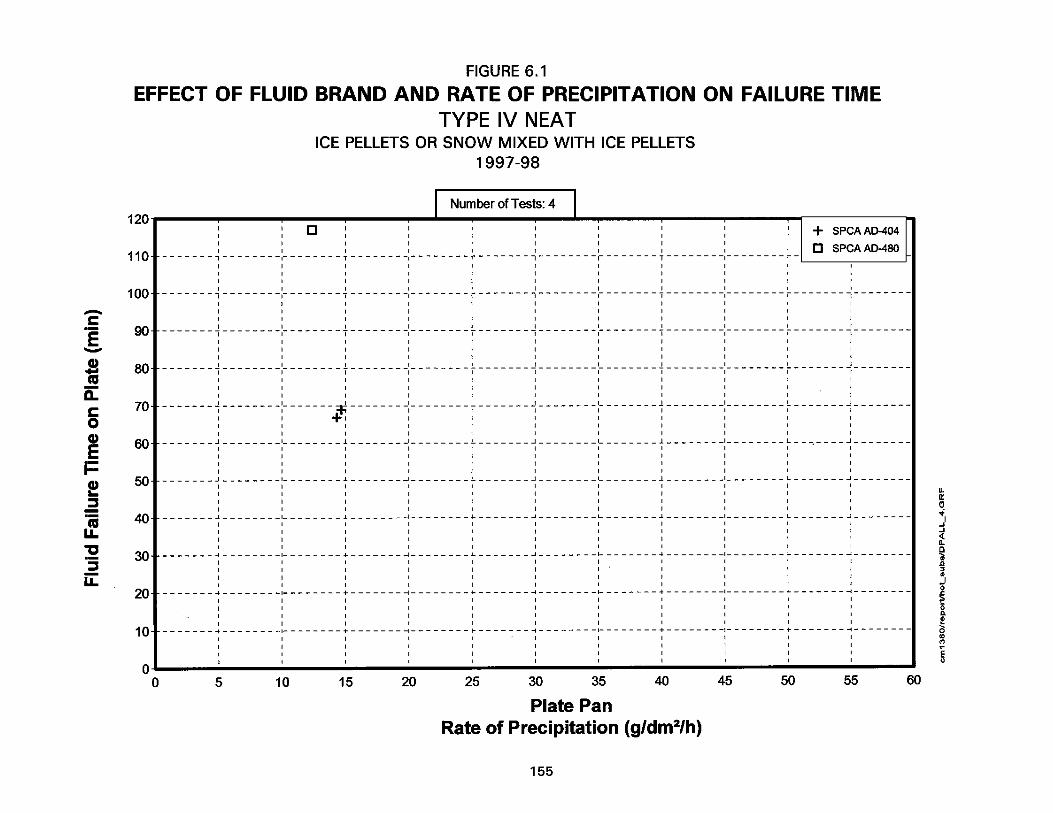
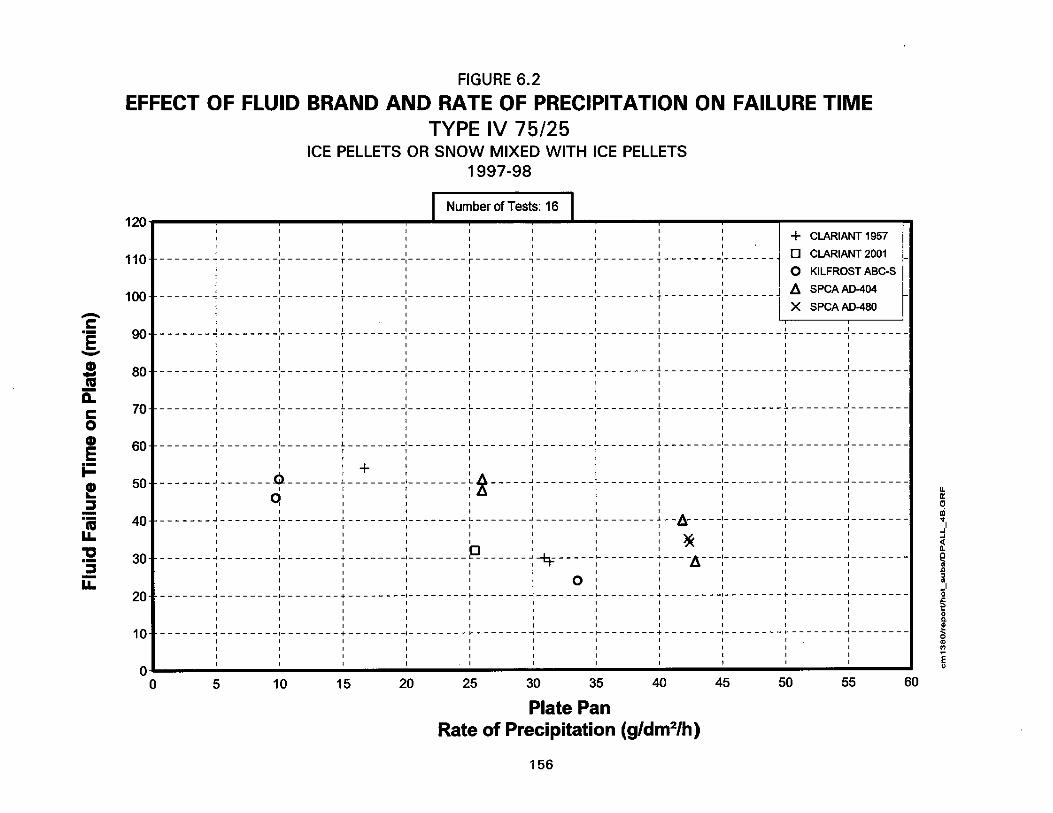
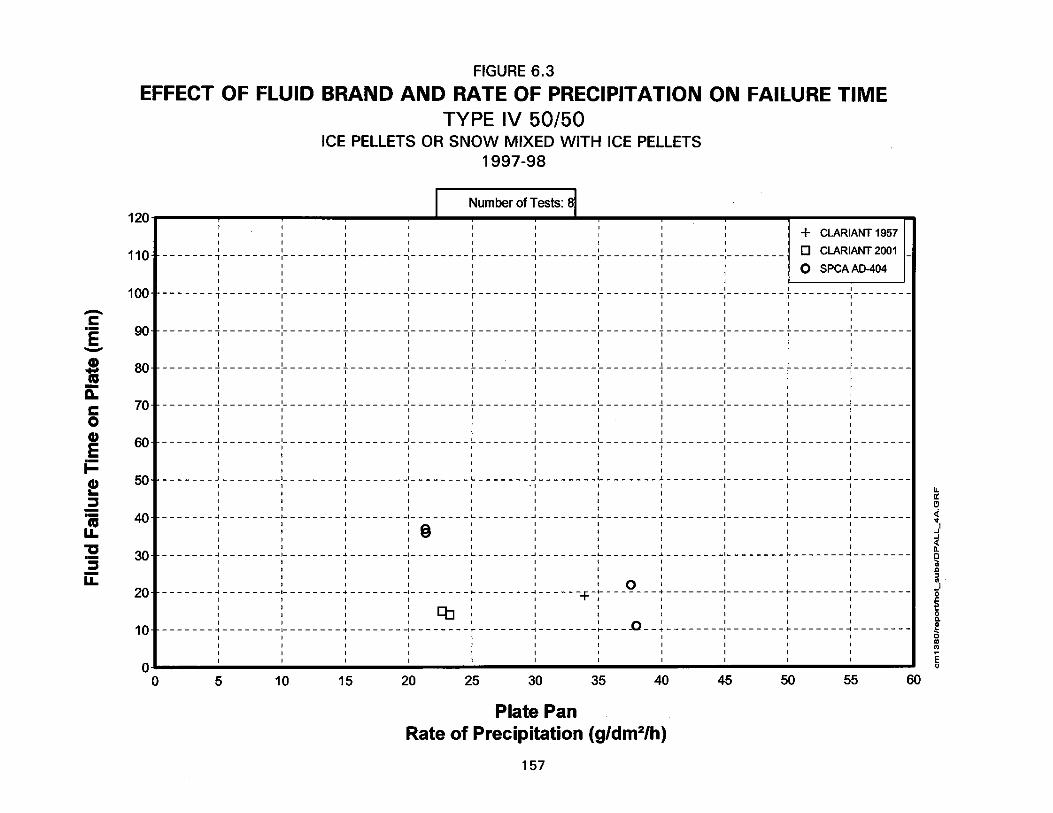
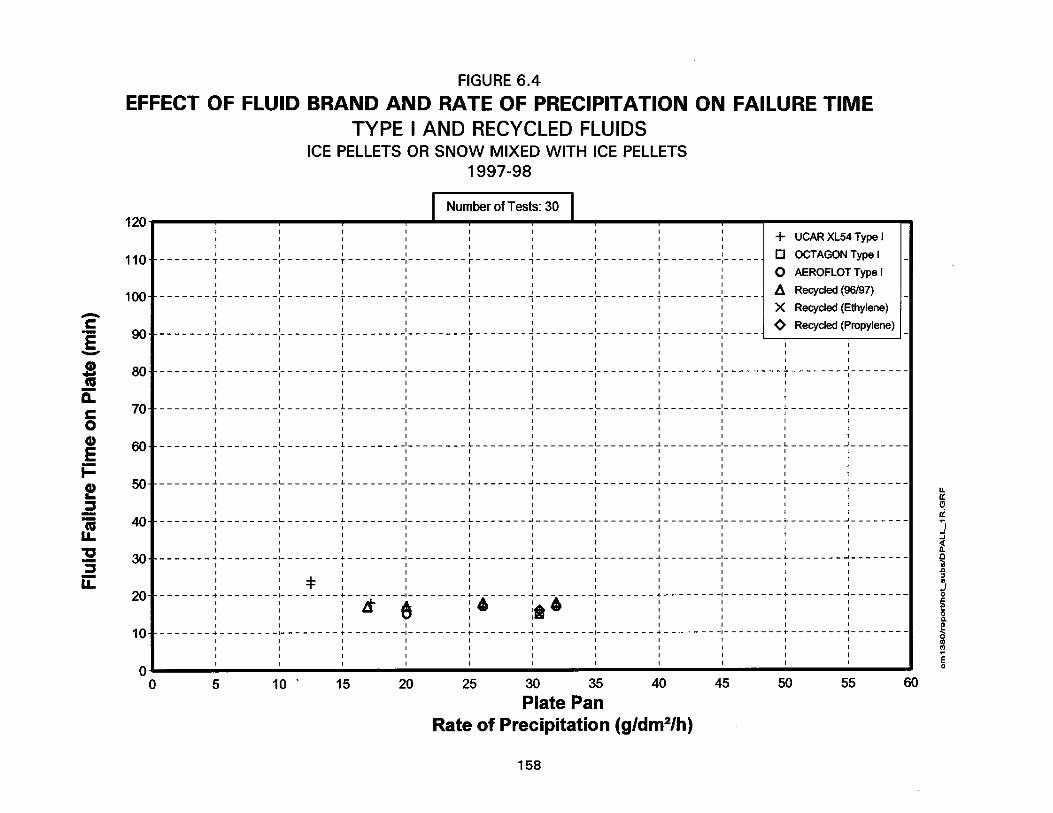
6. SUPPLEMENTARY TESTS 6.2 Evaluation of Recycled Fluids
X:\@APS ARCHIVE\CM1380 (TDC Deicing 1997-98)\REPORT\HOT_SUB\Final Version 1.0\Final Version 1.0.DOC Final Version 1.0, October 06 159
6.2 Evaluation of Recycled Fluids
At the request of TDC, APS Aviation was asked to evaluate the holdover time performance and fluid compatibility performance of two recycled fluids, one ethylene glycol-based and one propylene glycol-based. Both fluids were supplied by Inland Technologies Inc.
The fluids are currently being marketed as first-step or washdown fluids in two-step fluid applications; however, Inland is seeking certification of the fluids for potential future use on aircraft in the same capacity as commercial Type I fluids. The recycled Inland fluids are referred to as recycled ethylene and recycled propylene in this report. To gain acceptance for use of the fluids on aircraft, Inland is conducting corrosion tests with SMI, and WSET, HHET and aerodynamic acceptance tests with UQAC.
A series of preliminary holdover time and compatibility tests were also performed in Dorval by APS in 1996-97, using one batch of recycled ethylene fluid provided by Inland. The results of these tests appear in Transport Canada report TP 13131E (1).
6.2.1 Holdover Time
Over the past two test seasons, APS has conducted holdover time tests with Inland fluids in natural snow, light freezing rain, freezing drizzle, and rain on a cold-soaked wing conditions. Holdover time tests in natural snow were performed at the APS Dorval Airport test facility in 1997-98. The procedures used in the conduct of outdoor tests on the recycled fluids are outlined in Appendix B.
In total, 40 holdover time tests in natural snow were conducted in 1997-98 with Inland fluids, which included:
• 12 tests with Inland recycled ethylene fluid provided in 1996-97; • 13 tests with Inland recycled ethylene fluid provided in 1997-98; and • 15 tests with Inland recycled propylene fluid provided in 1997-98.
The majority of holdover time tests with recycled fluids in natural snow were conducted alongside plates of commercial Type I fluids for holdover time comparison. The results of these snow tests, including the Type I results, are plotted in the form of fluid failure time versus rate of precipitation (as a function of fluid type) and are displayed in Figure 6.5.
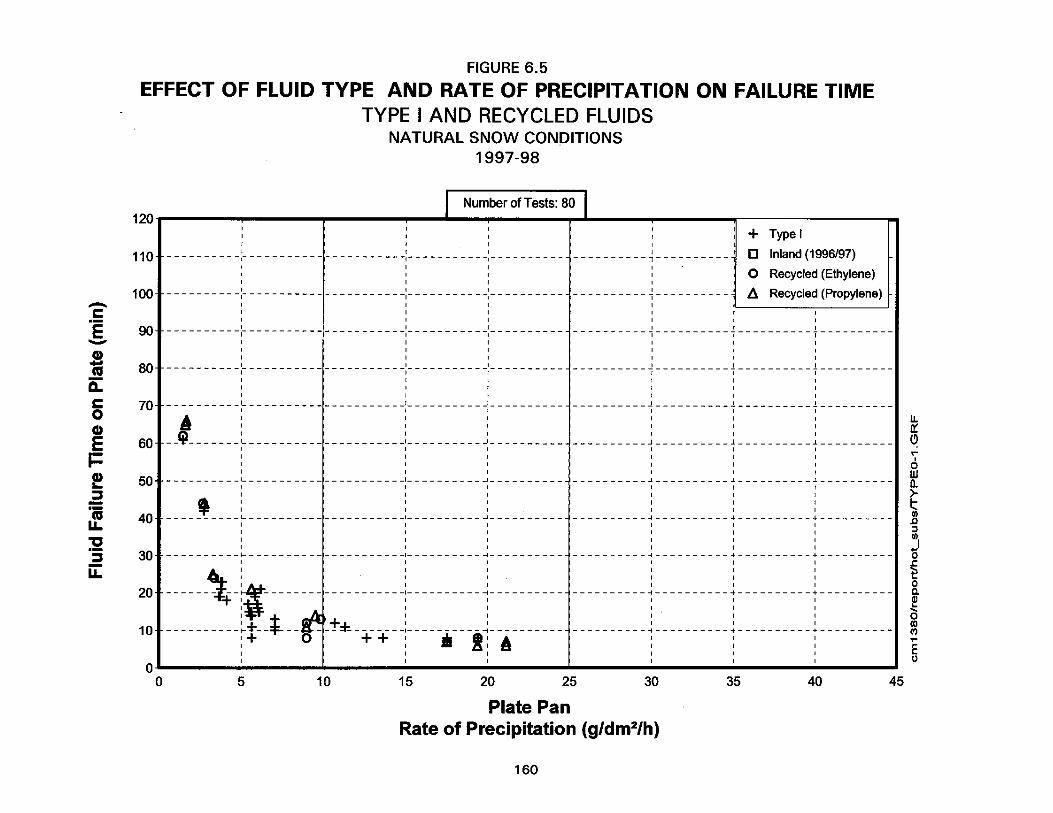
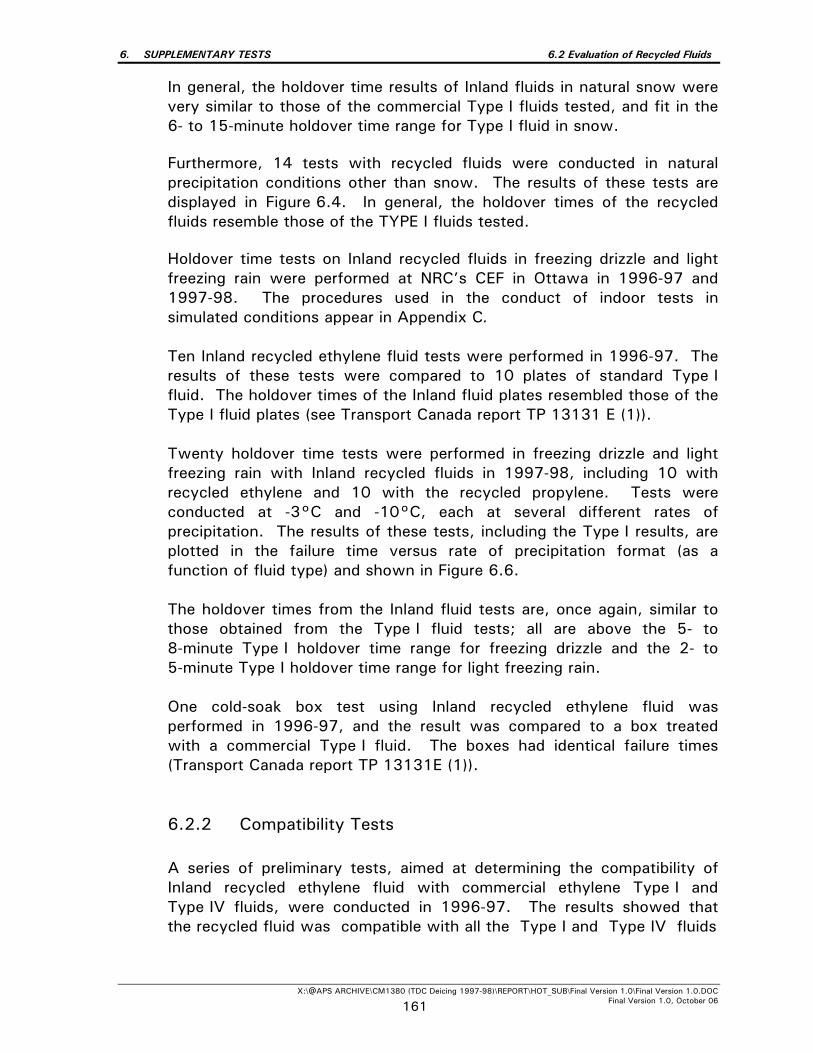
6. SUPPLEMENTARY TESTS 6.2 Evaluation of Recycled Fluids
X:\@APS ARCHIVE\CM1380 (TDC Deicing 1997-98)\REPORT\HOT_SUB\Final Version 1.0\Final Version 1.0.DOC Final Version 1.0, October 06 161
In general, the holdover time results of Inland fluids in natural snow were very similar to those of the commercial Type I fluids tested, and fit in the 6- to 15-minute holdover time range for Type I fluid in snow.
Furthermore, 14 tests with recycled fluids were conducted in natural precipitation conditions other than snow. The results of these tests are displayed in Figure 6.4. In general, the holdover times of the recycled fluids resemble those of the TYPE I fluids tested.
Holdover time tests on Inland recycled fluids in freezing drizzle and light freezing rain were performed at NRC’s CEF in Ottawa in 1996-97 and 1997-98. The procedures used in the conduct of indoor tests in simulated conditions appear in Appendix C. Ten Inland recycled ethylene fluid tests were performed in 1996-97. The results of these tests were compared to 10 plates of standard Type I fluid. The holdover times of the Inland fluid plates resembled those of the Type I fluid plates (see Transport Canada report TP 13131 E (1)).
Twenty holdover time tests were performed in freezing drizzle and light freezing rain with Inland recycled fluids in 1997-98, including 10 with recycled ethylene and 10 with the recycled propylene. Tests were conducted at -3°C and -10°C, each at several different rates of precipitation. The results of these tests, including the Type I results, are plotted in the failure time versus rate of precipitation format (as a function of fluid type) and shown in Figure 6.6.
The holdover times from the Inland fluid tests are, once again, similar to those obtained from the Type I fluid tests; all are above the 5- to 8-minute Type I holdover time range for freezing drizzle and the 2- to 5-minute Type I holdover time range for light freezing rain.
One cold-soak box test using Inland recycled ethylene fluid was performed in 1996-97, and the result was compared to a box treated with a commercial Type I fluid. The boxes had identical failure times (Transport Canada report TP 13131E (1)). 6.2.2 Compatibility Tests
A series of preliminary tests, aimed at determining the compatibility of Inland recycled ethylene fluid with commercial ethylene Type I and Type IV fluids, were conducted in 1996-97. The results showed that the recycled fluid was compatible with all the Type I and Type IV fluids
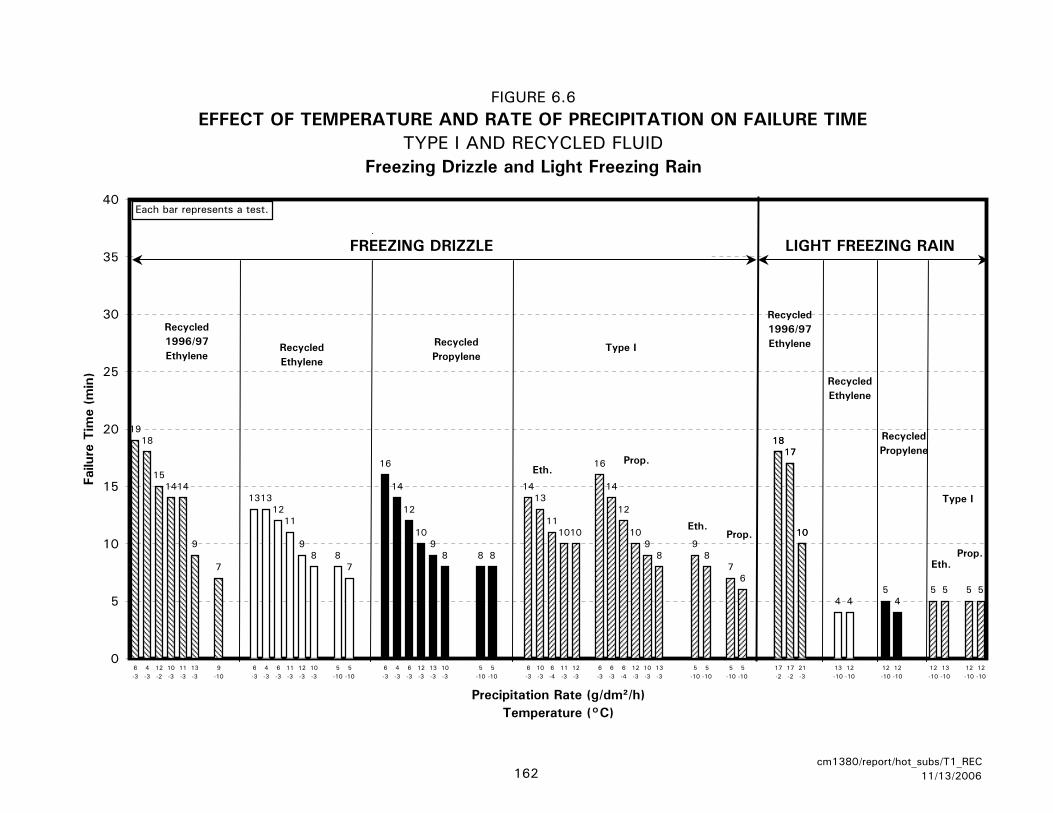
162cm1380/report/hot_subs/T1_REC
11/13/2006
FIGURE 6.6EFFECT OF TEMPERATURE AND RATE OF PRECIPITATION ON FAILURE TIME
TYPE I AND RECYCLED FLUIDFreezing Drizzle and Light Freezing Rain
1413
111010
16
14
12
109
89
87
6
1918
151414
9
7
131312
11
98 8
7
16
14
12
109
8 8 8
5 5 5 5
1817
10
4 45
4
1817
10
0
5
10
15
20
25
30
35
40
6-3
4-3
12-2
10-3
11-3
13-3
9-10
6-3
4-3
6-3
11-3
12-3
10-3
5-10
5-10
6-3
4-3
6-3
12-3
13-3
10-3
5-10
5-10
6-3
10-3
6-4
11-3
12-3
6-3
6-3
6-4
12-3
10-3
13-3
5-10
5-10
5-10
5-10
17-2
17-2
21-3
13-10
12-10
12-10
12-10
12-10
13-10
12-10
12-10
Precipitation Rate (g/dm²/h)Temperature (°C)
Failu
re T
ime
(min
)
FREEZING DRIZZLE
RecycledEthylene
RecycledPropylene
Type I
Recycled1996/97Ethylene
Type I
RecycledPropylene
RecycledEthylene
LIGHT FREEZING RAIN
Each bar represents a test.
Recycled1996/97Ethylene
Eth.
Eth.
Prop.
Prop.
Eth.Prop.
6. SUPPLEMENTARY TESTS 6.2 Evaluation of Recycled Fluids
X:\@APS ARCHIVE\CM1380 (TDC Deicing 1997-98)\REPORT\HOT_SUB\Final Version 1.0\Final Version 1.0.DOC Final Version 1.0, October 06 163
tested. The complete result summary of these tests appears in Transport Canada report TP 13131E (1). A more elaborate series of tests, involving various combinations of ethylene and propylene recycled fluids, as well as commercial ethylene and propylene Type I and Type IV fluids, were performed during the past test season in light freezing rain and freezing drizzle at the Climatic Engineering Facility in Ottawa. The plan for the conduct of compatibility tests appears in Appendix C. In general, the test procedure consisted of running standard holdover time tests with selected Type I and Type IV fluids, and then re-testing the same fluids in two-step applications, consisting of: • Type IV fluids over Type I fluids; • Type IV fluids over recycled fluids; and • Type I fluids over recycled fluids. Tests were conducted to determine the effect of the undercoat on the holdover time of the second-step fluid.
Compatibility tests were divided in two groups:
• Compatibility of recycled fluids with commercial Type I fluids; and • Compatibility of recycled fluids with commercial Type IV fluids.
6.2.2.1 Compatibility tests with Type I fluids
The results of tests conducted to determine the compatibility performance of recycled fluids and Type I fluids are shown in Figures 6.7 and 6.8. Figure 6.7 shows the results of Type I tests conducted in freezing drizzle. Each bar represents the holdover time result (in minutes) of the fluid(s) tested. The rate of precipitation and the test temperature are displayed below each bar. The holdover times of the Type I fluids, as shown in Figure 6.7, have generally increased slightly when recycled fluids have been used as an undercoat, thus suggesting good compatibility between the fluids. Figure 6.8 shows the results of Type I tests conducted in light freezing rain. The results show that recycled fluid undercoat does not affect the holdover time of the Type I fluid.
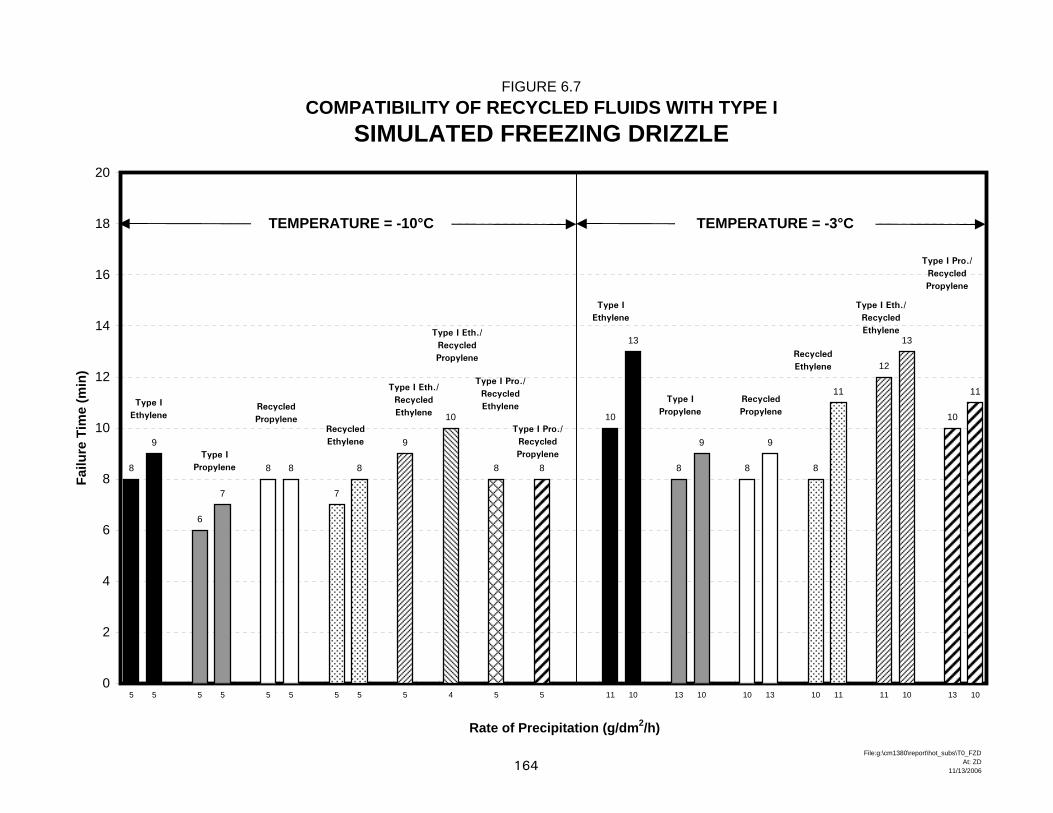
164File:g:\cm1380\report\hot_subs\T0_FZD
At: ZD11/13/2006
FIGURE 6.7COMPATIBILITY OF RECYCLED FLUIDS WITH TYPE I
SIMULATED FREEZING DRIZZLE
8
9
10
13
6
7
8
9
8 8 8
9
7
8 8
11
9
12
13
10
8 8
10
11
0
2
4
6
8
10
12
14
16
18
20
5 5 5 5 5 5 5 5 5 4 5 5 11 10 13 10 10 13 10 11 11 10 13 10
Rate of Precipitation (g/dm2/h)
Failu
re T
ime
(min
)
Type IEthylene
Type IPropylene
RecycledPropylene
RecycledEthylene
Type I Eth./RecycledEthylene
Type I Eth./RecycledPropylene
Type I Pro./RecycledPropylene
Type I Pro./RecycledEthylene
Type IEthylene
Type IPropylene
RecycledPropylene
RecycledEthylene
Type I Eth./RecycledEthylene
Type I Pro./RecycledPropylene
TEMPERATURE = -10°C TEMPERATURE = -3°C
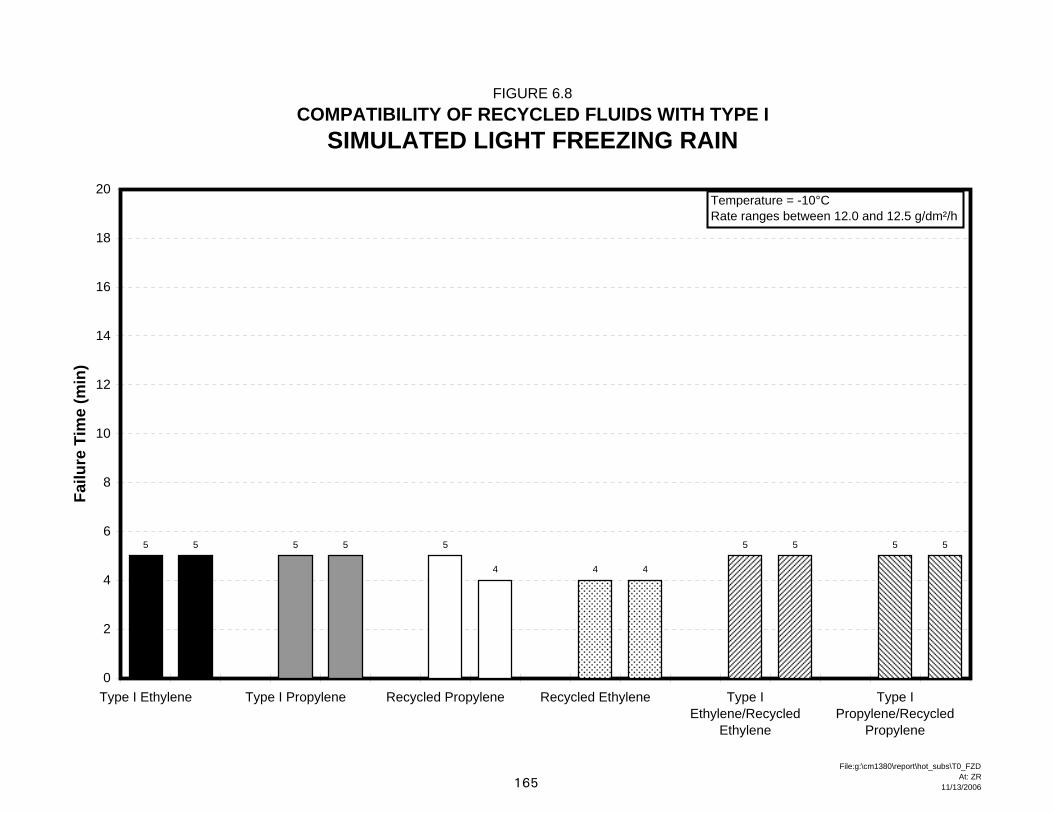
165File:g:\cm1380\report\hot_subs\T0_FZD
At: ZR11/13/2006
FIGURE 6.8COMPATIBILITY OF RECYCLED FLUIDS WITH TYPE I
SIMULATED LIGHT FREEZING RAIN
5 5 5 5 5
4 4 4
5 5 5 5
0
2
4
6
8
10
12
14
16
18
20
Type I Ethylene Type I Propylene Recycled Propylene Recycled Ethylene Type IEthylene/Recycled
Ethylene
Type IPropylene/Recycled
Propylene
Failu
re T
ime
(min
)
Temperature = -10°CRate ranges between 12.0 and 12.5 g/dm²/h
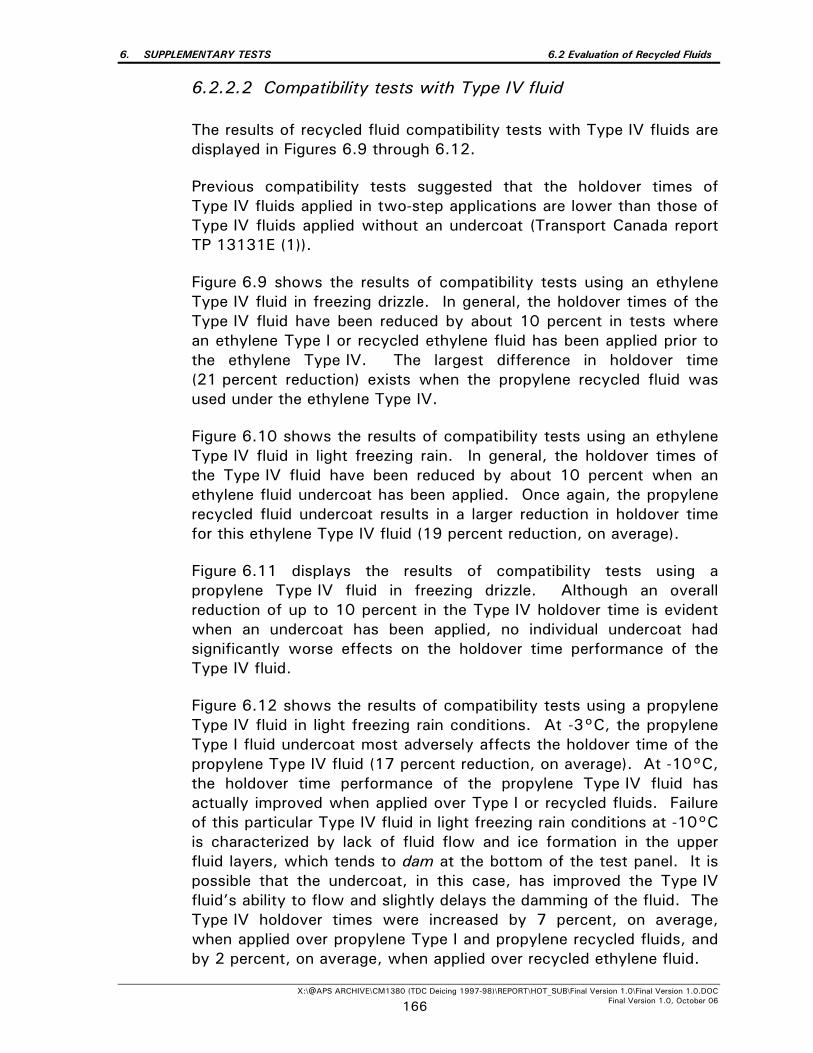
6. SUPPLEMENTARY TESTS 6.2 Evaluation of Recycled Fluids
X:\@APS ARCHIVE\CM1380 (TDC Deicing 1997-98)\REPORT\HOT_SUB\Final Version 1.0\Final Version 1.0.DOC Final Version 1.0, October 06 166
6.2.2.2 Compatibility tests with Type IV fluid
The results of recycled fluid compatibility tests with Type IV fluids are displayed in Figures 6.9 through 6.12. Previous compatibility tests suggested that the holdover times of Type IV fluids applied in two-step applications are lower than those of Type IV fluids applied without an undercoat (Transport Canada report TP 13131E (1)).
Figure 6.9 shows the results of compatibility tests using an ethylene Type IV fluid in freezing drizzle. In general, the holdover times of the Type IV fluid have been reduced by about 10 percent in tests where an ethylene Type I or recycled ethylene fluid has been applied prior to the ethylene Type IV. The largest difference in holdover time (21 percent reduction) exists when the propylene recycled fluid was used under the ethylene Type IV.
Figure 6.10 shows the results of compatibility tests using an ethylene Type IV fluid in light freezing rain. In general, the holdover times of the Type IV fluid have been reduced by about 10 percent when an ethylene fluid undercoat has been applied. Once again, the propylene recycled fluid undercoat results in a larger reduction in holdover time for this ethylene Type IV fluid (19 percent reduction, on average).
Figure 6.11 displays the results of compatibility tests using a propylene Type IV fluid in freezing drizzle. Although an overall reduction of up to 10 percent in the Type IV holdover time is evident when an undercoat has been applied, no individual undercoat had significantly worse effects on the holdover time performance of the Type IV fluid.
Figure 6.12 shows the results of compatibility tests using a propylene Type IV fluid in light freezing rain conditions. At -3°C, the propylene Type I fluid undercoat most adversely affects the holdover time of the propylene Type IV fluid (17 percent reduction, on average). At -10°C, the holdover time performance of the propylene Type IV fluid has actually improved when applied over Type I or recycled fluids. Failure of this particular Type IV fluid in light freezing rain conditions at -10°C is characterized by lack of fluid flow and ice formation in the upper fluid layers, which tends to dam at the bottom of the test panel. It is possible that the undercoat, in this case, has improved the Type IV fluid’s ability to flow and slightly delays the damming of the fluid. The Type IV holdover times were increased by 7 percent, on average, when applied over propylene Type I and propylene recycled fluids, and by 2 percent, on average, when applied over recycled ethylene fluid.
cm1380/report/hot_subs/UCAR_T0At: ZD11/13/2006 167
FIGURE 6.9
COMPATIBILITY OF RECYCLED FLUIDS WITH ETHYLENE TYPE IV
SIMULATED FREEZING DRIZZLE
59 6062
5255 56
5351 50
54
46 45
0
10
20
30
40
50
60
70
80
90
100
Failu
re T
ime
(min
)
Temperature = -3°CRate ranges between 10 and 12 g/dm²/hType IV Fluid: Ultra +
Type IV Type IV/Type I Type IV/Recycled Ethylene
Type IV/Recycled Propylene
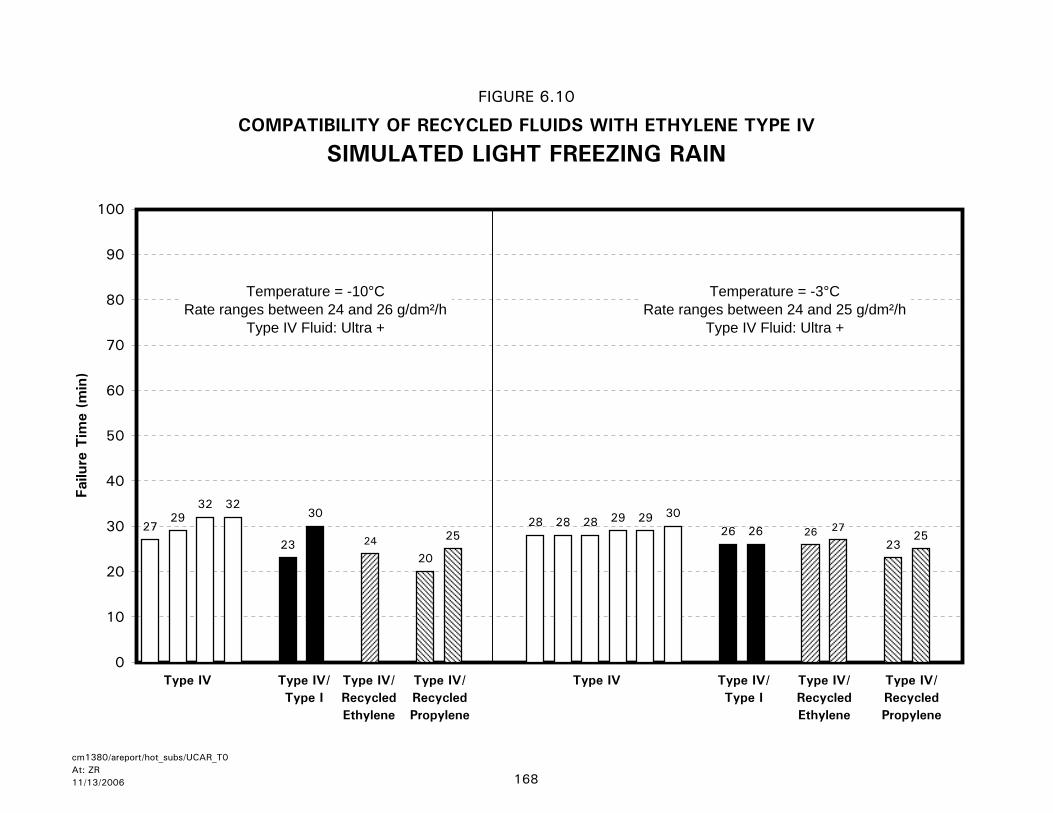
cm1380/areport/hot_subs/UCAR_T0At: ZR11/13/2006 168
FIGURE 6.10
COMPATIBILITY OF RECYCLED FLUIDS WITH ETHYLENE TYPE IV
SIMULATED LIGHT FREEZING RAIN
2729
32 3228 28 28 29 29 30
23
3026 26
2426 27
20
2523
25
0
10
20
30
40
50
60
70
80
90
100
Failu
re T
ime
(min
)
Type IV Type IV/Type I
Type IV/RecycledEthylene
Type IV/Recycled Propylene
Type IV Type IV/Type I
Type IV/RecycledEthylene
Type IV/Recycled Propylene
Temperature = -10°CRate ranges between 24 and 26 g/dm²/h
Type IV Fluid: Ultra +
Temperature = -3°CRate ranges between 24 and 25 g/dm²/h
Type IV Fluid: Ultra +
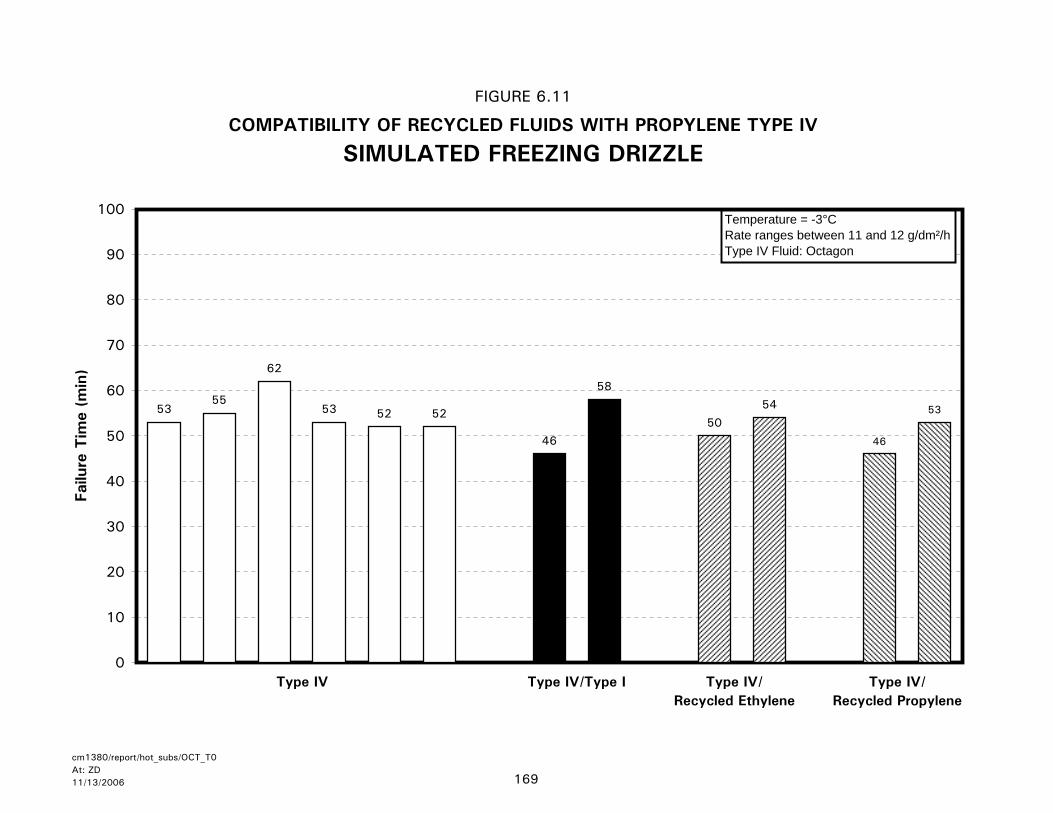
cm1380/report/hot_subs/OCT_T0At: ZD11/13/2006 169
FIGURE 6.11
COMPATIBILITY OF RECYCLED FLUIDS WITH PROPYLENE TYPE IV
SIMULATED FREEZING DRIZZLE
5355
62
53 52 52
46
58
46
5350
54
0
10
20
30
40
50
60
70
80
90
100
Failu
re T
ime
(min
)
Temperature = -3°CRate ranges between 11 and 12 g/dm²/hType IV Fluid: Octagon
Type IV/Recycled Propylene
Type IV/Recycled Ethylene
Type IV/Type IType IV
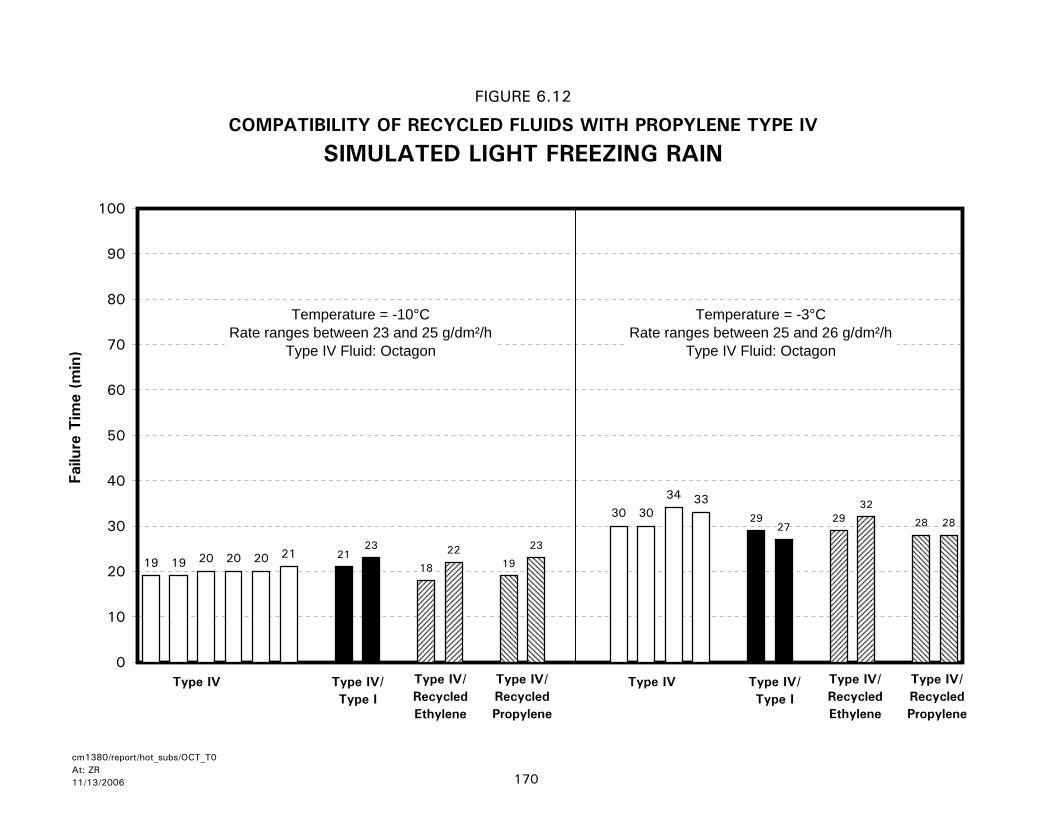
cm1380/report/hot_subs/OCT_T0At: ZR11/13/2006 170
FIGURE 6.12
COMPATIBILITY OF RECYCLED FLUIDS WITH PROPYLENE TYPE IV
SIMULATED LIGHT FREEZING RAIN
19 19 20 20 20 21
30 3034 33
2123
2927
19
23
28 28
18
22
2932
0
10
20
30
40
50
60
70
80
90
100
Failu
re T
ime
(min
)
Type IV Type IV/Type I
Type IV/RecycledEthylene
Type IV/RecycledPropylene
Type IV/RecycledPropylene
Type IV/RecycledEthylene
Type IV/Type I
Type IV
Temperature = -10°CRate ranges between 23 and 25 g/dm²/h
Type IV Fluid: Octagon
Temperature = -3°CRate ranges between 25 and 26 g/dm²/h
Type IV Fluid: Octagon
6. SUPPLEMENTARY TESTS 6.2 Evaluation of Recycled Fluids
X:\@APS ARCHIVE\CM1380 (TDC Deicing 1997-98)\REPORT\HOT_SUB\Final Version 1.0\Final Version 1.0.DOC Final Version 1.0, October 06 171
6.2.3 Thickness Tests
Fluid thickness tests, aimed at comparing the stabilized film thickness profiles of the recycled propylene and ethylene fluids and commercial Type I fluids, were conducted at NRC’s CEF in 1997-98. Procedures for the conduct of fluid thickness tests are outlined in Appendix C. Four plates were coated with Inland fluids, two with recycled ethylene and two with recycled propylene. Tests were performed at a temperature of -3°C in the absence of freezing precipitation. The fluids were applied to standard test plates at room temperature (20°C), and the stabilized thicknesses of the fluids were recorded after 30 minutes on the 15 cm line of the plates.
The test results indicate that all four plates had identical film thickness values of 0.04 mm after 30 minutes. The results of the thickness tests conducted with Type I fluid in 1995-96 (Transport Canada report TP 12900E (8)), showed stabilized thickness values of 0.03 mm.
6.2.4 Negative Buffer Deicing Fluid Tests / Deicing Only Fluid Tests
A series of experiments were undertaken by APS in 1997-98 at the NRC’s CEF in Ottawa. The objectives of these tests were to: • Determine the limits of the use of hot water and reduced glycol
content deicing fluids under conditions of precipitation; and • Develop a deicing only table for the removal of ice, slush, snow, or
frost in the absence of precipitation.
Tests were conducted using water; recycled propylene and ethylene fluids; propylene and ethylene Type I fluids; and Type II and Type IV anti-icing fluids.
The results showed that Inland recycled fluids performed equal to commercial Type I fluids in all tests.
The complete results of these tests are published in Transport Canada report TP 13315E (12).
6. SUPPLEMENTARY TESTS 6.3 Evaluation of Snow Making Capability at NRC CEF
X:\@APS ARCHIVE\CM1380 (TDC Deicing 1997-98)\REPORT\HOT_SUB\Final Version 1.0\Final Version 1.0.DOC Final Version 1.0, October 06 172
6.3 Evaluation of Snow-Making Capability at National Research Council Canada Climatic Engineering Facility
6.3.1 Background
Tests to evaluate fluid holdover times in snow conditions have in the past been limited to outdoor tests during periods of natural snowfall. Although best advantage was taken of snowstorms as they occurred, the chance nature of the combination of snowfall rate, air temperature, and winds has limited the opportunity to test at all desired experimental conditions. The ability to produce artificial snow in a cold chamber laboratory setting with controlled precipitation rates and assured consistency would enable more efficient and effective evaluation of fluids in snow conditions than is possible in natural freezing precipitation conditions.
6.3.2 Objective
The objective of this study was to evaluate the capability of NRC’s CEF to produce artificial snow suitable for fluid holdover testing. The principal attributes to be examined were: ability to produce snow at a range of temperatures, ability to provide a consistent rate of snowfall over time and over a defined area, and ability to produce at a controlled (predefined) rate. The nature of the snow was also examined photographically and with a magnifying glass. Snow was generated for these tests using the spray nozzles designed to generate freezing fog conditions, with adjustments to system air and water pressures. Two spray bars, each equipped with eight nozzles, were used.
6.3.3 Procedure
The procedural steps followed were:
• Position a number of flat horizontal plates of known surface area on individual pedestals at fixed locations around a flat plate test stand. The pedestals were positioned around the perimeter of the test stand to provide a measure of the variation of snowfall at the extreme limits of an area of the same proportions but somewhat larger than the test stand;
• Produce snow, at various air temperature values for different tests;
6. SUPPLEMENTARY TESTS 6.3 Evaluation of Snow Making Capability at NRC CEF
X:\@APS ARCHIVE\CM1380 (TDC Deicing 1997-98)\REPORT\HOT_SUB\Final Version 1.0\Final Version 1.0.DOC Final Version 1.0, October 06 173
• Catch snow on the plate over a 20- to 30-minute period, cut off snow accumulated past the plate edges, weigh plates with snow to determine rate, measure depth of snow to determine an average volume, use the mass and volume to compute the density; and
• Examine the nature of the snow particles.
With care, four downward cuts with a long spatula blade left the accumulated snow on the top of the plates intact. A square volume of snow with sides perpendicular to the surface and coincident with the plate edges remained. Photo 6.1 shows the test set-up with flat horizontal plates on pedestals near and around the flat plate stand; Photo 6.2 shows the spray bars in operation; Photo 6.3 shows snow accumulated on the flat plate stand with lumps of snow that fell from overhead accumulations; and Photo 6.4 shows snow accumulation on the overhead structure.
6.3.4 Results
Data from the tests are provided in Appendix J. Comments based on data collected and observations follow:
a) Ability to produce snow at a range of temperatures;
The NRC’s CEF staff indicated that snow production is difficult at warmer temperatures just under freezing. As a result, tests were conducted at colder temperatures. One test was performed at each of the three following air temperatures or ranges of temperatures, -10ºC, -10º to -15ºC, -15º to -20ºC, and four tests at -20ºC. Snow production at -3ºC would be necessary to satisfy experimental conditions for fluid tests.
b) Ability to provide a consistent rate of snowfall over time and over a
defined area;
During the four tests at constant air temperature, precipitation rates for individual plate positions showed a wide range of values. One position ranged from 16 to 24 g/dm2/h; another ranged from 13 to 21 g/dm2/h. Precipitation rates measured from one plate position to the next also showed a wide range of values, from 9 to 16 g/dm2/h in one trial and 14 to 20 g/dm2/h in another. These ranges are too great for experimentation; a target maximum variation in precipitation rate of 10 percent from plate to plate and from run to run is reasonable.
6. SUPPLEMENTARY TESTS 6.3 Evaluation of Snow Making Capability at NRC CEF
X:\@APS ARCHIVE\CM1380 (TDC Deicing 1997-98)\REPORT\HOT_SUB\Final Version 1.0\Final Version 1.0.DOC Final Version 1.0, October 06 174
c) Ability to produce at a controlled (predefined) rate; and
No attempt was made to adjust the snow-making system controls to produce a predefined snowfall rate. Based on observations of the variation in rate over time and between positions, it would be difficult to control snow precipitation rates to within experimental requirements. d) Nature of the snow particles.
The snow particles consisted of very small, fairly regular spherical agglomerations of microcrystalline ice particles, which are quite different from snowflakes observed in nature. Nevertheless, the measured density of accumulated snow was in a satisfactory range, providing density values in the neighbourhood of 0.05 to 0.1 g/cm3. The consistency of the snow, however, more closely resembled heavy freezing fog, and failures also resembled those observed during freezing fog tests.
Snow particles accumulated on the overhead structure and cables in the facility, to develop large, loose formations that tended to break away and fall onto the test set-up below.
6. SUPPLEMENTARY TESTS 6.4 Evaluation of Aeroflot Fluid
X:\@APS ARCHIVE\CM1380 (TDC Deicing 1997-98)\REPORT\HOT_SUB\Final Version 1.0\Final Version 1.0.DOC Final Version 1.0, October 06 175
6.4 Evaluation of Aeroflot Fluid
Prior to the 1997-98 test season, APS was provided with a 200 L barrel of aircraft deicing fluid from Aeroflot. No documentation or fluid specifications were provided with the barrel of fluid. Aeroflot personnel suggested that the fluid be used for anti-icing purposes and that it was similar to Type II or Type IV. APS made several requests for fluid documentation prior to testing, but with no results.
Aeroflot fluid tests were conducted in natural snow conditions at the APS Dorval Airport test facility. The tests were performed according to the procedures outlined in Appendix B.
During transfer of this fluid from the barrel to smaller, more manageable containers, the fluid was observed to be unthickened. The fluid viscosity appeared similar to that of a Type I fluid. Eighteen holdover time tests were conducted in natural snow with the Aeroflot fluid. The failure time versus rate of precipitation data are plotted in Figure 6.13. Failure times were similar to commercial Type I tests conducted on the same day, and were all above the six-minute lower holdover time value for Type I.
Testing of the fluid was limited to natural snow conditions, since it was determined that it was undoubtedly a deicing fluid.
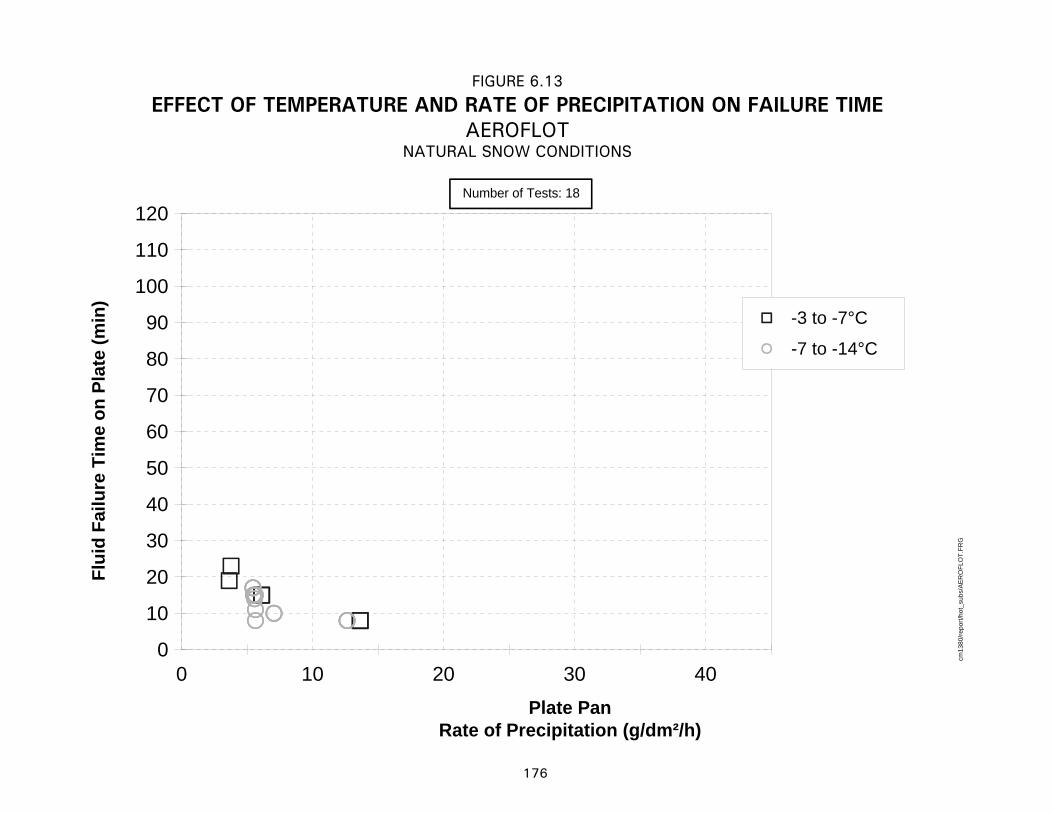
0 10 20 30 400
10
20
30
40
50
60
70
80
90
100
110
120
-3 to -7°C
-7 to -14°C
cm13
80/re
port/
hot_
subs
/AE
RO
FLO
T.FR
G
FIGURE 6.13
EFFECT OF TEMPERATURE AND RATE OF PRECIPITATION ON FAILURE TIMEAEROFLOT
NATURAL SNOW CONDITIONS
Number of Tests: 18
Flui
d Fa
ilure
Tim
e on
Pla
te (m
in)
Plate PanRate of Precipitation (g/dm²/h)
176
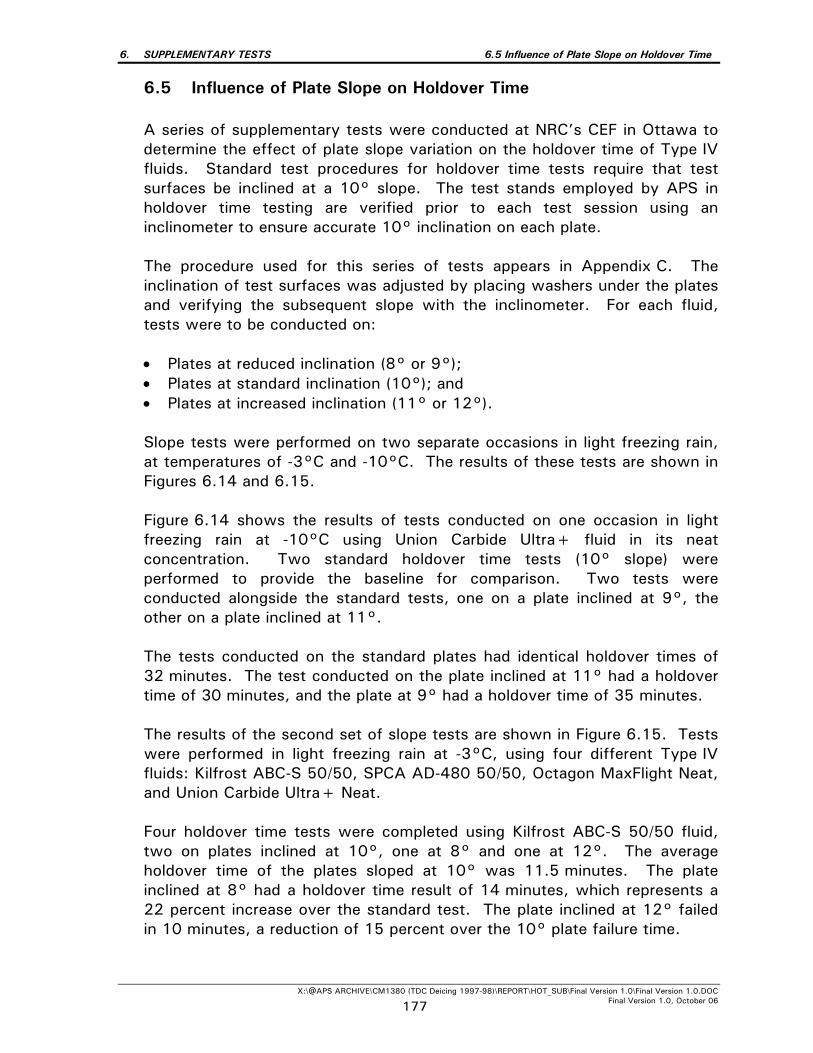
6. SUPPLEMENTARY TESTS 6.5 Influence of Plate Slope on Holdover Time
X:\@APS ARCHIVE\CM1380 (TDC Deicing 1997-98)\REPORT\HOT_SUB\Final Version 1.0\Final Version 1.0.DOC Final Version 1.0, October 06 177
6.5 Influence of Plate Slope on Holdover Time
A series of supplementary tests were conducted at NRC’s CEF in Ottawa to determine the effect of plate slope variation on the holdover time of Type IV fluids. Standard test procedures for holdover time tests require that test surfaces be inclined at a 10° slope. The test stands employed by APS in holdover time testing are verified prior to each test session using an inclinometer to ensure accurate 10° inclination on each plate. The procedure used for this series of tests appears in Appendix C. The inclination of test surfaces was adjusted by placing washers under the plates and verifying the subsequent slope with the inclinometer. For each fluid, tests were to be conducted on: • Plates at reduced inclination (8° or 9°); • Plates at standard inclination (10°); and • Plates at increased inclination (11° or 12°).
Slope tests were performed on two separate occasions in light freezing rain, at temperatures of -3°C and -10°C. The results of these tests are shown in Figures 6.14 and 6.15.
Figure 6.14 shows the results of tests conducted on one occasion in light freezing rain at -10°C using Union Carbide Ultra+ fluid in its neat concentration. Two standard holdover time tests (10° slope) were performed to provide the baseline for comparison. Two tests were conducted alongside the standard tests, one on a plate inclined at 9°, the other on a plate inclined at 11°.
The tests conducted on the standard plates had identical holdover times of 32 minutes. The test conducted on the plate inclined at 11° had a holdover time of 30 minutes, and the plate at 9° had a holdover time of 35 minutes.
The results of the second set of slope tests are shown in Figure 6.15. Tests were performed in light freezing rain at -3°C, using four different Type IV fluids: Kilfrost ABC-S 50/50, SPCA AD-480 50/50, Octagon MaxFlight Neat, and Union Carbide Ultra+ Neat.
Four holdover time tests were completed using Kilfrost ABC-S 50/50 fluid, two on plates inclined at 10°, one at 8° and one at 12°. The average holdover time of the plates sloped at 10° was 11.5 minutes. The plate inclined at 8° had a holdover time result of 14 minutes, which represents a 22 percent increase over the standard test. The plate inclined at 12° failed in 10 minutes, a reduction of 15 percent over the 10° plate failure time.
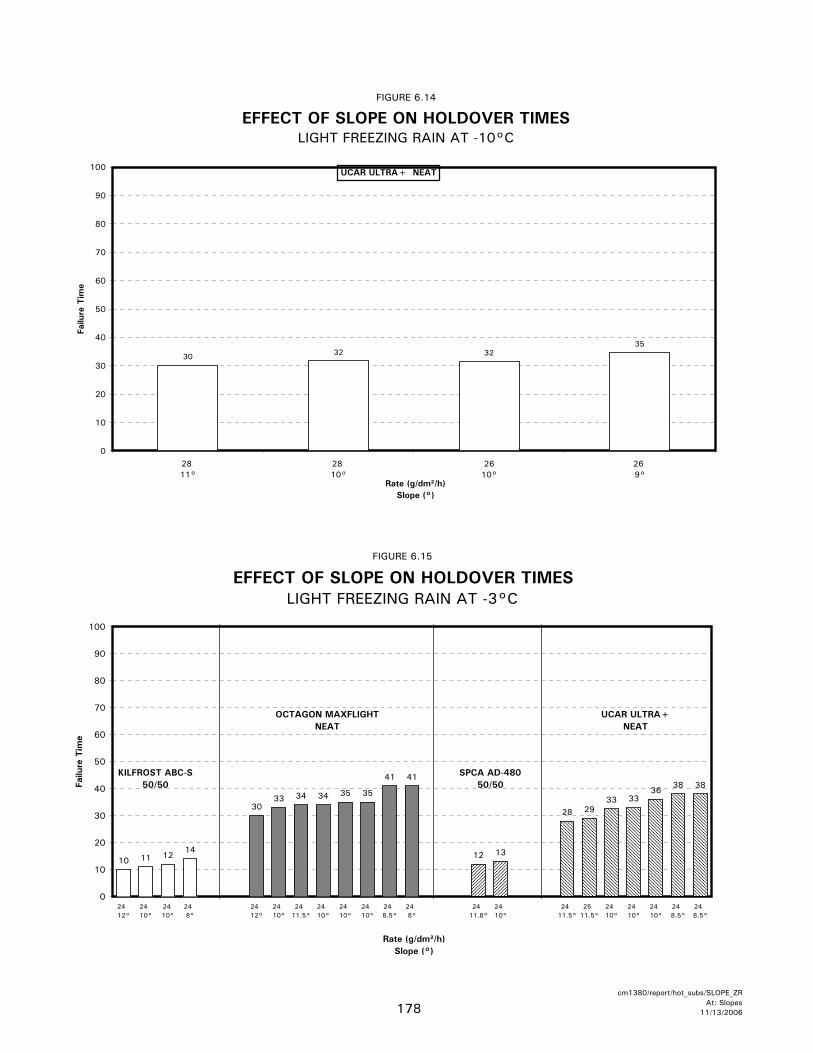
FIGURE 6.14
EFFECT OF SLOPE ON HOLDOVER TIMESLIGHT FREEZING RAIN AT -10°C
30 32 3235
0
10
20
30
40
50
60
70
80
90
100
28 11°
28 10°
2610°
26 9°
Rate (g/dm²/h)Slope (°)
Failu
re T
ime
UCAR ULTRA+ NEAT
FIGURE 6.15
EFFECT OF SLOPE ON HOLDOVER TIMESLIGHT FREEZING RAIN AT -3°C
10 11 1214
3033 34 34 35 35
41 41
12 13
28 2933 33
3638 38
0
10
20
30
40
50
60
70
80
90
100
24 12°
24 10°
24 10°
24 8°
24 12°
24 10°
24 11.5°
24 10°
24 10°
24 10°
24 8.5°
24 8°
24 11.8°
24 10°
24 11.5°
25 11.5°
24 10°
24 10°
24 10°
24 8.5°
24 8.5°
Rate (g/dm²/h)Slope (°)
Failu
re T
ime
KILFROST ABC-S50/50
OCTAGON MAXFLIGHTNEAT
UCAR ULTRA+NEAT
SPCA AD-48050/50
178cm1380/report/hot_subs/SLOPE_ZR
At: Slopes11/13/2006
6. SUPPLEMENTARY TESTS 6.5 Influence of Plate Slope on Holdover Time
X:\@APS ARCHIVE\CM1380 (TDC Deicing 1997-98)\REPORT\HOT_SUB\Final Version 1.0\Final Version 1.0.DOC Final Version 1.0, October 06 179
Only two tests were completed with SPCA AD-480 50/50 fluid, one inclined at 10°, the other at nearly 12°. The 12° inclined plate failed one minute prior to the standard plate, which, in this case, translates into an 8 percent decrease in holdover time. Eight tests were conducted with Octagon fluid in its neat concentration, including four with 10° slopes, and one at each of following inclinations: 8°, 8.5°, 11.5°, and 12°. The standard tests (10° plates) had an average failure time of approximately 34 minutes. Tests on plates with reduced inclination had identical failure times of 41 minutes, an increase of 20 percent of the standard inclination plates. Plates with raised slopes failed on average two minutes sooner than the standard plates, which represents a 6 percent reduction in holdover time. The final series of six tests were performed with neat Union Carbide Ultra+ fluid, including three on plates inclined at 10°, two on plates inclined at 8.5°, and one on a plate inclined at 11.5°. The average failure time for the plates at standard inclination was 34 minutes. The tests conducted on plates inclined at 8.5° had identical failure times of 38 minutes, which is equivalent to a 12 percent increase in holdover time. The plate inclined at 11.5° failed in 28 minutes, equivalent to a 21 percent reduction in holdover time.
6.5.1 Effect of Surface Finish on Holdover Time
A preliminary test was also performed to examine the influence of plate finish on Type IV fluid holdover time. A Type IV fluid was poured on two flat plates, one weathered (typical plate used in APS tests) with an average surface roughness of 0.4 microns, the other polished (new plate) to an average surface roughness of 0.2 microns. Both plates were then exposed to light freezing rain at an ambient air temperature of -8°C. The weathered plate failed in 32 minutes, while the polished plate failed in 30 minutes, representing a 7 percent difference in holdover time.
6. SUPPLEMENTARY TESTS 6.6 Influence of Application Procedure on Holdover Time
X:\@APS ARCHIVE\CM1380 (TDC Deicing 1997-98)\REPORT\HOT_SUB\Final Version 1.0\Final Version 1.0.DOC Final Version 1.0, October 06 180
6.6 Influence of Application Procedure on Holdover Time
A series of tests was conducted at the NRC’s CEF aimed at determining the effect of the fluid application method on the holdover time of Type IV fluids. The standard procedure for Type IV fluid application is to pour fluid onto the flat plates at ambient temperature from a manageable container until the entire test surface is covered by a uniform film of fluid. This procedure is described in Attachment B-II (Appendix B).
Anti-icing fluids are generally applied onto aircraft surfaces using vehicles equipped with fluid reservoirs, pumps, and a fluid delivery system with a specially designed nozzle. The Type IV fluid is subjected to shear when pumped through the nozzle and the fluid viscosity may be temporarily or permanently reduced, depending on which fluid is sprayed. Lower fluid viscosities tend to affect the holdover time. To possess fluid spraying capabilities, a mobile Type IV fluid sprayer (see Photos 6.5 and 6.6) with a Task Force Tips nozzle, was assembled during the past test season and used in the fluid application for these tests (see Transport Canada report TP 13314E (6)).
Fluid application tests were initiated in April 1998, but were rescheduled for July 1998, due to time constraints. The procedures for both series of tests are included in Appendix C. Tests were performed in light freezing rain at a temperature of -3°C.
The test plan consisted of spraying a Type IV fluid on two plates, and pouring the same fluid on two more plates. The plate holdover times were then compared. The results of fluid application tests appear in Figure 6.16.
The holdover time comparison for Union Carbide Ultra+ Neat fluid reveals that the sprayed fluid lasted slightly longer on the plate than did the poured fluid. A large difference in holdover time was observed with Union Carbide PG AAF, where the plates coated with poured fluid lasted on average 25 percent longer than the plates coated with sprayed fluid. The PG AAF was noted to be an extremely viscous fluid, and the performance was undoubtedly affected by the shearing of the fluid. Union Carbide PG AAF is not a certified fluid.
181cm1380/report/hot_subs/SPRAYER
11/13/2006
FIGURE 6.16
APS SPRAYER TESTSLIGHT FREEZING RAIN AT -3°C
33 32
92 90
29 29
115 113
0
20
40
60
80
100
120
140
ULTRA+25
ULTRA+25
ULTRA+25
ULTRA+25
UCAR PG24
UCAR PG28
UCAR PG25
UCAR PG24
FluidPrecip. Rate (g/dm²/h)
Flui
d Fa
ilure
Tim
e (m
in)
SprayedPoured
6. SUPPLEMENTARY TESTS 6.7 Influence of Type IV Fluid Temperature on Holdover Time
X:\@APS ARCHIVE\CM1380 (TDC Deicing 1997-98)\REPORT\HOT_SUB\Final Version 1.0\Final Version 1.0.DOC Final Version 1.0, October 06 182
6.7 Influence of Type IV Fluid Temperature on Holdover Time
Supplementary tests were conducted at NRC’s CEF to determine the effect of fluid temperature on the holdover time of Type IV fluids. The standard procedure for Type IV fluid application on flat plates for holdover time testing is shown in Attachment B-II of (Appendix B). Using this method, Type IV fluids are poured on the flat plates at ambient temperature. Heated Type I deicing fluids are normally used to remove ice or snow contamination from aircraft surfaces prior to the application of a Type IV anti-icing fluid in two-step operations. Because of the design of fluid tankage on certain older deicing vehicles, Type I and Type IV fluid reservoirs are sometimes side by side sharing a common metal wall, which results in a heat transfer to from the heated Type I tank to the Type IV tank. The Type IV fluid would then be applied to the aircraft surfaces at greater than ambient temperatures. This situation is believed to be common in the industry. This scenario was also studied in a preliminary series of thickness tests conducted last year (see Transport Canada report TP 13131E (1)). The heated Type IV fluid film thickness measurements showed reductions up to 80 percent relative to those for unheated fluids. These observations stimulated the conduct of holdover time tests using heated Type IV fluids.
The procedure used in heated fluid tests is shown in Appendix C. As a baseline for comparison, one standard holdover time test was performed with each Type IV fluid at ambient temperature. As well, one holdover time test was conducted with each Type IV fluid (heated to 40°C) poured on top of the standard Type I fluid (heated to 80°C) from the same manufacturer. In the case of Clariant Type IV tests, Octagon Type I fluid was used as the first-step fluid since no Clariant Type I was available. Results of the heated versus ambient Type IV tests are compared in Figure 6.17. Generally, the holdover times of the heated Type IV fluids are inferior to those of the ambient Type IV fluids. Kilfrost ABC-S, Octagon MaxFlight, and SPCA AD-480 showed the greatest reductions in holdover time (up to one half the standard holdover time). However, the heated Clariant MPIV 2001 plate actually saw an increase in holdover time compared to the ambient plate.
183cm1380/report/hot_subs/EFF_TEMP
11/13/2006
FIGURE 6.17
EFFECT OF FLUID TEMPERATURE ON HOLDOVER TIMESLIGHT FREEZING RAIN AT -3°C
42
36
75
40
44
32
53
34
39
50
19
3431
37
0
10
20
30
40
50
60
70
80
90
100
CL 195725
CL 200126
KILF24
OCT24
SPCA 40424
ULTRA+24
SPCA 48024
FluidRate (g/dm²/h)
Failu
re T
ime
(min
)
Type IV (at ambient)
Hot Type IV over Hot Type I
Clariant 2001 over Octagon
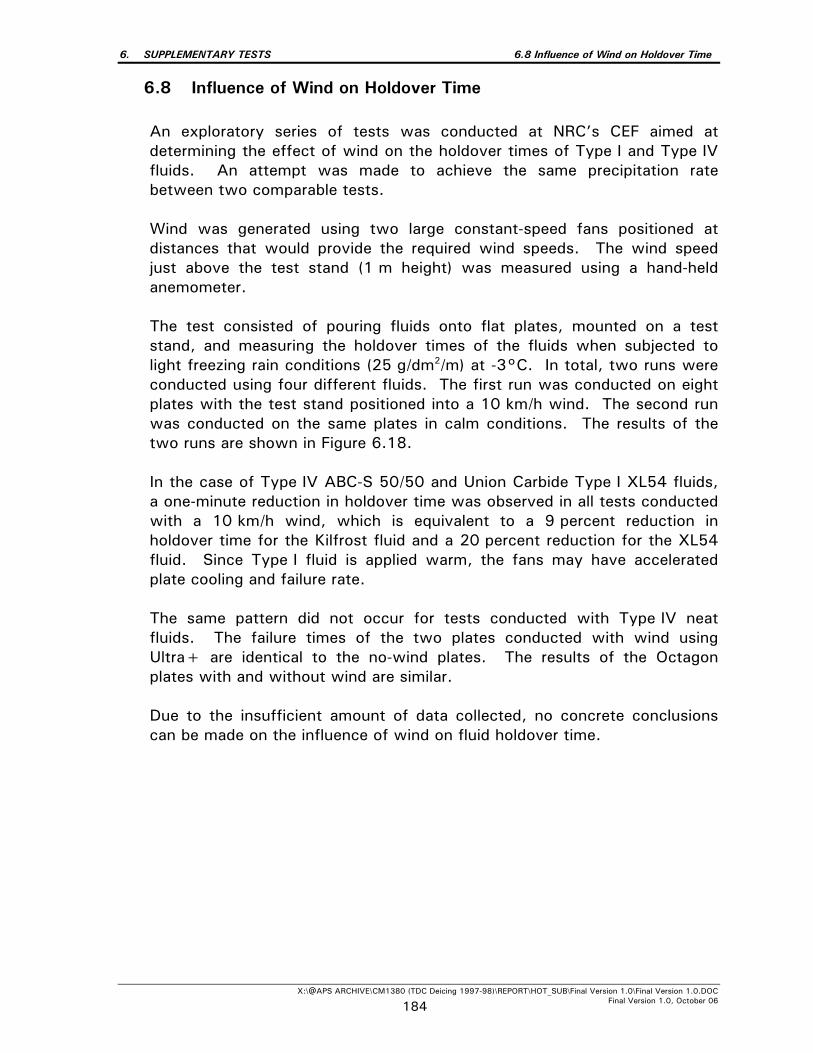
6. SUPPLEMENTARY TESTS 6.8 Influence of Wind on Holdover Time
X:\@APS ARCHIVE\CM1380 (TDC Deicing 1997-98)\REPORT\HOT_SUB\Final Version 1.0\Final Version 1.0.DOC Final Version 1.0, October 06 184
6.8 Influence of Wind on Holdover Time
An exploratory series of tests was conducted at NRC’s CEF aimed at determining the effect of wind on the holdover times of Type I and Type IV fluids. An attempt was made to achieve the same precipitation rate between two comparable tests.
Wind was generated using two large constant-speed fans positioned at distances that would provide the required wind speeds. The wind speed just above the test stand (1 m height) was measured using a hand-held anemometer.
The test consisted of pouring fluids onto flat plates, mounted on a test stand, and measuring the holdover times of the fluids when subjected to light freezing rain conditions (25 g/dm2/m) at -3°C. In total, two runs were conducted using four different fluids. The first run was conducted on eight plates with the test stand positioned into a 10 km/h wind. The second run was conducted on the same plates in calm conditions. The results of the two runs are shown in Figure 6.18.
In the case of Type IV ABC-S 50/50 and Union Carbide Type I XL54 fluids, a one-minute reduction in holdover time was observed in all tests conducted with a 10 km/h wind, which is equivalent to a 9 percent reduction in holdover time for the Kilfrost fluid and a 20 percent reduction for the XL54 fluid. Since Type I fluid is applied warm, the fans may have accelerated plate cooling and failure rate.
The same pattern did not occur for tests conducted with Type IV neat fluids. The failure times of the two plates conducted with wind using Ultra+ are identical to the no-wind plates. The results of the Octagon plates with and without wind are similar. Due to the insufficient amount of data collected, no concrete conclusions can be made on the influence of wind on fluid holdover time.
185cm1380/report/hot_subs/HOT_WND
11/13/2006, 4:46 PM
FIGURE 6.18
EFFECT OF WIND ON HOLDOVER TIMESLIGHT FREEZING RAIN AT -3°C
1311
5 5
3537
32 31
1210
4 4
3735
32 31
0
10
20
30
40
50
60
70
80
90
100
24 24 26 26 24 24 26 26 23 22 25 25 24 22 25 25
Rate of Precipitation (g/dm²/h)
Failu
re T
ime
(min
)
No Wind
10 km/h
NB: Each bar represents one test
KILFROST ABC-S50/50
UCAR XL54STD.
UCAR ULTRA+NEAT
OCTAGON MAXFLIGHTNEAT
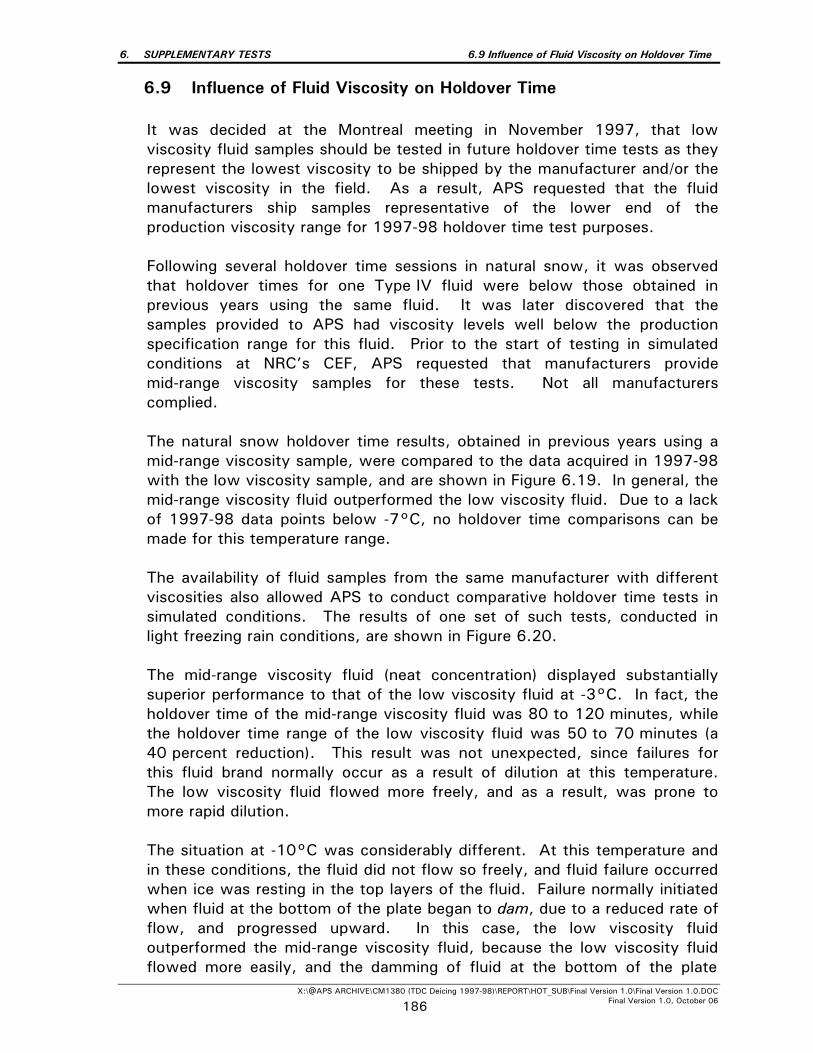
6. SUPPLEMENTARY TESTS 6.9 Influence of Fluid Viscosity on Holdover Time
X:\@APS ARCHIVE\CM1380 (TDC Deicing 1997-98)\REPORT\HOT_SUB\Final Version 1.0\Final Version 1.0.DOC Final Version 1.0, October 06 186
6.9 Influence of Fluid Viscosity on Holdover Time
It was decided at the Montreal meeting in November 1997, that low viscosity fluid samples should be tested in future holdover time tests as they represent the lowest viscosity to be shipped by the manufacturer and/or the lowest viscosity in the field. As a result, APS requested that the fluid manufacturers ship samples representative of the lower end of the production viscosity range for 1997-98 holdover time test purposes. Following several holdover time sessions in natural snow, it was observed that holdover times for one Type IV fluid were below those obtained in previous years using the same fluid. It was later discovered that the samples provided to APS had viscosity levels well below the production specification range for this fluid. Prior to the start of testing in simulated conditions at NRC’s CEF, APS requested that manufacturers provide mid-range viscosity samples for these tests. Not all manufacturers complied. The natural snow holdover time results, obtained in previous years using a mid-range viscosity sample, were compared to the data acquired in 1997-98 with the low viscosity sample, and are shown in Figure 6.19. In general, the mid-range viscosity fluid outperformed the low viscosity fluid. Due to a lack of 1997-98 data points below -7°C, no holdover time comparisons can be made for this temperature range.
The availability of fluid samples from the same manufacturer with different viscosities also allowed APS to conduct comparative holdover time tests in simulated conditions. The results of one set of such tests, conducted in light freezing rain conditions, are shown in Figure 6.20.
The mid-range viscosity fluid (neat concentration) displayed substantially superior performance to that of the low viscosity fluid at -3°C. In fact, the holdover time of the mid-range viscosity fluid was 80 to 120 minutes, while the holdover time range of the low viscosity fluid was 50 to 70 minutes (a 40 percent reduction). This result was not unexpected, since failures for this fluid brand normally occur as a result of dilution at this temperature. The low viscosity fluid flowed more freely, and as a result, was prone to more rapid dilution.
The situation at -10°C was considerably different. At this temperature and in these conditions, the fluid did not flow so freely, and fluid failure occurred when ice was resting in the top layers of the fluid. Failure normally initiated when fluid at the bottom of the plate began to dam, due to a reduced rate of flow, and progressed upward. In this case, the low viscosity fluid outperformed the mid-range viscosity fluid, because the low viscosity fluid flowed more easily, and the damming of fluid at the bottom of the plate
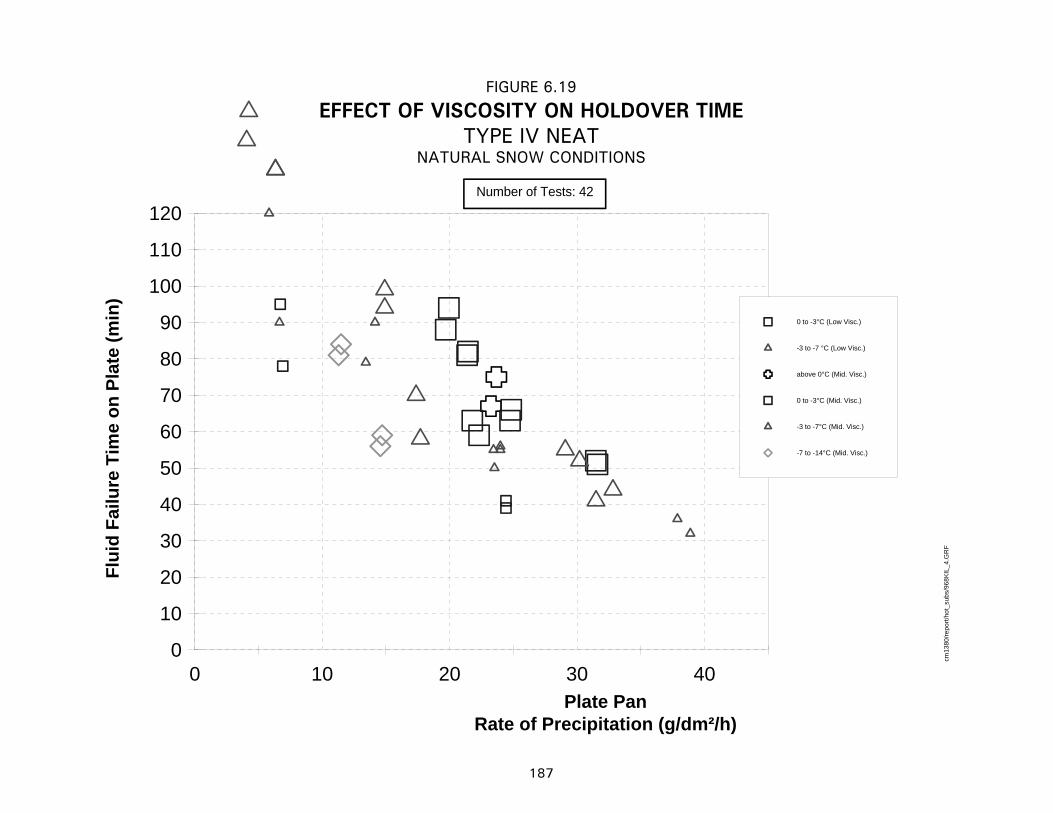
0 10 20 30 400
10
20
30
40
50
60
70
80
90
100
110
120
0 to -3°C (Low Visc.)
-3 to -7 °C (Low Visc.)
above 0°C (Mid. Visc.)
0 to -3°C (Mid. Visc.)
-3 to -7°C (Mid. Visc.)
-7 to -14°C (Mid. Visc.)
cm13
80/re
port/
hot_
subs
/968
KIL
_4.G
RF
FIGURE 6.19
EFFECT OF VISCOSITY ON HOLDOVER TIMETYPE IV NEAT
NATURAL SNOW CONDITIONS
187
Flui
d Fa
ilure
Tim
e on
Pla
te (m
in)
Plate PanRate of Precipitation (g/dm²/h)
Number of Tests: 42
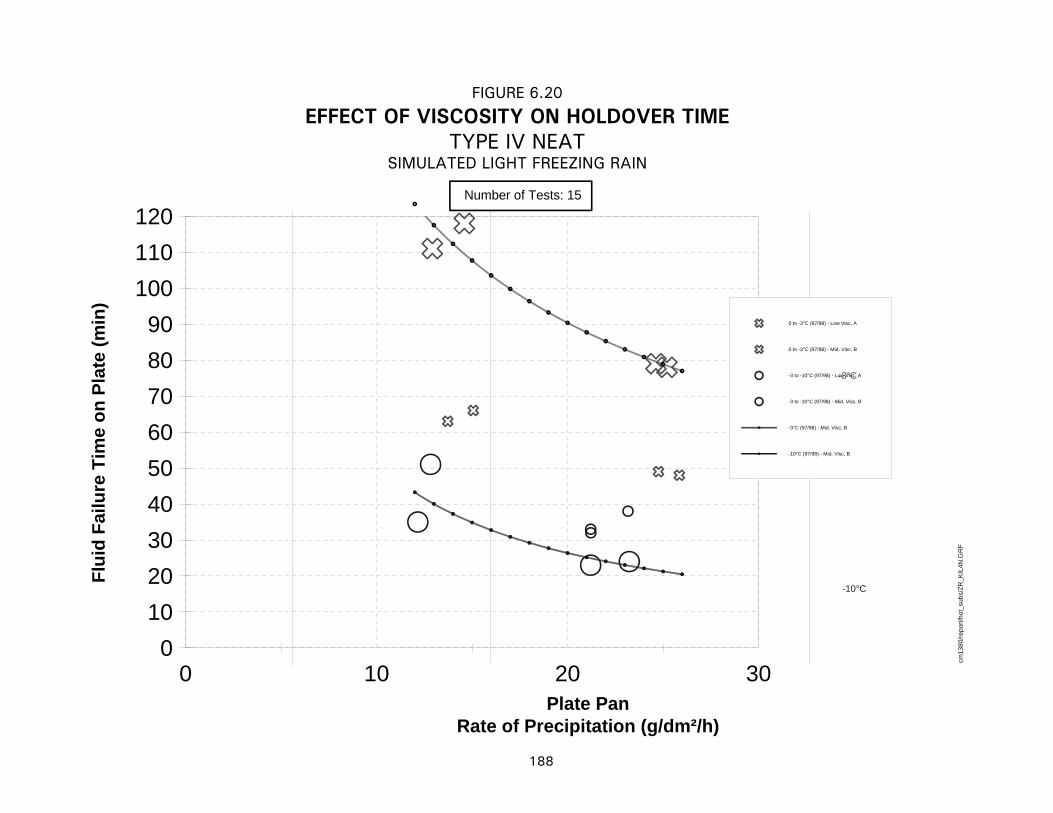
0 10 20 300
102030405060708090
100110120
0 to -3°C (97/98) - Low Visc, A
0 to -3°C (97/98) - Mid. Visc, B
-3 to -10°C (97/98) - Low Visc, A
-3 to -10°C (97/98) - Mid. Visc, B
-3°C (97/98) - Mid. Visc, B
-10°C (97/98) - Mid. Visc, B
-3°C
-10°C
cm13
80/re
port/
hot_
subs
/ZR
_KIL
4N.G
RF
FIGURE 6.20
EFFECT OF VISCOSITY ON HOLDOVER TIMETYPE IV NEAT
SIMULATED LIGHT FREEZING RAIN
188
Flui
d Fa
ilure
Tim
e on
Pla
te (m
in)
Plate PanRate of Precipitation (g/dm²/h)
Number of Tests: 15
6. SUPPLEMENTARY TESTS 6.9 Influence of Fluid Viscosity on Holdover Time
X:\@APS ARCHIVE\CM1380 (TDC Deicing 1997-98)\REPORT\HOT_SUB\Final Version 1.0\Final Version 1.0.DOC Final Version 1.0, October 06 189
was delayed. The low viscosity fluid data collected near the upper precipitation rate limit at -10°C had holdover times approximately 40 percent longer than those of the mid-range viscosity fluid. These tests demonstrate that fluid viscosity has a significant influence on fluid holdover times. Differences in formulations among the various Type IV fluids are responsible for how the fluid rheologies vary in response to lower temperature and dilution factors, and are largely responsible for the different failure mechanisms observed. Any given fluid may exhibit inferior or superior performance relative to other fluids, depending on the prevailing conditions and the fluid’s rheological profile during tests. 6.10 Escaped Precipitation: What and Why? During tests conducted to document the appearance of fluid failures in freezing drizzle and light freezing rain, it was observed that a significant fraction of the precipitation impinging on a test plate actually bounced off or rolled off the fluid-treated surface right after impact. The fraction of precipitation that makes contact, but leaves the surface by either avenue (rolling or bouncing), is referred to as “escaped precipitation”.

190
This page intentionally left blank
6. SUPPLEMENTARY TESTS
X:\@APS ARCHIVE\CM1380 (TDC DEICING 1997-98)\REPORT\HOT_SUB\REPORT COMPONENTS\PHOTOS\PHOTOS CHAPTER 6.DOC April 06 3 191
Photo 6.1 Test Setup showing Reduced Visibility during Snow Making
Photo 6.2
Snow Spray Bar in Operation
6. SUPPLEMENTARY TESTS
X:\@APS ARCHIVE\CM1380 (TDC Deicing 1997-98)\REPORT\HOT_SUB\REPORT COMPONENTS\PHOTOS\Photos Chapter 6.DOC April 06
192
Photo 6.3 Test Setup with Flat Horizontal Plates on Pedestals
Photo 6.4 Accumulated Snow Following Test
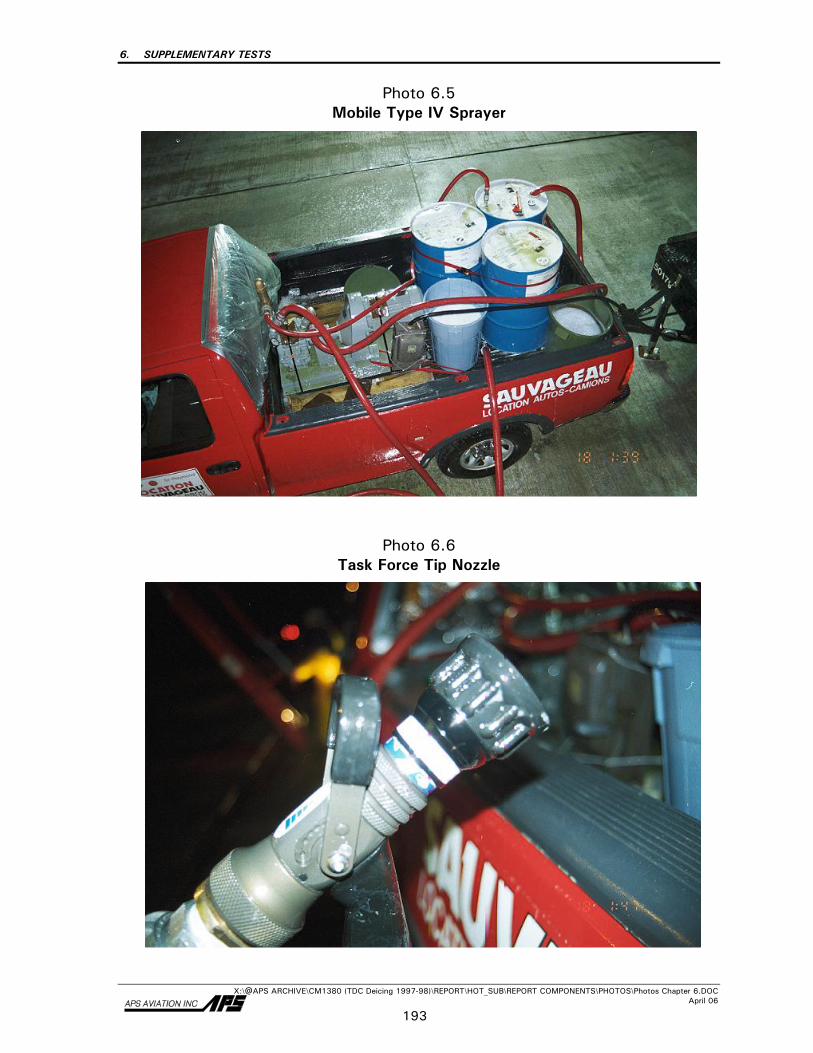
6. SUPPLEMENTARY TESTS
X:\@APS ARCHIVE\CM1380 (TDC Deicing 1997-98)\REPORT\HOT_SUB\REPORT COMPONENTS\PHOTOS\Photos Chapter 6.DOC April 06
193
Photo 6.5 Mobile Type IV Sprayer
Photo 6.6 Task Force Tip Nozzle

194
This page intentionally left blank
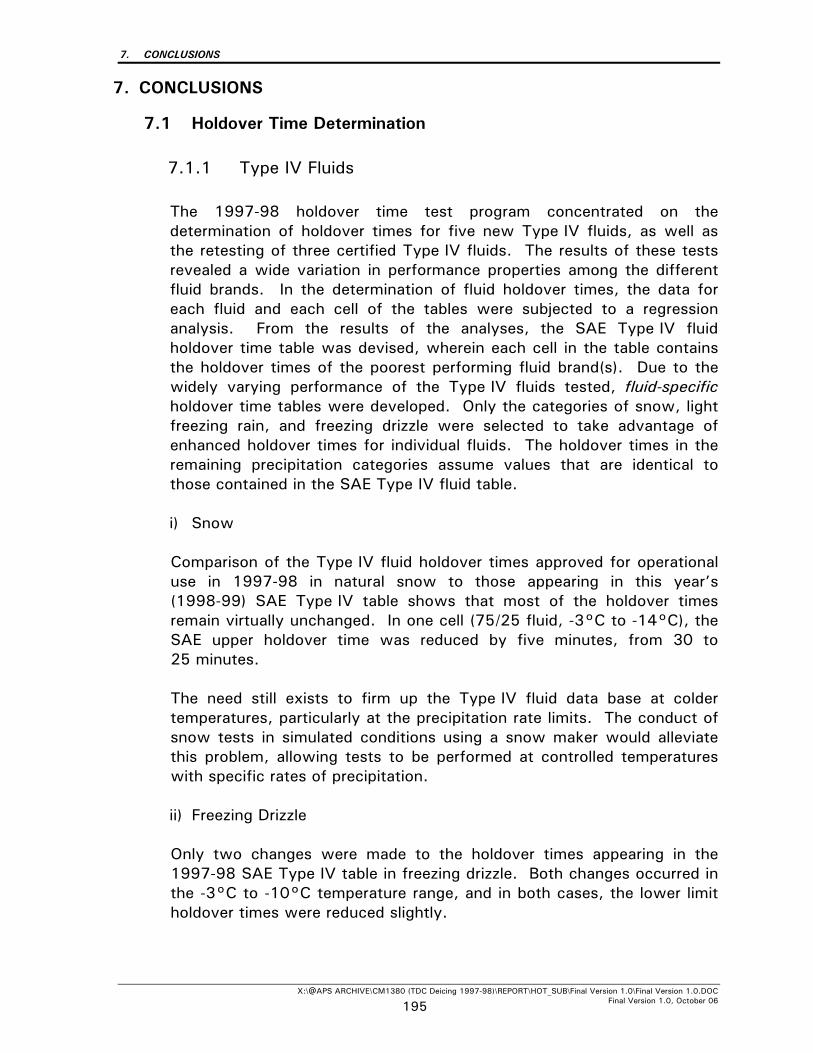
7. CONCLUSIONS
X:\@APS ARCHIVE\CM1380 (TDC Deicing 1997-98)\REPORT\HOT_SUB\Final Version 1.0\Final Version 1.0.DOC Final Version 1.0, October 06 195
7. CONCLUSIONS
7.1 Holdover Time Determination
7.1.1 Type IV Fluids
The 1997-98 holdover time test program concentrated on the determination of holdover times for five new Type IV fluids, as well as the retesting of three certified Type IV fluids. The results of these tests revealed a wide variation in performance properties among the different fluid brands. In the determination of fluid holdover times, the data for each fluid and each cell of the tables were subjected to a regression analysis. From the results of the analyses, the SAE Type IV fluid holdover time table was devised, wherein each cell in the table contains the holdover times of the poorest performing fluid brand(s). Due to the widely varying performance of the Type IV fluids tested, fluid-specific holdover time tables were developed. Only the categories of snow, light freezing rain, and freezing drizzle were selected to take advantage of enhanced holdover times for individual fluids. The holdover times in the remaining precipitation categories assume values that are identical to those contained in the SAE Type IV fluid table.
i) Snow
Comparison of the Type IV fluid holdover times approved for operational
use in 1997-98 in natural snow to those appearing in this year’s (1998-99) SAE Type IV table shows that most of the holdover times remain virtually unchanged. In one cell (75/25 fluid, -3°C to -14°C), the SAE upper holdover time was reduced by five minutes, from 30 to 25 minutes.
The need still exists to firm up the Type IV fluid data base at colder
temperatures, particularly at the precipitation rate limits. The conduct of snow tests in simulated conditions using a snow maker would alleviate this problem, allowing tests to be performed at controlled temperatures with specific rates of precipitation.
ii) Freezing Drizzle
Only two changes were made to the holdover times appearing in the
1997-98 SAE Type IV table in freezing drizzle. Both changes occurred in the -3°C to -10°C temperature range, and in both cases, the lower limit holdover times were reduced slightly.
7. CONCLUSIONS
X:\@APS ARCHIVE\CM1380 (TDC Deicing 1997-98)\REPORT\HOT_SUB\Final Version 1.0\Final Version 1.0.DOC Final Version 1.0, October 06 196
iii) Light Freezing Rain Holdover time changes were made to only one cell in the SAE Type IV
table in light freezing rain conditions. The changes occurred in the -3°C to -10°C temperature range for neat fluid, and both the upper and lower holdover time limits were reduced by 15 minutes, from 30 to 45 minutes, to 15 to 30 minutes.
iv) Freezing Fog
The holdover time values in the freezing fog cells of the Type IV fluid-
specific tables contain the SAE holdover times. Since it was decided in Vienna that the lower fog precipitation rate limit of 2 g/dm2/h was not indicative of low rate natural fog, the upper holdover times in the freezing fog cells were adopted from last year’s 1997-98 SAE Type IV fluid table. Two slight reductions were made to the lower limit holdover times, one for neat fluid in the 0°C to -3°C temperature range (from 140 minutes to 120 minutes), the other for 75/25 fluid in the -3°C to -14°C temperature range (from 35 minutes to 30 minutes).
v) Rain on a Cold-Soaked Wing
No changes were made to the SAE holdover times in the rain on a
cold-soaked wing condition.
7.1.2 Type III Fluids
No Type III fluids were available during the past season and therefore no Type III holdover time testing was performed. Furthermore, the current Type III holdover time table is not valid since its numbers were generated using a fluid that is no longer commercially available.
7.1.3 Type I Fluids
Type I fluid holdover times remain unchanged from those used during the 1997-98 winter. 7.1.4 Type II Fluids
Two Type II fluid holdover times were reduced to match the Type IV fluid holdover times, because no Type II holdover time may exceed the corresponding Type IV fluid holdover time. The values were both
7. CONCLUSIONS
X:\@APS ARCHIVE\CM1380 (TDC Deicing 1997-98)\REPORT\HOT_SUB\Final Version 1.0\Final Version 1.0.DOC Final Version 1.0, October 06 197
reduced from 30 minutes to 25 minutes; one was for snow and the second for freezing drizzle.
7.2 SUPPLEMENTARY TESTS
7.2.1 Evaluation of Recycled Fluids • Holdover time tests conducted on propylene and ethylene recycled
fluids manufactured by Inland Technologies showed them to exhibit performance levels equivalent to Type I fluids;
• The holdover times of Type IV fluids are generally reduced slightly
when applied over an undercoat of Type I or recycled fluids; and • Both recycled fluids also appear compatible with commercial Type IV
fluids when intended as first-step fluids in a two-step application. No single undercoat fluid appeared to have a significantly worse effect on Type IV fluid holdover time in all conditions.
7.2.2 Evaluation of the Snow-Making Capability of NRC’s CEF
The evidence from these brief tests indicates that the current ability of NRC’s CEF to produce snow does not offer the level of controllability required to satisfy the experimental conditions. Further, the uncertainty of snow production at warmer temperatures such as -3ºC is a concern.
7.2.3 Aeroflot Fluid
Aeroflot fluid holdover time tests were conducted in natural snow conditions only, and the failure times for the Aeroflot fluid were similar to commercial Type I tests conducted on the same day.
7.2.4 Influence of Plate Slope on Holdover Time
Plate slope has a notable effect on the holdover time of a given fluid. Standard holdover time tests are conducted on plates inclined at a 10° slope. When tests were performed on plates with a slight increase or decrease in plate inclination, for every 1° change in slope resulting holdover times were increased or decreased over the standard tests by as much as 10 percent.
7. CONCLUSIONS
X:\@APS ARCHIVE\CM1380 (TDC Deicing 1997-98)\REPORT\HOT_SUB\Final Version 1.0\Final Version 1.0.DOC Final Version 1.0, October 06 198
7.2.5 Influence of Application Procedure on Holdover Time
The method of fluid application appears to affect the holdover time of Type IV fluids. Standard holdover time tests are conducted using poured fluids on flat plates. Fluids are applied to aircraft wings through pumps and hoses, which inevitably shear the fluids. In the comparative tests conducted, the holdover time of the sprayed fluids increased or decreased in comparison to the holdover time of the poured fluids, depending on the fluid tested. Further testing is required to obtain any conclusive results. 7.2.6 Influence of Type IV Fluid Temperature on Holdover Time
Generally, the holdover times of heated Type IV fluids are inferior to those of ambient Type IV fluids. For certain fluids, holdover times of heated fluids were lowered by more than 50 percent.
7.2.7 Influence of Wind on Holdover Time
Tests were conducted to determine the effect of wind on the holdover times of Type I and Type IV fluids. The results showed that holdover times were slightly reduced when plates were exposed to a 10 km/h wind in the tests conducted with Type I and Type IV 50/50 fluids. In tests using neat Type IV fluid, the holdover time results both with and without wind exposure were similar. It should be noted that these conclusions were drawn from a limited amount of data.
7.2.8 Influence of Fluid Viscosity on Holdover Time
Tests conducted using low and mid-range viscosity samples from the same fluid manufacturer showed that viscosity does affect the holdover time of a fluid. A high viscosity sample is more resistant to dilution and will generally outperform a low viscosity sample, except at colder temperatures (for certain fluids) where the fluid manufacturer’s high viscosity sample did not flow as freely, and failures occur in the upper fluid layers.
8. RECOMMENDATIONS
X:\@APS ARCHIVE\CM1380 (TDC Deicing 1997-98)\REPORT\HOT_SUB\Final Version 1.0\Final Version 1.0.DOC Final Version 1.0, October 06 199
8. RECOMMENDATIONS
This section provides a series of detailed recommendations based on the test results and conclusions.
8.1 Holdover Time Tests
It is recommended that:
• An artificial snow-making machine (possibly the system in development by NCAR) be evaluated; based on the evaluation, the system could be used for future snow holdover time testing;
• Future holdover time tests be conducted with all fluid types using the
most restrictive temperature in each cell, and fluid samples from both the upper and lower end of the manufacturer’s production viscosity range;
• Fog deposition measurements be conducted outdoors to determine the
range of deposition rates that occur naturally in fog;
• Further tests in simulated freezing fog be conducted to evaluate upper holdover times at the lower precipitation rate limit, once an appropriate rate has been determined;
• Any new Type IV fluids be evaluated over the entire range of conditions
of the holdover time tables; and
• The holdover time table for Type III fluids be re-evaluated if new Type III fluids become available for testing in 1998-99.
8.2 Test Procedures and Equipment
8.2.1 Procedures
• Measure and record viscosity of all Type IV fluids prior to testing; and
• Test Type IV fluids at different shear levels to determine the viscosity’s effect on holdover time.
8. RECOMMENDATIONS
X:\@APS ARCHIVE\CM1380 (TDC Deicing 1997-98)\REPORT\HOT_SUB\Final Version 1.0\Final Version 1.0.DOC Final Version 1.0, October 06 200
8.2.2 Equipment
• Further testing of the Spar/Cox ice detection camera should be implemented to compare its response to visual failure observations and the records from other sensors;
• A shed should be used to store test fluids; and
• Due to difficulties related to temperature data collection using
thermistors mounted on the cold-soak boxes, alternative methods for monitoring box surface temperatures need to be investigated.
8.3 Supplementary Tests
8.3.1 Evaluation of Snow-Making at NRC’s CEF
It is recommended that other systems for producing snow at controlled and predefined rates be explored, perhaps for installation in the current cold chamber. Relative cost effectiveness of alternate systems should be a factor in the evaluation.
8.3.2 Influence of Application Procedure on Holdover Time
Since the results of fluid application tests varied depending on the fluid tested, it is recommended that further tests to examine the effect of the fluid sprayer on holdover time be conducted for each Type IV fluid made available for testing.
8.3.3 Influence of Wind on Holdover Time
Tests aimed at determining the effect of wind on fluid holdover times were conducted using 10 km/h winds only. Future tests should be performed using a variety of wind speeds, test conditions, and fluids.
8.3.4 Influence of Fluid Viscosity on Holdover Time
Fluid viscosity appears to have a substantial effect on fluid holdover time. In the future, all fluid manufacturers should ship fluids representative of the manufacturer’s lowest recommended on-wing viscosity for holdover time test purposes to allow equal evaluation of all fluids.
8. RECOMMENDATIONS
X:\@APS ARCHIVE\CM1380 (TDC Deicing 1997-98)\REPORT\HOT_SUB\Final Version 1.0\Final Version 1.0.DOC Final Version 1.0, October 06 201
The low viscosity samples would yield more conservative holdover times in most conditions. Fluid samples representative of the high end of the manufacturer’s production viscosity range should also be tested, especially in colder temperatures, since it has been observed that the high viscosity sample fails sooner for certain fluids. 8.3.5 Escaped Precipitation
One test that might be interesting to conduct in the future is to measure the test quantity of escaped precipitation. The data could be used to determine more precisely just what quantities of precipitation can actually be absorbed prior to failure in any test condition, and also to provide a measure of how much of the applied fluid drains from the plate surface.
Tests should be carried out with specially designed receptacles mounted just ahead of the lower flat plate edge to capture and subsequently weigh the fraction. A measure of the extent of fluid pickup by this escaped fraction would be determined from refractive index measurements of the collected fractions.

202
This page intentionally left blank.
REFERENCES
X:\@APS ARCHIVE\CM1380 (TDC Deicing 1997-98)\REPORT\HOT_SUB\Final Version 1.0\Final Version 1.0.DOC Final Version 1.0, October 06
203
REFERENCES 1. D’Avirro, J., Peters, A., Hanna, M., Dawson, P., Chaput, M.,
Aircraft Ground De/Anti-icing Fluid Holdover Time Field Testing Program for the 1996-97 Winter, APS Aviation Inc., Transportation Development Centre, Montreal, November 1997, TP 13131E, 232.
2. World Meteorological Organization, 1983: Guide to Meteorological
Instruments and Methods of Observation.
3. American Meteorological Society, Glossary of Meteorology, 1st ed., AMS, 1959.h
4. American Meteorological Society, Glossary of Meteorology WSDH
#7 Manual of Surface Weather Observations (MANOBS).
5. Naughton, I.I., and Wyat, J.G., The Dye-Stain Technique for Measuring the Size of Rain Drops, Royal Aircraft Establishment, July 1965, Report No. 65136.
6. Chaput, M., Dawson, P., D’Avirro, J., Hanna, M., Ruggi, E.,
Adam, S., Research on Aircraft De-icing Operations for the 1997-98 Winter, APS Aviation Inc., Transportation Development Centre, Montreal, December 1998, TP 13314E, 132.
7. Dawson, P., D’Avirro, J., Validation of Methodology for Simulating
a Cold-Soaked Wing, APS Aviation Inc., Transportation Development Centre, Montreal, October 1996, TP 12899E, 118.
8. Dawson, P., D’Avirro, J., Evaluation of Fluid Thickness to Locate
Representative Surfaces, APS Aviation Inc., Transportation Development Centre, Montreal, October 1996, TP 12900E, 109.
9. D’Avirro, J., Foo, H., Guy, C., Hoppe, A., McConachie, E., Spicer,
S., Aircraft Ground De/Anti-icing Fluid Holdover Time Field Testing Program for the 1991-1992 Winter, Aviation Planning Services Ltd., Transportation Development Centre, Montreal, August 1992, TP 11454E, 83.
10. Bilgen, E., Chan, G., Cleary, C., D’Avirro, J., Foo, H., Aicraft
Ground De/Anti-icing Fluid Holdover Time Field Testing Program for the 1992-1993 Winter, APS Aviation Inc., Transportation Development Centre, Montreal, October 1993, 11836E, 122.
REFERENCES
X:\@APS ARCHIVE\CM1380 (TDC Deicing 1997-98)\REPORT\HOT_SUB\Final Version 1.0\Final Version 1.0.DOC Final Version 1.0, October 06
204
11. D'Avirro, J., Aircraft Ground De/Anti-icing Fluid Holdover Time Field Testing Program for the 1995-1996 Winter, APS Aviation Inc., Transportation Development Centre, Montreal, November 1996, TP 12896E, 172.
12. Dawson, P., Hanna, M., Chaput, M., Aircraft Deicing Fluid Freeze
Point Buffer Requirements: Deicing Only and First Step of Two-Step Deicing, APS Aviation Inc., Transportation Development Centre, Montreal, December 1998, TP 13315E, 168.
Top Related