
![The AMS-02 time of flight (TOF) system: construction and overall …€¦ · The Alpha Magnetic Spetrometer (AMS-02)[1] on the International Space Station (ISS) measures the cosmic](https://static.fdocuments.us/doc/165x107/5f809903abe65f0703320ce1/the-ams-02-time-of-iight-tof-system-construction-and-overall-the-alpha-magnetic.jpg)


Languages
Pages
Legal

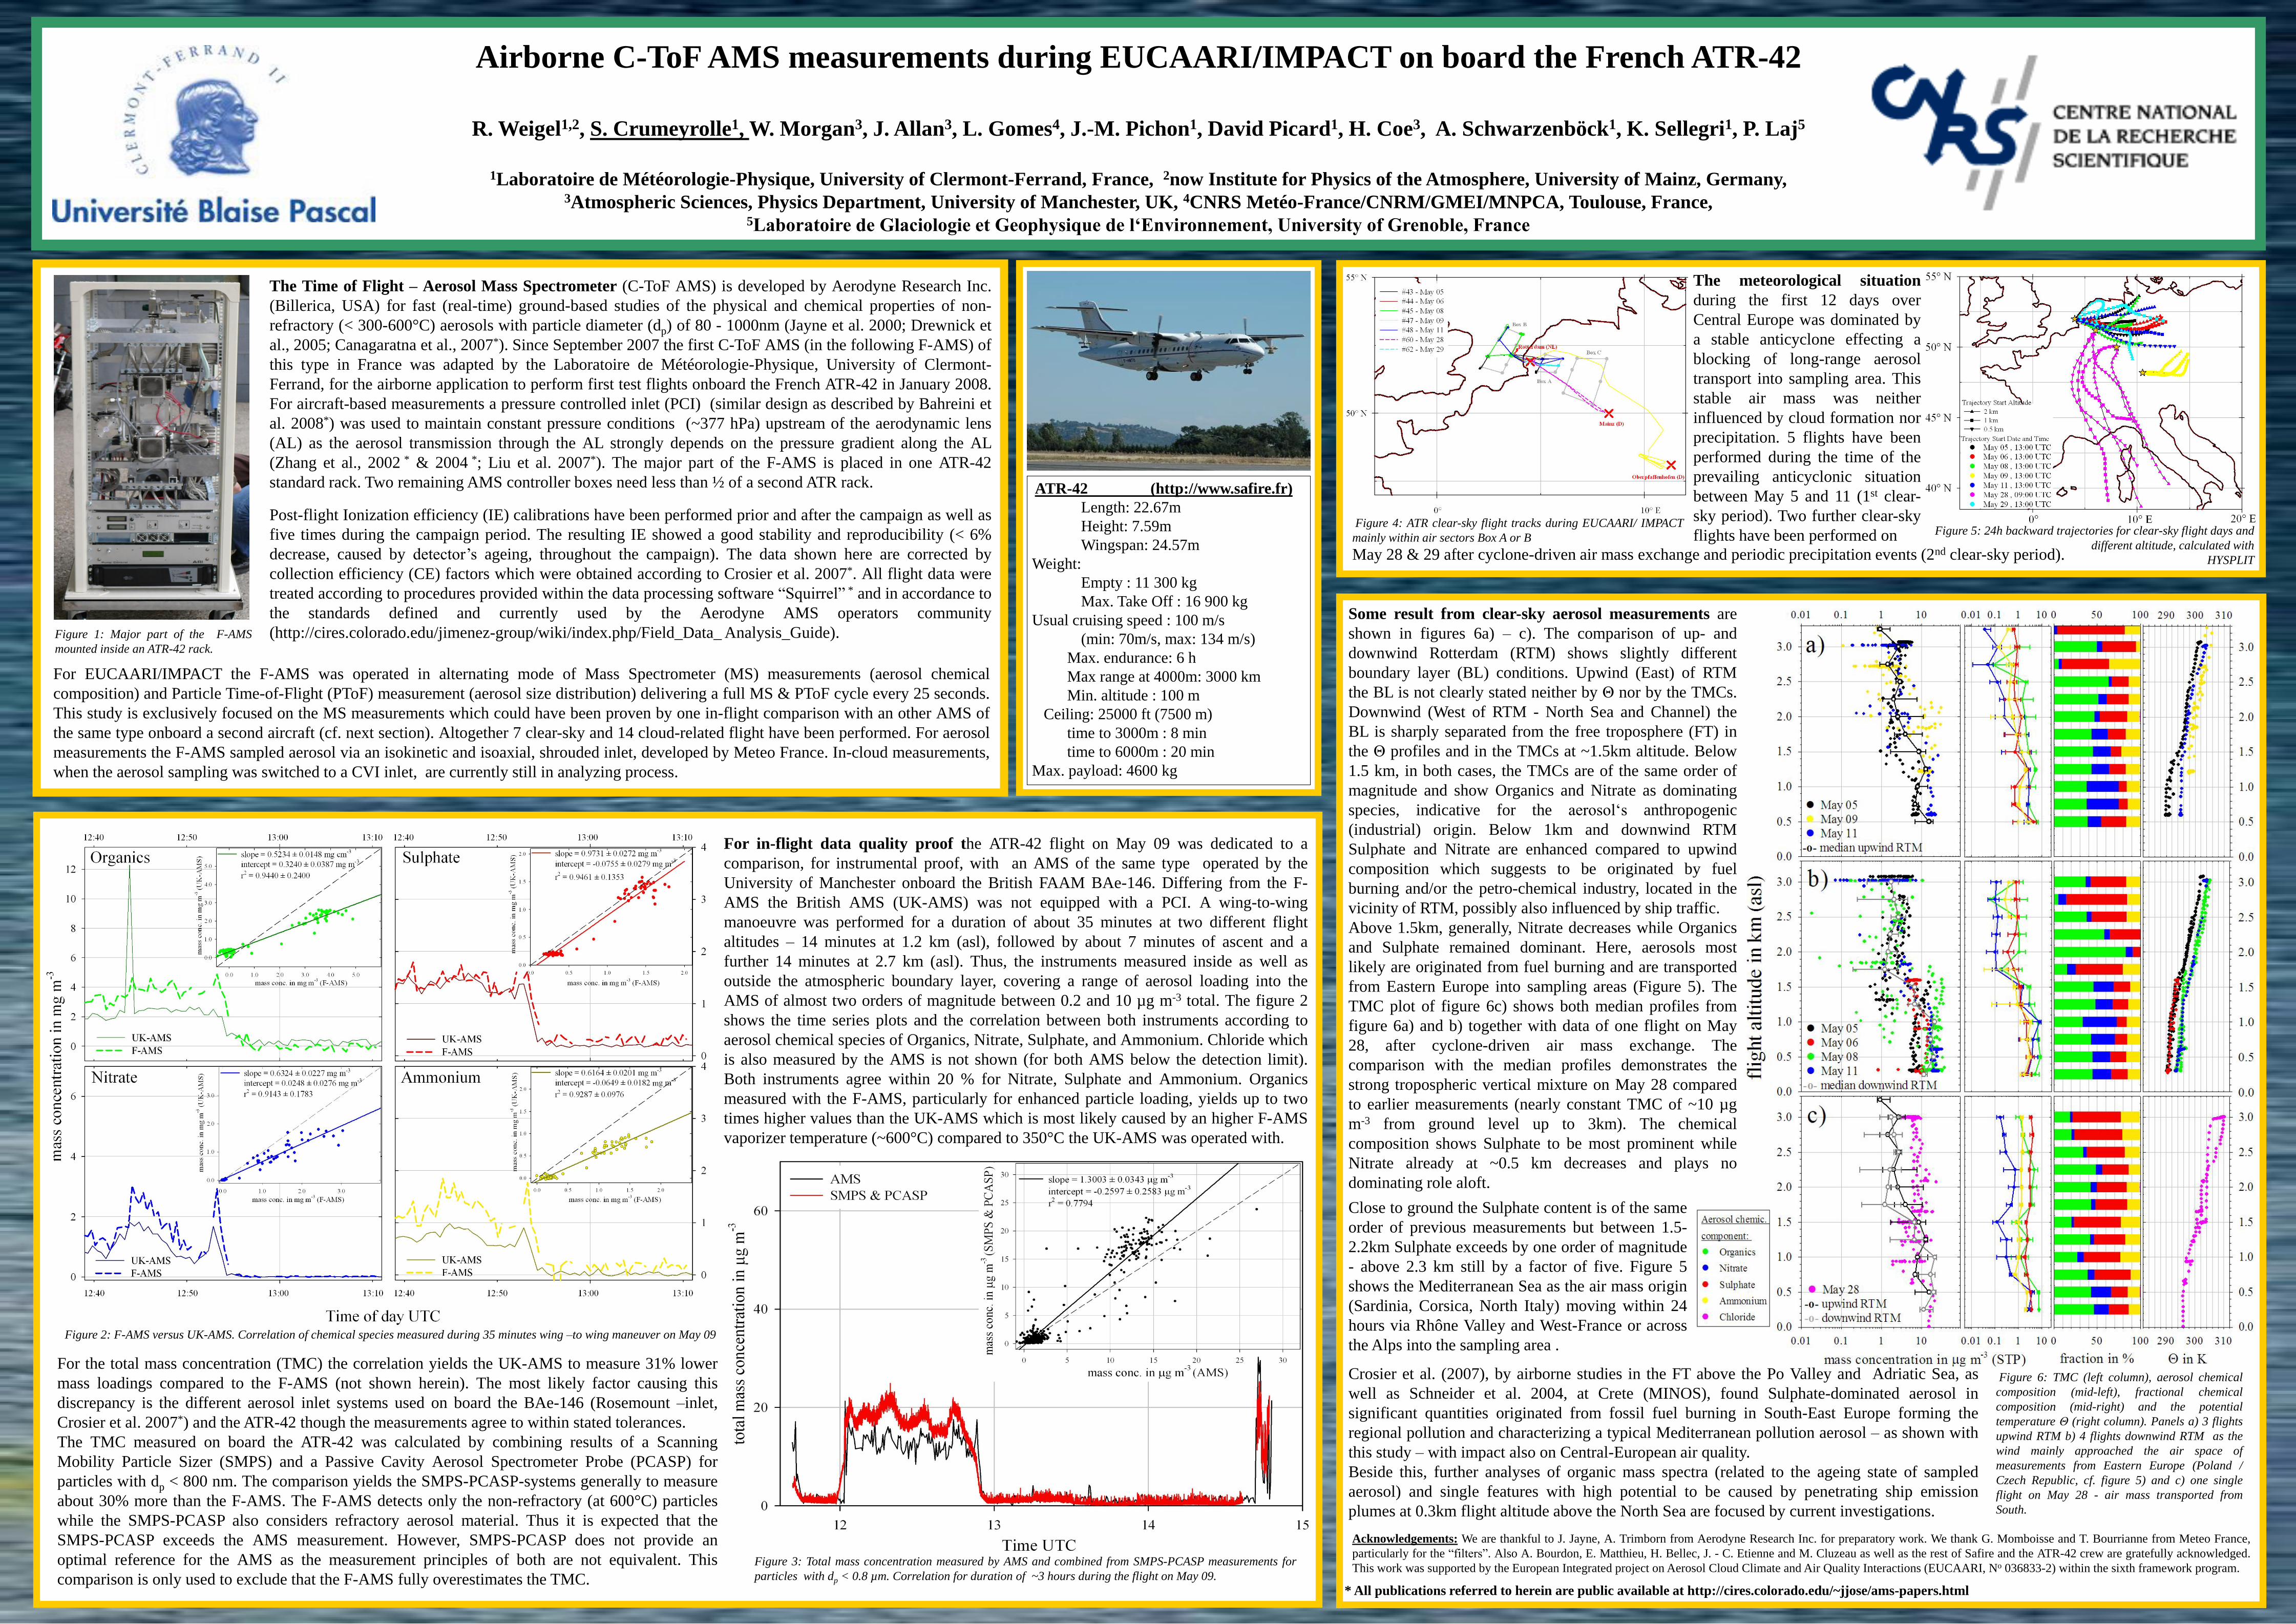
Airborne C-ToF AMS measurements during EUCAARI/IMPACT on board the French ATR-42
R. Weigel1,2, S. Crumeyrolle1, W. Morgan3, J. Allan3, L. Gomes4, J.-M. Pichon1, David Picard1, H. Coe3, A. Schwarzenböck1, K. Sellegri1, P. Laj5
1Laboratoire de Météorologie-Physique, University of Clermont-Ferrand, France, 2now Institute for Physics of the Atmosphere, University of Mainz, Germany, 3Atmospheric Sciences, Physics Department, University of Manchester, UK, 4CNRS Metéo-France/CNRM/GMEI/MNPCA, Toulouse, France,
5Laboratoire de Glaciologie et Geophysique de l‘Environnement, University of Grenoble, France
The Time of Flight – Aerosol Mass Spectrometer (C-ToF AMS) is developed by Aerodyne Research Inc.
(Billerica, USA) for fast (real-time) ground-based studies of the physical and chemical properties of non-
refractory (< 300-600°C) aerosols with particle diameter (dp) of 80 - 1000nm (Jayne et al. 2000; Drewnick et
al., 2005; Canagaratna et al., 2007*). Since September 2007 the first C-ToF AMS (in the following F-AMS) of
this type in France was adapted by the Laboratoire de Météorologie-Physique, University of Clermont-
Ferrand, for the airborne application to perform first test flights onboard the French ATR-42 in January 2008.
For aircraft-based measurements a pressure controlled inlet (PCI) (similar design as described by Bahreini et
al. 2008*) was used to maintain constant pressure conditions (~377 hPa) upstream of the aerodynamic lens
(AL) as the aerosol transmission through the AL strongly depends on the pressure gradient along the AL
(Zhang et al., 2002 * & 2004 *; Liu et al. 2007*). The major part of the F-AMS is placed in one ATR-42
standard rack. Two remaining AMS controller boxes need less than ½ of a second ATR rack.
Post-flight Ionization efficiency (IE) calibrations have been performed prior and after the campaign as well as
five times during the campaign period. The resulting IE showed a good stability and reproducibility (< 6%
decrease, caused by detector‟s ageing, throughout the campaign). The data shown here are corrected by
collection efficiency (CE) factors which were obtained according to Crosier et al. 2007*. All flight data were
treated according to procedures provided within the data processing software “Squirrel” * and in accordance to
the standards defined and currently used by the Aerodyne AMS operators community
(http://cires.colorado.edu/jimenez-group/wiki/index.php/Field_Data_ Analysis_Guide).
ATR-42 (http://www.safire.fr)
Length: 22.67m
Height: 7.59m
Wingspan: 24.57m
Weight:
Empty : 11 300 kg
Max. Take Off : 16 900 kg
Usual cruising speed : 100 m/s
(min: 70m/s, max: 134 m/s)
Max. endurance: 6 h
Max range at 4000m: 3000 km
Min. altitude : 100 m
Ceiling: 25000 ft (7500 m)
time to 3000m : 8 min
time to 6000m : 20 min
Max. payload: 4600 kg
The meteorological situation
during the first 12 days over
Central Europe was dominated by
a stable anticyclone effecting a
blocking of long-range aerosol
transport into sampling area. This
stable air mass was neither
influenced by cloud formation nor
precipitation. 5 flights have been
performed during the time of the
prevailing anticyclonic situation
between May 5 and 11 (1st clear-
sky period). Two further clear-sky
flights have been performed onFigure 4: ATR clear-sky flight tracks during EUCAARI/ IMPACT
mainly within air sectors Box A or BFigure 5: 24h backward trajectories for clear-sky flight days and
different altitude, calculated with
HYSPLIT
For in-flight data quality proof the ATR-42 flight on May 09 was dedicated to a
comparison, for instrumental proof, with an AMS of the same type operated by the
University of Manchester onboard the British FAAM BAe-146. Differing from the F-
AMS the British AMS (UK-AMS) was not equipped with a PCI. A wing-to-wing
manoeuvre was performed for a duration of about 35 minutes at two different flight
altitudes – 14 minutes at 1.2 km (asl), followed by about 7 minutes of ascent and a
further 14 minutes at 2.7 km (asl). Thus, the instruments measured inside as well as
outside the atmospheric boundary layer, covering a range of aerosol loading into the
AMS of almost two orders of magnitude between 0.2 and 10 µg m-3 total. The figure 2
shows the time series plots and the correlation between both instruments according to
aerosol chemical species of Organics, Nitrate, Sulphate, and Ammonium. Chloride which
is also measured by the AMS is not shown (for both AMS below the detection limit).
Both instruments agree within 20 % for Nitrate, Sulphate and Ammonium. Organics
measured with the F-AMS, particularly for enhanced particle loading, yields up to two
times higher values than the UK-AMS which is most likely caused by an higher F-AMS
vaporizer temperature (~600°C) compared to 350°C the UK-AMS was operated with.
For the total mass concentration (TMC) the correlation yields the UK-AMS to measure 31% lower
mass loadings compared to the F-AMS (not shown herein). The most likely factor causing this
discrepancy is the different aerosol inlet systems used on board the BAe-146 (Rosemount –inlet,
Crosier et al. 2007*) and the ATR-42 though the measurements agree to within stated tolerances.
The TMC measured on board the ATR-42 was calculated by combining results of a Scanning
Mobility Particle Sizer (SMPS) and a Passive Cavity Aerosol Spectrometer Probe (PCASP) for
particles with dp < 800 nm. The comparison yields the SMPS-PCASP-systems generally to measure
about 30% more than the F-AMS. The F-AMS detects only the non-refractory (at 600°C) particles
while the SMPS-PCASP also considers refractory aerosol material. Thus it is expected that the
SMPS-PCASP exceeds the AMS measurement. However, SMPS-PCASP does not provide an
optimal reference for the AMS as the measurement principles of both are not equivalent. This
comparison is only used to exclude that the F-AMS fully overestimates the TMC.
For EUCAARI/IMPACT the F-AMS was operated in alternating mode of Mass Spectrometer (MS) measurements (aerosol chemical
composition) and Particle Time-of-Flight (PToF) measurement (aerosol size distribution) delivering a full MS & PToF cycle every 25 seconds.
This study is exclusively focused on the MS measurements which could have been proven by one in-flight comparison with an other AMS of
the same type onboard a second aircraft (cf. next section). Altogether 7 clear-sky and 14 cloud-related flight have been performed. For aerosol
measurements the F-AMS sampled aerosol via an isokinetic and isoaxial, shrouded inlet, developed by Meteo France. In-cloud measurements,
when the aerosol sampling was switched to a CVI inlet, are currently still in analyzing process.
* All publications referred to herein are public available at http://cires.colorado.edu/~jjose/ams-papers.html
Acknowledgements: We are thankful to J. Jayne, A. Trimborn from Aerodyne Research Inc. for preparatory work. We thank G. Momboisse and T. Bourrianne from Meteo France,
particularly for the “filters”. Also A. Bourdon, E. Matthieu, H. Bellec, J. - C. Etienne and M. Cluzeau as well as the rest of Safire and the ATR-42 crew are gratefully acknowledged.
This work was supported by the European Integrated project on Aerosol Cloud Climate and Air Quality Interactions (EUCAARI, No 036833-2) within the sixth framework program.
Figure 1: Major part of the F-AMS
mounted inside an ATR-42 rack.
Figure 2: F-AMS versus UK-AMS. Correlation of chemical species measured during 35 minutes wing –to wing maneuver on May 09
Figure 3: Total mass concentration measured by AMS and combined from SMPS-PCASP measurements for
particles with dp < 0.8 µm. Correlation for duration of ~3 hours during the flight on May 09.
Figure 6: TMC (left column), aerosol chemical
composition (mid-left), fractional chemical
composition (mid-right) and the potential
temperature Θ (right column). Panels a) 3 flights
upwind RTM b) 4 flights downwind RTM as the
wind mainly approached the air space of
measurements from Eastern Europe (Poland /
Czech Republic, cf. figure 5) and c) one single
flight on May 28 - air mass transported from
South.
Some result from clear-sky aerosol measurements are
shown in figures 6a) – c). The comparison of up- and
downwind Rotterdam (RTM) shows slightly different
boundary layer (BL) conditions. Upwind (East) of RTM
the BL is not clearly stated neither by Θ nor by the TMCs.
Downwind (West of RTM - North Sea and Channel) the
BL is sharply separated from the free troposphere (FT) in
the Θ profiles and in the TMCs at ~1.5km altitude. Below
1.5 km, in both cases, the TMCs are of the same order of
magnitude and show Organics and Nitrate as dominating
species, indicative for the aerosol„s anthropogenic
(industrial) origin. Below 1km and downwind RTM
Sulphate and Nitrate are enhanced compared to upwind
composition which suggests to be originated by fuel
burning and/or the petro-chemical industry, located in the
vicinity of RTM, possibly also influenced by ship traffic.
Above 1.5km, generally, Nitrate decreases while Organics
and Sulphate remained dominant. Here, aerosols most
likely are originated from fuel burning and are transported
from Eastern Europe into sampling areas (Figure 5). The
TMC plot of figure 6c) shows both median profiles from
figure 6a) and b) together with data of one flight on May
28, after cyclone-driven air mass exchange. The
comparison with the median profiles demonstrates the
strong tropospheric vertical mixture on May 28 compared
to earlier measurements (nearly constant TMC of ~10 µg
m-3 from ground level up to 3km). The chemical
composition shows Sulphate to be most prominent while
Nitrate already at ~0.5 km decreases and plays no
dominating role aloft.
Close to ground the Sulphate content is of the same
order of previous measurements but between 1.5-
2.2km Sulphate exceeds by one order of magnitude
- above 2.3 km still by a factor of five. Figure 5
shows the Mediterranean Sea as the air mass origin
(Sardinia, Corsica, North Italy) moving within 24
hours via Rhône Valley and West-France or across
the Alps into the sampling area .
Crosier et al. (2007), by airborne studies in the FT above the Po Valley and Adriatic Sea, as
well as Schneider et al. 2004, at Crete (MINOS), found Sulphate-dominated aerosol in
significant quantities originated from fossil fuel burning in South-East Europe forming the
regional pollution and characterizing a typical Mediterranean pollution aerosol – as shown with
this study – with impact also on Central-European air quality.
Beside this, further analyses of organic mass spectra (related to the ageing state of sampled
aerosol) and single features with high potential to be caused by penetrating ship emission
plumes at 0.3km flight altitude above the North Sea are focused by current investigations.
May 28 & 29 after cyclone-driven air mass exchange and periodic precipitation events (2nd clear-sky period).
Top Related