


Languages
Pages
Legal


Ain Shams University
International Ranking Annual
Report 2020
مدير قطاع العلاقات الدولية والتعاون الأكاديمى
أ.د. شهيرة سمير زكى
مدير مكتب التصنيف الدولى
د. أحمد البنا

1
التصنيف الدولى نافذة الجامعات المصرية على المجتمع الدولى
مصنفة الغير ى السنوات الأخيرة ، فالجامعات التصنيف الدولى ضرورة لا غنى عنها ف لقد أصبح
ة يبحث جامعالقبل التحاقه بعلى المستوى العالمى ليس لها مكان على الخريطة العالمية ، فالطالب
كى يضمن فرصة عمل فى السوق المحلى والدولى أيضا .مكانتها العالمية قبل المحلية ، عن
جامعة عين شمس كواحدة من أعرق الجامعات تتواجد فى كل التصنيفات الدولية المرموقة مما يجعلها
من جامعات العالم. %3واحدة من أفضل
ادية واللوجستية تؤهلها لتحقيق ترتيبات متقدمة تؤمن الجامعة بأن كوادرها وامكانياتها البشرية والم
ضمن أفضل الجامعات فى التصنيفات الدولية المختلفة
وفى هذا الإطار فإن جامعة عين شمس تضع )النهوض بالتصنيف الدولى( ضمن أولوياتها
امعى جلخلق بيئة بحثية مناسبة تحفز المجتمع ال الاستراتيجية التى تعمل عليها كل قطاعات الجامعة
والباحثين والتى من شأنها إظهار الجامعة بشكل متميز فى التصنيفات الدولية المختلفة .
د محمود المتينى.أ
رئيس جامعة عين شمس
.

2
List of reputable international rankings with links to ASU rankings
Ranking Website ARWU(Shanghai)
http://www.shanghairanking.com/World-University-Rankings/Ain-Shams-University.html
Times Higher Education
https://www.timeshighereducation.com/world-university-rankings/ain-shams-university
QS
https://www.topuniversities.com/universities/ain-shams-university
US News
https://www.usnews.com/education/best-global-universities/ain-shams-university-500744
CWTS Leiden https://www.leidenranking.com/Ranking/University2020?universityId=1528&fieldId=1&periodId=10&fractionalCounting=1&performanceDimension=0&rankingIndicator=pp_top10&minNPubs=100
Scimago
https://www.scimagoir.com/institution.php?idp=2281
Center of world university
ranking
https://cwur.org/2020-21/Ain-Shams-University.php
University ranking by
academic performance
https://www.urapcenter.org/Rankings/2019-2020/world-2019

3
International rankings annual report 2020
Progress of Ain shams university in different international rankings
2021 2020 2019 2018 2017 2016 2015 2014 2013 2012
801-900
701-800
701-800
701-800
- - - - -
1001+ 801-1000
1001+ 801-1000
801+ - - - - -
801-1000 801-1000
701-750
701-750
**** 701+ 701+
701+
*** 601 601+
648 667 729 714 685 717
576 582 587 597 586 704 711 - -
624 605 613 541 543 557 572 600 648
794 793 715 943 960 965 965 - -
607 637 637 631 622 630 638 629

4
Region Egypt International
Africa 10 3 800-900
Africa 21 10 + 1001
Africa 8
Arab15 3 801 - 1000
Africa 15 3 648
Africa 8 2 576
Africa 7
MENA 21 2 624
Africa 7 2 794
Africa 10 3 607
5
Academic ranking of world universities ARWU
(Shanghai)
A. World Ranking
Introduction
The Academic Ranking of World Universities (ARWU) was first published in June 2003 by the
Center for World-Class Universities (CWCU), Graduate School of Education (formerly the Institute
of Higher Education) of Shanghai Jiao Tong University, China, and updated on an annual basis. Since
2009 the Academic Ranking of World Universities (ARWU) has been published and copyrighted by
Shanghai Ranking Consultancy. Shanghai Ranking Consultancy is a fully independent organization
on higher education intelligence and not legally subordinated to any universities or government
agencies.
ARWU uses six objective indicators to rank world universities, including the number of alumni
and staff winning Nobel Prizes and Fields Medals, number of highly cited researchers selected by
Clarivate Analytics, number of articles published in journals of Nature and Science, number of
articles indexed in Science Citation Index - Expanded and Social Sciences Citation Index, and per
capita performance of a university. More than 1800 universities are actually ranked by ARWU every
year and the best 1000 are published.
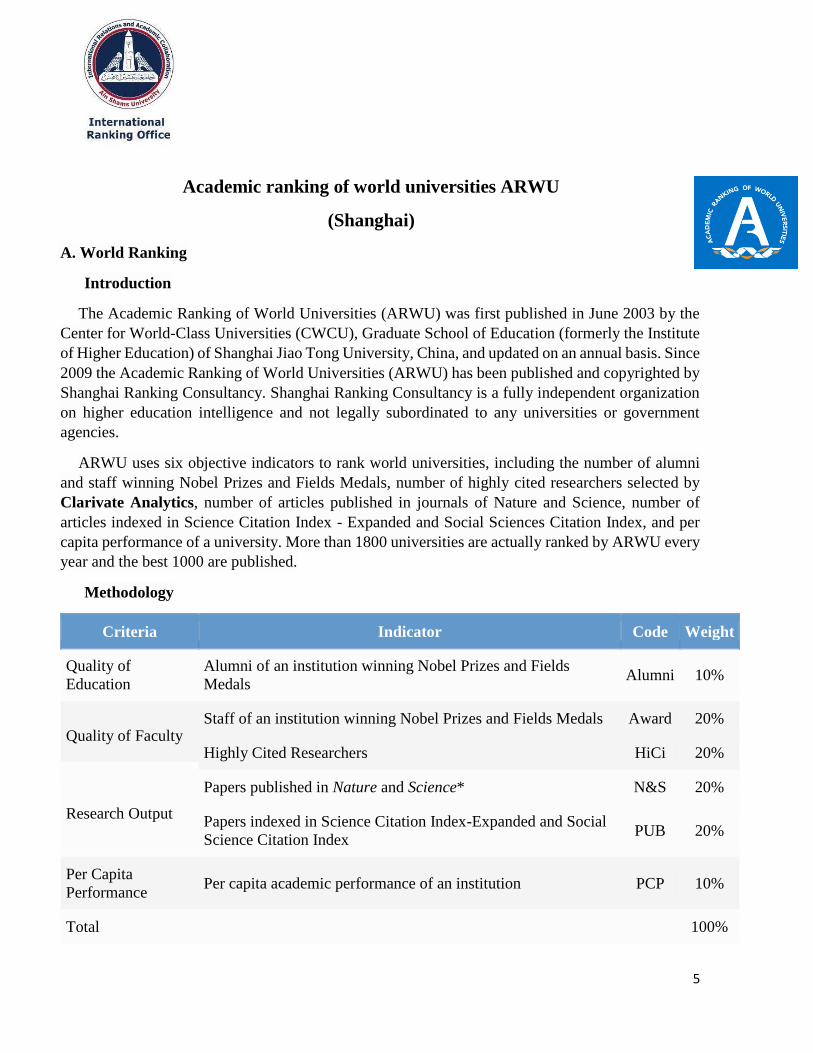
Methodology
Criteria Indicator Code Weight
Quality of
Education
Alumni of an institution winning Nobel Prizes and Fields
Medals Alumni 10%
Quality of Faculty Staff of an institution winning Nobel Prizes and Fields Medals Award 20%
Highly Cited Researchers HiCi 20%
Research Output
Papers published in Nature and Science* N&S 20%
Papers indexed in Science Citation Index-Expanded and Social
Science Citation Index PUB 20%
Per Capita
Performance Per capita academic performance of an institution PCP 10%
Total 100%

6
Indicator Definition
Alumni
The total number of the alumni of an institution winning Nobel Prizes and Fields Medals. Alumni are defined as those
who obtain bachelor's, master's or doctoral degrees from the institution. Different weights are set according to the periods
of obtaining degrees. The weight is 100% for alumni obtaining degrees after 2011, 90% for alumni obtaining degrees in
2001-2010, 80% for alumni obtaining degrees in 1991-2000, and so on, and finally 10% for alumni obtaining degrees in
1921-1930. If a person obtains more than one degree from an institution, the institution is considered once only.
Award
The total number of the staff of an institution winning Nobel Prizes in Physics, Chemistry, Medicine and Economics and
Fields Medal in Mathematics. Staff is defined as those who work at an institution at the time of winning the prize. Different
weights are set according to the periods of winning the prizes. The weight is 100% for winners after 2011, 90% for winners
in 2001-2010, 80% for winners in 1991-2000, 70% for winners in 1981-1990, and so on, and finally 10% for winners in
1921-1930. If a winner is affiliated with more than one institution, each institution is assigned the reciprocal of the number
of institutions. For Nobel prizes, if a prize is shared by more than one person, weights are set for winners according to
their proportion of the prize.
HiCi
The number of Highly Cited Researchers selected by Clarivate Analytics. The Highly Cited Researchers list issued in
December 2019 was used for the calculation of HiCi indicator in ARWU 2020. Only the primary affiliations of Highly
Cited Researchers are considered.
N&S
The number of papers published in Nature and Science between 2015 and 2019. To distinguish the order of author
affiliation, a weight of 100% is assigned for corresponding author affiliation, 50% for first author affiliation (second author
affiliation if the first author affiliation is the same as corresponding author affiliation), 25% for the next author affiliation,
and 10% for other author affiliations. When there are more than one corresponding author addresses, we consider the first
corresponding author address as the corresponding author address and consider other corresponding author addresses as
first author address, second author address etc. following the order of the author addresses. Only publications of 'Article'
type is considered.
PUB
Total number of papers indexed in Science Citation Index-Expanded and Social Science Citation Index in 2019. Only
publications of 'Article' type is considered. When calculating the total number of papers of an institution, a special weight
of two is introduced for papers indexed in Social Science Citation Index.
PCP
The weighted scores of the above five indicators divided by the number of full-time equivalent academic staff. If the
number of academic staff for institutions of a country cannot be obtained, the weighted scores of the above five indicators
is used. For ARWU 2020, the numbers of full-time equivalent academic staff are obtained for institutions in USA, UK,
France, Canada, Japan, Italy, Australia, Netherlands, Sweden, Switzerland, Belgium, South Korea, Czech, Slovenia, New
Zealand etc.
Ain shams performance among all parameters 2017-202
RANKING IN
EGYPT Alumni Award HiCi N&S PUB PCP
2017 701-800 2-3 0 0 0 3.6 26.2 13.2
2018 701-800 2-3 0 0 0 3.9 26.5 13.1
2019 701-800 2-3 0 0 0 2.1 28.3 13.7
2020 801-900 3-4 0 0 0 1.4 28.4 11.2

7
8
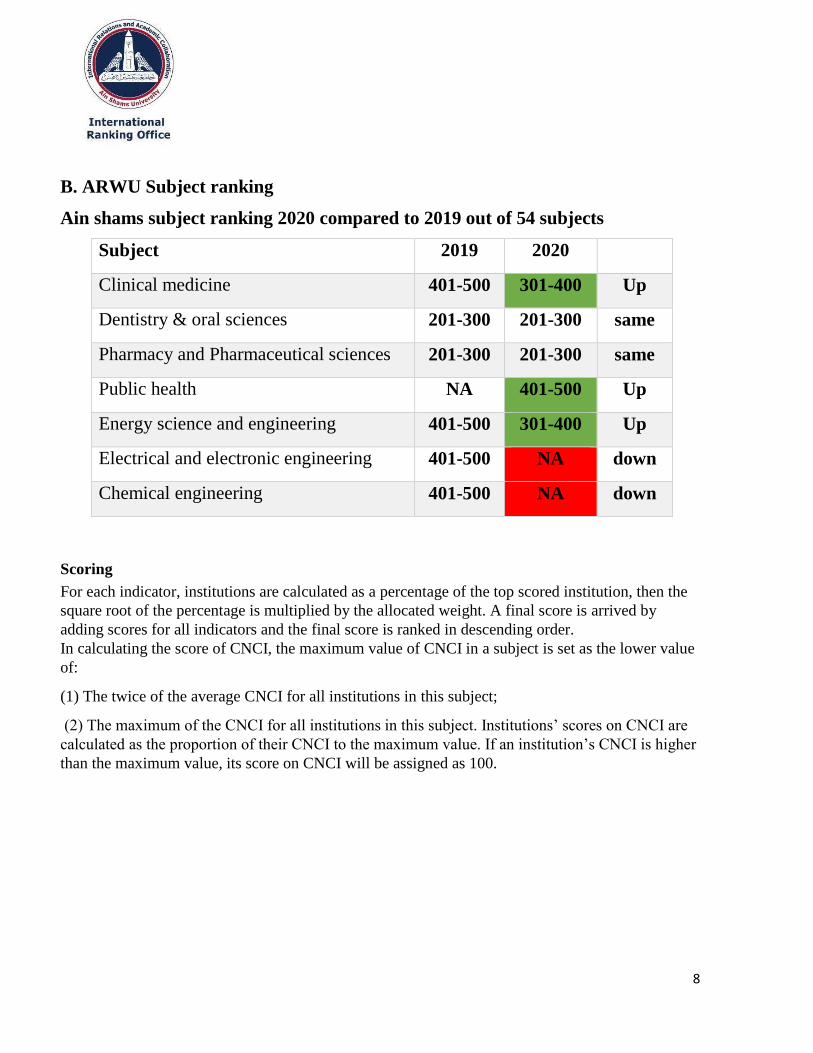
B. ARWU Subject ranking
Ain shams subject ranking 2020 compared to 2019 out of 54 subjects
Subject 2019 2020
Clinical medicine 401-500 301-400 Up
Dentistry & oral sciences 201-300 201-300 same
Pharmacy and Pharmaceutical sciences 201-300 201-300 same
Public health NA 401-500 Up
Energy science and engineering 401-500 301-400 Up
Electrical and electronic engineering 401-500 NA down
Chemical engineering 401-500 NA down
Scoring
For each indicator, institutions are calculated as a percentage of the top scored institution, then the
square root of the percentage is multiplied by the allocated weight. A final score is arrived by
adding scores for all indicators and the final score is ranked in descending order.
In calculating the score of CNCI, the maximum value of CNCI in a subject is set as the lower value
of:
(1) The twice of the average CNCI for all institutions in this subject;
(2) The maximum of the CNCI for all institutions in this subject. Institutions’ scores on CNCI are
calculated as the proportion of their CNCI to the maximum value. If an institution’s CNCI is higher
than the maximum value, its score on CNCI will be assigned as 100.

9
Definition of Indicators for subject ranking
Indicators Definition
Q1
Q1 is the number of papers authored by an institution in an Academic Subject in journals with Q1 Journal
Impact Factor Quartile during the period of 2014-2018. Only papers of 'Article' type are considered. Data are
collected from Web of Science and InCites. Papers in different Web of Science categories are grouped into
relevant Academic Subjects (Classification of Web of Science Categories into Academic Subjects).
CNCI
Category Normalized Citation Impact (CNCI) is the ratio of citation of papers published by an institution in
an Academic Subject during the period of 2014-2018 to the average citations of papers in the same category,
of the same year and same type. A CNCI value of 1 represents world-average performance while a value
above 1 represents performance above the world average. Only papers of 'Article' type are considered. Data
are collected from InCites database.
IC
International collaboration (IC) is the number of publications that have been found with at least two different
countries in addresses of the authors divided by the total number of publications in an Academic Subject for
an institution during the period of 2014-2018. Only papers of ‘Article’ type are considered. Data are collected
from InCites database.
Top
Top is the number of papers published in Top Journals in an Academic Subject for an institution during the
period of 2014-2018. Top Journals are identified through ShanghaiRanking’s Academic Excellence
Survey. In 2020, 151 top journals selected by the Survey are used in rankings of 47 Academic Subjects. In
Computer Science & Engineering, 22 selected top conferences are also taken into account this year. The list
of the top journals and conferences can be found here. Only papers of ‘Article’ type are considered for this
indicator. But in the subject of Pharmacy & Pharmaceutical Sciences, both "Article" and "Review" are
counted because only one journal in this subject was selected as Top journal and it mainly publishes reviews.
Award
Award refers to the total number of the staff of an institution wining a significant award in an Academic
Subject since 1981. Staff is defined as those who work full-time at an institution at the time of winning the
prize. If a researcher retired at the time of winning the award, we count the institution where the researcher’s
last full-time academic position was at. The significant awards in each subject are identified
through Shanghai Ranking’s Academic Excellence Survey.
If a winner is affiliated with more than one institution at the time of winning the award, each institution is
assigned the reciprocal of the number of institutions. If the award is awarded to more than one winner in one
year, weights are set for winners according to their proportion of the prize. Different weights are set
according to the periods of winning the prizes. The weight is 100% for winners in 2011-2018, 75% for
winners in 2001-2010, 50% for winners in 1991-2000, and 25% for winners in 1981-1990.
Nobel Prize in Physiology or Medicine is selected for Biological Sciences, Human Biological Sciences,
Clinical Medicine and Pharmacy & Pharmaceutical Sciences. Winners of this award are assigned to one or
more subjects according to the topics of their recognized contributions. If a contribution belongs to more than
one subject, the winner will be counted once for each relevant subject.
10
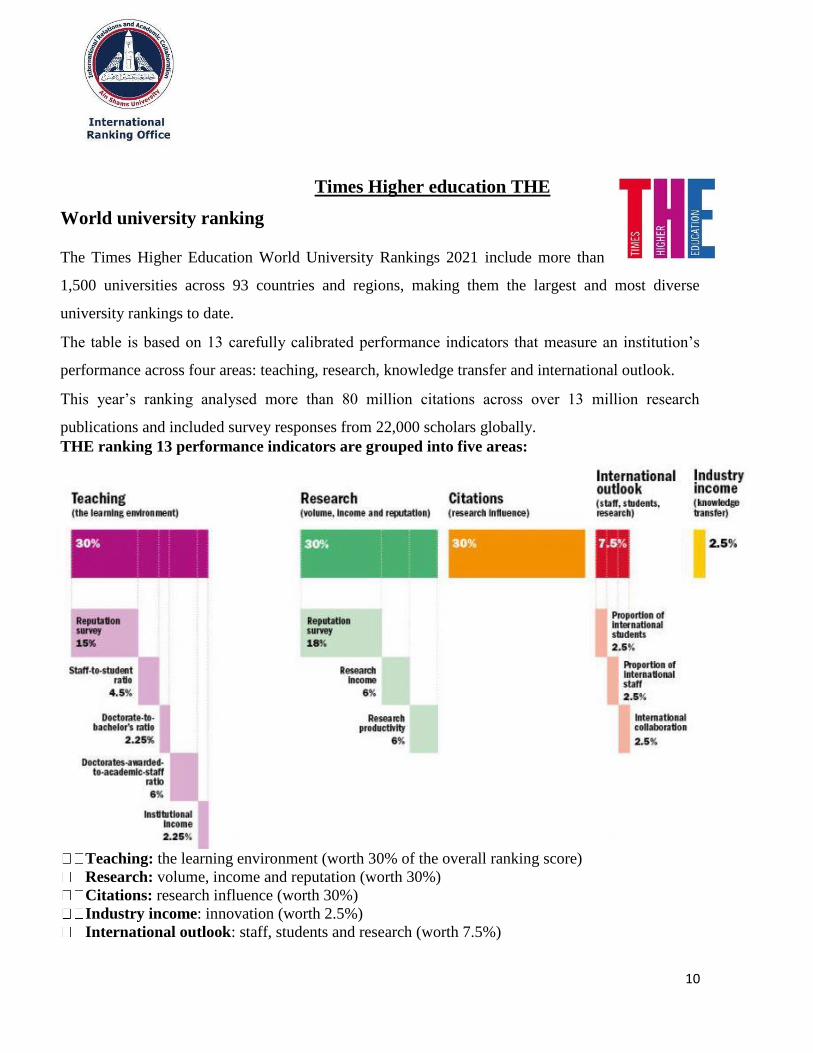
Times Higher education THE
World university ranking
The Times Higher Education World University Rankings 2021 include more than
1,500 universities across 93 countries and regions, making them the largest and most diverse
university rankings to date.
The table is based on 13 carefully calibrated performance indicators that measure an institution’s
performance across four areas: teaching, research, knowledge transfer and international outlook.
This year’s ranking analysed more than 80 million citations across over 13 million research
publications and included survey responses from 22,000 scholars globally.
THE ranking 13 performance indicators are grouped into five areas:
Teaching: the learning environment (worth 30% of the overall ranking score)
Research: volume, income and reputation (worth 30%)
Citations: research influence (worth 30%)
Industry income: innovation (worth 2.5%)
International outlook: staff, students and research (worth 7.5%)

11
Year Rank Overall teaching research citations Industry
income
International
outlook
2021 1001+ 10.3–25.0 22.6 10.5 37.7 34.6 36.2
2020 800-
1000 22.2–28.2 21.0 10.1 31.5 35.6 36.0
2019 1001+ 9.8–18.9 17.6 8.7 17.4 35.5 36.1
2018 800-
1000 15.6–21.4 21.1 8.2 13.5 33.0 34.9
THE subject ranking indicators for ASU
Clinical, preclinical &health
Ran
k
Overa
ll
Cita
tion
s
Ind
ustry
inco
me
Intern
atio
na
l ou
tlook
Resea
rch
Tea
chin
g
2021 176-200 42.5–44.0 50.4 41.4 45.3 27.4 47.4
2020 251-300 36.4–38.8 45.8 41.7 42.3 24.4 37.8
THE Subjects 2020 2021
Clinical, Preclinical and health 251-300 176-200
Engineering and technology 601-800 801-1000
Life science 601+ 601-800
Computer science 501-600 601-800
12
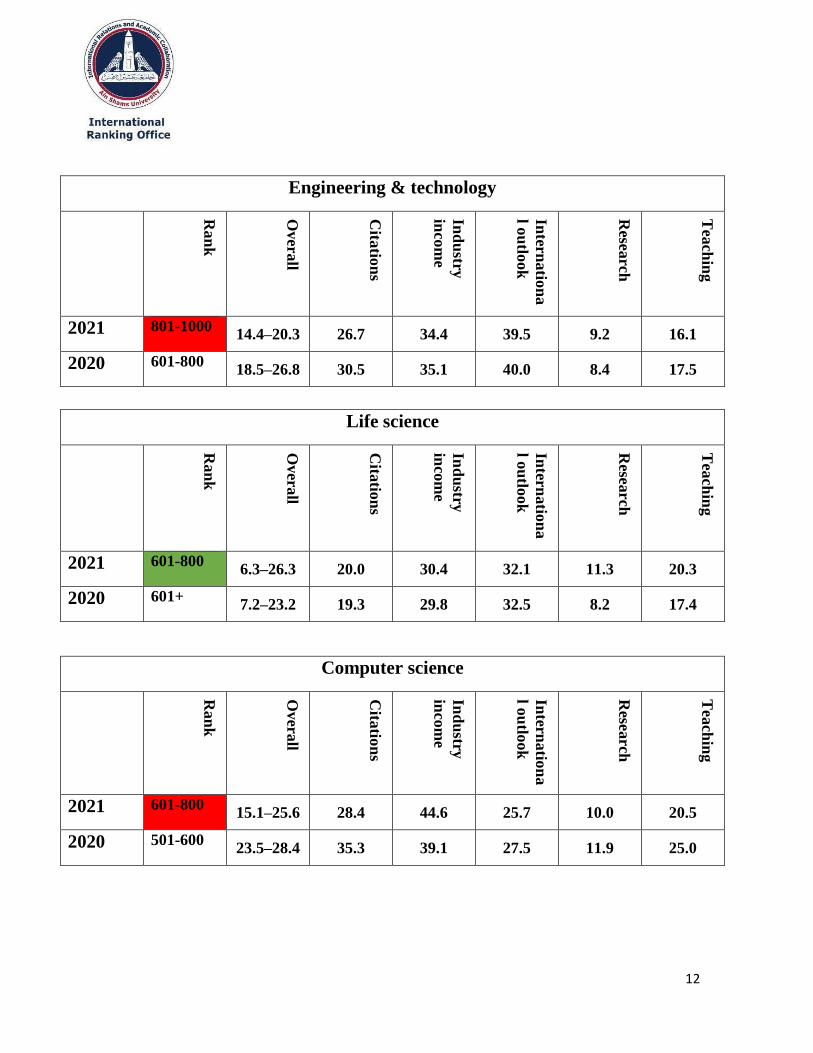
Engineering & technology
Ran
k
Overa
ll
Cita
tion
s
Ind
ustry
inco
me
Intern
atio
na
l ou
tlook
Resea
rch
Tea
chin
g
2021 801-1000 14.4–20.3 26.7 34.4 39.5 9.2 16.1
2020 601-800 18.5–26.8 30.5 35.1 40.0 8.4 17.5
Life science
Ran
k
Overa
ll
Cita
tion
s
Ind
ustry
inco
me
Intern
atio
na
l ou
tlook
Resea
rch
Tea
chin
g
2021 601-800 6.3–26.3 20.0 30.4 32.1 11.3 20.3
2020 601+ 7.2–23.2 19.3 29.8 32.5 8.2 17.4
Computer science
Ran
k
Overa
ll
Cita
tion
s
Ind
ustry
inco
me
Intern
atio
na
l ou
tlook
Resea
rch
Tea
chin
g
2021 601-800 15.1–25.6 28.4 44.6 25.7 10.0 20.5
2020 501-600 23.5–28.4 35.3 39.1 27.5 11.9 25.0

13
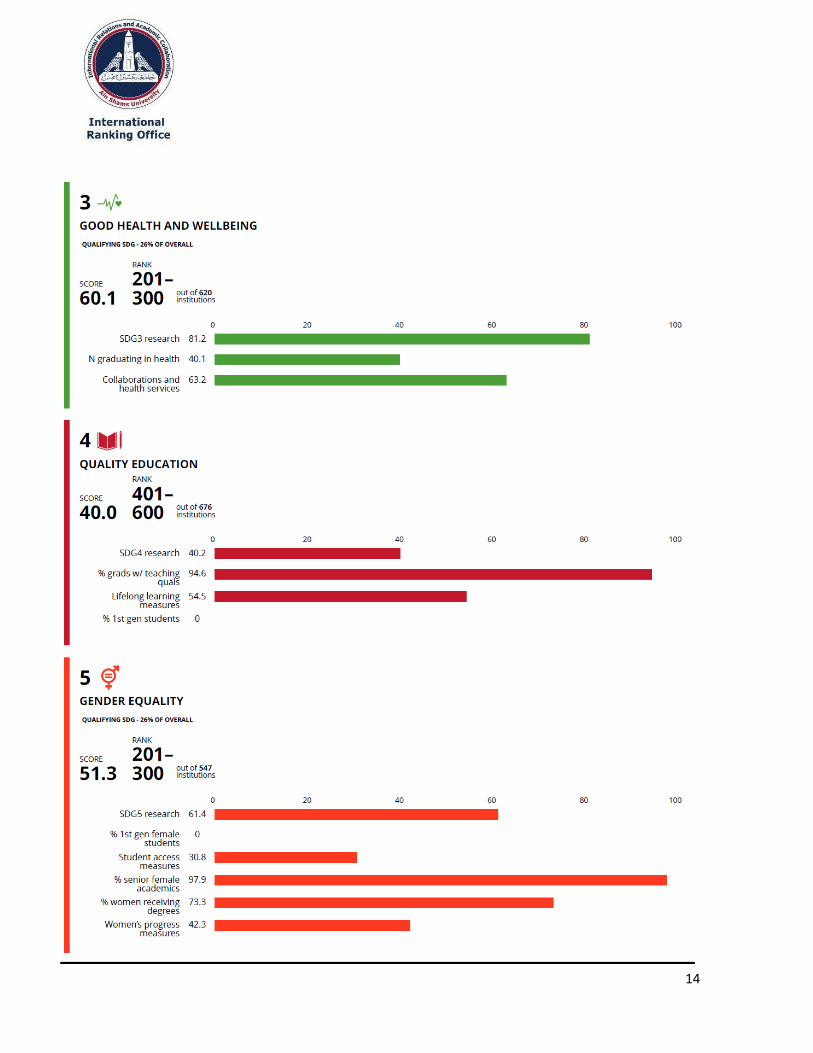
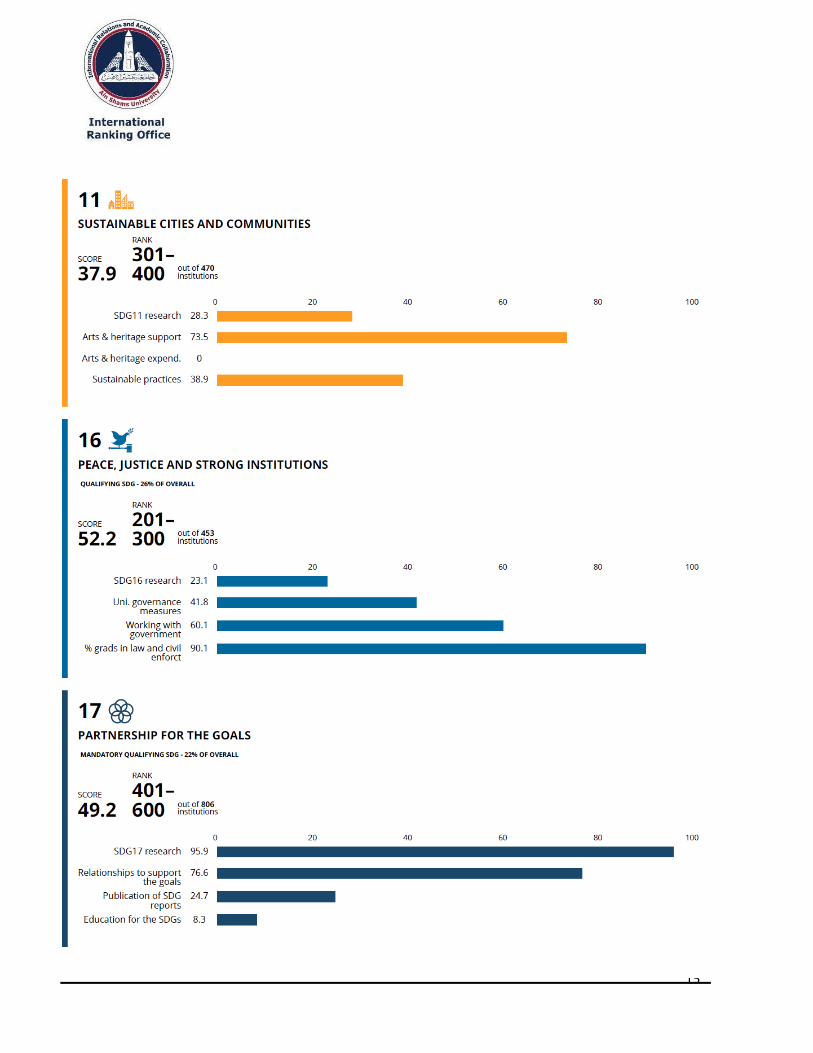
THE impact ranking
The Times Higher Education Impact Rankings are the only global performance tables
that assess universities against the United Nations’ Sustainable Development Goals
(SDGs). THE use carefully calibrated indicators to provide comprehensive and
balanced comparisons across three broad areas: research, outreach and stewardship.
This second edition includes 768 universities from 85 countries.
2020
2019
14
15
16
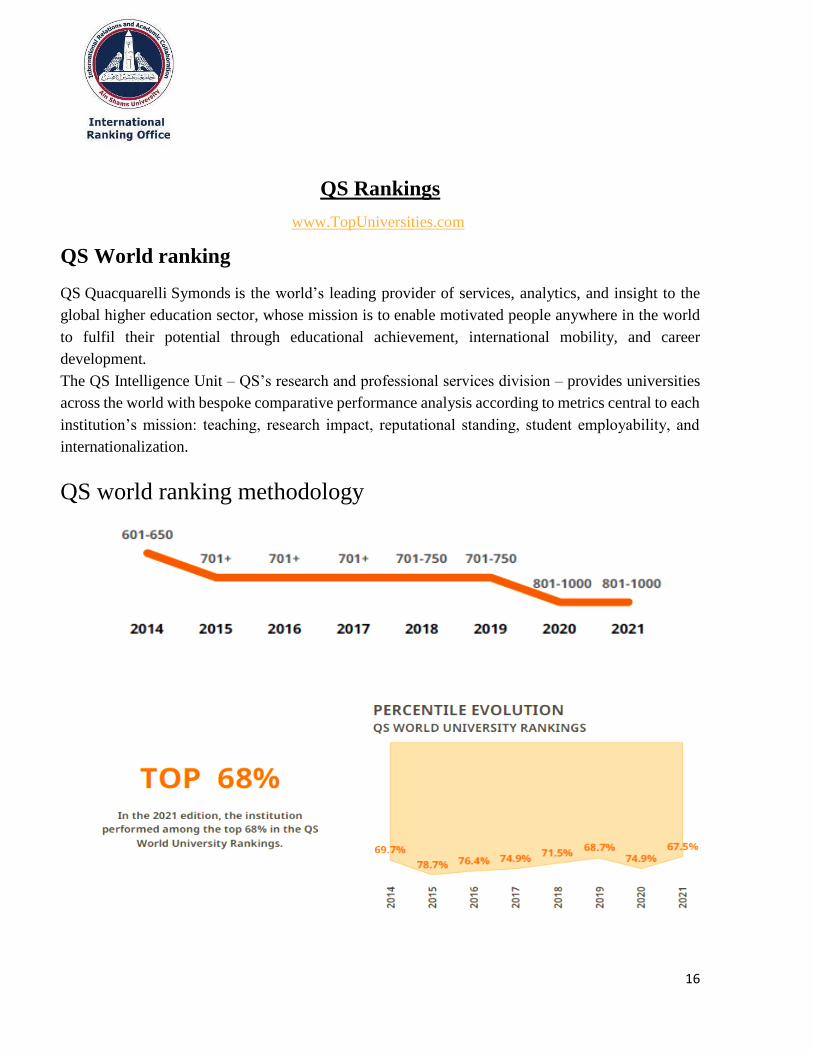
QS Rankings
www.TopUniversities.com
QS World ranking
QS Quacquarelli Symonds is the world’s leading provider of services, analytics, and insight to the
global higher education sector, whose mission is to enable motivated people anywhere in the world
to fulfil their potential through educational achievement, international mobility, and career
development.
The QS Intelligence Unit – QS’s research and professional services division – provides universities
across the world with bespoke comparative performance analysis according to metrics central to each
institution’s mission: teaching, research impact, reputational standing, student employability, and
internationalization.
QS world ranking methodology
17
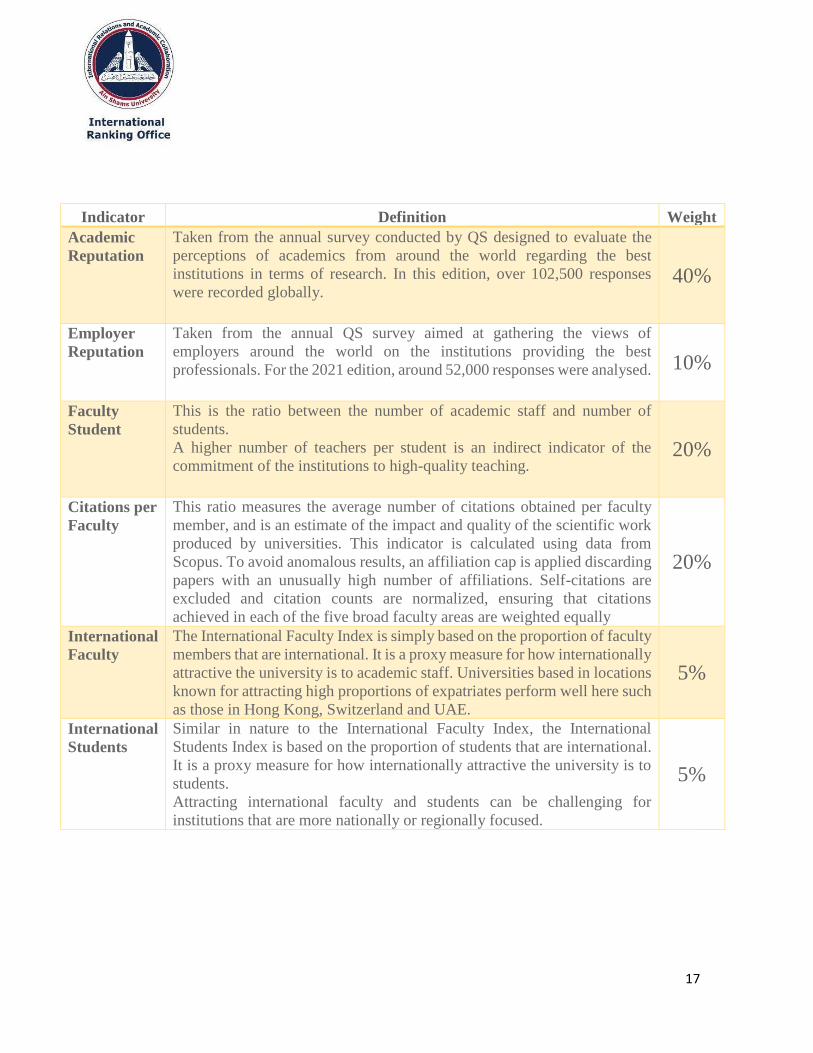
Indicator Definition Weight
Academic
Reputation
Taken from the annual survey conducted by QS designed to evaluate the
perceptions of academics from around the world regarding the best
institutions in terms of research. In this edition, over 102,500 responses
were recorded globally.
40%
Employer
Reputation
Taken from the annual QS survey aimed at gathering the views of
employers around the world on the institutions providing the best
professionals. For the 2021 edition, around 52,000 responses were analysed.
10%
Faculty
Student
This is the ratio between the number of academic staff and number of
students.
A higher number of teachers per student is an indirect indicator of the
commitment of the institutions to high-quality teaching.
20%
Citations per
Faculty
This ratio measures the average number of citations obtained per faculty
member, and is an estimate of the impact and quality of the scientific work
produced by universities. This indicator is calculated using data from
Scopus. To avoid anomalous results, an affiliation cap is applied discarding
papers with an unusually high number of affiliations. Self-citations are
excluded and citation counts are normalized, ensuring that citations
achieved in each of the five broad faculty areas are weighted equally
20%
International
Faculty
The International Faculty Index is simply based on the proportion of faculty
members that are international. It is a proxy measure for how internationally
attractive the university is to academic staff. Universities based in locations
known for attracting high proportions of expatriates perform well here such
as those in Hong Kong, Switzerland and UAE.
5%
International
Students
Similar in nature to the International Faculty Index, the International
Students Index is based on the proportion of students that are international.
It is a proxy measure for how internationally attractive the university is to
students.
Attracting international faculty and students can be challenging for
institutions that are more nationally or regionally focused.
5%

18
Ain shams scores by indicator
Overall 12.6
Academic Reputation 16.8
Employer Reputation 19.7
Faculty Student 11.4
Citations per Faculty 2.3
International Faculty 18.3
International Students 3.1
Ain Shams verified data
Students
204935
International Students
5774
Faculty Staff
12396
International Faculty
1231
Citations (Normalized) 58156
Citations (Excluding Self-Citations) 44594
Citations (Including Self-Citations) 58039
Papers 9625
The figures above are full-time equivalent (FTE). In those cases where only the headcounts were available,
the FTE was calculated by applying a ratio based on country or regional average.
Papers period: 2014-2018 | Citations period: 2014-2019

19

20
QS Arab Ranking

21
22
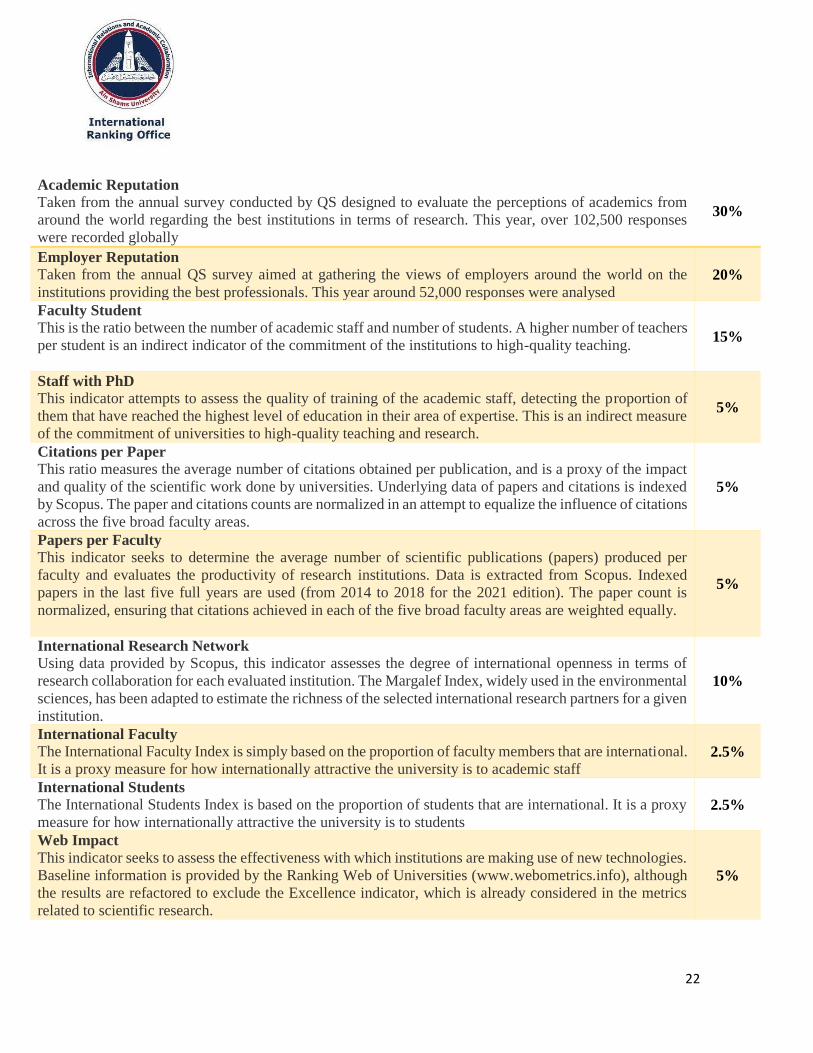
Academic Reputation
Taken from the annual survey conducted by QS designed to evaluate the perceptions of academics from
around the world regarding the best institutions in terms of research. This year, over 102,500 responses
were recorded globally
30%
Employer Reputation
Taken from the annual QS survey aimed at gathering the views of employers around the world on the
institutions providing the best professionals. This year around 52,000 responses were analysed
20%
Faculty Student
This is the ratio between the number of academic staff and number of students. A higher number of teachers
per student is an indirect indicator of the commitment of the institutions to high-quality teaching.
15%
Staff with PhD
This indicator attempts to assess the quality of training of the academic staff, detecting the proportion of
them that have reached the highest level of education in their area of expertise. This is an indirect measure
of the commitment of universities to high-quality teaching and research.
5%
Citations per Paper
This ratio measures the average number of citations obtained per publication, and is a proxy of the impact
and quality of the scientific work done by universities. Underlying data of papers and citations is indexed
by Scopus. The paper and citations counts are normalized in an attempt to equalize the influence of citations
across the five broad faculty areas.
5%
Papers per Faculty
This indicator seeks to determine the average number of scientific publications (papers) produced per
faculty and evaluates the productivity of research institutions. Data is extracted from Scopus. Indexed
papers in the last five full years are used (from 2014 to 2018 for the 2021 edition). The paper count is
normalized, ensuring that citations achieved in each of the five broad faculty areas are weighted equally.
5%
International Research Network
Using data provided by Scopus, this indicator assesses the degree of international openness in terms of
research collaboration for each evaluated institution. The Margalef Index, widely used in the environmental
sciences, has been adapted to estimate the richness of the selected international research partners for a given
institution.
10%
International Faculty
The International Faculty Index is simply based on the proportion of faculty members that are international.
It is a proxy measure for how internationally attractive the university is to academic staff 2.5%
International Students
The International Students Index is based on the proportion of students that are international. It is a proxy
measure for how internationally attractive the university is to students 2.5%
Web Impact
This indicator seeks to assess the effectiveness with which institutions are making use of new technologies.
Baseline information is provided by the Ranking Web of Universities (www.webometrics.info), although
the results are refactored to exclude the Excellence indicator, which is already considered in the metrics
related to scientific research.
5%

23
24
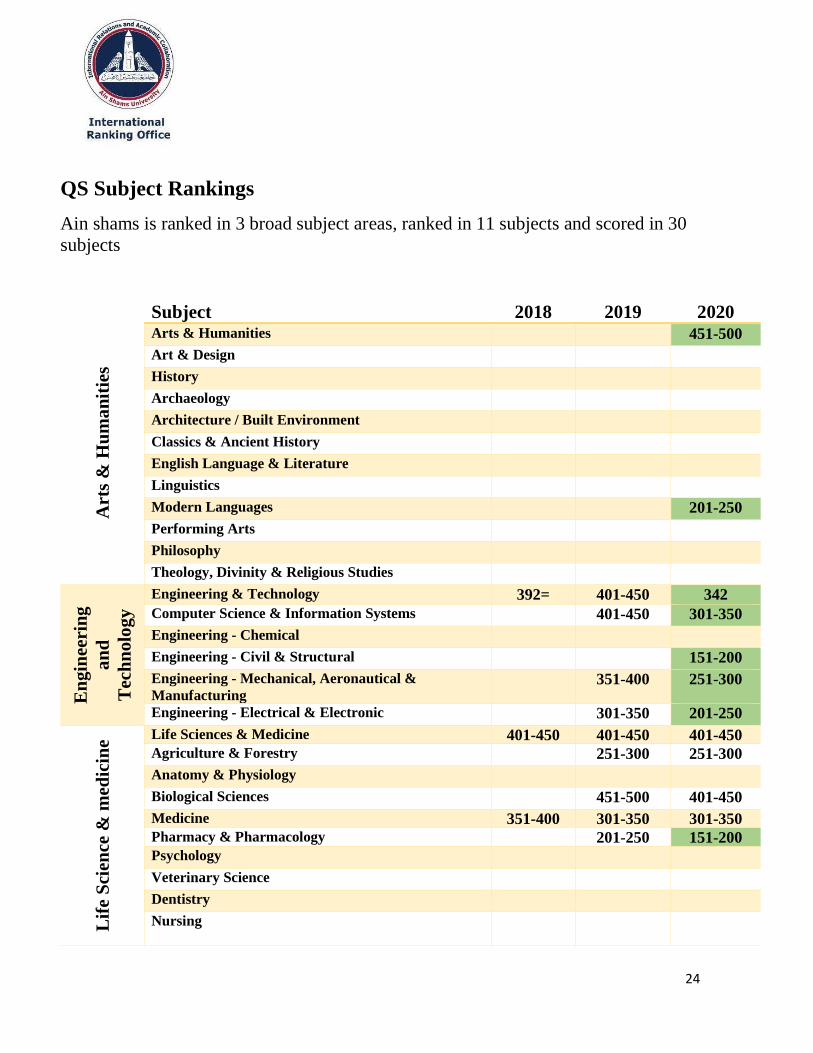
QS Subject Rankings
Ain shams is ranked in 3 broad subject areas, ranked in 11 subjects and scored in 30
subjects
Art
s &
Hu
ma
nit
ies
Subject 2018 2019 2020 Arts & Humanities 451-500 Art & Design History Archaeology Architecture / Built Environment Classics & Ancient History English Language & Literature Linguistics Modern Languages 201-250 Performing Arts Philosophy Theology, Divinity & Religious Studies
En
gin
eeri
ng
an
d
Tec
hn
olo
gy
Engineering & Technology 392= 401-450 342
Computer Science & Information Systems 401-450 301-350
Engineering - Chemical Engineering - Civil & Structural 151-200
Engineering - Mechanical, Aeronautical &
Manufacturing 351-400 251-300
Engineering - Electrical & Electronic 301-350 201-250
Lif
e S
cien
ce &
med
icin
e
Life Sciences & Medicine 401-450 401-450 401-450 Agriculture & Forestry 251-300 251-300
Anatomy & Physiology Biological Sciences 451-500 401-450
Medicine 351-400 301-350 301-350 Pharmacy & Pharmacology 201-250 151-200 Psychology Veterinary Science Dentistry Nursing
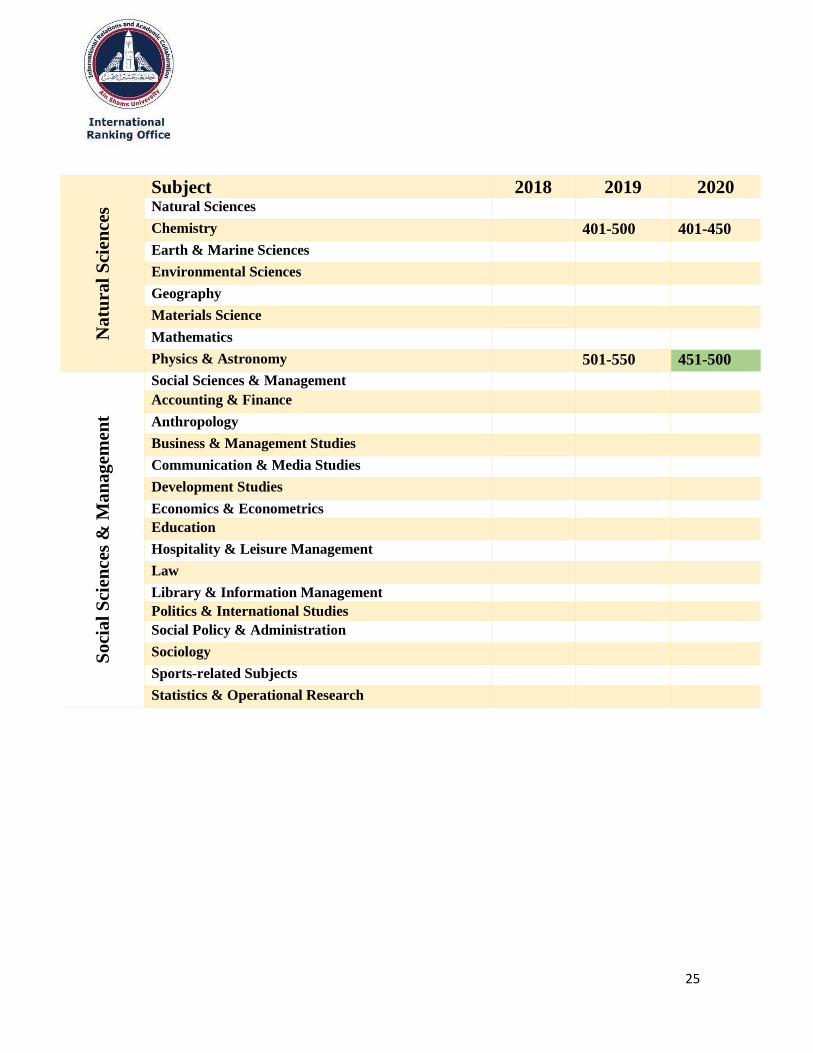
25
Natu
ral
Sci
ence
s
Subject 2018 2019 2020 Natural Sciences Chemistry 401-500 401-450
Earth & Marine Sciences
Environmental Sciences
Geography
Materials Science
Mathematics
Physics & Astronomy 501-550 451-500
So
cial
Sci
ence
s &
Ma
nag
emen
t
Social Sciences & Management
Accounting & Finance
Anthropology Business & Management Studies
Communication & Media Studies
Development Studies
Economics & Econometrics Education
Hospitality & Leisure Management Law
Library & Information Management Politics & International Studies Social Policy & Administration Sociology Sports-related Subjects Statistics & Operational Research

26
27
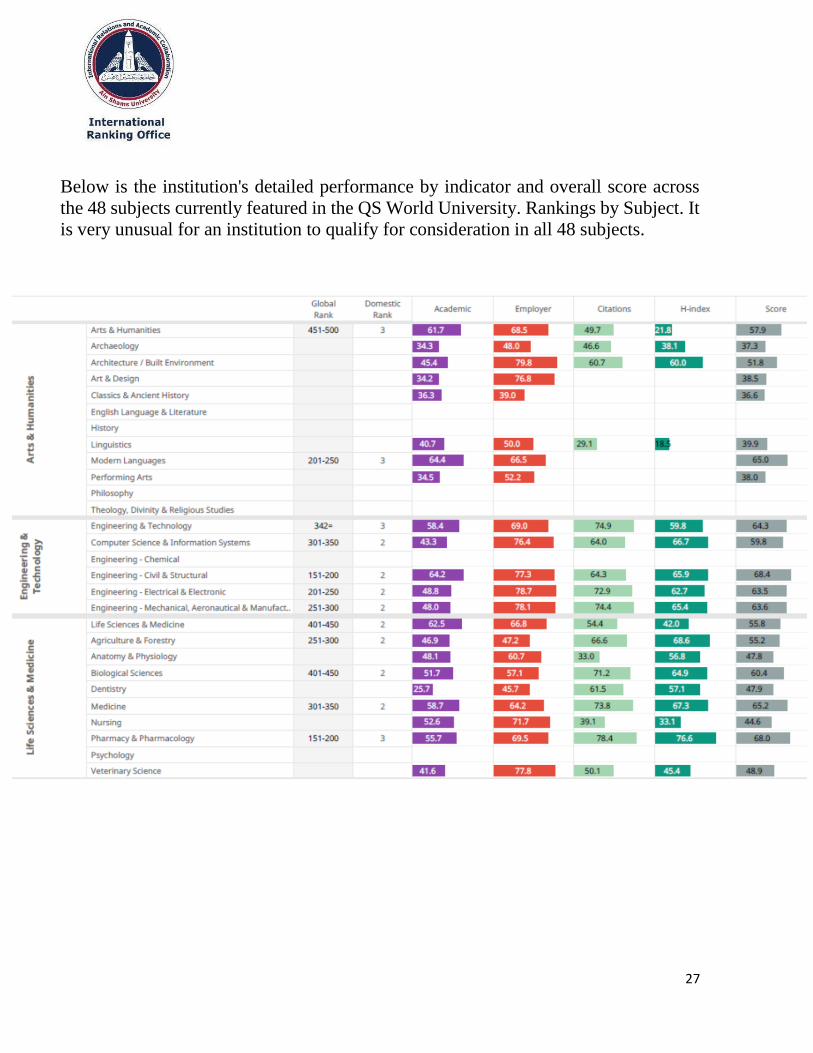
Below is the institution's detailed performance by indicator and overall score across
the 48 subjects currently featured in the QS World University. Rankings by Subject. It
is very unusual for an institution to qualify for consideration in all 48 subjects.

28
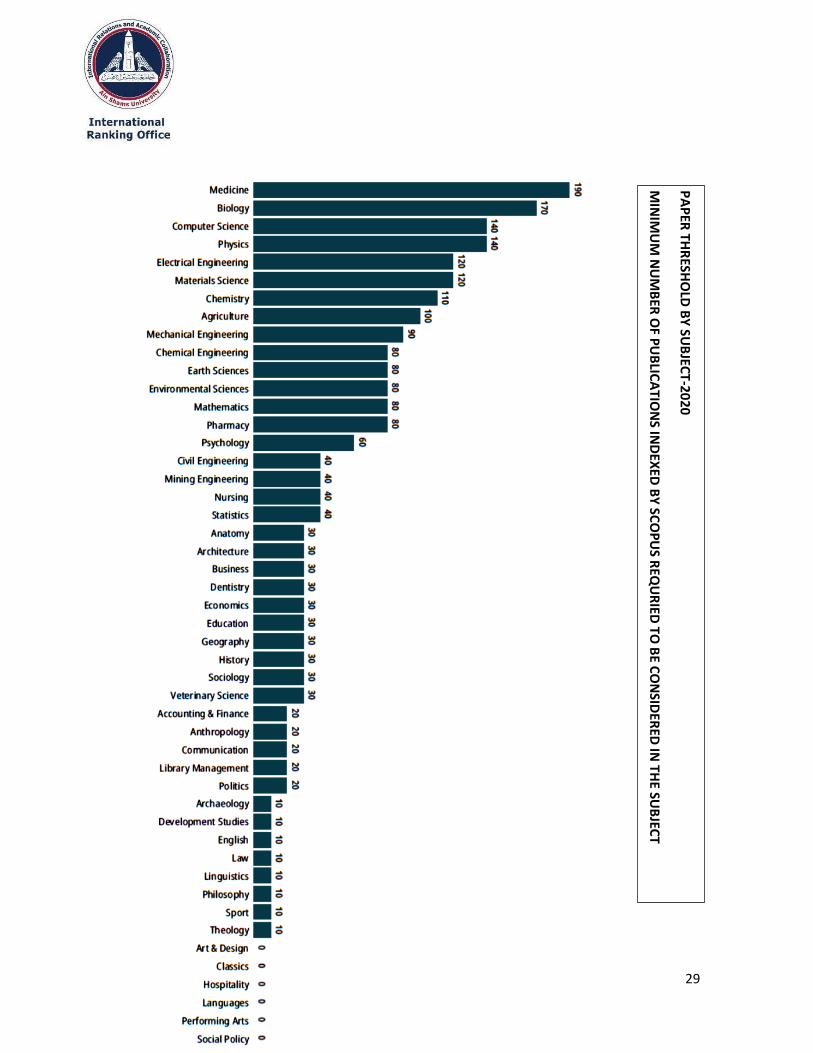
29
PA
PER
THR
ESHO
LD B
Y SU
BJEC
T-2
02
0
MIN
IMU
M N
UM
BER
OF P
UB
LICA
TION
S IND
EXED
BY
SCO
PU
S REQ
UR
IED TO
BE C
ON
SIDER
ED IN
THE SU
BJEC
T
RA
NK
ING
S

30
US News Ranking
The overall Best Global Universities rankings encompass nearly 1,500
top institutions spread across 86 countries, up from 81 countries last
year. The first step in producing these rankings, which are powered
by Clarivate, involved creating a pool of 1,748 universities that was used to
rank the top 1,500 schools.
To create the pool of 1,748, U.S. News first included the top 250 universities in the
results of Clarivate's global reputation survey, described further below. Next, U.S.
News added institutions that had met the minimum threshold of at least 1,250 papers
published in 2014 to 2018, down from 1,500 papers last year. The last step was to
remove duplicates and institutions that are not schools to reach the final 2021 ranking
pool of 1,748 institutions.
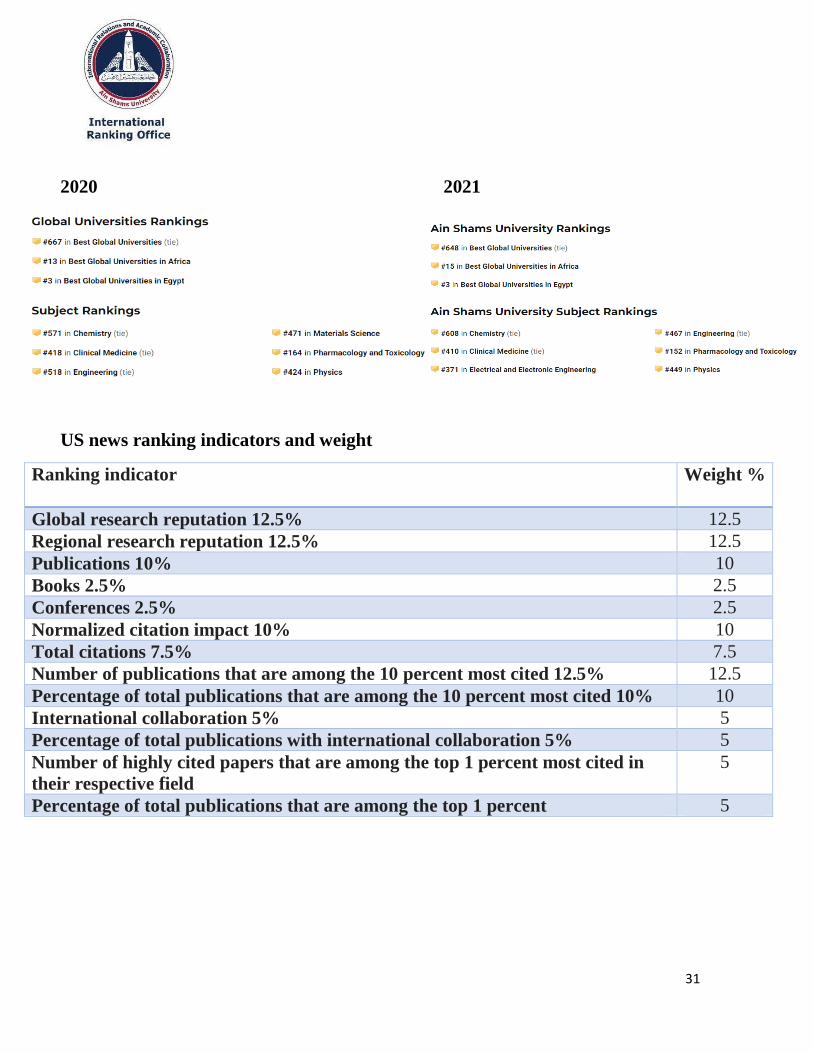
Ain shams University situation 2021 compared to 2020
2020 2021
overall 667 648
Africa 13 15
Egypt 3 3
Chemistry 571 608
Physics 424 449
Clinical medicine 418 410
Pharmacology 164 152
Engineering 518 467
Electrical and electronic engineering - 371
Materials science 471 -
31
2020 2021
US news ranking indicators and weight
Ranking indicator Weight %
Global research reputation 12.5% 12.5
Regional research reputation 12.5% 12.5
Publications 10% 10
Books 2.5% 2.5
Conferences 2.5% 2.5
Normalized citation impact 10% 10
Total citations 7.5% 7.5
Number of publications that are among the 10 percent most cited 12.5% 12.5
Percentage of total publications that are among the 10 percent most cited 10% 10
International collaboration 5% 5
Percentage of total publications with international collaboration 5% 5
Number of highly cited papers that are among the top 1 percent most cited in
their respective field
5
Percentage of total publications that are among the top 1 percent 5

32
Progress of Egyptian Universities in US news global university ranking
33
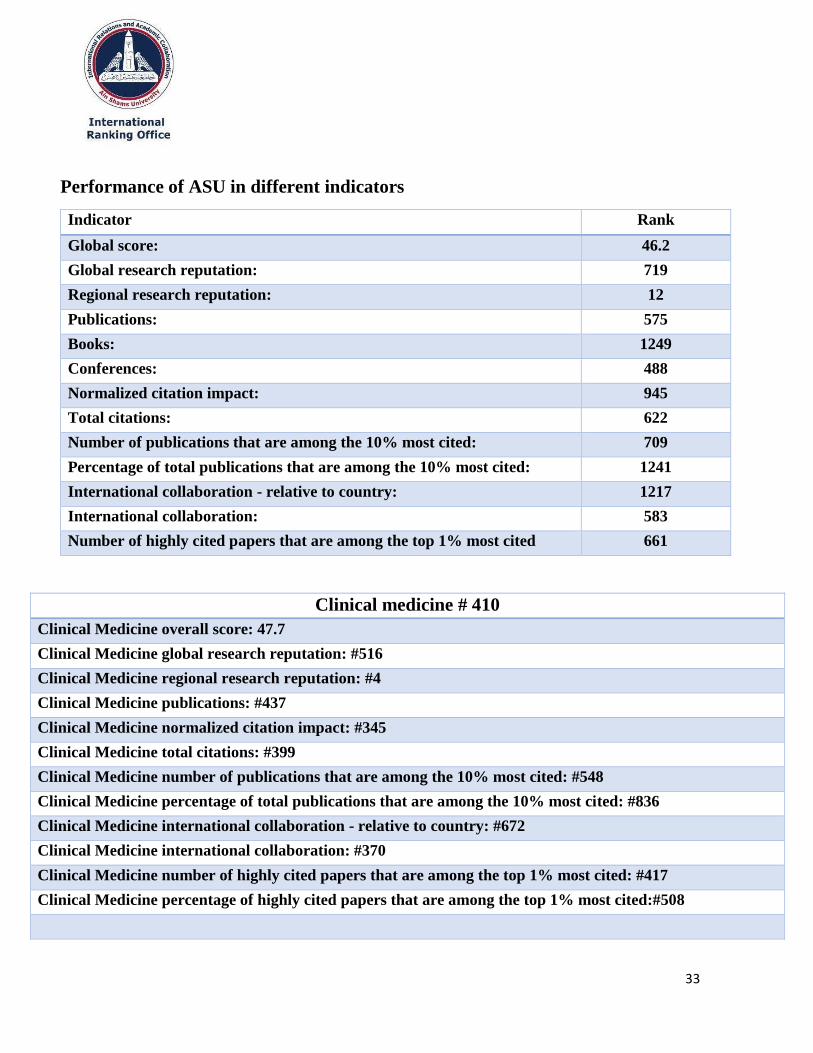
Performance of ASU in different indicators
Indicator Rank
Global score: 46.2
Global research reputation: 719
Regional research reputation: 12
Publications: 575
Books: 1249
Conferences: 488
Normalized citation impact: 945
Total citations: 622
Number of publications that are among the 10% most cited: 709
Percentage of total publications that are among the 10% most cited: 1241
International collaboration - relative to country: 1217
International collaboration: 583
Number of highly cited papers that are among the top 1% most cited 661
Clinical medicine # 410
Clinical Medicine overall score: 47.7
Clinical Medicine global research reputation: #516
Clinical Medicine regional research reputation: #4
Clinical Medicine publications: #437
Clinical Medicine normalized citation impact: #345
Clinical Medicine total citations: #399
Clinical Medicine number of publications that are among the 10% most cited: #548
Clinical Medicine percentage of total publications that are among the 10% most cited: #836
Clinical Medicine international collaboration - relative to country: #672
Clinical Medicine international collaboration: #370
Clinical Medicine number of highly cited papers that are among the top 1% most cited: #417
Clinical Medicine percentage of highly cited papers that are among the top 1% most cited:#508
34
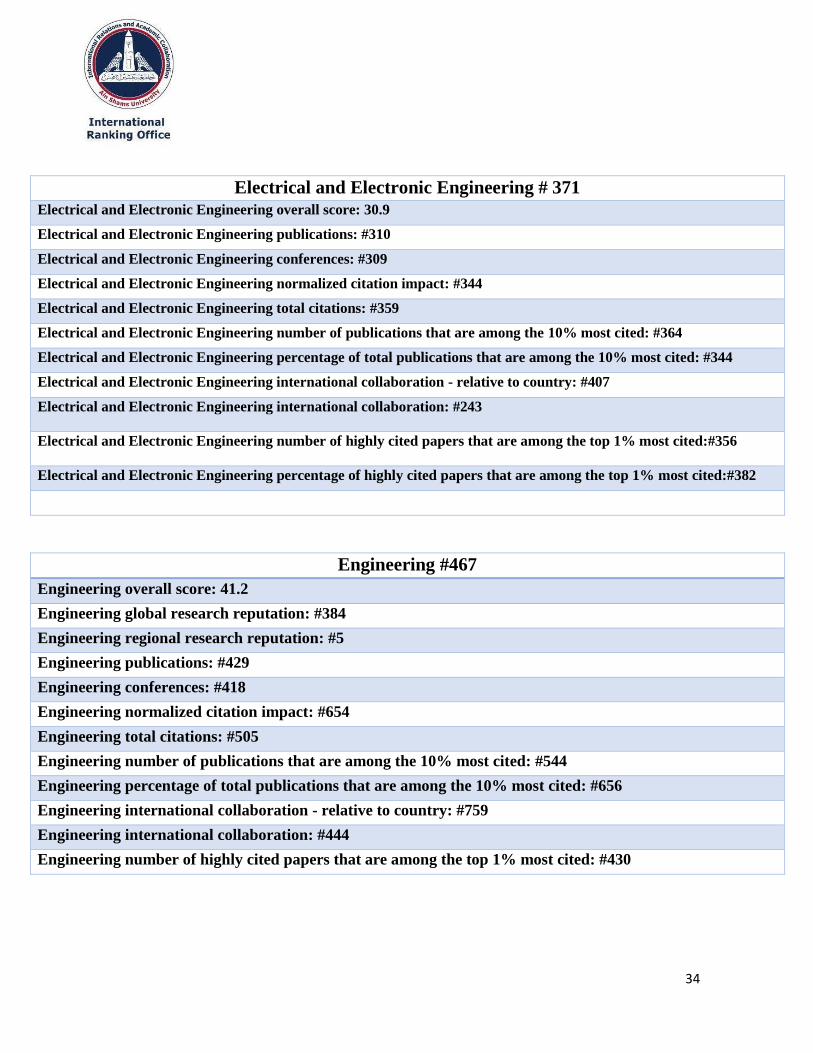
Electrical and Electronic Engineering # 371
Electrical and Electronic Engineering overall score: 30.9
Electrical and Electronic Engineering publications: #310
Electrical and Electronic Engineering conferences: #309
Electrical and Electronic Engineering normalized citation impact: #344
Electrical and Electronic Engineering total citations: #359
Electrical and Electronic Engineering number of publications that are among the 10% most cited: #364
Electrical and Electronic Engineering percentage of total publications that are among the 10% most cited: #344
Electrical and Electronic Engineering international collaboration - relative to country: #407
Electrical and Electronic Engineering international collaboration: #243
Electrical and Electronic Engineering number of highly cited papers that are among the top 1% most cited:#356
Electrical and Electronic Engineering percentage of highly cited papers that are among the top 1% most cited:#382
Engineering #467
Engineering overall score: 41.2
Engineering global research reputation: #384
Engineering regional research reputation: #5
Engineering publications: #429
Engineering conferences: #418
Engineering normalized citation impact: #654
Engineering total citations: #505
Engineering number of publications that are among the 10% most cited: #544
Engineering percentage of total publications that are among the 10% most cited: #656
Engineering international collaboration - relative to country: #759
Engineering international collaboration: #444
Engineering number of highly cited papers that are among the top 1% most cited: #430

35
Pharmacology and Toxicology #152
Pharmacology and Toxicology overall score: 44.4
Pharmacology and Toxicology global research reputation: #174
Pharmacology and Toxicology regional research reputation: #2
Pharmacology and Toxicology publications: #171
Pharmacology and Toxicology normalized citation impact: #194
Pharmacology and Toxicology total citations: #183
Pharmacology and Toxicology number of publications that are among the 10% most cited: #176
Pharmacology and Toxicology percentage of total publications that are among the 10% most cited: #172
harmacology and Toxicology international collaboration - relative to country: #174
Pharmacology and Toxicology international collaboration: #89
Pharmacology and Toxicology number of highly cited papers that are among the top 1%most cited: #255
Pharmacology and Toxicology percentage of highly cited papers that are among the top 1% most cited: #278
Physics #449
Physics overall score: 47.7
Physics global research reputation: #455
Physics regional research reputation: #10
Physics publications: #394
Physics normalized citation impact: #433
Physics total citations: #455
Physics number of publications that are among the 10% most cited: #419
Physics percentage of total publications that are among the 10% most cited: #402
Physics international collaboration - relative to country: #486
Physics international collaboration: #460
Physics number of highly cited papers that are among the top 1% most cited: #416
Physics percentage of highly cited papers that are among the top 1% most cited: #415
36
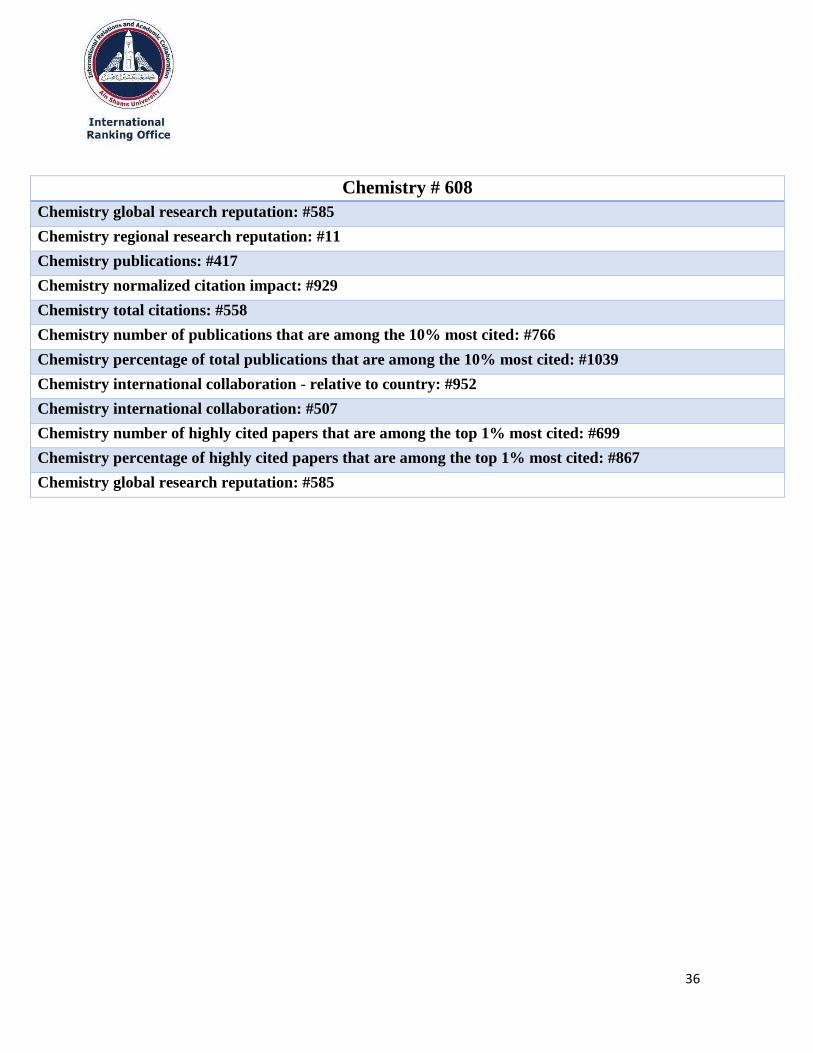
Chemistry # 608
Chemistry global research reputation: #585
Chemistry regional research reputation: #11
Chemistry publications: #417
Chemistry normalized citation impact: #929
Chemistry total citations: #558
Chemistry number of publications that are among the 10% most cited: #766
Chemistry percentage of total publications that are among the 10% most cited: #1039
Chemistry international collaboration - relative to country: #952
Chemistry international collaboration: #507
Chemistry number of highly cited papers that are among the top 1% most cited: #699
Chemistry percentage of highly cited papers that are among the top 1% most cited: #867
Chemistry global research reputation: #585
37
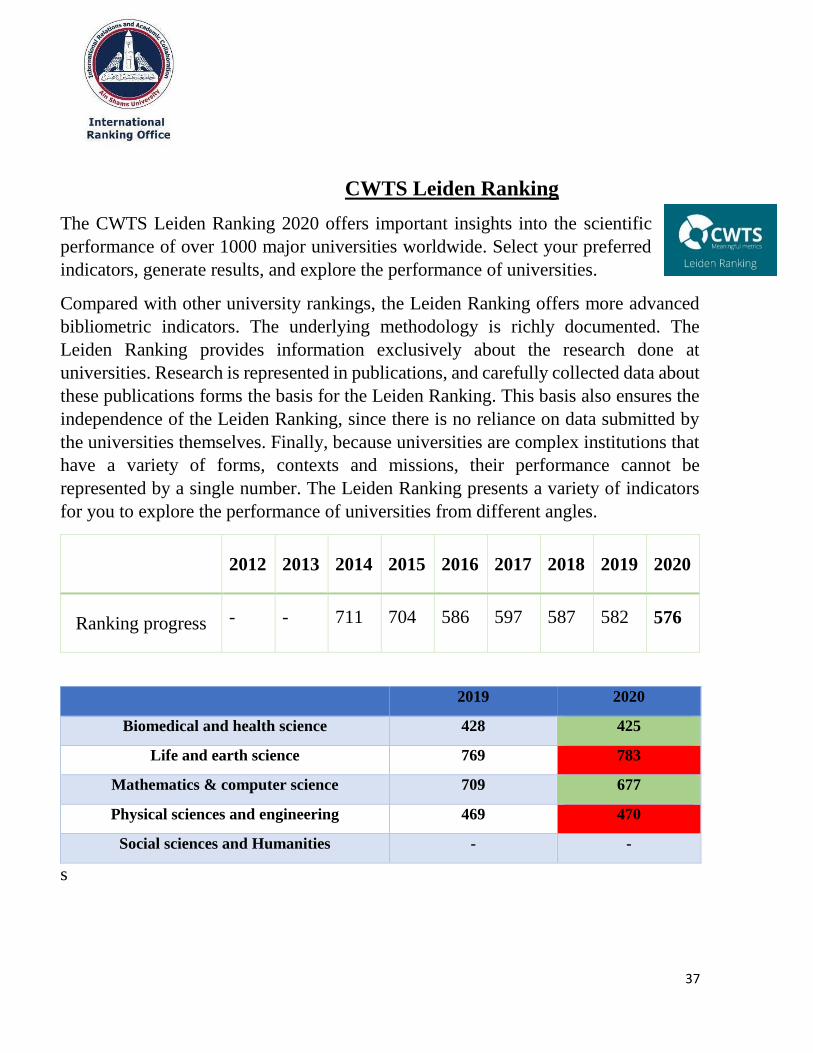
CWTS Leiden Ranking
The CWTS Leiden Ranking 2020 offers important insights into the scientific
performance of over 1000 major universities worldwide. Select your preferred
indicators, generate results, and explore the performance of universities.
Compared with other university rankings, the Leiden Ranking offers more advanced
bibliometric indicators. The underlying methodology is richly documented. The
Leiden Ranking provides information exclusively about the research done at
universities. Research is represented in publications, and carefully collected data about
these publications forms the basis for the Leiden Ranking. This basis also ensures the
independence of the Leiden Ranking, since there is no reliance on data submitted by
the universities themselves. Finally, because universities are complex institutions that
have a variety of forms, contexts and missions, their performance cannot be
represented by a single number. The Leiden Ranking presents a variety of indicators
for you to explore the performance of universities from different angles.
2020 2019 2018 2017 2016 2015 2014 2013 2012
576 582 587 597 586 704 711 - - Ranking progress
2019 2020
Biomedical and health science 428 425
Life and earth science 769 783
Mathematics & computer science 709 677
Physical sciences and engineering 469 470
Social sciences and Humanities - -
s
38
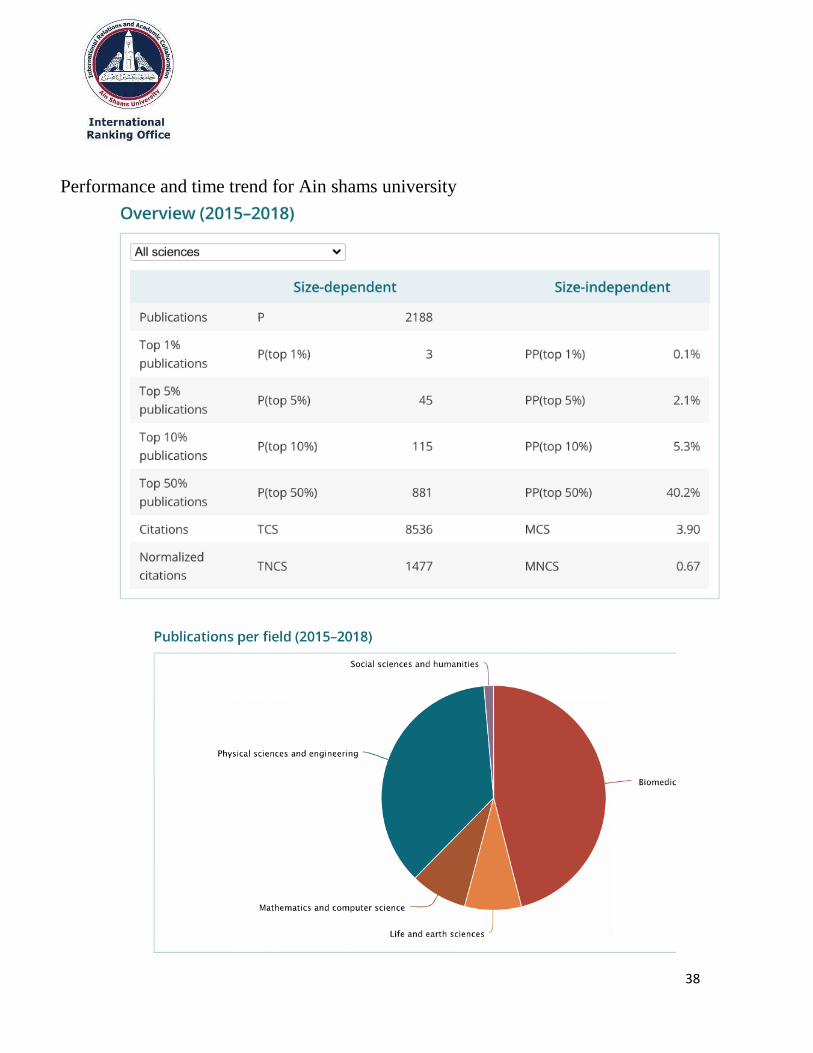
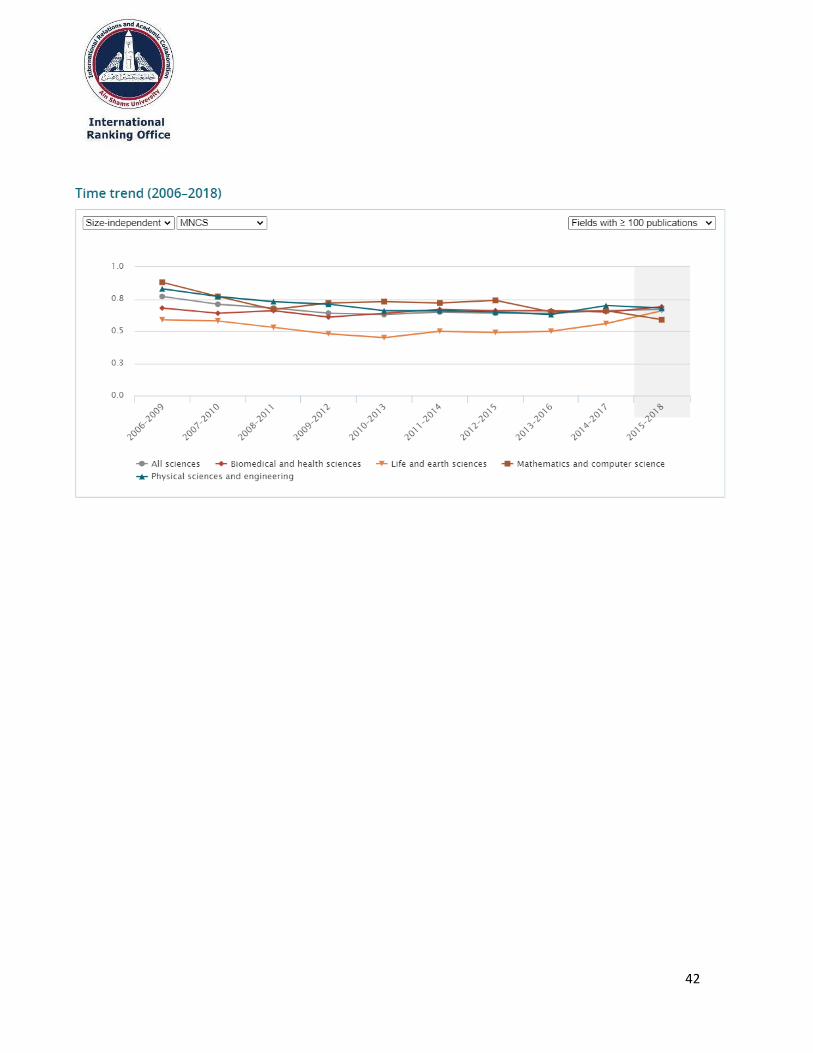
Performance and time trend for Ain shams university

39

40

41
42
43
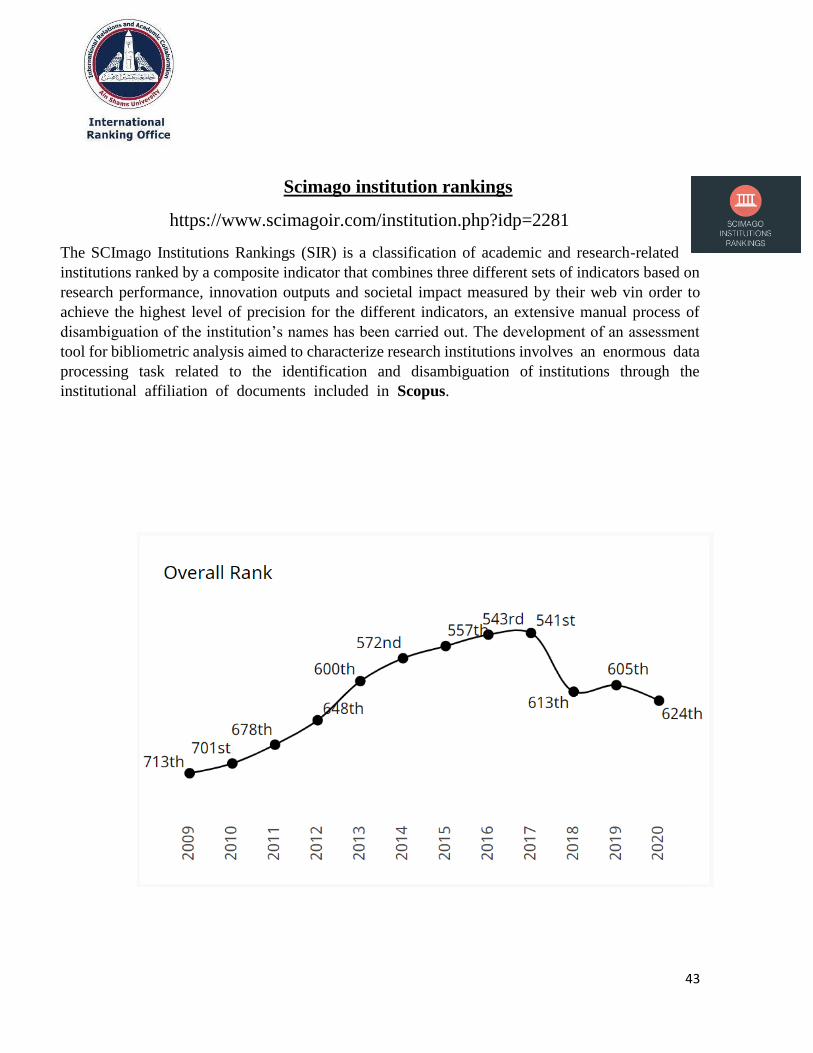
Scimago institution rankings
https://www.scimagoir.com/institution.php?idp=2281
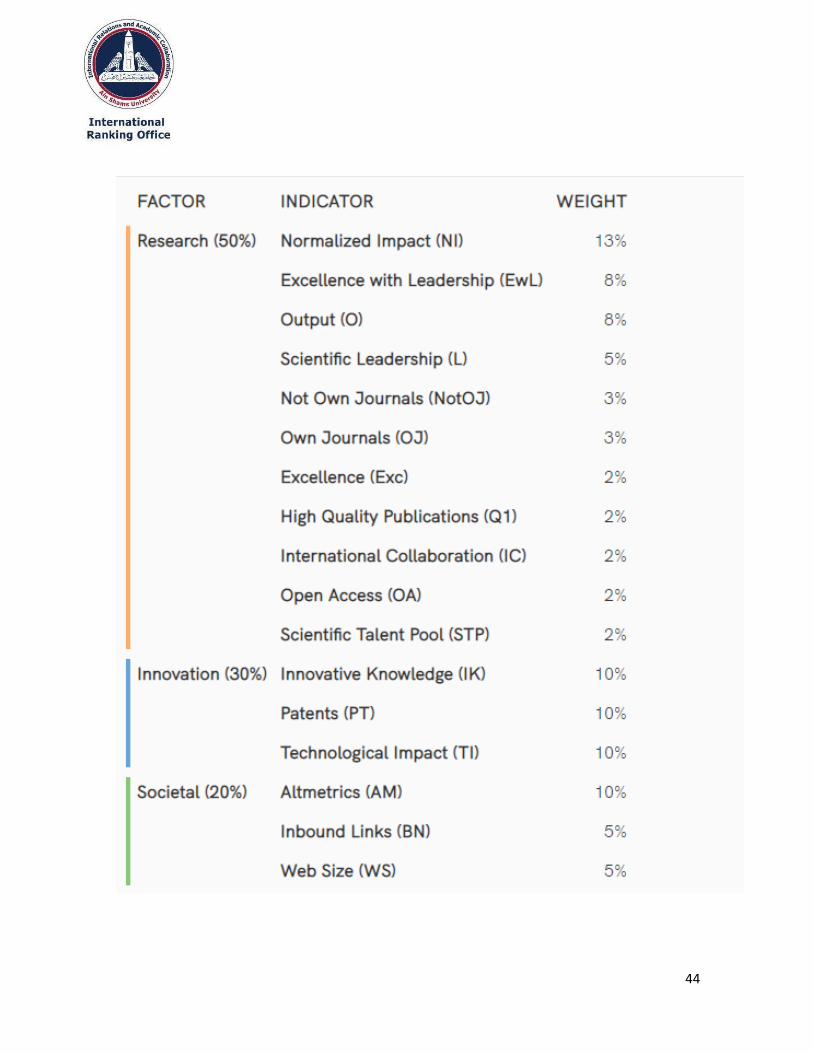
The SCImago Institutions Rankings (SIR) is a classification of academic and research-related
institutions ranked by a composite indicator that combines three different sets of indicators based on
research performance, innovation outputs and societal impact measured by their web vin order to
achieve the highest level of precision for the different indicators, an extensive manual process of
disambiguation of the institution’s names has been carried out. The development of an assessment
tool for bibliometric analysis aimed to characterize research institutions involves an enormous data
processing task related to the identification and disambiguation of institutions through the
institutional affiliation of documents included in Scopus.
44

45

46

47
The Center for World University Rankings (CWUR)
The Center for World University Rankings (CWUR) is a leading consulting organization
providing policy advice, strategic insights, and consulting services to governments and
universities to improve educational and research outcomes.
Since 2012, CWUR has been publishing the only academic ranking of global universities that
assesses the quality of education, alumni employment, research output, and citations without relying
on surveys and university data submissions. The ranking started out as a project in Jeddah, Saudi
Arabia with the aim of rating the top 100 world universities. It was quickly reported worldwide by
universities and the media and many requests were received to expand it. In 2019, the ranking
expanded to list the top 2000 out of twenty thousand universities worldwide, making it the largest
academic ranking of global universities.
2020 2019 2018 2017 2016 2015 2014 2013 2012
794 793 715 943 960 965 965 - -
CWUR uses seven objective and robust indicators to rank the world's universities:
1) Quality of Education, measured by the number of a university's alumni who have won major academic
distinctions relative to the university's size (25%)
2) Alumni Employment, measured by the number of a university's alumni who have held top executive
positions at the world's largest companies relative to the university's size (25%)
3) Quality of Faculty, measured by the number of faculty members who have won major academic
distinctions (10%)
4) Research Performance:
i) Research Output, measured by the the total number of research papers (10%)
ii) High-Quality Publications, measured by the number of research papers appearing in top-tier journals (10%)
iii) Influence, measured by the number of research papers appearing in highly-influential journals (10%)
iv) Citations, measured by the number of highly-cited research papers (10%)

48

49
University ranking by academic performance
World Ranking Indicators URAP 2019-2020 World Ranking is based on 6 academic performance indicators. Since URAP is an
academic performance based ranking, publications constitute the basis of the ranking methodology.
Both quality and quantity of publications and international research collaboration performance are
used as indicators. The indicators, the data sources, and the duration of coverage are summarized in
the table below.
Indicator Objective Coverage Source
Article Current Scientific Productivity 2018 InCites
Citation Research Impact 2014-2018 InCites
Total Document Scientific Productivity 2014-2018
InCites
Article Impact Total Research Quality 2014-2018
InCites
Citation Impact Total Research Quality 2014-2018
InCites
International Collaboration International Acceptance 2014-2018
InCites
Progress of ASU in different indicators of URAP
World
rank Article Citation
Total
Document AIT CIT Collaboration Total
2020 637 59.68 66.25 30.77 46.72 52.33 41.42 297.17
2019 660 55.27 56.18 28.11 48.69 36.74 44.73 269.72
2018 631 66.91 64.23 31.56 56.09 45.87 47.20 311.86
2017 622 66.71 64.14 31.22 56.22 46.06 47.22 311.57
Top Related