


Languages
Pages
Legal

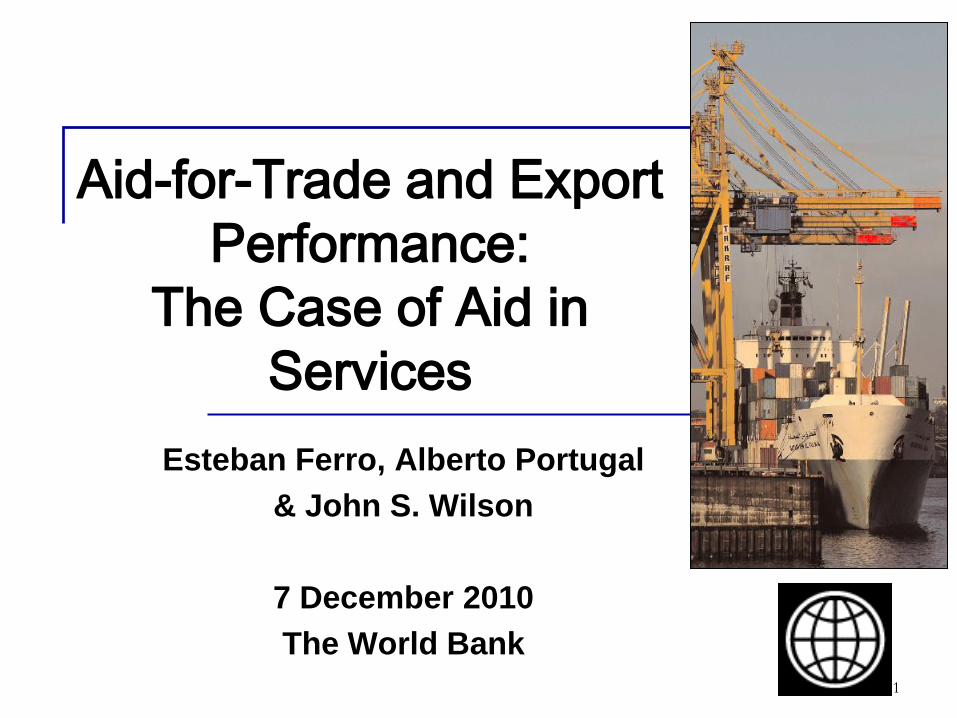
Aid-for-Trade and Export
Performance:
The Case of Aid in
Services
Esteban Ferro, Alberto Portugal
& John S. Wilson
7 December 2010
The World Bank
1
2
Outline
1. Motivation
2. Literature review
3. Identification strategy.
4. Data and Results
5. Final Remarks
2
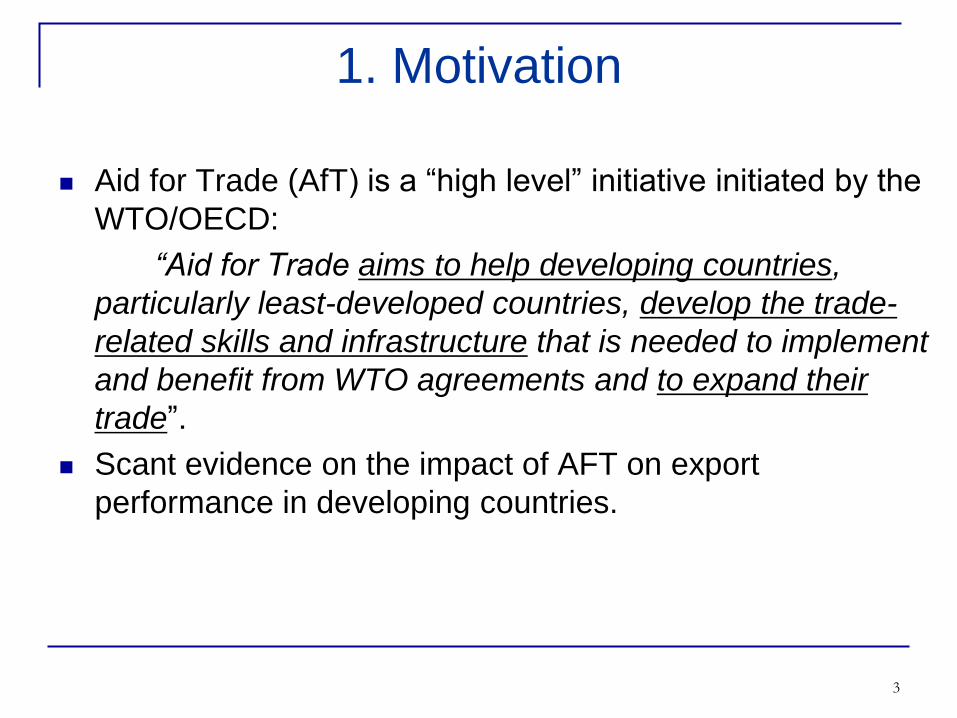
1. Motivation
Aid for Trade (AfT) is a “high level” initiative initiated by the
WTO/OECD:
“Aid for Trade aims to help developing countries,
particularly least-developed countries, develop the trade-
related skills and infrastructure that is needed to implement
and benefit from WTO agreements and to expand their
trade”.
Scant evidence on the impact of AFT on export
performance in developing countries.
3
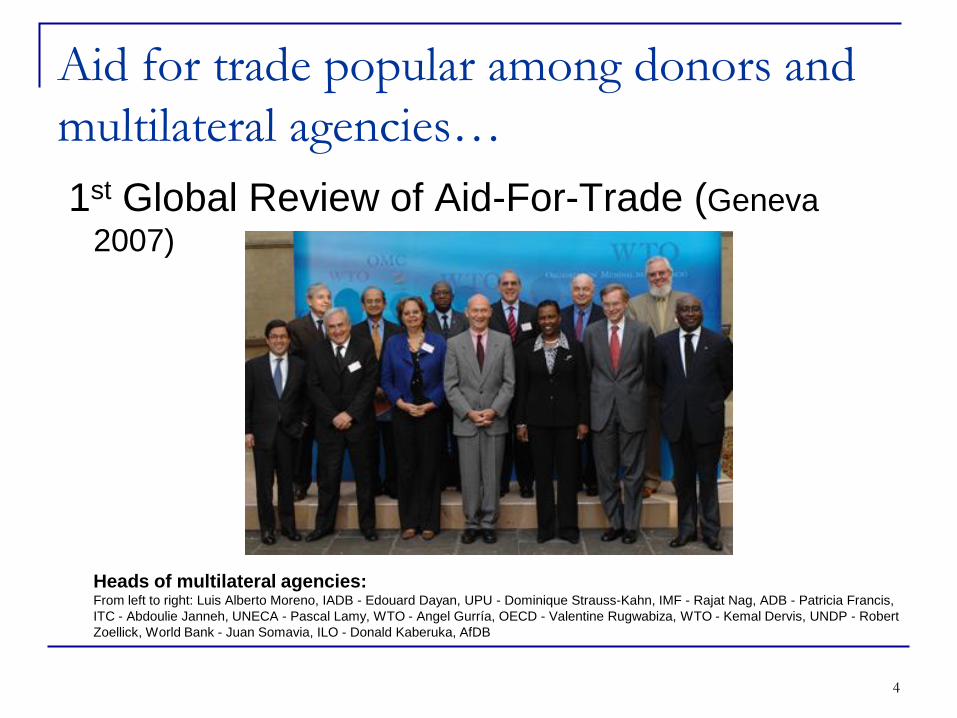
Aid for trade popular among donors and
multilateral agencies…
1st Global Review of Aid-For-Trade (Geneva
2007)
Heads of multilateral agencies:From left to right: Luis Alberto Moreno, IADB - Edouard Dayan, UPU - Dominique Strauss-Kahn, IMF - Rajat Nag, ADB - Patricia Francis,
ITC - Abdoulie Janneh, UNECA - Pascal Lamy, WTO - Angel Gurría, OECD - Valentine Rugwabiza, WTO - Kemal Dervis, UNDP - Robert
Zoellick, World Bank - Juan Somavia, ILO - Donald Kaberuka, AfDB
4

AFT through Time
5
0
5,0
00
10,0
00
15,0
00
20,0
00
25,0
00
199019
9119
921993
19941995
1996
1997
19981999
2000
2001
2002
20032004
200520
0620
072008
Aid for Trade (1990-2008)
AFT_infrastructure AFT_capacity
AFT_regulation
Source: estimates from OECD-CRS database.
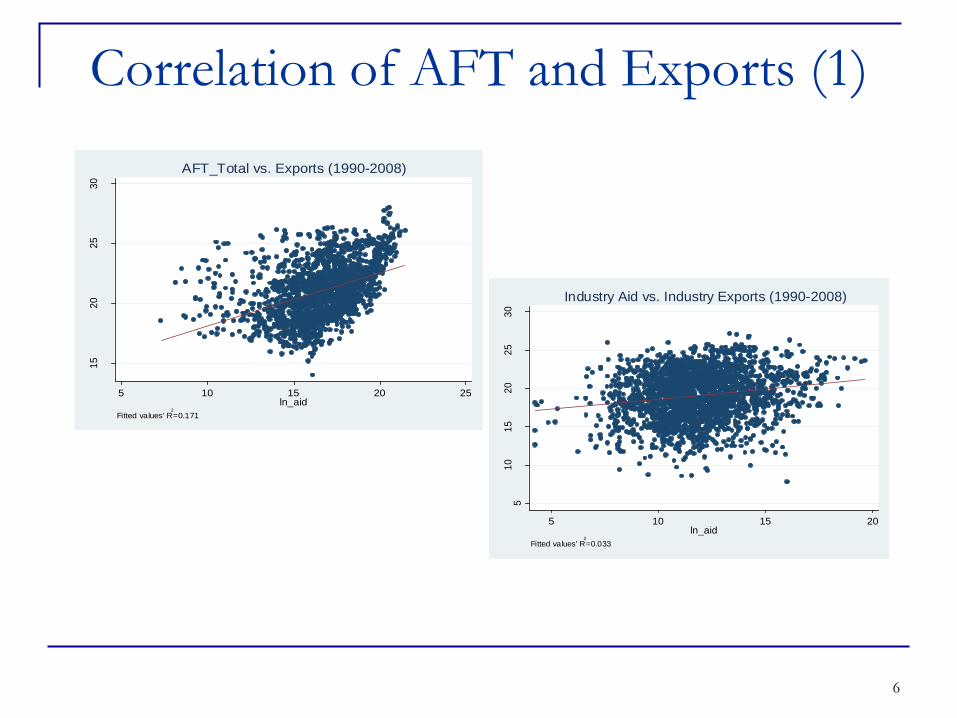
Correlation of AFT and Exports (1)
6
15
20
25
30
ln(e
xp
ort
s)
5 10 15 20 25ln_aid
Fitted values' R2
=0.171
AFT_Total vs. Exports (1990-2008)
51
01
52
02
53
0
ln(e
xp
ort
s)
5 10 15 20ln_aid
Fitted values' R2
=0.033
Industry Aid vs. Industry Exports (1990-2008)

7
DZAAGO
ATG
ARG
BGD
BRB
BLZ
BEN
BTN
BOL
BWA
BRA
BFA
BDI
CMR
CPV
CAF
TCD
CHL
CHN
COL
COM
ZAR
COGCRI
CIV
DJI
DMA
DOM
ECU EGY
SLV
GNQ
FJI
GAB
GMB
GHA
GRD
GTM
GIN
GNB
GUY
HND
INDIDN
JAM
JOR KEN
KIR
LAOLBN
LSOLBR
LBY
MDG
MWI
MYS
MDV MLI
MUS
MEX
MAR
MOZNAM
NPL
NIC
NER
NGA
OMNPAK
PAN PNGPRY
PER
PHL
RWA
WSM
SEN
SYC SLESLB
ZAF
LKA
KNALCA
VCT
SDN
SURSWZ
TZA
THA
TGO
TON
TTO TUN
TUR
UGA
URY
VUT
VNM
ZMB
15
20
25
30
ln(e
xp
ort
s)
12 14 16 18 20 22ln_aid
Fitted values R2
=0.151
AFT_Total vs. Exports (2008)
DZA
AGO
ATG
ARG
BGDBRB
BLZ
BEN
BTN
BOL
BWA
BRA
BFABDI
CMR
CPV
CAF
TCDCHL
CHN
COL
COM
ZAR
COG
CRI
CIV
DJIDMA
DOM
ECU
EGYSLV
GNQ
FJI
GAB
GMB
GHA
GRD
GTM
GIN
GNB
GUY
HND
IND
IDN
JAM
JOR
KEN
KIR
LAO
LBN
LSO
LBR
LBY
MDG
MWI
MYS
MDV
MLI
MUSMEX
MARMOZ
NAM
NPL
NIC
NER
NGA
OMN
PAK
PAN
PNG
PRYPER
PHL
RWA
WSM SEN
SYC
SLE
SLB
ZAF
LKA
KNALCA
VCT
SDN
SUR
SWZ
TZA
THATGO
TON
TTO
TUN
TUR
UGA
URY
VUT
VNM
ZMB
34
56
78
ln(e
xp
ort
s /
GD
P)
0 1 2 3 4ln(aid / GDP)
Fitted values R2
=0.067
Total AFT/GDP vs. Exports/GDP (2008)
Correlation of AFT and Exports (2)
Potential reverse causality: does Aid cause exports?
or does exports cause Aid?

1990-2008 2008
code/ sector name Disburs. (USD mill) Disburs. (USD mill)
Infrastructure 114,118 57% 13,112 51%
210 Transport & Storage 61,633 31% 7,494 29%
220 Communications 7,508 4% 461 2%
230 Energy 44,977 22% 5,157 20%
Production Capacity 82,101 41% 11,982 46%
240 Banking & Financial Services 13,053 7% 2,892 11%
250 Business & Other Services 9,319 5% 1,943 8%
311 Agriculture 32,163 16% 4,668 18%
312 Forestry 4,567 2% 534 2%
313 Fishing 2,836 1% 341 1%
321 Industry 15,561 8% 1,362 5%Agro-industries 821.20 0.4% 86.16 0.4%Wood industries 240.26 0.1% 2.48 0.0%Textiles 100.39 0.1% 9.86 0.0%Chemicals 2,125.18 1.1% 45.27 0.2%Non metallic products 324.50 0.2% 0.84 0.0%Basic Metals 253.02 0.1% 1.87 0.0%Non-ferrous metals 28.45 0.0% 0.27 0.0%Machinery 352.35 0.2% 22.90 0.1%Transport equipment 622.52 0.3% 2.76 0.0%Energy manufacturing 670.49 0.4% 1.45 0.0%
Industrial policy, , R&D 8,681.74 4.7% 844.20 3.8%
322 Mineral Resources & Mining 4,602 2% 241 1%
Trade Policies and Regulations 4,378 2% 795 3%
Total 200,596 100% 25,888 100%
8

2. Literature review
Aid-for-Trade on exports
Helble, Mann & Wilson (2010)
Brenton & von Uexkull (2009)
Cali & Te Velde (2009)
AfT on trade costs (DB: time/container cost,
#documents) :
Busse et al. (2010):
Cali and te-Velde (2009)
Aid Effectiveness: large literature, ex
Rajan & Subramanian (2009 & forthcoming)
Brueckner (2010)
9

Problem: potential reverse causality
Biased estimates
Potential IV for AFT: civil liberties,
immunization rates, gender health access?
IV at country level.
Limited instruments.
Identification strategy:
exploit Aid on services.
use US I-O data on intensity of services on
downstream goods.
10
3. Identification Strategy
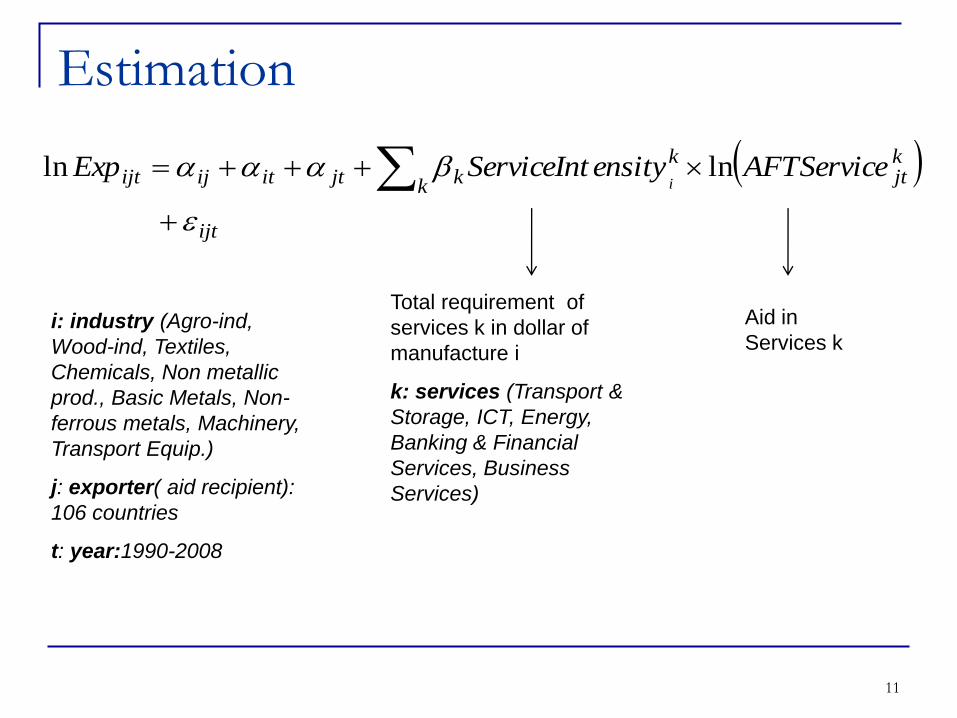
Estimation
11
ijt
k
kjt
kkjtitijijt AFTServiceensityServiceIntExp
i
lnln
i: industry (Agro-ind,
Wood-ind, Textiles,
Chemicals, Non metallic
prod., Basic Metals, Non-
ferrous metals, Machinery,
Transport Equip.)
j: exporter( aid recipient):
106 countries
t: year:1990-2008
Total requirement of
services k in dollar of
manufacture i
k: services (Transport &
Storage, ICT, Energy,
Banking & Financial
Services, Business
Services)
Aid in
Services k
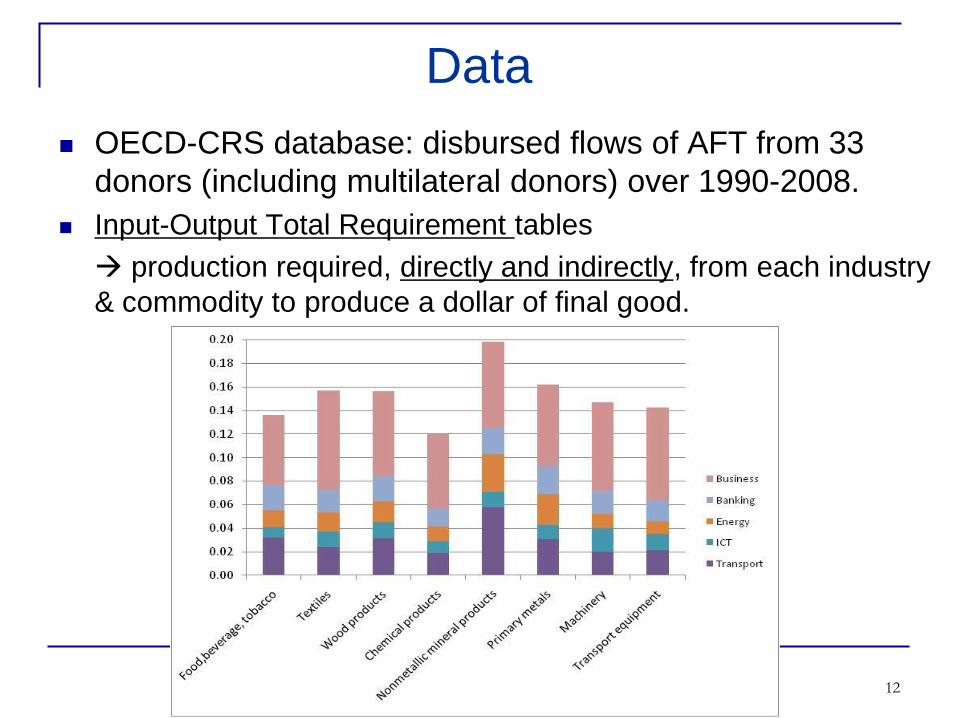
Data
OECD-CRS database: disbursed flows of AFT from 33
donors (including multilateral donors) over 1990-2008.
Input-Output Total Requirement tables
production required, directly and indirectly, from each industry
& commodity to produce a dollar of final good.
12
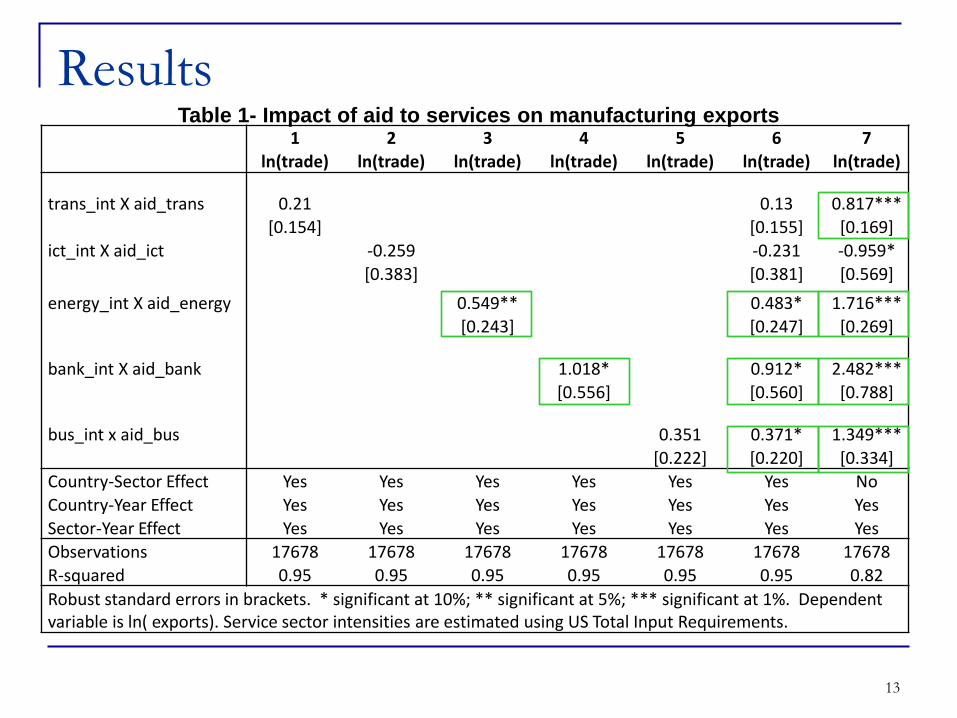
Results
13
1 2 3 4 5 6 7
ln(trade) ln(trade) ln(trade) ln(trade) ln(trade) ln(trade) ln(trade)
trans_int X aid_trans 0.21 0.13 0.817***
[0.154] [0.155] [0.169]
ict_int X aid_ict -0.259 -0.231 -0.959*
[0.383] [0.381] [0.569]
energy_int X aid_energy 0.549** 0.483* 1.716***
[0.243] [0.247] [0.269]
bank_int X aid_bank 1.018* 0.912* 2.482***
[0.556] [0.560] [0.788]
bus_int x aid_bus 0.351 0.371* 1.349***
[0.222] [0.220] [0.334]
Country-Sector Effect Yes Yes Yes Yes Yes Yes No
Country-Year Effect Yes Yes Yes Yes Yes Yes Yes
Sector-Year Effect Yes Yes Yes Yes Yes Yes Yes
Observations 17678 17678 17678 17678 17678 17678 17678
R-squared 0.95 0.95 0.95 0.95 0.95 0.95 0.82
Robust standard errors in brackets. * significant at 10%; ** significant at 5%; *** significant at 1%. Dependent variable is ln( exports). Service sector intensities are estimated using US Total Input Requirements.
Table 1- Impact of aid to services on manufacturing exports

Results
14
Robustness Checks By income level
Baseline ARG_Intensities Year>1999 low mid-low mid-high
1 2 3 4 5 6
trans_int X aid_trans 0.13 0.015 0.343 0.062 -0.15 0.551**
[0.155] [0.168] [0.267] [0.361] [0.290] [0.225]
ict_int X aid_ict -0.231 0.156 -1.617** 0.64 -0.417 -1.357**
[0.381] [1.493] [0.807] [0.749] [0.580] [0.690]
energy_int X aid_energy 0.483* 0.491*** 0.819** 0.575 0.800* 0.059
[0.247] [0.183] [0.393] [0.503] [0.478] [0.333]
bank_int X aid_bank 0.912* 3.453** 2.691*** 1.743 1.457* 0.088
[0.560] [1.452] [0.906] [1.095] [0.809] [1.085]
bus_int x aid_bus 0.371* -0.679*** -0.211 -0.371 0.541 0.856**
[0.222] [0.252] [0.342] [0.435] [0.437] [0.414]
Observations 17678 17678 9480 6298 6185 3998
R-squared 0.95 0.95 0.96 0.92 0.96 0.97
Robust standard errors in brackets. * significant at 10%; ** significant at 5%; *** significant at 1%. Dependent variable is ln( exports). Service sector intensities are estimated using US Total Input Requirements except for column (2) where Argentina’s Total Input Requirements are used. All regressions control for country-sector, country-year, and sector-year effects.
Table 2- Impact of aid to services on manufacturing exports

Final Remarks and Future Research
Extend the input-output linkages to estimate:
Impact of aid on additional upstream sectors
(other than services)
On exports of downstream goods (other than
manufactures)
Implement the identification strategy with
country-specific Input-Output matrices.
Additional robustness checks (lags of aid,
samples of countries, years)
15

To be continued…
Many thanks!
16

17
Aid to Service Sectors (Inputs)
210 - Transport and Storage
220 - Communications
230 - Energy
240 - Banking and Financial Services
250 - Business and Other Services
Export Performance in Manufacturing
- Agro-industries - Wood-industries
- Textiles - Chemicals
- Basic Metals - Non-Ferrous Metals
- Machinery - Transport Equipment
- Non-metallic mineral products
Identification Strategy
Top Related