


Languages
Pages
Legal

AIA MPF - PRIME VALUE CHOICE
REPORTS AND FINANCIAL STATEMENTS
FOR THE YEAR ENDED
30TH NOVEMBER 2018

AJA MPF - PRIME VALUE CHOICE
Contents
Scheme report
Investment report
Independent auditor's report
Scheme
Statement of net assets available for benefits
Statement of changes in net assets available for benefits
Statement of cash flows
Constituent funds
Statement of net assets
Statement of comprehensive income
Statement of changes in net assets attributable to members
Statement of cash flows
Notes to the financial statements
Pa es
1 to 7
8 to 71
72 to 75
76
77 to 78
79
80 to 91
92 to 103
104 to 115
116tol27
128 to 206

AIA MPF - PRIME VALUE CHOICE
SCHEME REPORT FOR THE YEAR ENDED 30TH NOVEMBER 2018
1. Background
The AJA MPF - Prime Value Choice (the "Scheme") is a master trust scheme established by a master trust deed dated 31st January 2000, as amended (the "Trust Deed"). The sponsor of the Scheme is AJA Company Limited (the "Sponsor"). The trustee of the Scheme is AJA Company (Trustee) Limited (the "Trustee"). The investment managers of the Scheme are PineBridge Investments Hong Kong Limited, JF Asset Management Limited, Allianz Global Investors Asia Pacific Limited (ceased to be an investment manager of the Scheme on 15th November 2018), Amundi Hong Kong Limited and FIL Investment Management (Hong Kong) Limited (the "Managers"). The Scheme is registered under the Hong Kong Mandatory Provident Fund Schemes Ordinance (the "MPF Ordinance") and has been authorised by the Securities and Futures Commission of Hong Kong. (Not, I)
Whilst the Scheme has been designed to ensure that participating employers can comply with the requirements of the MPF Ordinance in respect of those employees covered by MPF legislation, it is also possible for self-employed persons and non-employed persons to join the Scheme. If an employee member changes employment, he/she can leave the whole or any part of his/her accrued benefits in the Scheme and become a personal account member. Employees, self-employed and nonemployed members are all collectively referred to as "Scheme members" hereinafter.
Mandatory contributions in accordance with the MPF Ordinance are fully vested and belong immediately to Scheme members from the date the contributions were received by the Trustee. Participating employers, employees and self-employed members can choose to make additional voluntary contributions at their own discretion. However, benefits accruing on employers' voluntary contributions need not belong immediately to the employees, but will be subject to a vesting scale determined by length of employment or other conditions.
In accordance with the Trust Deed of the Scheme, the Trustee must procure that the trust assets of the Scheme members are invested in constituent funds. During the year, twenty-eight constituent funds (No1,,i, each having a separate and distinct investment objective and policy, were offered exclusively for Scheme members' selection. They are free to allocate their accrued benefits to one or more of the constituent funds in ratios (at 5 percent intervals) that best suit their investment objectives and constraints.

AJA MPF - PRIME VALUE CHOICE
SCHEME REPORT (CONTINUED) FOR THE YEAR ENDED 30TH NOVEMBER 2018
1. Background ( continued)
As at 30th November 2018 and 2017, the members' accrued benefits were allocated as follows:
Growth Portfolio Balanced Portfolio Capital Stable Portfolio Guaranteed Portfolio MPF Conservative Fund Hong Kong Equity Fund European Equity Fund Japan Equity Fund North American Equity Fund Asian Equity Fund Greater China Equity Fund Allianz Capital Stable Fund (Note 2) Allianz Growth Fund (Note 2) Allianz Stable Growth Fund (Note 2) Green Fund Global Bond Fund World Fund Manager's Choice Fund Fidelity Capital Stable Fund Fidelity Stable Growth Fund Fidelity Growth Fund Asian Bond Fund Eurasia Fund Hong Kong and China Fund American Fund Age 65 Plus Fund Core Accumulation Fund China HK Dynamic Asset Allocation Fund
Fair Value HK$'000
2018 2017
10,889,776 5,421,845 3,478,213 9,165,933 5,369,828 5,979,433 1,446,891
660,492 2,496,374 3,947,409 6,799,613
1,850,629 1,515,877 1,333,453 4,303,947
963,892 2,075,646 2,126,833
962,105 339,065
2,182,054 889,532 441,402
1,640,347 544,292
76,824,881
12,318,304 5,816,683 3,631,059 8,204,463 4,251,325 6,731,427 1,725,359
747,365 2,290,426 4,437,700 8,008,278
407,570 1,098,909
793,406 1,827,609 1,300,017 1,259,043 4,598,162
450,712 1,196,710 1,185,922
761,149 330,408
2,184,311 729,443 216,208
1,047,003 296,669
77,845,640
Note 1 : Such registration or authorisation does not imply official recommendation by either the Mandatory Provident Fund Schemes Authority ("MPFA") or the Securities and Futures Commission of Hong Kong ("SFC").
Note 2 : Allianz Capital Stable Fund, Allianz Growth Fund and Allianz Stable Growth Fund ("the 3 Allianz Funds") had no investments and operations since 15th November 2018. MPFA had approved the termination of the 3 Allianz Funds to take effect on 13th March 2019.
2
AIA MPF - PRIME VALUE CHOICE
SCHEME REPORT (CONTINUED) FOR THE YEAR ENDED 30TH NOVEMBER 2018
2. Changes to the Governing Rules and Principal Brochure of the Scheme
During the year, the following changes to the governing rules and the Principal Brochure of the Scheme were approved:
2.1 Governing Rules
By a Deed of Variation to the Trust Deed dated 8th December 2016, amendments were made to the Trust Deed to reflect, among others, the implementation of the MPF Default Investment Strategy with effect from I st April 20 I 7 pursuant to the Mandatory Provident Fund Schemes Ordinance.
2.2 Principal Brochure
The First Addendum and Second Addendum to the Principal Brochure were issued on 12th December 2016 concerning the changes ( effective I st April 20 I 7) to the Principal Brochure, unless otherwise specified therein, to reflect the implementation of MPF Default Investment Strategy and the addition of two constituent funds namely Core Accumulation Fund and Age 65 Plus Fund in connection with its implementation.
The Third Addendum to the Principal Brochure was issued on 4th May 2017, unless otherwise specified therein, to reflect the establishment of one constituent fund, namely China HK Dynamic Asset Allocation Fund which was made available for investment by members with effect from 4th July 2017.
The Fourth Addendum was issued on 14th August 20 I 8, unless otherwise specified therein, to reflect the change of Administrator of the Scheme from AIA Pension and Trustee Co. Ltd. to AIA International Limited (Hong Kong Branch), with effect from I October 2018.
The Fifth Addendum was issued on 14th August 2018, unless otherwise specified therein, to reflect i) the restructuring of Greater China Equity Fund and Hong Kong Equity Fund from a feeder fund structure to a portfolio-managed structure with effect from 20th September 2018, ii) the change of Investment Manager of the Greater China Equity Fund and the Hong Kong Equity Fund from PineBridge Investments Hong Kong Limited to JF Asset Management Limited with effect from 20th September 2018, iii) termination of the Allianz Growth Fund, the Allianz Stable Growth Fund and the Allianz Capital Stable Fund with effect from 15th November 2018, iv) the change of trustee fee at the underlying level for the Asian Equity Fund, the European Equity Fund and the Japan Equity Fund with effect from 13th November 2017, and v) miscellaneous changes such as addition of wording on the cut-off time for Constituent Funds' reallocation and switching, and updating the name of the index that forms part of the reference portfolio of the Default Investment Strategy Constituent Funds.
3. Contact
Further information about the Scheme and its operation can be obtained from the following:
Employer hotline Member hotline: Fax number Postal address
(852) 2100-1888 (852) 2200-6288 (852) 2565-0001 AIA International Limited 8/F, AIA Financial Centre, 712 Prince Edward Road East Kowloon, Hong Kong
3

AIA MPF - PRIME VALUE CHOICE
SCHEME REPORT (CONTINUED) FOR THE YEAR ENDED 30TH NOVEMBER 2018
4. Service Providers
Trustee AIA Company (Trustee) Limited Rn( {gg't)1§~~0 E'J Prior to 13th October 2018: 2/F, AIA Building, I Stubbs Road, Hong Kong
With effect from 13th October 2018: 11/F, AIA Hong Kong Tower, 734 King's Road, Quarry Bay, Hong Kong
Administrator Prior to I st October 2018: AIA Pension and Trustee Co. Ltd. Rn~{*~~:E][,&{gg:£1§~~0'6'] (Note i) Prior to I 0th July 2018: Vanterpool Plaza, 2/F, Wickhams Cay I, Road Town, Tortola, British Virgin Islands
With effect from 10th July 2018: Tortola Pier Park, Building I, Second Floor, Wickhams Cay I, Road Town, Tortola, British Virgin Islands
Hong Kong Administration Office: 1/F, AIA Building, I Stubbs Road, Hong Kong
With effect from I st October 2018: AIA International Limited Rn{5F<~(~f~)1§m0 E'] (Note i) Clarendon House, 2 Church Street, Hamilton HM 11, Bermuda
Hong Kong Administration Office: 1/F, AIA Hong Kong Tower, 734 King's Road, Quarry Bay, Hong Kong
Custodian Citibank N .A. 50/F, Champion Tower, Three Garden Road, Central, Hong Kong
Investment Managers PineBridge Investments Hong Kong Limited Level 31, Three Pacific Place, I Queen's Road East, Hong Kong
JF Asset Management Limited 21/F, Chater House, 8 Connaught Road, Central, Hong Kong
Allianz Global Investors Asia Pacific Limited (Ceased to be an investment manager of the Scheme on 15th November 2018) 27/F, ICBC Tower, 3 Garden Road, Central, Hong Kong
Amundi Hong Kong Limited 9/F, One Pacific Place, 88 Queensway, Admiralty, Hong Kong
FIL Investment Management (Hong Kong) Limited Level 21, Two Pacific Place, 88 Queensway, Admiralty, Hong Kong
4

AIA MPF - PRIME VALUE CHOICE
SCHEME REPORT (CONTINUED) FOR THE YEAR ENDED 30TH NOVEMBER 2018
4. Service Providers (continued)
Insurer AJA Company Limited tzn{Ji1;~1'§~R0-EJ (Note ii) 27th Floor, Hopewell Centre, 183 Queen's Road East, Wanchai, Hong Kong
Bank The Hong Kong and Shanghai Banking Corporation Limited HSBC Main Building, I Queen's Road Central, Hong Kong
Citibank, N.A. Hong Kong 50/F, Champion Tower, 3 Garden Road, Hong Kong
Auditor PricewaterhouseCoopers 21/F, Edinburgh Tower, 15 Queen's Road, Central, Hong Kong
Note i:
Note ii:
Prior to 1st October 2018, the Administrator was the immediate holding company of the Trustee.
With effect from 1st October 2018, the administrator is the fellow subsidiary of the Trustee.
The Insurer is the intermediate holding company of the Trustee as at 30th November 2018 and 2017.
5

AIA MPF - PRIME VALUE CHOICE
SCHEME REPORT (CONTINUED) FOR THE YEAR ENDED 30TH NOVEMBER 2018
5. Board of Directors
Directors of the Trustee
Ms. Bonnie Pui-Lan TSE Mr. John Tai-Wo CHU Mr. Kam Tong LAI Mr. Peter James CREWE Mr. Sai Cheong FOONG Mr. Elaine Kar-Yee Lau (Appointed on 19th July 2018) Mr. Stephen Yu-Kay FUNG (Resigned on 19th July 2018)
Directors of the Administrator
Mr. Garth Brian JONES Mr. Keng Hooi NG Mr. Mitch David NEW Ms. Shelby Ross Weldon Mr. Timothy Carrick FARIES Mr. Wing Shing CHAN Mr. Clive Vincent ANDERSON (Alternate Director to Keng Hooi NG) Mr. Jon Paul NIELSEN (Alternate Director to Wing Shing CHAN) Mr. Qiang CAI (resigned on 31st December 2017) Mr. William LISLE (resigned on 31st December 2017)
Directors of the Investment Managers
PineBridge Investments Hong Kong Limited
Mr. Arthur Egbert Chu-Ming LAU Ms. Jennifer Theunissen (Appointed on 7th December 2018) Mr. Rajeev MITT AL (Resigned on 7th December 2018)
JF Asset Management Limited
Mr. Aidan Daniel SHEVLIN Mr. Ayaz Hatim EBRAHIM Ms. Chloe Louise THOMAS Mr. Christopher David SPELMAN Mr. Edwin Tsun-Kay CHAN Mr. Lee Matthew BRAY Mr. Leon GOLDFIELD Mr. Philippe EL-ASMAR Ms. Qionghui WANG Ms. Shaw Yann HO Mr. Daniel James WATKINS (Appointed on 1st March 2019) Mr. Michael Irving FALCON (Resigned on 20th December 2018) Mr. Richard Edward TITHERINGTON (Resigned on 22nd November 2018)
6

AIA MPF - PRIME VALUE CHOICE
SCHEME REPORT (CONTINUED) FOR THE YEAR ENDED 30TH NOVEMBER 2018
5. Board ofDirectors (continued)
Directors of the Investment Managers (continued)
Allianz Global Investors Asia Pacific Limited
Mr. Daniel LEHMANN Mr. Desmond Ka-Yiu NG Mr. Kam Wah IP Mr. Raymond Chi Keung CHAN Ms. Tze-Ling YU
Amundi Hong Kong Limited
Mr. Guerrier de DUMAST Mr. Jean-Yves GLAIN Mr. Vincent MORTIER Mr. Xiao-Feng ZHONG Mr. Christianus PELLIS (Appointed on 9th April 2018) Mr. Bernard CARA YON (Resigned on 9th April 2018) Mr. Laurent BERTIAU (Resigned on 9th April 2018)
FIL Investment Management (Hong Kong) Limited
Mr. Bradley Duane FRESIA Mr. Timothy John ORCHARD Ms. Wai Fun (Daisy) Ho Ms. Christopher Paul Quinlan (Appointed on 20th July 2018) Mr. Paras Kishore Anand (Appointed on 10th September 2018) Mr. Rajeev Mittal (Appointed on 1st March 2019) Ms. Victoria Kelly (Appointed on 2nd January 2019) Mr. Mark Antony TALBOT (Resigned on 23rd May 2018)
Directors of the Insurer
Mr. Choi-Cheung FUNG Mr. Dominic Ka-Kui LEUNG Mr. Gaith Brian JONES Mr. John Tai-Wo CHU Mr. Keng Hooi NG Mr, Qiang CAI Mr. Timothy Carrick FARIES Mr. William LISLE Mr. Wing Shing CHAN
For business address of the directors, please refer to section 4 of the Scheme Report.
7

AIA MPF - PRIME VALUE CHOICE
INVESTMENT REPORT FOR THE YEAR ENDED 30TH NOVEMBER 2018
Investment Policies
As at 30th November 2018 and during the year, AJA MPF - Prime Value Choice is a master trust scheme and offering the following constituent funds:
I. Growth Portfolio 2. Balanced Portfolio 3. Capital Stable Portfolio 4. Guaranteed Portfolio 5. MPF Conservative Fund 6. Hong Kong Equity Fund 7. European Equity Fund 8. Japan Equity Fund 9. North American Equity Fund 10. Asian Equity Fund 11. Greater China Equity Fund 12. Allianz Capital Stable Fund Noto 1
13. Allianz Growth Fund Noto 1
14. Allianz Stable Growth Fund Noto 1
15. Green Fund 16. Global Bond Fund 17. World Fund 18. Manager's Choice Fund 19. Fidelity Capital Stable Fund 20. Fidelity Stable Growth Fund 21. Fidelity Growth Fund 22. Asian Bond Fund 23. Eurasia Fund 24. Hong Kong and China Fund 25. American Fund 26. Age 65 Plus Fund 27. Core Accumulation Fund 28. China HK Dynamic Asset Allocation Fund
Note 1 : Allianz Capital Stable Fund, Allianz Growth Fund and Allianz Stable Growth Fund ("the 3 Allianz Funds") had no investments and operations since 15th November 2018. MPFA had approved the termination of the 3 Allianz Funds to take effect on 13th March 2019.
Each of the constituent funds is managed in accordance with separate and distinct investment policies reflecting the different risk profiles of the investment choices as set out below.
1. Growth Portfolio The primary objective of the Growth Portfolio is to maximise its long term capital appreciation in Hong Kong dollar terms. The secondary objective is to outperform Hong Kong salary inflation over the long term. The Growth Portfolio seeks to achieve these investment objectives through a professionally managed portfolio, invested in two or more approved pooled investment funds ( and to the extent permitted, any other permissible investment as approved by the MPF A and SFC).
The Growth Portfolio asset allocation policy is normally to have an equity content of 90% with the balance invested in bonds and cash. Investments may be made in any market in any country where permitted by the Hong Kong Mandatory Provident Fund Schemes (General) Regulation (the "General Regulation").
8

AJA MPF - PRIME VALUE CHOICE
INVESTMENT REPORT (CONTINUED) FOR THE YEAR ENDED 30TH NOVEMBER 2018
Investment Policies (continued)
2. Balanced Portfolio The primary objective of the Balanced Portfolio is to maximise its long term capital appreciation in Hong Kong dollar terms within moderate risk parameters. The secondary objective is to outperform Hong Kong price inflation over the long term. The Balanced Portfolio seeks to achieve these investment objectives through a professionally managed portfolio, invested in two or more approved pooled investment funds (and to the extent permitted, any other permissible investment as approved by the MPF A and SFC).
The Balanced Portfolio asset allocation policy is normally to have an equity content of 50% with the remainder in cash and bonds. Investments may be made in any market in any country where permitted by the General Regulation.
3. Capital Stable Portfolio The primary objective of the Capital Stable Portfolio is to minimise its short term capital risk in Hong Kong dollar terms. The secondary objective is to enhance returns over the long term through limited exposure to global equities. The Capital Stable Portfolio seeks to achieve these investment objectives through a professionally managed portfolio, invested in two or more approved pooled investment funds (and to the extent permitted, any other permissible investment as approved by the MPFA and SFC). The Capital Stable Portfolio does not guarantee the repayment of capital.
The Capital Stable Portfolio asset allocation policy is normally to have the greater proportion of assets invested in bonds and cash, with the balance invested in equities. Investments may be made in any market in any country where permitted by the General Regulation.
4. Guaranteed Portfolio The primary objective of the Guaranteed Portfolio is to minimise capital risk in Hong Kong dollar terms. The secondary objective is to achieve a stable, consistent and predictable rate of return.
Due to the nature and inclusion of the guarantee, it is possible that there may be a dilution in performance of the Guaranteed Portfolio.
Except for a small portion that may be held in cash or cash based investments for operational purposes, the Guaranteed Portfolio is a feeder fund investing solely in an approved pooled investment fund. The underlying approved pooled investment fund is a guaranteed insurance policy investing entirely in a pooled investment fund approved by the MPFA in the form of a unit trust which invests at least 70% of its non-cash assets in bonds and other fixed income instruments either denominated in Hong Kong dollars or, if they are not denominated in Hong Kong dollars, the effective currency exposure shall be hedged back into Hong Kong dollars in order to ensure that the approved pooled investment fund in the form of a unit trust has an effective currency exposure of at least 70% to the Hong Kong dollar. The remaining assets of the approved pooled investment fund will be held in cash and/or deposits. When investing in a pooled investment fund in the form of a unit trust approved by the MPF A, the underlying investments of such pooled investment fund shall be used to determine whether the relevant percentage limits stated in this section are adhered to. For the avoidance of doubt, units or shares of such pooled investment fund shall not be treated as equity investments for purposes of this section.
9

AIA MPF - PRIME VALUE CHOICE
INVESTMENT REPORT (CONTINUED) FOR THE YEAR ENDED 30TH NOVEMBER 2018
Investment Policies ( continued)
4. Guaranteed Portfolio (continued)
The investments of the approved pooled investment fund in the form of a unit trust in bonds are required to comply with the minimum credit rating requirements set by the MPFA in Guidelines on Debt Securities (Guidelines Ill. I), where appropriate.
5. MPF Conservative Fund The objective of the MPF Conservative Fund is to preserve principal value. _The MPF Conservative Fund does not guarantee the repayment of capital.
Except for a small portion to be held in cash or cash based investments for operational purposes, the MPF Conservative Fund is a feeder fund investing solely in an approved pooled investment fund. The underlying approved pooled investment fund is a money market fund investing in deposits and debt securities subject to the restrictions set out in section 37 of the General Regulation.
The investments of the underlying approved pooled investment fund in debt secunties are required to comply with the minimum credit rating requirements set by the MPF A in Guidelines on Debt Securities (Guidelines III.I), where appropriate.
6. Hong Kong Equity Fund The Hong Kong Equity Fund is a portfolio management fund investing in two or more approved pooled investment funds and/or approved ITCISs. The Hong Kong Equity Fund seeks to provide long term capital appreciation through the underlying approved pooled investment funds and/or approved ITCISs which invest primarily in securities of companies either listed, based or operating principally in Hong Kong. Implementation of the investment policy is considered to be of high inherent risk.
The Hong Kong Equity Fund is a portfolio management fund investing in two or more approved pooled investment funds and/or approved ITCISs which have majority of assets invested in Hong Kong equities. The Hong Kong Equity Fund may hold up to 30% of the assets in bonds, cash or cash based investments for operational purposes.
7. European Equity Fund The European Equity Fund is a feeder fund investing solely in an approved pooled investment fund. The investment objective of the European Equity Fund is to provide investors with long term capital growth through the underlying approved pooled investment fund which consists primarily of securities of companies based or operating principally in countries in Western Europe.
A portion of the underlying investment fund may be invested in companies which are based or operating in other countries in Eastern Europe.
Except for a small portion that may be held in cash or cash based investments for operational purposes, the European Equity Fund will invest solely in an approved pooled investment fund whose asset allocation policy is normally to have the greater proportion of assets invested in equities and convertibles, primarily in the European market, with the remainder in cash and bonds.
10

AIA MPF - PRIME VALUE CHOICE
INVESTMENT REPORT (CONTINUED) FOR THE YEAR ENDED 30TH NOVEMBER 2018
Investment Policies (continned)
8. Japan Equity Fund The Japan Equity Fund is a feeder fund investing solely in an approved pooled investment fund. The investment objective of the Japan Equity Fund is to provide investors with long term capital growth through the underlying approved pooled investment fund which consists primarily of securities of companies based or operating principally in Japan.
Except for a small portion that may be held in cash or cash based investments for operational purposes, the Japan Equity Fund will invest solely in an approved pooled investment fund whose asset allocation policy is normally to have the greater proportion of assets invested in equities and convertibles, primarily in the Japan market, with the remainder in cash and bonds.
9. North American Equity Fund The North American Equity Fund is a feeder fund investing entirely in an approved pooled investment fund. The North American Equity Fund seeks to provide long term capital appreciation through the underlying approved pooled investment fund which consists primarily of shares in US companies.
Except for a small portion to be held in cash or cash based investments for operational purposes, the North American Equity Fund is a feeder fund investing solely in an approved pooled investment fund whose asset allocation policy is normally to have the greater proportion of assets invested in equities and convertibles, primarily in the US market, with the remainder in cash and bonds.
I 0. Asian Equity Fund The Asian Equity Fund is a feeder fund investing entirely in an approved pooled investment fund. The investment objective of the Asian Equity Fund is to provide investors with long term capital growth in US dollar terms through a portfolio consisting primarily of securities of companies based or operating principally in the Asia-Pacific region, excluding Japan and Hong Kong.
Except for a small portion that may be held in cash or cash based investments for operational purposes, the Asian Equity Fund will invest solely in an approved pooled investment fund whose asset allocation policy is normally to have a maximum equity content of 100% with the remainder in cash or bonds.
11. Greater China Equity Fund The Greater China Equity Fund is a portfolio management fund investing in two or more approved pooled investment funds and/or approved ITC!Ss. The Greater China Equity Fund seeks to provide long term capital appreciation through the underlying approved pooled investment funds and/or approved ITC!Ss which invest primarily in securities of companies based or operating principally in the Greater China Region i.e. the People's Republic of China, Hong Kong, Macau and Taiwan - the majority of these companies will be listed on a stock exchange in Hong Kong and Taiwan. Implementation of the investment policy is considered to be of high inherent risk.
The Greater China Equity Fund is a portfolio management fund investing in two or more approved pooled investment funds and/or approved ITCISs which have majority of assets invested in Greater China equities. The Greater China Equity Fund may hold up to 30% of the assets in bonds, cash or cash based investments for operational purposes.
11

AIA MPF - PRIME VALUE CHOICE
INVESTMENT REPORT (CONTINUED) FOR THE YEAR ENDED 30TH NOVEMBER 2018
Investment Policies (continued)
12. Allianz Capital Stable Fund /Nm, 1!
The Allianz Capital Stable Fund is a feeder fund investing entirely in an approved pooled investment fund. The objective of the Allianz Capital Stable Fund is to provide investors with capital preservation combined with steady capital appreciation over the long term by investing in a diversified portfolio of global equities and fixed-interest securities through the underlying approved pooled investment fund. This Allianz Capital Stable Fund is designed for members who are willing to assume a relatively low level of risk. The Allianz Capital Stable Fund does not guarantee the repayment of capital.
Except for a small portion that may be held in cash or cash based investments for operational purposes, the Allianz Capital Stable Fund is intended to invest entirely in an approved pooled investment fund. This approved pooled investment fund is expected to invest 30% of its assets in equities and 70% in fixed-interest securities. The fixed income portion will consist of a range of instruments issued in countries around the world.
The equity portion of the approved pooled investment fund will be invested primarily in the Hong Kong, Japan, North American and European markets with a smaller proportions being invested, at the discretion of the Manager, in other Asian countries and emerging markets.
13. Allianz Growth Fund /Note 1!
The Allianz Growth Fund is a feeder fund investing entirely in an approved pooled investment fund. The objective of the Allianz Growth Fund is to maximise long term overall returns by investing primarily in global equities through the underlying approved pooled investment fund. This Allianz Growth Fund is designed for members who are willing to assume a relatively higher level ofrisk to achieve potentially higher long-term returns.
Except for a small portion that may be held in cash or cash based investments for operational purposes, the Allianz Growth Fund is intended to invest entirely in an approved pooled investment fund. This approved pooled investment fund, may invest in the countries comprised in the MSCI World Index which covers all the major world stock markets including those in Japan, North America, Asia and Europe.
14. Allianz Stable Growth Fund /Note 1!
The Allianz Stable Growth Fund is a feeder fund investing entirely in an approved pooled investment fund. The objective of the Allianz Stable Growth Fund is to achieve a stable overall return over the long term by investing in a diversified portfolio of global equities and fixedinterest securities through the underlying approved pooled investment fund. This Allianz Stable Growth Fund is designed for members who are willing to assume a medium level of risk.
Except for a small portion that may be held in cash or cash based investments for operational purposes, the Allianz Stable Growth Fund is intended to invest entirely in an approved pooled investment fund. This approved pooled investment fund, is expected to invest 50% of its assets in equities and 50% in fixed-interest securities. The fixed income portion will consist of a range of instruments issued in countries around the world. The equity portion of the approved pooled investment fund will be invested primarily in the Hong Kong, Japan, North American and European markets with a smaller proportion being invested, at the discretion of the Manager, in other Asian countries and emerging markets.
Note 1: Allianz Capital Stable Fund, Allianz Growth Fund and Allianz Stable Growth Fund ("the 3 Allianz Funds") had no investments and operations
since 15th November 2018. MPFA had approved the termination of the 3 Allianz Funds to take effect on 13th March 2019.
12

AIA MPF - PRIME VALUE CHOICE
INVESTMENT REPORT (CONTINUED) FOR THE YEAR ENDED 30TH NOVEMBER 2018
Investment Policies (continued)
15. Green Fund The Green Fund is a feeder fund investing entirely in an approved pooled investment fund. The objective of the Green Fund is to provide investors with long term capital appreciation through well diversified investments in global equities principally by investing in companies according to (I) their environmental ratings and (2) financial performance expectations, with a view to outperforming the MSC! World Index over the medium to long term:
The Green Fund is intended to invest entirely in an approved pooled investment fund. With an exception of a small portion that may be held in cash or cash based investments or other shortterm bonds permitted by the General Regulation for operational and cash management purpose, most of the assets of this approved pooled investment funds are invested in equity securities. Subject to the limitations required by the General Regulation, this approved pooled investment fund may also invest in exchange traded funds and in convertible bonds or authorised unit trust or authorised mutual fund permitted by the General Regulation for performance management purposes.
The geographical distribution of investments will be driven purely by bottom-up stock selection processes based on the securities comprised in the MSC! World Index which covers all the major world stock markets including but not limited to North America, Europe, Asia and Japan. The Green Fund will not invest in emerging market equities.
16. Global Bond Fund The Global Bond Fund is a feeder fund investing solely in an approved pooled investment fund. The investment objective of the Global Bond Fund is to seek long term stable return from a combination of current income and capital appreciation by investing in a portfolio of debt securities in the international markets, issued by government, supranational organizations and corporates.
Except for a small portion that may be held in cash or cash based investments for operational purposes, the Global Bond Fund will invest solely in an approved pooled investment fund that normally invests in a portfolio of debt securities in the international market, issued by governments, supranational organizations and corporates.
The investments of the underlying approved pooled investment fund in debt securities are required to comply with the minimum credit rating requirements set by the MPFA in Guidelines on Debt Securities (Guidelines Ill. I), where appropriate.
17. World Fund The World Fund is a portfolio management fund investing entirely in approved Index-tracking Collective Investment Schemes (ITC!Ss). The investment objective of the World Fund is to seek a long term capital appreciation by investing in a combination of global equity market indextracking funds. The World Fund is not an index-tracking fund.
The World Fund will invest mainly in approved ITC!Ss that track equity market indices that cover Large Cap companies in their respective markets around the world. A greater proportion of the assets will primarily be invested in equity market indices that track North American, European, Far Eastern and Australasian markets and a smaller proportion will be invested in Latin American markets. The remaining assets will be held in cash or cash based investments for operational and/or hedging purposes.
13

AIA MPF - PRIME VALUE CHOICE
INVESTMENT REPORT (CONTINUED) FOR THE YEAR ENDED 30TH NOVEMBER 2018
Investment Policies (continued)
18. Manager's Choice Fund The Manager's Choice Fund seeks to achieve long term capital appreciation through a professionally managed portfolio, invested in two or more approved pooled investment funds and/or approved ITC!Ss. The Manager's Choice Fund attempts to perform dynamic asset allocation in order to maximise long term capital appreciation. The Manager's Choice Fund would be suitable to investors who are willing to accept an above average level ofrisk in order to achieve long term capital appreciation.
Depending on the global market condition, the Manager's Choice Fund may allocate from I 0% to 90% of its assets in equities, with the balance invested in bonds, money market instruments and cash. Investments may be made in the above mentioned asset classes and may be in various markets globally where permitted by the General Regulation. The allocations will change based on the investment manager's view on the economic and market outlook, with higher allocation to equity when equity market outlook is positive, balanced allocation when equity market outlook is neutral and higher allocation to bonds, money market instruments and cash when equity market outlook is negative.
19. Fideli/J! Capital Stable Fund The Fidelity Capital Stable Fund is a feeder fund investing entirely in an approved pooled investment fund. The Fidelity Capital Stable Fund aims to produce a positive return over the long term and to focus investment towards less volatile assets of bonds and cash whilst retaining some equity exposure. It also aims to maintain a broad geographic diversification with a bias towards Hong Kong, and to ensure that the risk to the. capital base is limited in the short term. The Fidelity Capital Stable Fund does not guarantee the repayment of capital.
Except for a small portion that may be held in cash or cash based investments for operational purposes, the Fidelity Capital Stable Fund invests entirely in an approved pooled investment fund. This approved pooled investment fund is expected to invest 30% of its assets in equities and 70% in bonds and cash. The fund will be invested primarily in Hong Kong, Japan, Asia Pacific ex Japan ex Hong Kong, Americas and European markets.
20. Fideli/J! Stable Growth Fund The Fidelity Stable Growth Fund is a feeder fund investing entirely in an approved pooled investment fund. The Fidelity Stable Growth Fund aims to generate a positive return over the long term and to broadly diversify the portfolio as to asset type as between equities and bonds. It also aims to maintain a broad geographic diversification with a bias towards Hong Kong, and to limit the volatility of returns in the short term.
Except for a small portion that may be held in cash or cash based investments for operational purposes, the Fidelity Stable Growth Fund invests entirely in an approved pooled investment fund. This approved pooled investment fund is expected to invest 50% of its assets in equities and 50% in bonds and cash. The fund will be invested primarily in Hong Kong, Japan, Asia Pacific ex Japan ex Hong Kong, Americas and European markets.
21. Fideli/J! Growth Fund The Fidelity Growth Fund is a feeder fund investing entirely in an approved pooled investment fund. The Fidelity Growth Fund aims to build real wealth over the long term, to focus investment into the global equity markets and to have the flexibility to invest in global bonds. It also aims to maintain a broad geographic diversification with a bias towards Hong Kong and to manage the volatility of returns in the short term.
14
AIA MPF - PRIME VALUE CHOICE
INVESTMENT REPORT (CONTINUED) FOR THE YEAR ENDED 30TH NOVEMBER 2018
Investment Policies (continued)
21. Fidelity Growth Fund (continued) Except for a small portion that may be held in cash or cash based investments for operational purposes, the Fidelity Growth Fund invests entirely in an approved pooled investment fund. This approved pooled investment fund is expected to invest 90o/o of its assets in equities and I 0% in bonds and cash. The fund will be invested primarily in Hong Kong, Japan, Asia Pacific ex Japan ex Hong Kong, Americas and European markets.
22. Asian Bond Fund The Asian Bond Fund is a feeder fund investing solely in an approved pooled investment fund. The investment objective of the Asian Bond Fund is to seek long term capital growth by primarily investing in a portfolio of bonds in the Asia-Pacific region (excluding Japan), issued by, amongst others, government, supranational organizations and corporates.
Except for a small portion that may be held in cash or cash based investments for operational purposes, the Asian Bond Fund will invest solely in an approved pooled investment fund whose proposed asset allocation policy is to invest 70% to I 00% of assets in bonds within the AsiaPacific region ( excluding Japan), including but not limited to Australia, Hong Kong, Korea, Malaysia, New Zealand, Singapore and Thailand; and 0% to 30% of assets in bonds outside the Asia-Pacific region (excluding Japan), including but not limited to US dollar denominated bonds such as US treasury inflation-protected securities and treasury bonds for defensive purpose during periods of perceived uncertainty and volatility.
The investments of the underlying approved pooled investment fund in bonds are required to comply with the minimum credit rating requirements set by the MPFA in Guidelines on Debt Securities (Guidelines III. I), where appropriate.
23. Eurasia Fund The Eurasia Fund is a portfolio management fund investing entirely in approved ITC!Ss. The investment objective of the Eurasia Fund is to seek a long term capital appreciation by investing in a combination of European, Australasian and Far Eastern equity market index-tracking funds. The Eurasia Fund is not an index-tracking fund.
Except for a small portion to be held in cash or cash based investments for operational and/or hedging purposes, the Eurasia Fund will invest solely in approved ITCISs that track European, Australasian and Far Eastern equity market indices.
24. Hong Kong and China Fund The Hong Kong and China Fund is a portfolio management fund investing entirely in approved ITCISs. The investment objective of the Hong Kong and China Fund is to seek a long term capital appreciation by investing in a combination of equity market index-tracking funds that track Hong Kong equity market indices that measure the performance of companies listed in Hong Kong (including China incorporated enterprises listed in Hong Kong in the form of H Shares). The Hong Kong and China Fund is not an index-tracking fund.
Except for a small portion to be held in cash or cash based investments for operational and/or hedging purposes, the Hong Kong and China Fund will invest solely in approved ITCISs that track Hong Kong equity market indices that measure the performance of companies listed in Hong Kong (including China incorporated enterprises listed in Hong Kong in the form of H Shares).
15

AIA MPF - PRIME VALUE CHOICE
INVESTMENT REPORT (CONTINUED) FOR THE YEAR ENDED 30TH NOVEMBER 2018
Investment Policies ( continned)
25. American Fund The American Fund is a portfolio management fund investing entirely in approved ITCISs. The investment objective of the American Fund is to seek a long term capital appreciation by investing in a combination of North and South American equity market index-tracking funds. The American Fund is not an index-tracking fund.
Except for a small portion to be held in cash or cash based investments for operational and/or hedging purposes, the American Fund will invest solely in approved ITCISs that track North and South American equity market indices.
26. Age 65 Plus Fund The Age 65 Plus Fund is a feeder fund investing entirely in an approved pooled investment fund, namely, the Vanguard Income Fund. The investment objective of the Age 65 Plus Fund is to provide stable growth to Members in a globally diversified manner.
The investment manager of the Vanguard Income Fund will adopt a passive investment strategy in managing the portfolio by investing substantially all of the assets in constituent securities included in the Reference Portfolio of the Age 65 Plus Fund using sampling techniques. The investment manager of the Vanguard Income ·fund will seek to hold a range of securities that, in the aggregate, approximate the Reference Portfolio of the Age 65 Plus Fund in terms of the key characteristics: (i) for the equity investments, they will consist of a broadly diversified collection of stocks that approximate those included in the Reference Portfolio of the Age 65 Plus Fund in terms of factors such as country weightings, industry weightings, market capitalization and other financial characteristics of stocks; and (ii) for the bond investments, they will be made in consideration of factors such as country weightings, duration and cash flow. At the time of launch, the Reference Portfolio of the Age 65 Plus Fund is identified as follows: 20% FTSE MPF All-World Index (HKD unhedged total return)+ 77% Citi MPF World Government Bond Index (HKD hedged total return) + 3% cash or money market instruments providing a return at MPF Prescribed Savings Rate (HKD unhedged total return). The Reference Portfolio is subject to change from time to time. Please visit www.hkifa.org.hk for further information.
Sampling techniques are an approach whereby the investment manager of the Vanguard Income Fund tracks the Reference Portfolio of the Age 65 Plus Fund by investing in a representative portion, or sample, of the full list of the constituent securities of the Reference Portfolio of the Age 65 Plus Fund such that the overall characteristics of the portion of securities invested by the Vanguard Income Fund would be similar to those of the full list of constituent securities of the Reference Portfolio of the Age 65 Plus Fund.
Under such sampling techniques, the vast majority of the Vanguard Income Fund's holdings will be constituent securities that are within the universe of the Reference Portfolio of the Age 65 Plus Fund, except in limited circumstances where it is in the best interest of the Vanguard Income Fund. Such limited circumstances may include but not limited to where:
(i) it is not possible or it is difficult to buy or hold constituent securities ( e.g. due to liquidity or restrictions of ownership of such constituent securities);
(ii) the holding of non-constituent securities which were originally constituent securities is, in the opinion of the investment manager of the Vanguard Income Fund, more cost efficient to reflect the overall characteristics of the Reference Portfolio of the Age 65 Plus Fund;
16

AIA MPF - PRIME VALUE CHOICE
INVESTMENT REPORT (CONTINUED) FOR THE YEAR ENDED 30TH NOVEMBER 2018
Investment Policies (continned)
26. Age 65 Plus Fund (continued) (iii) investment in the constituent securities is not the most efficient way to reflect the
performance of the Reference Portfolio of the Age 65 Plus Fund, for example when it is more cost efficient to invest in the non-constituent securities which reflect the overall characteristics of the Reference Portfolio of the Age 65 Plus Fund;
(iv) the non-constituent securities which are, in the reasonable opinion of the investment manager of the Vanguard Income Fund, likely to form part of the Reference Portfolio of the Age 65 Plus Fund within six months of acquisition;
(v) the non-constituent securities which the investment manager of the Vanguard Income Fund considers to be an appropriate substitute for the constituent securities of the Reference Portfolio of the Age 65 Plus Fund having regard to investment objectives of the Vanguard Income Fund; and
(vi) to gain exposure to permissible securities in countries where such access is otherwise limited.
Such investment strategy aims to provide consistent investment returns in relation to the Reference Portfolio of the Age 65 Plus Fund in a cost efficient manner.
Through such underlying investment, the Age 65 Plus Fund will indirectly hold 20% of its net assets in Higher Risk Assets (such as global equities), with the remainder investing in Lower Risk Assets (such as global bonds and money market instruments). The asset allocation of Higher Risk Assets may vary between 15% and 25% due to differing price movements of various equity and bond markets. There is no prescribed allocation for investments in any specific countries or currencies.
27. Core Accumulation Fund The Core Accumulation Fund is a feeder fund investing entirely in an approved pooled investment fund, namely, the Vanguard Moderate Growth Fund. The investment objective of the Core Accumulation Fund is to provide capital growth to Members by indirectly investing in a globally diversified manner.
The investment manager of the Vanguard Moderate Growth Fund will adopt a passive investment strategy in managing the portfolio by investing substantially all of the assets in constituent securities included in the Reference Portfolio of the Core Accumulation Fund using sampling techniques. The investment manager of the Vanguard Moderate Growth Fund will seek to hold a range of securities that, in the aggregate, approximate the Reference Portfolio of the Core Accumulation Fund in terms of the key characteristics: (i) for the equity investments, they will consist of a broadly diversified collection of stocks that approximate those included in the Reference Portfolio of the Core Accumulation Fund in terms of factors such as countryweightings, industry weightings, market capitalization and other financial characteristics of stocks; and ( ii) for the bond investments, they will be made in consideration of factors such as country weightings, duration and cash flow. At the time of launch, the Reference Portfolio of the Core Accumulation Fund is identified as follows: 60% FTSE MPF All-World Index (HKD unhedged total return) + 37% Citi MPF World Government Bond Index (HKD hedged total return) + 3% cash or money market instruments providing a return at MPF Prescribed Savings Rate (HKD unhedged total return). The Reference Portfolio is subject to change from time to time. Please visit www.hkifa.org.hk for further information.
17

AIA MPF - PRIME VALUE CHOICE
INVESTMENT REPORT (CONTINUED) FOR THE YEAR ENDED 30TH NOVEMBER 2018
Investment Policies ( continued)
27. Core Accumulation Fund (continued) Sampling techniques are an approach whereby the investment manager of the Vanguard Moderate Growth Fund tracks the Reference Portfolio of the Core Accumulation Fund by investing in a representative portion, or sample, of the full list of the constituent securities of the Reference Portfolio of the Core Accumulation Fund such that the overall characteristics of the portion of securities invested by the Vanguard Moderate Growth Fund would be similar to those of the full list of constituent securities of the Reference Portfolio of the Core Accumulation Fund.
Under such sampling techniques, the vast majority of the Vanguard Moderate Growth Fund's holdings will be constituent securities that are within the universe of the Reference Portfolio of the Core Accumulation Fund, except in limited circumstances where it is in the best interest of the Vanguard Moderate Growth Fund. Such limited circumstances may include but not limited to where:
(i) it is not possible or it is difficult to buy or hold constituent securities ( e.g. due to liquidity or restrictions of ownership of such constituent securities);
(ii) the holding of non-constituent securities which were originally constituent securities is, in the opinion of the investment manager of the Vanguard Moderate Growth Fund, more cost efficient to reflect the overall characteristics of the Reference Portfolio of the Core Accumulation Fund;
(iii) investment in the constituent securities is not the most efficient way to reflect the performance of the Reference Portfolio of the Core Accumulation Fund, for example when it is more cost efficient to invest in the non-constituent securities which reflect the overall characteristics of the Reference Portfolio of the Core Accumulation Fund;
(iv) the non-constituent securities which are, in the reasonable opinion of the investment manager of the Vanguard Moderate Growth Fund, likely to form part of the Reference Portfolio of the Core Accumulation Fund within six months of acquisition;
(v) the non-constituent securities which the investment manager of the Vanguard Moderate Growth Fund considers to be an appropriate substitute for the constituent securities of the Reference Portfolio of Core Accumulation Fund having regard to investment objectives of the Vanguard Moderate Growth Fund; and
(vi) to gain exposure to permissible securities in countries where such access is otherwise limited.
Such investment strategy aims to provide consistent investment returns in relation to the Reference Portfolio of the Core Accumulation Fund in a cost efficient manner.
Through such underlying investment, the Core Accumulation Fund will indirectly hold 60% of its net assets in Higher Risk Assets (such as global equities), with the remainder investing in Lower Risk Assets (such as global bonds and money market instruments). Although the Core Accumulation Fund will target to indirectly hold 60% assets in Higher Risk Assets (such as global equities), with the remainder investing in Lower Risk Assets (such as global bonds and money market instruments), the asset allocation to Higher Risk Assets may vary between 55% and 65% due to differing price movements of various equity and bond markets. There is no prescribed allocation for investments in any specific countries or currencies.
18 .,

AJA MPF - PRIME VALUE CHOICE
INVESTMENT REPORT (CONTINUED) FOR THE YEAR ENDED 30TH NOVEMBER 2018
Investment Policies (continued)
28. China HK Dynamic Asset Allocation Fund The China HK Dynamic Asset Allocation Fund is a feeder fund investing entirely in an approved pooled investment fund, Value Partners Asset Allocation Fund, a sub fund of Value Partners Choice Investment Funds. The objective of the China HK Dynamic Asset Allocation Fund is to aim to achieve long-term capital growth potential with medium-high volatility through the Value Partners Asset Allocation Fund which (i) mainly invests in Hong Kong and China equities and debt securities, with up to 9% of its assets investing in exchange-traded funds that track the price of gold, and (ii) performs dynamic asset allocation. The China HK Dynamic Asset Allocation Fund is suitable to investors who are willing to accept an above average level of risk in order to aim to achieve long-term capital growth potential.
Depending on the China and Hong Kong market conditions, Value Partners Asset Allocation Fund may, through investing in other approved pooled investment funds, allocate between 10% to 90% of its assets to Hong Kong and China equities, with the remaining balance mainly invested in Hong Kong and China debt securities (including debt securities that are denominated in offshore Renminbi, "Offshore RMB Bonds") and up to 9% of its assets investing in exchangetraded funds that track the price of gold.
The equities will be selected from the FTSE MPF Hong Kong Index by the adoption of a screening model, which aims to identify investment opportunities within the FTSE MPF Hong Kong Index through analyzing multiple quantitative data such as valuation, return on equity, volatility, and market capitalisation.
The majority of the debt securities will be China and Hong Kong debt securities issued by (i) companies or issuers listed, established in or operating principally in·, or which derive or are expected to derive a significant portion of their earnings or revenues from or which have part of their assets, production activities or other business interests based in or related to China and/or Hong Kong, and (ii) governments and government related entities in China or Hong Kong. Offshore RMB Bonds may be invested, including fixed and floating rate securities, convertible bonds and notes issued or distributed outside China by sovereigns, government agencies, supranationals, banks, corporations and exempt authorities. Currently, debt securities issued within China will not be invested. Debt securities issued by issuers (including corporations, government and government related entities) established outside China and Hong Kong but within the Asian region, and which are linked to or have part of their operations, revenue, assets, production activities or other business interests based in or related to China and / or Hong Kong, may also be invested.
Value Partners Asset Allocation Fund, through investing in other approved pooled investment funds, may invest up to 9% of its assets in exchange-traded funds that track the price of gold and are approved by the MPF A as permissible investments from time to time.
The asset allocation of the Value Partners Asset Allocation Fund will change based on its investment manager's view on the economic and market outlook, with higher allocation to equity when equity market outlook is positive, balanced allocation between equity and debt securities when equity market outlook is neutral and higher allocation to debt securities and cash when equity market outlook is negative.
19

AIA MPF - PRIME VALUE CHOICE
INVESTMENT REPORT (CONTINUED) FOR THE YEAR ENDED 30TH NOVEMBER 2018
General Investment Climate
1. North American Eqnity Markets
The US market continued its upward trend to new all-time highs during the final month of 2017, capping off a strong year for US equities. Markets were optimistic as the sweeping tax r.eform bill was signed into law during the month in time for the new year. Over the year, equities experienced record inflows as incremental fundamental improvement and a rosy economic outlook had been a catalyst for US equity market outperformance.
The US equity markets continued to rally into the year 2018 as continued positive sentiment from tax reform and improving fundamentals of economic growth boosted investor confidence. In somewhat of a carryover effect, the optimism of tax reform passed into law in December of 2017 led to a sustained market rally in January as indices continued to push record highs. The US market underperformed in the month of February. The sell-off in equities from end of January intensified through the beginning of February as the S&P saw the worst daily performance since 2011 related to elevated volatility. The period of elevated volatility persisted as US equity markets ended the month of March further in the red. In the second quarter, the general theme seemed to be strength in underlying fundamentals signaling a continuously strong US economy while a series of disruptive geopolitical developments tapered index performance.
US equity index performance was largely positive as the Fed expressed confidence in the US economy, drowning out the noise from trade disputes with China which were consistently headline news as the Trump administration reiterated a hard line in trade negotiations. In July, there was scattered talk regarding tariff concessions with some US trading partners but the announcement of tariffs on approximately $200 billion worth of Chinese goods rendered other trade developments secondary.
Over the one-year period ending 30th November 2018, the Fund underperformed its benchmark index by 216bps on an HKD basis. From a sector perspective, the Industrials and Utilities sectors contributed the most to relative performance while Financials and Consumer Discretionary were the worst performing sectors over the one-year period. From a growth category perspective, Mature Turnaround names contributed the most to performance while the laggards were mostly in the Mature Cyclical life cycle categorization.
The Valuation factor continued to be volatile with some reversion in July, underperformance in August, then again some reversion as September came to a close. While Value ended slightly higher in the third quarter, model performance was bolstered by steady performance in Sentiment and Quality. There was a deterioration in Sentiment performance as well as Value which led to underperformance for the model in November.
While the equity markets bounced back after a painful October, there are looming concerns for equity investors as 2018 winds to a close. We have not seen the full effect of Chinese tariffs that are being implemented and will likely hear of more US companies being adversely affected by the Trump administration's trade policy absent a longer term trade agreement between the US and China. A major theme moving forward will be whether or not strength in the US economy is enough to give investors confidence or if the continued back and forth between the US and China results in avoidance of US equities.
20

AIA MPF - PRIME VALUE CHOICE
INVESTMENT REPORT (CONTINUED) FOR THE YEAR ENDED 30TH NOVEMBER 2018
General Investment Climate (continued)
2. European Equity Markets
European equity markets struggled in 2018, and returns were negative for almost all countries and sectors. The index overall fell by I 0% in local currency terms, with the best-performing sectors Utilities and Pharma. Real Estate and Financials were the worst performers. In country terms Norway was the best performer, and Greece was the worst.
After a strong start to the year equities started to struggle as the blistering pace of GDP growth from 201 7 started to slow, and the slowdown was very protracted, even though the overall rate of growth for the year was above trend at around or just under 2.0%. Central banks in the region retained a very accommodative policy and credit continued to expand. Corporate earnings for the year grew by a mid-single digits, but investors remained very cagy as a series of political events overshadowed sentiment. The new Italian government caused concerns as the populist coalition threatened to cause a confrontation with the EU over budget policy, and Italian bond yields moved sharply higher, although in the event the budget was adjusted to avoid breaching rules and spreads narrowed again. The UK continued to negotiate its departure from the EU, but Prime Minister May struggled to get the deal she had agreed past the UK Parliament, which increased the risk of a no-deal departure. More importantly internationally was President Trump's announcement of trade tariffs, which had a discernible effect on trade volumes and on corporate sentiment as companies struggled to plan for the impact on global supply chains.
The fact that earnings continued to grow, despite the negative sentiment engendered by politics, meant that equity valuations fell sharply during the year, and this leaves some support for 2019, given that earnings are expected to grow this year as well. Relative to bonds and cash equities look especially attractive, but we will have to see ifthere is a positive outcome to the UK's exit process and to the trade tensions globally before trusting that sentiment will turn decisively better.
3. Pacific Asia Equity Markets
Asian equities had a challenging year in 2018. Positive tailwinds supporting markets two years ago including a synchronized global recovery, weaker US dollar and positive earnings revisions all reversed their courses and became headwinds. In addition, rising trade frictions between the US and China further exacerbated risk aversion and market volatility. All Asian markets corrected against this backdrop. Thailand and Malaysia held up relatively better while Korea, China and the Philippines suffered badly. Overall, growth sectors notably consumer discretionary and technology underperformed.
Looking ahead, there are apparent reasons why investors would remain cautious towards Asian equities. However, one principal reminder is that Asia tends to outperform the developed markets when the US dollar weakens. We have already seen it retracing some of its gains towards the end of 2018, and a narrower spread in policy rate and growth expectations between the US and the rest of the world should favour a continuous US dollar retracement.
21

AIA MPF - PRIME VALUE CHOICE
INVESTMENT REPORT (CONTINUED) FOR THE YEAR ENDED 30TH NOVEMBER 2018
General Investment Climate (continned)
3. Pacific Asia Eqnity Markets ( continned)
Policy should also become a tailwind in 2019, with governments of China and Korea expected to further implement accommodative monetary/ fiscal/ administrative policies to boost domestic growth. Most importantly, we believe there are ample opportunities spanning from premium and quality businesses that we closely monitor in Asia which, at current valuation levels, are compelling long term investment candidates. The headline valuation of Asia ex Japan, as measured by trailing price-to-book, is I standard deviation below its average since 1995. Our Expected Return framework indicates the region is forecasted to generate a compound annualized return of 15.5% over the next 5 years, compared to 8.7% as of end-December 2017. Both indicators underline the possibility that much of the risks are already in the price.
Overall, considering risks to gradually subside and fundamentals remain solid, we remain constructive towards long term growth of Asia.
4. Global Bond Markets
2018 is set to be the worst year on record for returns across a broad spectrum of assets. Indeed at 89%, in USD terms this is the worst year ever with data back to 190 I, after 2017 was the best year ever by the same measure. We have seen a regime change in developed countries: between 2010 and 2017, growth was on average below trend, but central banks were doing Quantitative Easing ("QE") and keeping interest rates around or below zero and volatility kept decreasing. Over the last 18 months or so growth has generally improved but importantly for financial markets, central banks have moved from peak QE to Quantitative Tightening, resulting in assets being correlated on the downside and volatility rising sharply. The story for local currency returns might not be quite so dramatic given the dollar has had a strong year, but a similar story holds true with 2018 being very close to being the worst year on record on this measure.
The year has been characterized by a trade war between the US and mainly China, further political turmoil in Europe - this time Italy and the UK taking the spotlight - while the Fed kept the auto-pilot and raised interest rates four times this year. Government bonds in the G4 markets had a mixed performance with the US underperforming while German bunds outperforming. The I 0years UST was at 2.41 % at the beginning of the period and closed at 2.99%. JGBs moved from 0.04% to 0.09%, UK Gilts from 1.33% to 1.36% and I 0years Bunds went from 0.37% to 0.31 %. At the same time, credit markets had a very poor year with the US posting negative excess returns of l 50bps during the period while these returns were negative 220 in Europe and negative 260bps in the UK. In terms of currencies, the USD had a very strong 12 months appreciating against all GIO currencies except the NZD; the DXY index moved from 93.0 to 97.3. Finally, the oil had a volatile year, but it ended pretty much where it started 12 months ago.
22

AIA MPF - PRIME VALUE CHOICE
INVESTMENT REPORT (CONTINUED) FOR THE YEAR ENDED 30TH NOVEMBER 2018
General Investment Climate (continued)
5. Asia Bond Markets
2018 has been a transition year to a higher volatility regime, to the late stages of the economic cycle, and to a world of quantitative tightening. Investors have had to contend with rising US central bank interest rates, a sharp slowdown in eurozone business confidence, weaker Chinese growth and rising geopolitical concerns, including Brexit, Italian politics and the ongoing trade conflict between the US and China.
In the US, the Fed raised interest rates four times, by 25 bps each time over this period, on the back of strong and broad-based growth in the US. The rate hikes the Fed has delivered this year have brought it closer to being to the neutral fed funds rate which neither stimulates nor restrains growth. U.S. policy normalization has continued at a slow and steady pace. Over the period, The Fed has lifted its short-term Fed Funds rates by 1 00bps and started to shrink its balance sheet in an effort to normalize its policy stance and to give it added simulative capacity if needed. The ECB did not raise rates during this period; confrrmed that it will cease net asset purchases at the end of this year, in line with its previous guidance. President Mario Draghi had previously stated that the central bank's key interest rates would stay at their present levels "at least through the summer of2019".
In China, headline data pointed out to continued weakness in the economy, with decade-low real GDP growth rate, due to rising internal and external uncertainties since February 2018, the Chinese government has kept stepping up its counter-cyclical economic policies. The monetary easing started with the PBoC's RRR cuts in April, July and October of 2018. PBoC introduced targeted medium-term lending facility, Targeted re-lending and MLF to stimulate bank's lending to SME's. China's Ministry of Finance reversed its fiscal consolidation measures since July 2018 and improved financial conditions of local government bonds and tax reductions.
In the local currencies space, most Asia local currencies depreciated against USD during this period, driven majorly by unexpected US exceptionalism which propelled USD higher amidst a desynchronization of global growth, and against Europe and China in particular. Trade conflict, Brexit and Italian budget stress also contributed to a challenging environment. The Marki! iBoxx Asian Local Bond Indices returned -0.88%. In Asia USD credit market, the J.P. Morgan Asia Credit Index returned -1.92% over this period as the credit spread widened on the back of trade war headlines uncertainties, tightening in financial conditions and softer economic data. Technical factor for Asian credit remained relatively weak driven by high market volatility and weak sentiment.
23

AIA MPF - PRIME VALUE CHOICE
INVESTMENT REPORT (CONTINUED) FOR THE YEAR ENDED 30TH NOVEMBER 2018
Trustee's Commentary
A. Trustee's Commentary on analysis of the investments held by the scheme and supporting information of its commentary
Annualized return (in terms of%) I vear 5 vears 10 years Since Launch
Growth Portfolio -7.62 2.87 7.51 4.88 Launch date: 01/12/2000 Benchmark/ Performance Target -7.30 3.06 7.45 4.01 (Lipper MPF Lifestyle (>80-100% Eauitv) Fund Category median) Deviation from the benchmark I -0.32 -0.19 0.06 0.87 oerformance tarn:et Trustee's Commentary The fund underperformed the market median in I year and
5 years but it outperformed the market median in IO years and since launch.
During the past financial period ended 30th November 2018, the major weak areas of the portfolio were Japanese, Asian and European security selection. Asset allocation was a neutral contributor and other geographical areas were in aggregate positive, specially US and HK stock selection. The stock selection in Japan, Asian, and European equities mainly detracted from the performance.
Annualized return (in terms of%) I vear 5 vears 10 vears Since Launch
Balanced Portfolio -6.30 1.26 4.65 3.90 Launch date: 01/12/2000 Benchmark/ Performance Target -5.17 1.63 4.88 3.63 (Lipper MPF Lifestyle (>40-60% Equity) Fund Category median) Deviation from the benchmark I -1. I 3 -0.37 -0.23 0.27 performance target Trustee's Commentary The fund underperformed the market median in I year, 5
years, and IO years but it outperformed since launch.
During the past financial period ended 30 November 2018, within the fund's equity holdings, the overweight to US Equities as well as the positions in HK Equities were the top contributors. Meanwhile, the fund's positions in Far East Equities (ex Japan ex HK), Japanese Equities, and European Equities detracted from performance. As for fixed income, the underweight to Global Fixed Income detracted from performance, while the positions in Asian Bond remained neutral. Overall, security selection was the major detractor over the I-Year period, while asset allocation detracted yet to a lesser extent on a relative basis.
24

AIA MPF - PRIME VALUE CHOICE
INVESTMENT REPORT (CONTINUED) FOR THE YEAR ENDED 30TH NOVEMBER 2018
Trustee's Commentary (continued)
Annualized return (in terms of%) I vear 5 vears 10 vears Since Launch
Capital Stable Portfolio -4.92 0.65 3.19 3.33 Launch date: 01/12/2000 Benchmark/ Performance Target -4.46 0.80 3.40 3.25 (Lipper MPF Lifestyle (>20-40% Equitv) Fund Cate!!orv median) Deviation from the benchmark I -0.46 -0.15 -0.21 0.08 performance tarl(et Trustee's Commentary The fund underperformed the market median in I year, 5
years, and IO years but it outperformed since launch.
During the past financial period ended 30 November 2018, within the fund's equity holdings, the overweight to US Equities was the primary contributor. Meanwhile, the fund's overweight to Far East Equities (ex Japan ex HK) as well as the positions in Japanese Equities and European Equities detracted from performance. As for fixed income, the underweight to Global Fixed Income detracted from performance, while the positions in HK Fixed Income and Asian Bond were the major contributors. Overall, security selection was the major detractor over the I-Year period, while asset allocation detracted yet to a lesser extent on a relative basis.
Annualized return ( in terms of%) I vear 5 vears 10 vears Since Launch
Guaranteed Portfolio 0.150 0.290 1.090 1.660 Launch date: 01/12/2000 Benchmark/ Performance Target 0.024 0.010 0.009 0.472 (MPF Prescribed Savings Rates for Caoital Preservation) Deviation from the benchmark oerformance tarl(et
I 0.126 0.280 1.081 1.188
Trustee's Commentary The fund outperformed the MPF Prescribed Savings Rates for Capital Preservation in I year, 5 years, IO years, and since launch.
Annualized return ( in terms of % ) I vear 5 vears 10 vears Since Launch
MPF Conservative Fund 0.580 Launch date: 01 I 12/2000
0.210 0.170 0.650
Benchmark/ Performance Target 0.024 0.010 0.009 0.472 (MPF Prescribed Savings Rates for Caoital Preservation) Deviation from the benchmark I 0.556 0.200 0.161 0.178 performance target Trustee's Commentary The fund outperformed the MPF Prescribed Savings Rates
for Capital Preservation in I year, 5 years, IO years, and since launch.
25

AIA MPF - PRIME VALUE CHOICE
INVESTMENT REPORT (CONTINUED) FOR THE YEAR ENDED 30TH NOVEMBER 2018
Trustee's Commentary (continued)
Annualized return (in terms of%) 1 year 5 years 10 years Since Launch
Hong Kong Equity Fund -8.32 0.53 6. 16 7.09 Launch date: 01/01/2002 Benchmark/ Performance Target -10.20 3.43 8.55 8.61 {Lipper MPF Hong Kong Equity Fund category median) Deviation from the benchmark I 1.88 -2.90 -2.39 -1.52 performance target Trustee's Commentary The fund outperformed the market median in 1 year but
underperformed the market median in 5 years, 1 0 years, and since launch.
During the past financial period ended 30th November 2018, the funds' relative underperformance narrowed substantially and peer ranking improved notably. This was helped by further strengthening of the stock selection process.
Annualized return ( in terms of%) I vear 5 years 10 years Since Launch
European Equity Fund -12.47 0.49 6.91 4.36 Launch date: 01/01/2002 Benchmark/ Performance Target -8.65 0.64 6.51 . 2.41 (Lipper MPF European Equity Fund category median) Deviation from the benchmark I -3.82 -0.15 0.40 1.95 performance target Trustee's Commentary The fund underperformed the market median in 1 year and
5 years but it outperformed the market median in IO years and since launch.
During the past financial period ended 30 November 2018, the fund performance was mainly detracted by stock selection in capital goods, consumer durables and apparel sectors. The effect was partly offset by stock selection in food beverage and tobacco, and pharmaceuticals biotechnology which contributed positively to the fund.
26

AIA MPF - PRIME VALUE CHOICE
INVESTMENT REPORT (CONTINUED) FOR THE YEAR ENDED 30TH NOVEMBER 2018
Trustee's Commentarv (continued)
Annualized return (in terms of%)
1 year 5 years 10 years Since Launch Japan Equity Fund -10.95 2.26 5.28 3.10 Launch date: 01/01/2002
Benchmark / Performance Target -7.87 2.40 4.79 3.21 (Lipper MPF Japan Equity Fund category median) Deviation from the benchmark I -3.08 -0.14 0.49 -0.11performance target Trustee's Commentary The fund underperformed the market median in 1 year, 5
years, and since launch returns but it outperformed the market median in 10 years.
During the past financial period ended 30th November 2018, Japanese equities were volatile, with Japan's broad market index (TOPIX) falling over -13% in USD terms. Global economic slowdown and earnings downgrades have weighed on markets. Both sector allocation and stock selection detracted from the performance. The positive contribution from stock selection in basic materials and industrials was more than offset by the detraction from the underweight and stock selection in consumer services.
Annualized return (in terms of%) 1 year 5 years 10 years Since Launch
North American Equity Fund 2.03 8.00 12.31 5.03 Launch date: 01/01/2002
Benchmark / Performance Target 4.04 7.99 11.56 4.17 (Lipper MPF United States Equity Fund category median) Deviation from the benchmark I -2.01 0.01 0.75 0.86 performance target Trustee's Commentary The fund underperformed the market median in 1 year but
it outperformed the median in 5 years, 10 years and since launch.
During the past financial period ended 30th November 2018, from a sector perspective, the Industrials and Utilities sectors contributed the most to relative performance while Financials and Consumer Discretionary were the worst performing sectors.
27

AIA MPF - PRIME VALUE CHOICE
INVESTMENT REPORT (CONTINUED) FOR THE YEAR ENDED 30TH NOVEMBER 2018
Trustee's Commentary (continued)
Annualized return ( in terms of % ) 1 year 5 years 10 years Since Launch
Asian Equity Fund -7.99 1.24 8.70 5.79 Launch date: 01/12/2004 Benchmark/ Performance Target -7.99 2.40 7.89 4.64 (Lipper MPF Asia ex Japan HK Equity Fund category median) Deviation from the benchmark I - -1.16 0.81 1.15 performance target Trustee's Commentary The fund's performance was in-line with market median in
1 year, and outperformed the market median in 10 years, and since launch while its performance underperformed the market median in 5 years.
During the past financial period ended 30 November 2018, fund performance was contributed by overweight position in energy sector and India markets. However, underweight position in utilities sector and stock selection in technology sector detracted the fund performance.
Annualized return ( in terms of%) 1 vear 5 vears 10 years Since Launch
Greater China Equity Fund -10.26 0.86 6.62 5.17 Launch date: 01/12/2004 Benchmark/ Performance Target -10.95 3.26 7.80 5.17 (Lipper MPF Greater China Equity Fund category median) Deviation from the benchmark I 0.69 -2.40 -1.18 -performance target Trustee's Commentary The fund outperformed the market median in 1 year but it
underperformed the market median in 5 years and 10 years.
During the past fmancial period ended 30th November 2018, the funds' relative underperformance narrowed substantially and peer ranking improved notably. This was helped by further strengthening of the stock selection process.
28

AIA MPF - PRIME VALUE CHOICE
INVESTMENT REPORT (CONTINUED) FOR THE YEAR ENDED 30TH NOVEMBER 2018
Trustee's Commentary (continued)
Annualized return (in terms of%) I year 5 vears IO years Since Launch
Allianz Capital Stable Fund NIA NIA NIA NIA Launch date: 01/09/2005 Benchmark I Performance Target NIA NIA NIA NIA Deviation from the benchmark I NIA NIA NIA NIA performance target Trustee's Commentary The AIA Allianz Capital Stable Fund ("the Fund") had no
investments and operations since 15th November 2018. Mandatory Provident Fund Schemes Authority had approved the termination of the Fund to take effect on 13th March 2019.
Annualized return ( in terms of%) I year 5 years 10 years Since Launch
Allianz Growth Fund NIA NIA NIA NIA Launch date: 01/09/2005 Benchmark I Performance Target NIA NIA NIA NIA Deviation from the benchmark I NIA NIA NIA NIA performance target Trustee's Commentary The AIA Allianz Growth Fund ("the Fund") had no
investments and operations since 15th November 20 I 8. Mandatory Provident Fund Schemes Authority had approved the termination of the Fund to take effect on 13th March 2019.
Annualized return (in terms of%) I year 5 years 10 years Since Launch
Allianz Stable Growth Fund NIA NIA NIA NIA Launch date: 01/09/2005 Benchmark I Performance Target NIA NIA NIA NIA Deviation from the benchmark I NIA NIA NIA NIA performance target Trustee's Commentary The AJA Allianz Stable Growth Fund ("the Fund") had
no investments and operations since 15th November 2018. Mandatory Provident Fund Schemes Authority had approved the termination of the Fund to take effect on 13th March 2019.
29
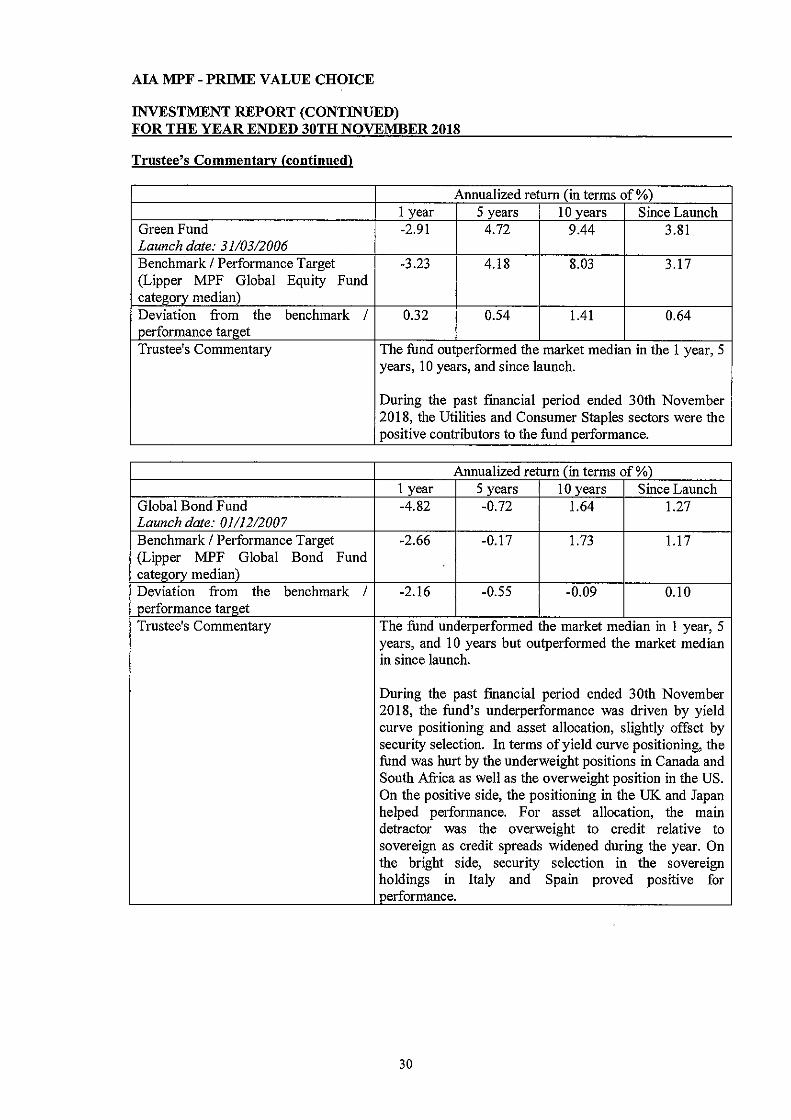
AIA MPF - PRIME VALUE CHOICE
INVESTMENT REPORT (CONTINUED) FOR THE YEAR ENDED 30TH NOVEMBER 2018
Trustee's Commentary {continued)
Annualized return ( in terms of%) 1 year 5 years 10 vears Since Launch
Green Fund -2.91 4.72 9.44 3.81 Launch date: 31/03/2006 Benchmark / Performance Target -3.23 4.18 8.03 3.17 (Lipper MPF Global Equity Fund category median) Deviation from the benchmark I 0.32 0.54 1.41 0.64 performance target Trustee's Commentary The fund outperformed the market median in the 1 year, 5
years, 10 years, and since launch.
During the past fmancial period ended 30th November 2018, the Utilities and Consumer Staples sectors were the positive contributors to the fund performance.
Annualized return ( in terms of%) 1 year 5 years 10 years Since Launch
Global Bond Fund -4.82 -0.72 1.64 1.27 Launch date: 01/12/2007 Benchmark/ Performance Target -2.66 -0.17 1.73 1.17 (Lipper MPF Global Bond Fund category median) Deviation from the benchmark I -2.16 -0.55 -0.09 0.10 performance target Trustee's Commentary The fund underperformed the market median in 1 year, 5
years, and 10 years but outperformed the market median in since launch.
During the past fmancial period ended 30th November 2018, the fund's underperformance was driven by yield curve positioning and asset allocation, slightly offset by security selection. In terms of yield curve positioning, the fund was hurt by the underweight positions in Canada and South Africa as well as the overweight position in the US. On the positive side, the positioning in the UK and Japan helped performance. For asset allocation, the main detractor was the overweight to credit relative to sovereign as credit spreads widened during the year. On the bright side, security selection in the sovereign holdings in Italy and Spain proved positive for performance.
30

AIA MPF - PRIME VALUE CHOICE
INVESTMENT REPORT (CONTINUED) FOR THE YEAR ENDED 30TH NOVEMBER 2018
Trustee's Commentary (continued)
Annualized return ( in terms of % ) 1 vear 5 years 10 years Since Launch
World Fund -1.11 4.72 9.22 2.80 Launch date: 01/12/2007 Benchmark/ Performance Target 0.66 5.43 9.85 3.26 (50% S&P 500 Index + 30% MSCI EAFE Index + 20% S&P Latin America 40 Index) Deviation from the benchmark I -1.77 -0.71 -0.63 -0.46 nerformance target Trustee's Commentary The fund's performance has underperformed 1 year, 5 years,
10 years, and since launch returns when compared with its benchmark. The underperformance is mainly due to asset allocation, fee differences, cashflow, and tracking difference between the underlying ITCISs and their underlying benchmarks.
Annualized return ( in terms of % ) 1 vear 5 vears 10 vears Since Launch
Manager's Choice Fund -6.72 2.13 7.62 5.22 Launch date: 01/08/2008 Benchmark/ Performance Target -5.17 1.63 4.88 3.63 (Lipper MPF Lifestyle (>40-60% Equitv) Fund Category median) Deviation from the benchmark I -1.55 0.50 2.74 1.59 performance target Trustee's Commentary Over the I year period ending 30 November 2018, the
underperformance was driven by negative security selection in European Equities, Far East Equities ( ex Japan ex HK) and overweight to HK Equities and underweight to Global Fixed Income. Overall, security selection was the major detractor over the 1-Y ear period, yet asset allocation also contributed to the underperformance but to a lesser extent on a relative basis. The Fund is a total-return focused strategy as it seeks to achieve real return outcomes with moderate volatility over market cycles which the Investment Manager measure over rolliµg 5 year cycles.
31

AIA MPF - PRIME VALUE CHOICE
INVESTMENT REPORT (CONTINUED) FOR THE YEAR ENDED 30TH NOVEMBER 2018
Trustee's Commentary (continued)
Annualized return (in terms of%) 1 year 5 years 10 years Since Launch
Fidelity Capital Stable Fund -3.93 0.99 NIA 1.78 Launch date: 01/12/2010 Benchmark I Performance Target -4.46 0.80 NIA 1.50 (Lipper MPF Lifestyle (>20-40% Equity) Fund Catee:orv median) Deviation from the benchmark I 0.53 0.19 NIA 0.28 performance target Trustee's Commentary The fund outperformed the market median in the 1 year, 5
years, and since launch.
During the past financial period ended 30 November 2018, the performance of the fund was mainly contributed by overweighting in US equities, security selection in technology sector in Asia market, and underweight positions in the peripheral bonds of Italy. The effect was partly offset by overweighting Hong Kong equities, positions in industrial engineering sector in Japan market, and underweighting bonds which detracted from performance.
Annualized return (in terms of%) 1 year 5 years 10 years Since Launch
Fidelity Stable Growth Fund -4.76 2.48 NIA 3. 15 Launch date: 01/12/2010 Benchmark I Performance Target -5.17 1.63 NIA 2.64 (Lipper MPF Lifestyle (>40-60% Equity) Fund Catee:ory median) Deviation from the benchmark I 0.41 0.85 NIA 0.51 performance target Trustee's Commentary The fund outperformed the market median in the 1 year, 5
years, and since launch.
During the past financial period ended 30 November 2018, the performance of the fund was mainly contributed by overweighting in US equities, security selection in technology sector m Asia market, and underweight positions in the peripheral bonds of Italy. The effect was partly offset by overweighting Hong Kong equities, positions in industrial engineering sector in Japan market, and underweighting bonds which detracted from performance.
32

AIA MPF - PRIME VALUE CHOICE
INVESTMENT REPORT (CONTINUED) FOR THE YEAR ENDED 30TH NOVEMBER 2018
Trustee's Commentary (continued)
Annualized return ( in terms of%) 1 vear 5 vears 10 years Since Launch
Fidelity Growth Fund -6.69 3.15 NIA 3.90 Launch date: Olli 2/2010 Benchmark I Performance Target -7.30 3.06 NIA 3.91 (Lipper MPF Lifestyle (>80-100% Eouity) Fund Category median) Deviation from the benchmark I 0.61 0.09 NIA -0.01 performance target Trustee's Commentary The fund outperformed the market median in I year, and 5
years while its performance is in-line with median in since launch.
During the past financial period ended 30 November 2018, the performance of the fund was mainly contributed by overweighting in US equities, security selection in technology sector in Asia market, and exposure to Chinese oil and gas companies in Hong Kong market. The effect was partly offset by positions in industrial engineering sector in Japan market, stock selection in healthcare sector in Europe market, and underweighting in bonds which detracted from fund performance.
Annualized return ( in terms of % ) I vear 5 vears 10 years Since Launch
Asian Bond Fund -0.93 0.88 NIA 0.89 Launch date: 23/09/2011 Benchmark I Performance Target -1.26 0.76 NIA 0.89 (Lipper MPF Asian Bond category median) Deviation from the benchmark I 0.33 0.12 NIA 0.00 performance target Trustee's Commentary The fund was in-line with since launch performance, and
outperformed market median in 1 year and 5 years.
During the past financial period ended 30 November 2018, the allocation position and security selection in CNH and THB denominated bonds contributed to the fund performance while the underweight exposure to KR W denominated bonds and the currency detracted the performance.
hedges placed
33
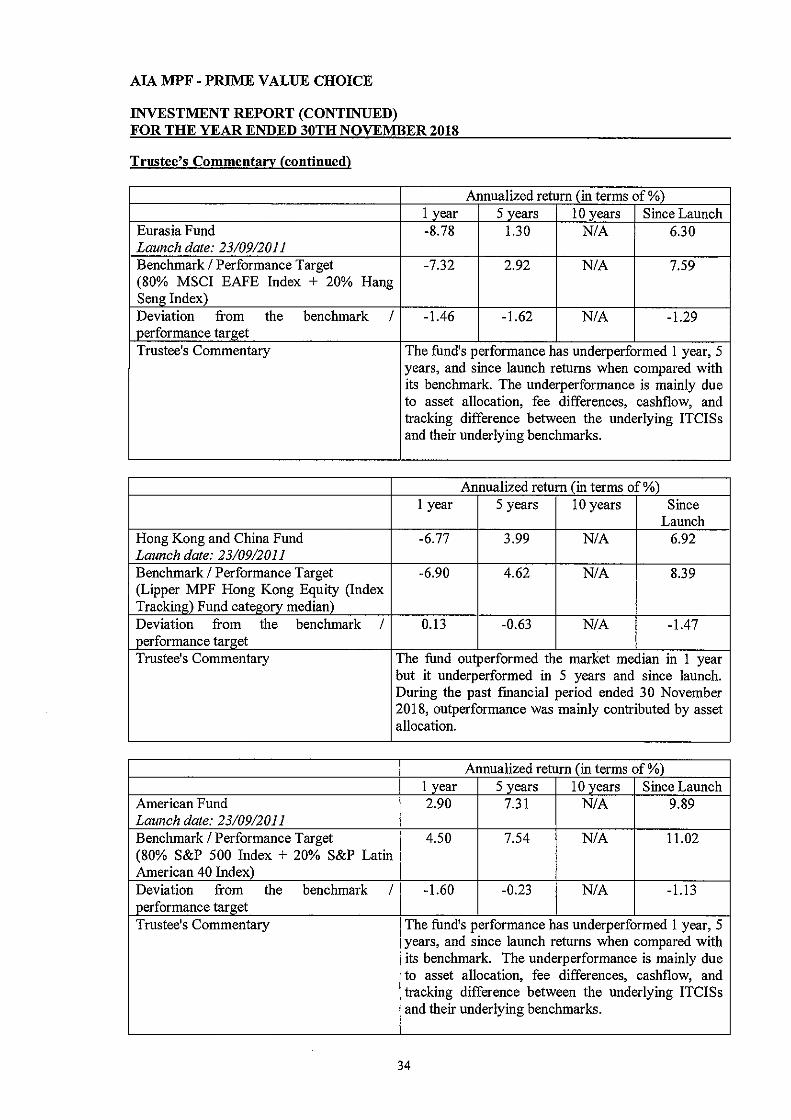
AJA MPF - PRIME VALUE CHOICE
INVESTMENT REPORT (CONTINUED) FOR THE YEAR ENDED 30TH NOVEMBER 2018
Trustee's Commentary (continued)
Annualized return ( in terms of % ) 1 year 5 years 10 years Since Launch
Eurasia Fund -8.78 1.30 NIA 6.30 Launch date: 23/09/2011 Benchmark I Performance Target -7.32 2.92 NIA 7.59 (80% MSCI EAFE Index + 20% Hang Seng Index) Deviation from the benchmark I -1.46 -1.62 NIA -1.29 performance target Trustee's Commentary The fund's performance has underperformed 1 year, 5
years, and since launch returns when compared with its benchmark. The underperformance is mainly due to asset allocation, fee differences, cashflow, and tracking difference between the underlying ITCISs and their underlying benchmarks.
Annualized return ( in terms of%) I year 5 years 10 years Since
Launch Hong Kong and China Fund -6.77 3.99 NIA 6.92 Launch date: 23/09/2011 Benchmark I Performance Target -6.90 4.62 NIA 8.39 (Lipper MPF Hong Kong Equity (Index Tracking) Fund category median) Deviation from the benchmark I 0.13 -0.63 NIA -1.47 performance target Trustee's Commentary The fund outperformed the market median in 1 year
but it underperformed in 5 years and since launch. During the past financial period ended 30 November 2018, outperformance was mainly contributed by asset allocation.
Annualized return ( in terms of % ) I year 5 years 10 years Since Launch
American Fund 2.90 7.31 NIA 9.89 Launch date: 23/09/2011 Benchmark I Performance Target 4.50 7.54 NIA 11.02 (80% S&P 500 Index + 20% S&P Latin American 40 Index) Deviation from the benchmark I -1.60 -0.23 NIA -1.13 performance target Trustee's Commentary The fund's performance has underperformed I year, 5
years, and since launch returns when compared with its benchmark. The underperformance is mainly due to asset allocation, fee differences, cashflow, and tracking difference between the underlying ITCISs and their underlying benchmarks.
34

AJA MPF - PRIME VALUE CHOICE
INVESTMENT REPORT (CONTINUED) FOR THE YEAR ENDED 30TH NOVEMBER 2018
Trustee's Commentary (continned)
Annualized return ( in terms of % ) I vear 5 vears 10 years Since Launch
Age 65 Plus Fund -0.93 NIA NIA 1.24 Launch date: 01/04/2017 Benchmark I Performance Target -1.05 NIA NIA 1.40 (Willis Towers Watson - MPF DIS Reference Portfolio - Age 65 Plus Fund) Deviation from the benchmark I 0.12 NIA NIA -0.16 oerformance tar<!et Trustee's Commentary The fund outperformed the Reference Portfolio in 1
year return while underperformed Reference Portfolio in the since launch return. The difference of cashflow pattern between the Constituent Fund and the underlying fund as well as the tracking difference between the underlying fund and its underlying benchmark were the main reasons of the since launch underperformance.
Annualized return ( in terms of % )
1 vear 5 vears 10 vears Since Launch Core Accumulation Fund -1.15 NIA NIA 4.00 Launch date: 01/04/2017 Benchmark I Performance Target -1.21 NIA NIA 4.37 (Willis Towers Watson - MPF DIS Reference Portfolio - Core Accumulation Fund) Deviation from the benchmark I 0.06 NIA NIA -0.37 performance target Trustee's Commentary The fund outperformed the Reference Portfolio in 1
year return while underperformed Reference Portfolio in the since launch return. The difference of cashflow pattern between the Constituent Fund and the underlying fund as well as the tracking difference between the underlying fund and its underlying benchmark were the main reasons of the since launch underperformance.
35

AIA MPF - PRIME VALUE CHOICE
INVESTMENT REPORT (CONTINUED) FOR THE YEAR ENDED 30TH NOVEMBER 2018
Trustee's Commentary (continned)
Annualized return ( in terms of%)
I year 5 years 10 vears Since Launch China HK Dynamic Asset Allocation Fund -1.16 NIA NIA 5.08 Launch date: 04/07/2017 Benchmark I Performance Target -3.00 NIA NIA 4.95 (50% FTSE MPF HK+ 25% Markit iBoxx ALB! HK+ 25% HK 3m HIBOR) Deviation from the benchmark I 1.84 NIA NIA 0.13 performance target Trustee's Commentary The fund's performance has outperformed I year and
smce launch returns when compared with its benchmark.
When the market was performing well in the second half of 2017, the fund had a higher weightage in equities (approx. 70%). Meanwhile, the fund only had a less than 30% weighting in the more defensive VP China HK Bond and Gold Fund. This relatively more aggressive positioning of the underlying AP!Fs was the primary reason for the fund's positive performance in comparison to its peers and the portfolio benchmark.
36

AIA MPF - PRIME VALUE CHOICE
INVESTMENT REPORT (CONTINUED) FOR THE YEAR ENDED 30TH NOVEMBER 2018
Trustee's Commentary (continued)
B. Supporting Information in relation to trustee's assessment framework for deriving its commentary and trustee's action, if any, to address its concerns raised in its commentary in Section A
The Board of Directors of the Trustee ("the Board") meets on a regular basis to review the result of fund performance monitoring of the AJA MPF - Prime Value Choice ("the Scheme") conducted by the Fund Review Committee, a governance committee established by the Board, which comprises of relevant functional heads. The performance of constituent funds under the Scheme are assessed regularly against relevant market medians and benchmarks. During the year ended 30th November 2018, 13 constituent funds in the Scheme aligned with or outperformed the market medians / benchmarks. Proper actions had been taken on the constituent funds with underperformance issues. This includes short term actions such as requesting investment manager to provide more regular updates on the funds' strategies and attributions and longer term ones such as requesting a full review of the investment process and an action plan for improving the fund performance.
With effect on 20th September 2018, the Greater China Equity Fund and Hong Kong Equity Fund under the Scheme ("the Relevant Equity Funds") had been restructured from feeder fund to portfolio management fund structure, allowing investment in more than one Approved Pooled Investment Fund ("APIF") and/or Index-Tracking Collective Investment Scheme ("ITCIS"). JF Asset Management Limited had been appointed as the new investment manager of the Relevant Equity Funds. It is believed that the changes will generate a more consistent return of the Relevant Equity Funds in the long run.
With effect on 15th November 2018, the Allianz Growth Fund, Allianz Stable Growth Fund, and Allianz Capital Stable Fund under the Scheme ("the Allianz Funds") had no operations and investments. The redemption proceeds of the Allianz Funds had been transferred to, and used to acquire units in, each of the Fidelity Growth Fund, Fidelity Stable Growth Fund, and Fidelity Capital Stable Fund respectively. MPF A approved the termination of the Allianz Funds to take effect on 13th March 2019. It is believed that the changes would simplify the choice of the constituent funds available under the Scheme and enhance its overall competitiveness in terms of fund performance.
The Scheme recorded a positive return during the year and the Investment Report set forth on pages 38 to 71 serves to summarise the following:
a) Investment Valuations; b) Investment Performance; c) Investment Portfolio; and d) Statement of Movement in Portfolio Holdings.
37

AJA MPF- PRIME VALUE CHOICE
INVESTMENT REPORT (CONTINUED) FOR T_llE YEAR ENDED 30TH NOVEMBER 2018 a) Investment Valnations
Contribution monies received during the year were invested into the following constituent funds based on the investment options chosen by the Scheme members. Their net asset value positions at year end are summarised as follows:
As at 30th November 2018 Investments (% of net asset value) Other assets/(]iabilities) (% of net asset value) Closing net asset value
Net asset value per unit
As at 30th November 2017 Investments (% of net asset value) Other assets/(]iabilities) (% of net asset value) Closing net asset value
Net asset value per unit
Growth Portfolio
HK$
10,530,985,402 96.71%
358,790,124 3.29%
10,889,775,526
235.77
12,327,767,383 /00.08%
(9,463,798) (0.08%}
12,318,303,585
255.23
Balanced Portfolio
HK$
5,102,134,197 94.10%
319,711,018 5.90%
5,421,845,215
199.16
5,506,146,912 94.66%
310,535,802 5.34%
5,816,682,714
212.56
38
Capital Stable Guaranteed MPF Portfolio Portfolio Conservative Fund
HK$ HK$ HK$
3,109,760,235 9,168,614,948 5,358,106,261 89.41% 100.03% 99.78%
368,453,227 (2,682,313) 11,722,043 10.59% (0.03%} 0.22%
3,478,213,462 9,165,932,635 5,369,828,304
180.33 NIA 112.34
3,296,920,687 8,205,078,039 4,252,337,870 90.80% 100.01% 100.02%
334,138,614 (614,827) (1,012,456) 9.20% (0.01%) (0.02%)
3,631,059,301 8,204,463,212 4,251,325,414
189.66 NIA 111.69

AJA MPF - PRIME VALUE CHOICE
INVESTMENT REPORT (CONTINUED) FOR THE YEAR ENDED 30TH NOVEMBER 2018
a) Investment Valuations ( continued)
Hong Kong European Japan North American Asian Equity Fund Equity Fund Equity Fund Equity Fund Equity Fund
HK$ HK$ HK$ HK$ HK$ As at 30th November 2018 Investments 5,994,590,747 1,449,718,959 662,964,708 2,499,986,790 3,954,418,559 (% of net asset value) 100.25% 100.20% 100.37% 100./4% 100.18% Other assets/(liabilities) (15,157,282) (2,827,982) (2,472,191) (3,613,287) (7,009,397) (% of net asset value) (0.25%) (0.20%) (0.37%) (0.14%) (0.18%) Closing net asset value 5,979,433,465 1,446,890,977 660,492,517 2,496,373,503 3,947,409,162
Net asset value per unit 318.78 205.84 167.51 229.49 219.97
As at 30th November 2017 Investments 6,736,249,763 1,727,869,690 750,128,734 2,295,704,110 4,450,838,370 (% of net asset value) 100.07% 100.15% 100.37% 100.23% 100.30% Other assets/(liabilities) (4,822,576) (2,510,926) (2,763,822) (5,278,213) (13,138,225) (% of net asset value) (0.07%) (0.15%) (0.37%) (0.23%) (0.30%) Closing net asset value 6,731,427,187 1,725,358,764 747,364,912 2,290,425,897 4,437,700,145
Net asset value per unit 347.72 235.16 188.10 224.93 239.07
39

AIA MPF - PRIME VALUE CHOICE
INVESTMENT REPORT (CONTINUED) FOR THE YEAR ENDED 30TH NOVEMBER 2018
a) Investment Valnations (continned)
Allianz Capital Allianz Growth Allianz Stable Greater China Stable Fund Fund Growth fund Green
Equity Fund Note i Note i Note i Fund HK$ HK$ HK$ HK$ HK$
As at 30th November 2018 lnvestments 6,813,678,268 - 1,852,870,067 (% of net asset value) 100.21% NIA NIA NIA 100.12% Other assetsl(liabilities) (14,065,603) - (2,241,028) (% of net asset value) (0.21%) NIA NIA NIA (O.J2%) Closing net asset value 6,799,612,665 - - 1,850,629,039
Net asset value per unit 202.61 NIA NIA NIA 160.62
As at 30th November 2017 Investments 8,026,981,823 408,303,580 1,099,968,179 794,286,225 1,827,780,805 (% of net asset value) JOO.23% IOO.J8% JOO.JO% JOO.11% JOO.OJ% Other assetsl(liabilities) (18,704,367) (733,486) (1,058,900) (880,576) (171,930) (% of net asset value) (0.23%) [O.J8%) co.JO%) (0.11%) (O.OJ%) Closing net asset value 8,008,277,456 407,570,094 1,098,909,279 793,405,649 1,827,608,875
Net asset value per unit 225.78 142.54 195.81 164.81 165.44
Note i : Allianz Capital Stable Fund, Allianz Growth Fund and Allianz Stable Growth Fund ("the 3 Allianz Funds") had no investments and operations since 15th November 2018. MPFA had approved the termination of the 3 Allianz Funds to take effect on 13th March 2019.
40

AIA MPF - PRIME VALUE CHOICE
INVESTMENT REPORT (CONTINUED) FOR THE YEAR ENDED 30TH NOVEMBER 2018
a) Investment Valnations ( con tinned)
Global World Manager's Fidelity Capital Fidelity Stable Bond Fund Fund Choice Fund Stable Fund Growth Fund
HK$ HK$ HK$ HK$ HK$ As at 30th November 2018 Investments 1,517,266,766 1,334,015,963 4,183,082,705 966,407,721 2,078,453,875 (% of net asset value) 100.09% 100.04% 97.19% 100.26% 100./4% Other assets/(liabilities) (1,389,936) (563,173) 120,864,239 (2,515,878) (2,807,766) (% of net asset value) (0.09%) (0.04%) 2.81% (0.26%) (0.14%) Closing net asset value 1,515,876,830 1,333,452,790 4,303,946,944 963,891,843 2,075,646,109
Net asset value per unit 114.85 135.42 169.15 115.18 128.18
As at 30th November 2017 Investments 1,299,403,744 1,255,558,954 4,452,023,893 451,589,480 1,195,891,799 (% of net asset value) 99.95% 99.72% 96.82% 100.19% 99.93% Other assets/(liabilities) 612,961 3,484,461 146,138,352 (877,378) 818,182 (% of net asset value) 0.05% 0.28% 3.18% (0.19%) 0.07% Closing net asset value 1,300,016,705 1,259,043,415 4,598,162,245 450,712,102 1,196,709,981
Net asset value per unit 120.66 136.84 181.33 119.89 134.58
41
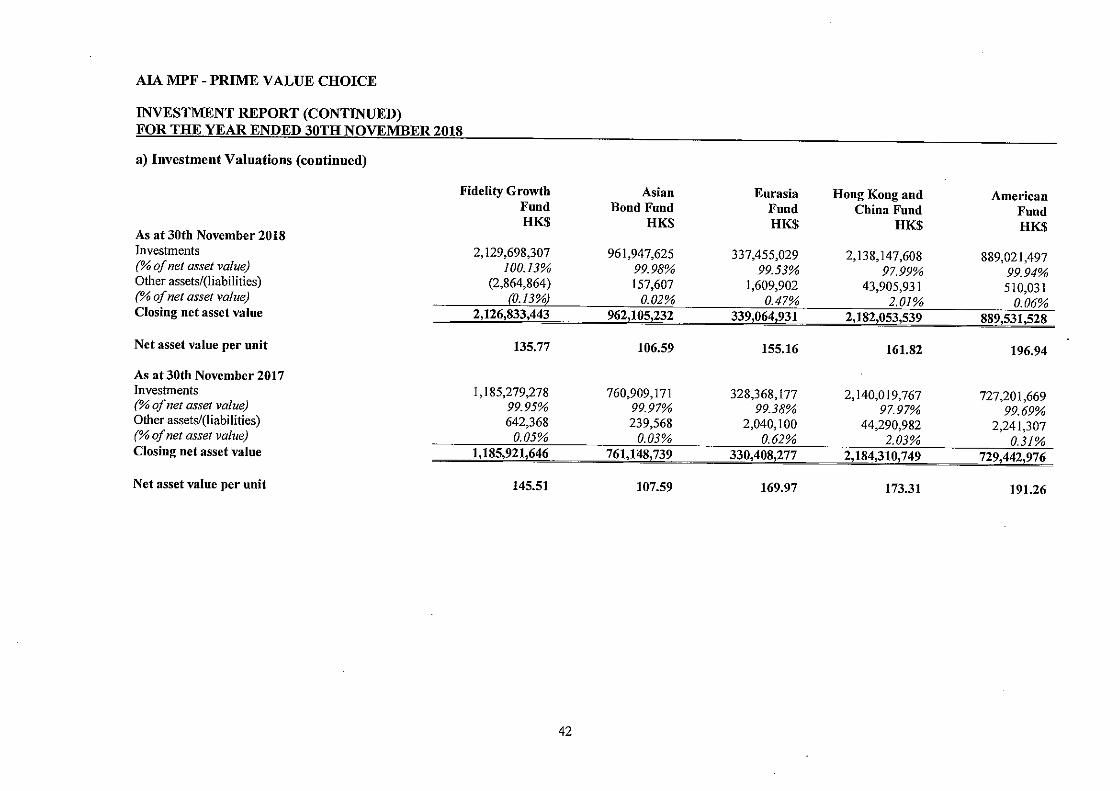
AIA MPF - PRIME VALUE CHOICE
INVESTMENT REPORT (CONTINUED) FOR THE YEAR ENDED 30TH NOVEMBER 2018
a) Investment Valuations (continued)
Fidelity Growth Asian Eurasia Hong Kong and American Fund Bond Fund Fund China Fund Fund HK$ HK$ HK$ HK$ HK$
As at 30th November 2018 Investments 2,129,698,307 961,947,625 337,455,029 2,138,147,608 889,021,497 (% of net asset value) 100.13% 99.98% 99.53% 97.99% 99.94% Other assets/(liabilities) (2,864,864) 157,607 1,609,902 43,905,931 510,031 (% of net asset value) [0.13%) 0.02% 0.47% 2.01% 0.06% Closing net asset value 2,126,833,443 962,105,232 339,064,931 2,182,053,539 889,531,528
Net asset value per unit 135.77 106.59 155.16 161.82 196.94
As at 30th November 2017 Investments I, 185,279,278 760,909,171 328,368,177 2,140,019,767 727,201,669 (% of net asset value) 99.95% 99.97% 99.38% 97.97% 99.69% Other assets/(liabilities) 642,368 239,568 2,040,100 44,290,982 2,241,307 (% of net asset value) 0.05% 0.03% 0.62% 2.03% 0.31% Closing net asset value 1,185,921,646 761,148,739 330,408,277 2,184,310,749 729,442,976
Net asset value per unit 145.51 107.59 169.97 173.31 191.26
42
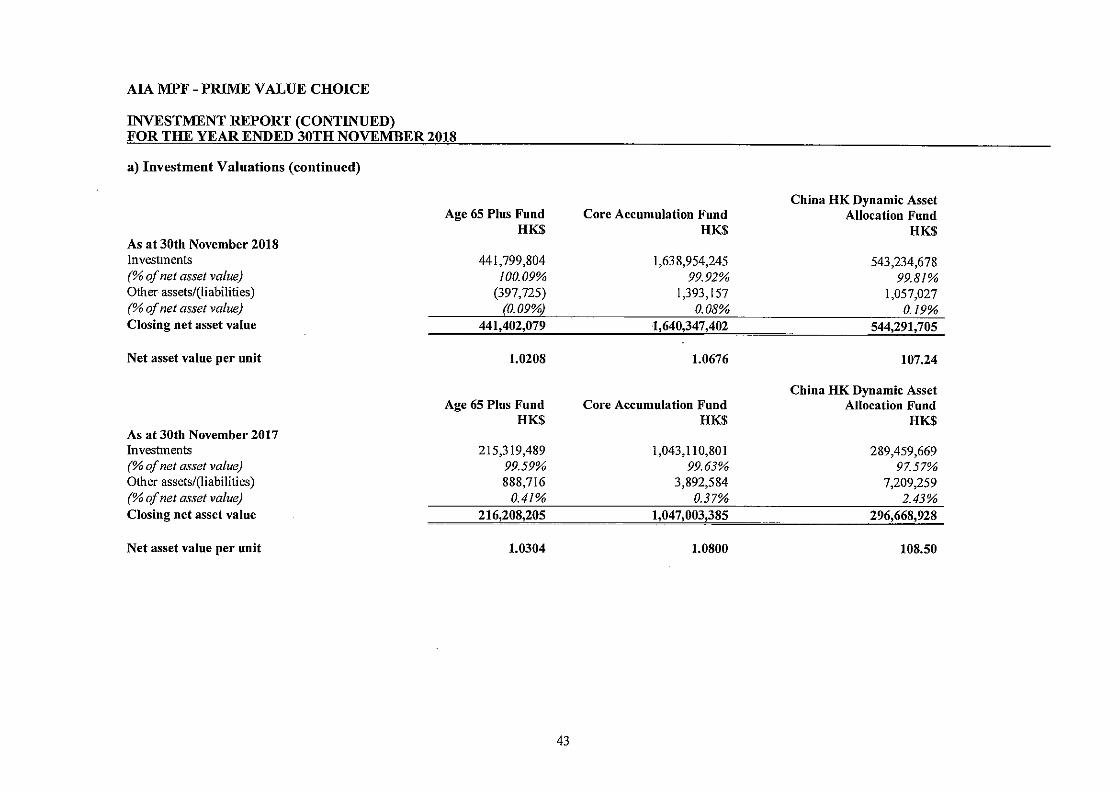
AIA MPF - PRIME VALUE CHOICE
INVESTMENT REPORT (CONTINUED) FOR THE YEAR ENDED 30TH NOVEMBER 2018
a) Investment Valnations (continued)
As at 30th November 2018 Investments (% of net asset value) Other assets/(liabilities) (% of net asset value) Closing net asset value
Net asset value per unit
As at 30th November 2017 Investments (% of net asset value) Other assets/(liabilities) (% of net asset value) Closing net asset value
Net asset value per unit
Age 65 Plus Fund HK$
441,799,804 100.09%
(397,725} (0.09%)
441,402,079
1.0208
Age 65 Plus Fund HK$
215,319,489 99.59% 888,716
0.41% 216,208,205
1.0304
43
China HK Dynamic Asset Core Accumulation Fund Allocation Fund
HK$ HK$
1,638,954,245 543,234,678 99.92% 99.81%
1,393,157 1,057,027 0.08% 0.19%
1,640,347,402 544,291,705
1.0676 107.24
China HK Dynamic Asset Core Accumulation Fund Allocation Fund
HK$ HK$
1,043,110,801 289,459,669 99.63% 97.57%
3,892,584 7,209,259 0.37% 2.43%
1,047,003,385 296,668,928
1.0800 108.50

AIA MPF - PRIME VALUE CHOICE
INVESTMENT REPORT (CONTINUED) FOR l'RE_ YEAR ENDED 30'.I'll NOVEMBER 2018
a) Investment Valuations (continued)
Note I: Please refer to pages 62 to 66 for details of the investment portfolio held by each constituent fund. Note 2: All constituent funds were launched on I st December 2000 except for the following:
- Hong Kong Equity Fund, European Equity Fund, Japan Equity Fund and North American Equity Fund were launched on !st January 2002 (soft launched date, whereas hard launched date was 19th March 2002), Asian Equity Fund and Greater China Equity Fund were launched on I st December 2004, Allianz Capital Stable Fund, Allianz Growth Fund and Allianz Stable Growth Fund were launched on 1st September 2005, Green Fund was launched on 31st March 2006, Global Bond Fund and World Fund were launched on 1st December 2007, Manager's Choice Fund was launched on ls! August 2008, Fidelity Capital Stable Fund, Fidelity Stable Growth Fund and Fidelity Growth Fund were launched on Isl December 2010, Asian Bond Fund, Eurasia Fund, Hong Kong and China Fund and American Fund were launched on 23rd September 2011, Age 65 Plus Fund and Core Accumulation Fund were launched on 1st April 2017, and China HK Dynamic Asset Allocation Fund was launched on 4th July 2017.
44

AIA MPF - PRIME VALUE CHOICE
INVESTMENT REPORT (CONTINUED) FOR THE YEAR ENDED 30TH NOVEMBER 2018
b) Investment Performance
Growth Balanced Capital Stable Guaranteed MPF Portfolio Portfolio Portfolio Portfolio Conservative Fund
HK$ HK$ HK$ HK$ HK$ 30th November 2018 Interest on bank deposits 633,939 1,175,697 1,245,390 Declared investment return - 13,085,783 Dividend income Total comprehensive income/(loss) excluding capital
(219,479,835) (104,439,429) (65,264,114) 13,085,789 (46,740,066) appreciation/( depreciation) Capital appreciation/( depreciation) (670,698,992) (260,429,103) (115,657,489) 76,638,413 Total comprehensive income/(loss) for the year (890,178,827) (364,868,532) (I 80,921,603) 13,085,789 29,898,347 Total net asset value 10,889,775,526 5,421,845,215 3,478,213,462 9,165,932,635 5,369,828,304 Total value of investments l 0,530,985,402 5,102,134,197 3,109,760,235 9,168,614,948 5,358,106,261 Net asset value per unit 235.77 199.16 180.33 NIA 112.34 Highest issue price 281.21 225.25 196.92 NIA 112.34 Lowest redemption price 227.82 195.62 178.52 NIA 111.69 Net annualised investment return (7.62%) (6.30%) (4.92%) 0.15% 0.58%
30th November 2017 Interest on bank deposits 186,831 628,384 518,784 Declared investment return - 12,140,719 Dividend income Total comprehensive income/(loss) excluding capital
(207,152,289) (99,949,987) (63,758,788) 12,140,757 (34,272,304) appreciation/( depreciation) Capital appreciation/( depreciation) 2,812,664,885 854,113,182 386,328,983 38,572,665 Total comprehensive income/(loss) for the year 2,605,512,596 754,163,195 322,570,195 12,140,757 4,300,361 Total net asset value 12,318,303,585 5,816,682,714 3,631,059,301 8,204,463,212 4,251,325,414 Total value of investments 12,327,767,383 5,506,146,912 3,296,920,687 8,205,078,039 4,252,337,870 Net asset value per unit 255.23 212.56 189.66 NIA 111.69 Highest issue price 257.54 213.68 190.28 NIA 111.69 Lowest redemption price 199.56 183.54 171.57 NIA 111.57 Net annualised investment return 26.25% 14.92% 9.76% 0.15% 0.11%
45

AIA MPF - PRIME VALUE CHOICE
INVESTMENT REPORT (CONTINUED) FOR THE YE;\R ENDEJ) 30TH NOVEMBER 2018
b) Investment Performance (Continued)
30th November 2016 Interest on bank deposits Declared investment return Dividend income Total comprehensive incomel(loss) excluding capital
appreciation/( depreciation) Capital appreciation/( depreciation) Total comprehensive incornel(loss) for the year Total net asset value Total value of investments Net asset value per unit Highest issue price Lowest redemption price Net annualised investment return
Growth Portfolio
HK$
235,785
(158,574,143)
351,880,531 193,306,388
9,991,705,828 9,753,208,041
202.16 209.07 174.89
(0.27"/o)
Balanced Portfolio
HK$
138,071
(82,785,005)
129,106,145 46,321,140
5,016,834,246 4,824,975,544
184.97 192.14 168.76 0.04%
46
Capital Stable Guaranteed MPF Portfolio Portfolio Conservative Fund
HK$ HK$ HK$
91,770 I0,505,143
-(54,903,412) 10,505,143 (21,169,499)
75,348,840 - 24,660,558 20,445,428 I0,505,143 3,491,059
3,286,829,499 8,086,648,708 3,710,642,775 3,077,975,347 8,091,066,998 3,713,616,720
172.79 NIA 111.57 179.69 NIA 111.57 163.48 NIA 111.45 0.35% 0.15% 0.11%

AIA MPF - PRIME VALUE CHOICE
INVESTMENT REPORT (CONTINUED) FOR THE YEAR ENDED 30TH NOVEMBER 2018
b) Investment Performance (Continued)
Hong Kong European Japan North American Asian Equity Fund Equity Fund Equity Fund Equity Fund Equity Fund
HK$ HK$ HK$ HK$ HK$ 30th November 2018 Interest on bank deposits Declared investment return Dividend income Total comprehensive income/(loss) excluding capital
(120,331,258) (30,666,121) (13,537,390) (44,332,750) (80,532,400) appreciation/( depreciation) Capital appreciation/( depreciation) (402,310,391) (175,836,726) (67,087,857) 80,224,714 (261,050,476) Total comprehensive income/(loss) for the year (522,641,649) (206,502,847) (80,625,247) 35,891,964 (341,582,876) Total net asset value 5,979,433,465 1,446,890,977 660,492,517 2,496,373,503 3,947,409,162 Total value of investments 5,994,590,747 1,449,718,959 662,964,708 2,499,986,790 3,954,418,559 Net asset value per unit 318.78 205.84 167.51 229.49 219.97 Highest issue price 395.22 257.95 205.51 247.65 261.37 Lowest redemption price 296.32 205.04 160.67 218.60 209.99 Net annualised investment return (8.32%) (12.47%) (10.95%) 2.03% (7.99%)
30th November 2017 Interest on bank deposits Declared investment return Dividend income Total comprehensive income/(loss) excluding capital (113,215,877) (29,141,691) (11,956,588) (37,281,249) (76,076,913)
appreciation/( depreciation) Capital appreciation/( depreciation) 1,568,748,170 429,877,794 177,020,307 432,944,683 1,005,168,884 Total comprehensive income/(loss) for the year 1,455,532,293 400,736,103 165,063,719 395,663,434 929,091,971 Total net asset value 6,731,427,187 1,725,358,764 747,364,912 2,290,425,897 4,437,700,145 Total value of investments 6,736,249,763 I, 727,869,690 750,128,734 2,295,704,110 4,450,838,370 Net asset value per unit 347.72 235.16 188.10 224.93 239.07 Highest issue price 358.44 238.11 190.31 224.93 245.65 Lowest redemption price 258.52 180.26 143.30 184.02 187.76 Net annualised investment return 26.55% 30.28% 28.55% 21.79% 26.44%
47
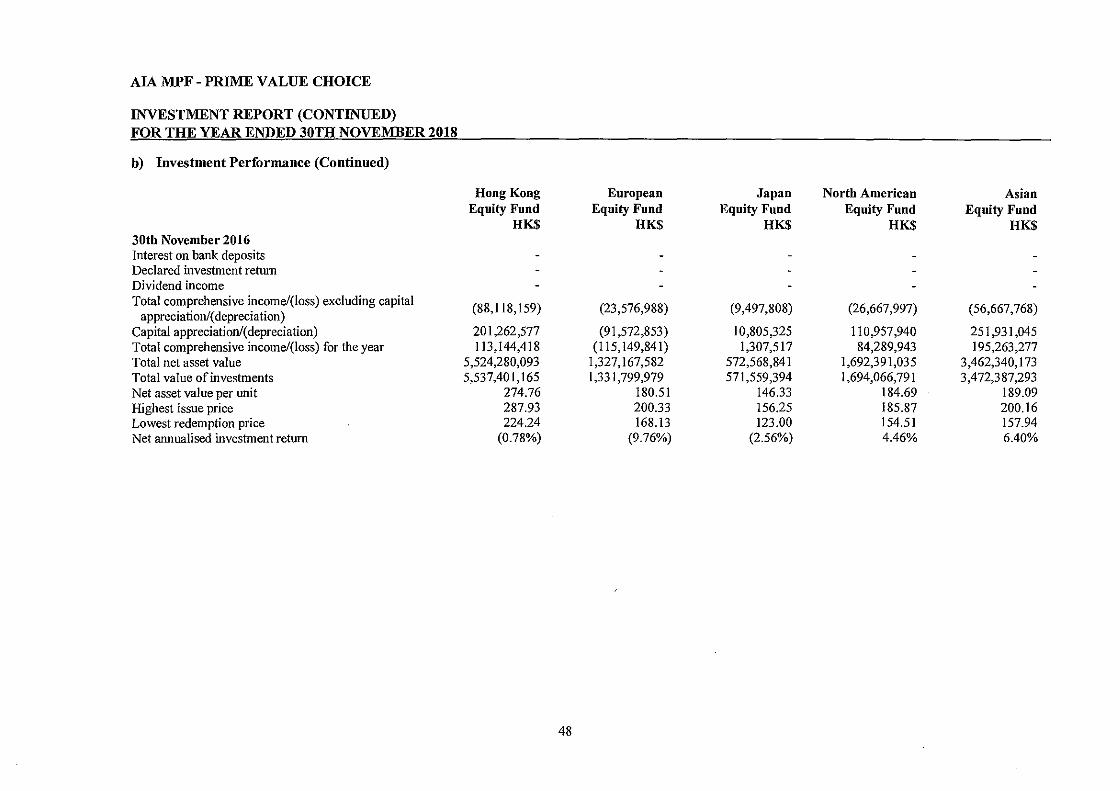
AIA MPF - PRIME VALUE CHOICE
INVESTMENT REPORT (CONTINUED) FOR THE YEAR ENDED 30TH NOVEMBER 2018
b) Investment Performance (Continued)
30th November 2016 Interest on bank deposits Declared investment return Dividend income Total comprehensive income/(]oss) excluding capital
appreciation/( depreciation) Capital appreciation/( depreciation) Total comprehensive income/(]oss) for the year Total net asset value Total value of investments Net asset value per unit Highest issue price Lowest redemption price Net annualised investment return
Hong Kong Equity Fund
HK$
(88,118,159)
201,262,577 113,144,418
5,524,280,093 5,537,401,165
274.76 287.93 224.24
(0.78%)
48
European Equity Fund
HK$
(23,576,988)
(91,572,853) (115,149,841)
1,327,167,582 1,331,799,979
180.51 200.33 168.13
(9.76%)
Japan Equity Fund
HK$
(9,497,808)
10,805,325 1,307,517
572,568,841 571,559,394
146.33 156.25 123.00
(2.56%)
North American Equity Fund
HK$
(26,667,997)
110,957,940 84,289,943
1,692,391,035 1,694,066,791
184.69 185.87 154.51 4.46%
Asian Equity Fund
HK$
(56,667,768)
251,931,045 195,263,277
3,462,340,173 3,472,387,293
189.09 200.16 157.94 6.40%

AIA MPF - PRIME VALUE CHOICE
INVESTMENT REPORT (CONTINUED) FOR THE YEAR ENDED 30TH NOVEMBER 2018
b) Investment Performance (Continued)
Allianz Capital Allianz Grow th Allianz Stable Greater China Stable Fund Fund Growth fund Green
Equity Fund (Note i) (Note i) (Note i) Fund HK$ HK$ HK$ HK$ HK$
30th November 2018 Interest on bank deposits Declared investment return Dividend income Total comprehensive income/(loss) excluding capital
(141,517,814) (7,494,102) (18,369,564) (13,857,081) (28,234,910) appreciation/( depreciation) Capital appreciation/( depreciation) (633,517,482) (19,503,418) (92,586,478) (47,492,193) (29,725,849) Total comprehensive income/(loss) for the year (775,035,296) (26,997,520) (110,956,042) (61,349,274) (57,960,759) Total net asset value 6,799,612,665 - 1,850,629,039 Total value of investments 6,813,678,268 - - 1,852,870,067 Net asset value per unit 202.61 NIA NIA NIA 160.62 Highest issue price 253.61 148.36 214.90 174.76 179.63 Lowest redemption price 189.86 132.94 169.96 150.16 155.21 Net annualised investment return (10.26%) NIA NIA NIA (2.91%)
30th November 2017 Interest on bank deposits Declared investment return Dividend income Total comprehensive income/(loss) excluding capital
(134,071,076) (6,983,936) (18,505,248) (13,401,508) (23,344,883) appreciation/( depreciation) Capital appreciation/( depreciation) 1,921,414,990 44,940,560 249,005,739 118,983,910 352,485,155 Total comprehensive income/(loss) for the year 1,787,343,914 37,956,624 230,500,491 105,582,402 329,140,272 Total net asset value 8,008,277,456 407,570,094 1,098,909,279 793,405,649 1,827,608,875 Total value of investments 8,026,981,823 408,303,580 1,099,968,179 794,286,225 1,827,780,805 Net asset value per unit 225.78 142.54 195.81 164.81 165.44 Highest issue price 233.48 143.44 198.25 166.20 165.44 Lowest redemption price 167.00 127.46 154.29 141.07 133.60 Net annualised investment return 27.95% 10.74% 26.12% 15.81% 23.56%
Note i: Allianz Capital Stable Fund, Allianz Growth Fund and Allianz Stable Growth Fund ("the 3 Allianz Funds") had no investments and operations since 15th November 2018. MPFA had approved the termination of the 3 Allianz Funds to take effect on 13th March 2019.
49

AJA MPF - PRIME VALUE CHOICE
JNVESTMENT REPORT (CONTINUED) EOR THE YEAR ENDED 30TH NOVEMBER 201_8
b) Investment Performance (Continued)
Greater China Equity Fund
HK$ 30th November 2016 Interest on bank deposits Declared investment return Dividend income Total comprehensive income/(loss) excluding capital
appreciation/( depreciation) (104,144,327)
Capital appreciation/(depreciation) 314,331,131 Total comprehensive income/(loss) for the year 210,186,804 Total net asset value 6,438,554,665 Total value of investments 6,453,618,798 Net asset value per unit 176.47 Highest issue price 185.80 Lowest redemption price 146.53 Net annualised investment return 1.50%
Allianz Capital Stable Fund
HK$
(5,686,010)
4,908,742 (777,268)
334,504,443 335,258,507
128.73 136.00 124.23 0.06%
50
Allianz Growth Allianz Stable Green Fund Growth fund Fund HK$ HK$ HK$
(14,388,543) (I 0,650,486) (16,667,431)
17,239,149 14,565,669 6,518,579 2,850,606 3,915,183 (I 0, 148,852)
877,822,179 640,568,450 1,309,603,432 879,822,256 641,903,880 1,311,176,772
155.27 142.31 133.89 162.25 149.91 137.70 134.12 132.64 117.40
(1.52%) 0.43% (1.90%)

AIA MPF - PRIME VALUE CHOICE
INVESTMENT REPORT (CONTINUED) FOR THE YEAR ENDED 30TH NOVEMBER 2018
b) Investment Performance (Continned)
Global World Manager's Fidelity Capital Fidelity Stable Bond Fund Fund Choice Fund Stable Fund Growth Fund
HK$ HK$ HK$ HK$ HK$ 30th November 2018 Interest on bank deposits 1,311 254,251 Declared investment return Dividend income 21,126,694 Total comprehensive income/(loss) excluding capital
(13,194,349) 10,840,581 (70,225,568) (9,508,505) (20,756,127) appreciation/( depreciation) Capital appreciation/( depreciation) (62,841,773) (27,462,940) (239,987,684) (13,434,490) (43,566,560) Total comprehensive income/(loss) for the year (76,036,122) (16,622,359) (310,213,252) (22,942,995) (64,322,687) Total net asset value 1,515,876,830 1,333,452,790 4,303,946,944 963,891,843 2,075,646, I 09 Total value of investments 1,517,266,766 1,334,0 I 5,963 4,183,082,705 966,407,721 2,078,453,875 Net asset value per unit 1.14.85 135.42 169.15 115.18 128.18 Highest issue price 122.82 151.63 198.00 124.81 142.79 Lowest redemption price 114.53 131.15 164.64 114.00 125.81 Net annualised investment return (4.82%) (1.04%) (6.72%) (3.93%) (4.76%)
30th November 2017 Interest on bank deposits - 299 593,582 Declared investment return Dividend income - 15,965,786 Total comprehensive income/(loss) excluding capital
(10,369,882) 7,324,101 (61,019,713) (6,367,209) (14,994,510) appreciation/( depreciation)
Capital appreciation/( depreciation) 83,741,956 200,761,265 853,4 I 1,084 45,687,941 161,578,591 Total comprehensive income/(loss) for the year 73,372,074 208,085,366 792,391,371 39,320,732 146,584,081 Total net asset value 1,300,016,705 1,259,043,415 4,598,162,245 450,712,102 1,196,709,981 Total value of investments 1,299,403,744 1,255,558,954 4,452,023,893 451,589,480 1,195,891,799 Net asset value per unit 120.66 136.84 181.33 119.89 134.58 Highest issue price 121.75 137.49 182.67 120.46 135.53 Lowest redemption price 111.97 111.28 148.02 106.83 I 14.88 Net annualised investment return 6.56% 21.61% 21.32% 11.30% 16.19%
51

AIA MPF - PRIME VALUE CHOICE
INVESTMENT REPORT (CONTINUED) FOR THE YEAR ENDED 30TH NOVEMBER 2018
b) Investment Performance (Continued)
Global World Manager's Fidelity Capital Fidelity Stable Bond Fund Fund Choice Fund Stable Fund Growth Fund
HK$ HK$ HK$ HK$ HK$ 30th November 2016 Interest on bank deposits 19 100,966 Declared investment return Dividend income 11,604,408 Total comprehensive income/(loss) excluding capital
(7,675,681) 5,962,840 (49,535,745) (4,391,516) (6,119,530) appreciation/( depreciation)
Capital appreciation/(depreciation) 6,032,765 39,670,466 46,390,417 4,222,585 13,870,867 Total comprehensive income/(loss) for the year ( 1,642,9 I 6) 45,633,306 (3,145,328) (168,931) 7,751,337 Total net asset value 1,023,394,324 873,964,651 3,588,372,844 303,457,182 761,244,931 Total value of investments 1,027,344,587 874,130,124 3,345,094,564 303,897,286 763,755,838 Net asset value per unit 113.24 112.52 149.47 107.72 115.83 Highest issue price 120.34 114.87 154.51 113.53 121.87 Lowest redemption price 111.17 92.79 129.46 l03.07 106.92 Net annualised investment return 1.27% 5.31% (1.05%) 0.47% 1.27%
52

AIA MPF - PRIME VALUE CHOICE
INVESTMENT REPORT (CONTINUED) FOR THE YEAR ENDED 30TH NOVEMBER 2018
b) Investment Performance (Continued)
Fidelity Growth Asian Eurasia Hong Kong and American Fund Bond Fund Fund China Fund Fund HK$ HK$ HK$ HK$ HK$
30th November 2018 Interest on bank deposits 204 603 1,849 Declared investment return Dividend income - - 8,348,716 72,070,960 10,860,795 Total comprehensive income/(loss) excluding capital
(22,173,212) (6,192,734) 5,796,141 54,170,673 3,900,538 appreciation/( depreciation) Capital appreciation/( depreciation) (58,696,903) (4,621,985) (38,570,251) (213,574,323) 14,956,628 Total comprehensive income/(loss) for the year (80,870,115) (10,814,719) (32,774,110) (159,403,650) 18,857,166 Total net asset value 2,126,833,443 962,105,232 339,064,931 2,182,053,539 889,531,528 Total value of investments 2,129,698,307 961,947,625 337,455,029 2,138,147,608 889,021,497 Net asset value per unit 135.77 106.59 155.16 161.82 196.94 Highest issue price 160.07 110.06 185.62 198.30 211.89 Lowest redemption price 131.00 104.31 150.58 151.28 189.07 Net annualised investment return (6.69%) (0.93%) (8.71%) (6.63%) 2.97%
30th November 2017 Interest on bank deposits - 63 46 229 Declared investment return Dividend income - 5,636,655 65,201,856 7,760,894 Total comprehensive income/(loss) excluding capital
(16,988,974) (4,259,722) 3,804,516 51,131,408 2,569,266 appreciation/( depreciation) Capital appreciation/( depreciation) 236,580,738 36,531,979 55,052,014 408,889,604 103,439,752 Total comprehensive income/(loss) for the year 219,591,764 32,272,257 58,856,530 460,021,012 106,009,018 Total net asset value 1,185,921,646 761,148,739 330,408,277 2,184,310,749 729,442,976 Total value of investments 1,185,279,278 760,909,171 328,368,177 2,140,019,767 727,201,669 Net asset value per unit 145.51 107.59 169.97 173.31 191.26 Highest issue price 147.12 108.77 171.27 178.66 191.48 Lowest redemption price 115.17 100.35 134.01 127.17 156.91 Net annualised investment return 25.07% 5.04% 26.50% 28.79% 20.55%
53

AIA MPF - PRIME VALUE CHOICE
INVESTMENT REPORT (CONTINUED) FOR THE YEAR ENDED 30TH NOVEMBER 20_18
b) Investment Performance (Continned)
30th November 2016 Interest on bank deposits Declared investment return Dividend income Total comprehensive income/(loss) excluding capital
appreciation/(depreciation) Capital appreciation/( depreciation) Total comprehensive income/(loss) for the year Total net asset value Total value of investments Net asset value per unit Highest issue price Lowest redemption price Net annualised investment return
Fidelity Growth Fund HK$
(I 1,376,622)
20,370,325 8,993,703
782,222,122 783,370,791
I 16.35 121.77 100.43
(0.09%)
54
Asian Bond Fund
HK$
(3,122,978)
2,923,466 (199,512)
579,461,017 579,027,253
102.43 108.45 99.91
1.49%
Eurasia Fund HK$
5
4,074,494
3,440,304
(5,877,613) (2,437,309)
193,021,238 191,801,882
134.36 141.44 I I 8.0 I
(2.90%)
Hong Kong and American China Fund Fund
HK$ HK$
35 12
44,132,419 4,178,072
35,257,538 1,536,424
61,260,295 28,641,498 96,517,833 30,177,922
I ,446,032,402 408,766,052 1,411,211,202 408,429,115
134.58 158.67 141.19 159.73 104.68 128.2 I 5.59% 8.60%

AIA MPF - PRIME VALUE CHOICE
INVESTMENT REPORT (CONTINUED) FOR THE YEAR ENDED 30TH NOVEMBER 2018
b) Investment Performance (Continned)
Age 65 Plus Fund HK$
30th November 2018 Interest on bank deposits Declared investment return Dividend income Total comprehensive income/(loss) excluding capital
(1,956,050) appreciation/( depreciation)
Capital appreciation/( depreciation) (1,997,921) Total comprehensive income/(loss) for the period (3,953,971) Total net asset value 441,402,079 Total value of investments 441,799,804 Net asset value per unit 1.0208 Highest issue price 1.0418 Lowest redemption price 1.0108 Net annualised investment return (0.93%)
30th November 2017 Interest on bank deposits Declared investment return Dividend income Total comprehensive income/(loss) excluding capital
(570,923) appreciation/( depreciation)
Capital appreciation/( depreciation) 4,011,795 Total comprehensive income/(loss) for the period 3,440,872 Total net asset value 2 I 6,208,205 Total value of investments 215,319,489 Net asset value per unit 1.0304 Highest issue price 1.0304 Lowest redemption price 1.0000 Net annualised investment return NIA
Core Accumulation China HK Dynamic Asset Fund Allocation Fund HK$ HK$
(7,813,006) (4,301,051)
(I 8,853,061) (7,189,461) (26,666,067) (I 1,490,512)
1,640,347,402 544,291,705 1,638,954,245 543,234,678
1.0676 107.24 1.1344 118.31 1.0452 104.88
(1.15%) (1.16%)
(2,803,000) (649,824)
53,319,679 9,068,660 50,516,679 8,418,836
1,047,003,385 296,668,928 1,043,110,801 289,459,669
1.0800 108.50 1.0800 110.81 1.0000 99.86
NIA NIA
55

AJA MPF - PRIME VALUE CHOICE
INVESTMENT REPORT (CONTINUED) FOR THE YEAR ENDED 30TH NOVEMBER 2018
b) Investment Performance (Continued)
Growth Balanced Capital Stable Guaranteed MPF Portfolio Portfolio Portfolio Portfolio Conservative Fund
HK$ HK$ HK$ HK$ HK$ 30th November 2015 Highest issue price 230.08 200.90 182.48 NIA ll 1.45 Lowest redemption price 188.53 175.99 166.87 NIA 111.33 Net annualised investment return (3.13%) (2.70%) (2.42%) 0.50% 0.11%
30th November 2014 Highest issue price 214.58 194.30 180.25 NIA ll l.33 Lowest redemption price 192.13 180.75 171.13 NIA 111.15 Net annualised investment return 2.23% 1.58% 1.06% 0.52% 0.16% 30th November 2013 Highest issue price 204.71 187.07 174.76 NIA 111.15 Lowest redemption price 171.48 168.19 162.57 NIA 111.03 Net annualised investment return 18.96% 8.83% 3.66% 0.82% 0.1 ]%
30th November 2012 Highest issue price 172.07 171.88 168.43 NIA 111.03 Lowest redemption price 147.13 155.62 156.93 NIA 110.76 Net annualised investment return 13.59% 8.94% 6.54% 1.94% 0.24%
30th November 2011 Highest issue price 186.25 I 76.87 169.65 NIA 110.76 Lowest redemption price 138.08 150.70 154.49 NIA ll0.64 Net annualised investment return (10.41%) (4.28%) (1.16%) 1.94% 0.11%
30th November 2010 Highest issue price 180.18 174.02 168.06 NIA 110.64 Lowest redemption price 144.42 148.41 147.46 NIA 110.52 Net annualised investment return 5.86% 2.42% 0.64% 2.75% 0.11%
30th November 2009 Highest issue price 164.69 163.17 159.82 NIA 110.52 Lowest redemption price 97.77 116.64 125.93 NIA 110.46 Net annualised investment return 39.82% 27.32% 20.70% 2.75% 0.05%
56

AIA MPF - PRIME VALUE CHOICE
INVESTMENT REPORT (CONTINUED) FOR THE YEAR ENDED 30TH NOVEMBER 2018
b) Investment Performance (Continned)
Hong Kong European Japan North American Asian Equity Fund Equity Fund Equity Fund Equity Fund Equity Fund
HK$ HK$ HK$ HK$ HK$ 30th November 2015 Highest issue price 368.02 215.14 158.23 I 83.55 215.63 Lowest redemption price 261.39 185.71 131.32 157.93 163.16 Net annualised investment return (12.11%) (1.50%) 9.61% (0.76%) (12.87%) 30th November 2014 Highest issue price 330.41 221.40 151.97 179.27 222.04 Lowest redemption price 280.84 186.22 127.50 151.47 189.49 Net annualised investment return 1.51% 1.09% (8.54%) 14.05% (1.38%)
30th November 2013 Highest issue price 310.41 200.89 153 .11 156.56 215.27 Lowest redemption price 251.88 155.40 107.37 119.18 182.99 Net annualised investment return 13.32% 29.27% 39.52% 29.13% 6.88%
30th November 2012 Highest issue price 273.91 156.50 117.31 123.42 193.52 Lowest redemption price 227.95 125.29 100.99 100.00 161.45 Net annualised investment return 20.03% 14.73% (2.01%) 17.07% 10.82%
30th November 20ll Highest issue price 323.21 178.73 128.72 111.56 222.44 Lowest redemption price 205.23 119.62 103.90 90.25 154.24 Net annualised investment return (25.55%) (5.87%) (1.62%) 8.04% (6.29%)
30th November 2010 Highest issue price 330.96 162.13 115.38 99.37 200.10 Lowest redemption price 248.88 118.56 98.62 83.98 146.26 Net annualised investment return 8.43% (2.00%) 7.60% 7.26% 10.18%
30th November 2009 Highest issue price 295.48 154.65 111.10 90.69 175.94 Lowest redemption price 153.35 82.41 76.12 55.59 85.06 Net annualised investment return 61.26% 39.13% 3.40% 24.04% 77.05%
57

AJA MPF - PRIME VALUE CHOICE
INVESTMENT REPORT (CONTINUED) FOR THE YEAR ENDED 30TH NOVEMBER 2018
b) Investment Performance (Continued)
Greater China Allianz Capital Allianz Growth Allianz Stable Green Equity Fund Stable Fund Fund Growth fund Fund
HK$ HK$ HK$ HK$ HK$ 30th November 2015 Highest issue price 231.59 137.57 183.93 155.82 145.34 Lowest redemption price 163.90 126.96 147.30 137.89 124.70 Net annualised investment return (13.58%} (3.99%) (5.10%) (4.46%) (0.76%)
30th November 2014 Highest issue price 212.32 137.36 173.10 153.07 139.20 Lowest redemption price 180. 19 131.91 155.98 144.25 122.98 Net annualised investment return 3.62% (0.50%) (1.02%) (0.81%) 7.84%
30th November 2013 Highest issue price 194.16 134.74 167.93 149.59 127.53 Lowest redemption price 158.90 126.16 141.09 135.42 99.51 Net annualised investment return 13.29% 3.10% 17.43% 7.35% 28.03%
30th November 2012 Highest issue price 171.37 130.62 143.85 139.28 101.44 Lowest redemption price 142.37 121.90 121.65 126.23 85.54 Net annualised investment rehrrn 18.52% 6.25% 13.91% 8.67% 11.67%
30th November 2011 Highest issue price 200.37 131.12 153.75 142.19 103.08 Lowest redemption price 130.92 119.83 113.14 122.13 81.34 Net annualised investment return (24.05%} (1.32%) (10.68%) (3.91%} 0.70%
30th November 2010 Highest issue price 200.54 129.72 148.94 139.66 93.63 Lowest redemption price 154.37 115.06 116.52 119.46 77.22 Net annualised investment return 7.08% 1.16% 7.44% 2.50% 4.69%
30th November 2009 Highest issue price 184.76 123.91 135.82 131.97 86.69 Lowest redemption price 100.62 98.96 84.91 95.72 51.35 Net annualised investment return 66.62% 18.94% 32.29% 25.50% 29.79%
58

AIA MPF - PRIME VALUE CHOICE
INVESTMENT REPORT (CONTINUED) FOR THE YEAR ENDED 30TH NOVEMBER 2018
b) Investment Performance (Continued)
Global World Manager's Fidelity Capital Fidelity Stable Bond Fund Fund Choice Fund Stable Fund Growth Fund
HK$ HK$ HK$ HK$ HK$ 30th November 2015 Highest issue price 118.96 117.81 169.49 114.92 124.68 Lowest redemption price 110.66 98.09 139.73 I 05.49 110.36 Net annualised investment return (5.85%) (6.42%) (1.94%) (3.93%) (2.49%) 30th November 2014 Highest issue price 123.46 117.70 158.17 113.71 119.37 Lowest redemption price 117.94 102.41 144.72 107.68 110.12 Net annualised investment return (0.27%) 7.08% 1.20% 1.79% 3.43% 30th November 2013 Highest issue price 123.28 107.67 153.12 109.67 113.41 Lowest redemption price I 14.60 89.10 137.21 102.29 102.73 Net annualised investment return (2.89%) 19.46% 10.64% 5.10% 9.40%
30th November 2012 Highest issue price 123.36 92.14 137.58 104.33 103.67 Lowest redemption price 117.43 77.91 116.69 96.13 93.07 Net annualised investment return 3.96% 9.33% 14.98% 7.92% 10.13%
30th November 2011 Highest issue price 123.55 94.16 132.96 104.05 105.39 Lowest redemption price 112.33 72.64 112.28 95.02 90.69 Net annualised investment return 4.14% (0.50%) (2.09%) (3.33%) (5.87%)
30th November 2010 Highest issue price 120.08 87.05 128.99 NIA NIA Lowest redemption price 105.25 70.75 103.89 NIA NIA Net annualised investment return (1.55%) 5.73% 9.31% NIA NIA 30th November 2009 Highest issue price 115.23 78.95 114.82 NIA NIA Lowest redemption price 95.61 44.46 71.81 NIA NIA Net annualised investment return 17.91% 39.24% 37.79% NIA NIA
59

AIA MPF - PRIME VALUE CHOICE
INVESTMENT REPORT (CONTINUED) FOR THE YEAR ENDED 30TH NOVEMBER 2018
b) Investment Performance (Continued)
Fidelity Growth Asian Eurasia Hong Kong and American Fund Bond Fund Fund China Fund Fund HK$ HK$
30th November 2015 HK$ HK$ HK$
Highest issue price 133.65 105.81 157.34 165.64 156.27 Lowest redemption price 108.50 98.99 128.56 119.09 132.95 Net annualised investment return (3.00%) (3.55%) (3.98%) (6.36%) (4.93%) 30th November 2014 Highest issue price 123.08 106.32 153.00 142.51 155.23 Lowest redemption price 109.73 100.98 134.67 116.00 131.94 Net annualised investment return 3.24% 2.60% (0.93%) 2.48% 12.15% 30th November 2013 Highest issue price 116.29 107.93 145.85 133.05 138.66 Lowest redemption price 97.64 99.14 121.61 109.11 113.65 Net annualised investment return 18.74% (4.55%) 19.49% 10.67% 19.97% 30th November 2012 Highest issue price 97.93 106.86 121.82 121.18 119.10 Lowest redemption price 83.95 100.33 102.02 99.37 101.00 Net annualised investment return 13.86% 5.67% 11.82% 20.54% 9.21% 30th November 2011 Highest issue price 105.45 101.69 112.23 110.03 108.77 Lowest redemption price 79.44 99.34 97.98 91.75 98.58 Net annualised investment return (13.99%) 1.13% 8.86% (0.43%) 4.58% 30th November 2010 Highest issue price NIA NIA NIA NIA NIA Lowest redemption price NIA NIA NIA NIA NIA Net annualised investment return NIA NIA NIA NIA NIA 30th November 2009 Highest issue price NIA NIA NIA NIA NIA Lowest redemption price NIA NIA NIA NIA NIA Net annualised investment return NIA NIA NIA NIA NIA
60
AIA MPF - PRIME VALUE CHOICE
INVESTMENT REPORT (CONTINUED) FOR THE YEAR ENDED 30TH NOVEMBER 2_!!_ll!
b)
Note I :
Note2:
Investment Performance (Continned)
Past performance is not indicative of future performance. The price of units may go down as well as up.
Annualised Investment Return
(a) For unitised funds except (b) below The annualised investment return is calculated by comparing the net asset value per unit at period/year end against the net asset value per unit at the beginning of the period/year except for the first year of the following funds where the initial subscription price per unit is used. Fidelity Capital Stable Fund, Fidelity Stable Growth Fund and Fidelity Growth Fund were launched on !st December 2010 at the initial subscription price of HK$ I 00 per unit, Asian Bond Fund, Eurasia Fund, Hong Kong and China Fund and American Fund were launched on 23rd September 2011 at the initial subscription price of HK$ 100 per unit, Age 65 Plus Fund and Core Accumulation Fund were launched on 1st April 2017, and China HK Dynamic Asset Allocation Fund was launched on 4th July 2017.
(b) For Guaranteed Portfolio The annualised investment return is the declared investment return of its underlying investment, the MPF Capital Guaranteed Plus Policy, for each of the years.
61

AJA MPF - PRIME VALUE CHOICE
INVESTMENT REPORT (CONTINUED) FOR THE YEAR ENDED 30TH NOVEMBER 2018
c) Investment Portfolio As At 30th November 2018
2018 Holding Fair Value Cost % of
Growth Portfolio Units HK$ HK$ Net Assets Harbinger Japanese Equity Fund 10,526,299 217,473,332 192,076,480 2.00 JPMorgan SAR American Fund 3,815,374 999,653,395 755,331,381 9.18 JPMorgan SAR Asian Fund 1,319,262 728,994,270 687,208,242 6.70 JPMorgan SAR European Fund 4,052,644 914,027,603 760,207,076 8.39 JPMorgan SAR Global Emerging Markets Fund 3,086,119 51,569,052 47,570,672 0.47 JPMorgan SAR Hong Kong Fund 23,174,212 1,768,424,096 1,271,058,825 16.24 JPMorgan SAR Japan Fund 2,803,023 702,603,739 689,551,886 6.45 PineBridge Asian Fund 1,094,280 416, I 04,619 412,841,374 3.82 PineBridge Europe Equity Fund 34,133,692 768,008,067 689,535,734 7.05 PineBridge Hong Kong Equity Fund 34,206,155 1,387,059,591 1,161,322,176 12.74 PineBridge Japan Equity Fund 28,296,154 546,115,774 549,406,642 5.02 PineBridge US Equity Fund 42,846,156 1,297,381,609 943,965,251 11.91 JPMorgan SAR Global Bond Fund 2,387,216 445,000,450 443,954,844 4.09 PineBridge Global Bond Fund 1,789,147 288,569,805 297,482,528 2.65
Total 10,530,985,402 8,901,513,111 96.71
Balanced Portfolio Harbinger Japanese Equity Fund 1,778,806 36,750,130 32,119,080 0.68 JPMorgan SAR American Fund 1,793,761 469,977,483 419,026,592 8.67 JPMorgan SAR Asian Fund 173,711 95,988,765 81,178,434 1.77 JPMorgan SAR European Fund 1,106,147 249,478,854 254,589,314 4.60 JPMorgan SAR Global Emerging Markets Fund 3,736,961 62,444,626 70,598,975 1.15 JPMorgan SAR Hong Kong Fund 8,201,888 625,886,098 496,052,519 11.54 JPMorgan SAR Japan Fund 523,371 131,187,850 113,526,916 2.42 PineBridge Asian Fund 379,517 144,313,045 136,496,744 2.66 PineBridge Europe Equity Fund 11,178,694 251,520,612 261,660,582 4.64 PineBridge Hong Kong Equity Fund 6,616,550 268,301,090 226,460,718 4.95 PineBridge Japan Equity Fund 8,245,994 159,147,688 148,956,429 2.94 PineBridge US Equity Fund 7,459,369 225,869,696 169,858,642 4.17 JPMorgan SAR Asian Bond Fund 7,898,993 91,707,303 89,639,507 1.69 JPMorgan SAR Global Bond Fund 3,453,224 643,714,684 585,678,135 11.87 PineBridge Asian Bond Fund 1,471,142 152,544,787 138,628,830 2.81 PineBridge Global Bond Fund 9,258,542 1,493,301,486 1,467,808,238 27.54
Total 5,102,134,197 4,692,279,655 94.10
62
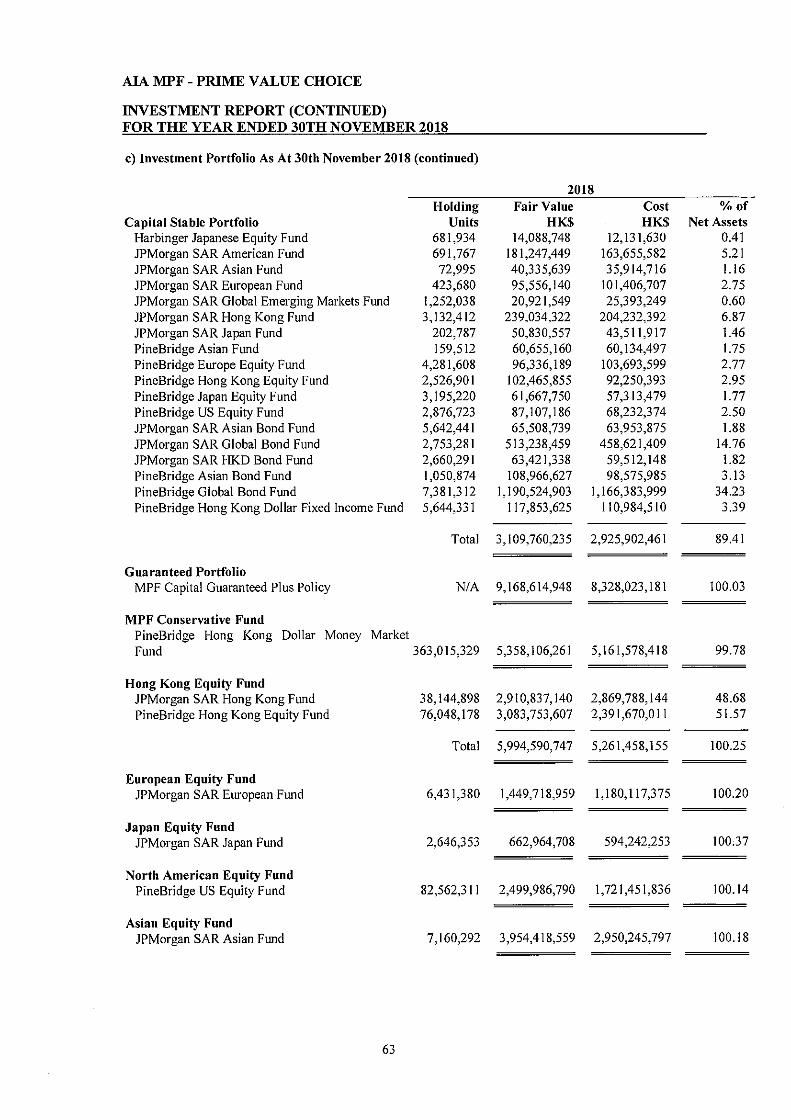
AJA MPF - PRIME VALUE CHOICE
INVESTMENT REPORT (CONTINUED) FOR THE YEAR ENDED 30TH NOVEMBER 2018
c) Investment Portfolio As At 30th November 2018 (continued)
2018 Holding Fair Value Cost %of
Capital Stable Portfolio Units HK$ HK$ Net Assets Harbinger Japanese Equity Fund 681,934 14,088,748 12,131,630 0.41 JPMorgan SAR American Fund 691,767 181,247,449 163,655,582 5.21 JPMorgan SAR Asian Fund 72,995 40,335,639 35,914,716 1.16 JPMorgan SAR European Fund 423,680 95,556,140 101,406,707 2.75 JPMorgan SAR Global Emerging Markets Fund 1,252,038 20,921,549 25,393,249 0.60 JPMorgan SAR Hong Kong Fund 3,132,412 239,034,322 204,232,392 6.87 JPMorgan SAR Japan Fund 202,787 50,830,557 43,511,917 1.46 PineBridge Asian Fund 159,512 60,655,160 60,134,497 1.75 PineBridge Europe Equity Fund 4,281,608 96,336,189 103,693,599 2.77 PineBridge Hong Kong Equity Fund 2,526,901 102,465,855 92,250,393 2.95 PineBridge Japan Equity Fund 3,195,220 61,667,750 57,313,479 1.77 PineBridge US Equity Fund 2,876,723 87,107,186 68,232,374 2.50 JPMorgan SAR Asian Bond Fund 5,642,441 65,508,739 63,953,875 1.88 JPMorgan SAR Global Bond Fund 2,753,281 513,238,459 458,621,409 14.76 JPMorgan SAR HKD Bond Fund 2,660,291 63,421,338 59,512,148 1.82 PineBridge Asian Bond Fund 1,050,874 108,966,627 98,575,985 3.13 PineBridge Global Bond Fund 7,381,312 I, 190,524,903 I, 166,383,999 34.23 PineBridge Hong Kong Dollar Fixed Income Fund 5,644,331 117,853,625 110,984,510 3.39
Total 3,109,760,235 2,925,902,461 89.41
Guaranteed Portfolio MPF Capital Guaranteed Plus Policy NIA 9,168,614,948 8,328,023,181 100.03
MPF Conservative Fund PineBridge Hong Kong Dollar Money Market Fund 363,015,329 5,358, I 06,261 5,161,578,418 99.78
Hong Kong Equity Fund JPMorgan SAR Hong Kong Fund 38,144,898 2,910,837,140 2,869,788,144 48.68 PineBridge Hong Kong Equity Fund 76,048,178 3,083,753,607 2,391,670,01 I 51.57
Total 5,994,590,747 5,261,458,155 100.25
European Equity Fund JPMorgan SAR European Fund 6,431,380 1,449,718,959 1, I 80,117,375 100.20
Japan Equity Fund JPMorgan SAR Japan Fund 2,646,353 662,964,708 594,242,253 10037
North American Equity Fund PineBridge US Equity Fund 82,562,311 2,499,986,790 1,721,451,836 100.14
Asian Equity Fund JPMorgan SAR Asian Fund 7,160,292 3,954,418,559 2,950,245,797 100.18
63
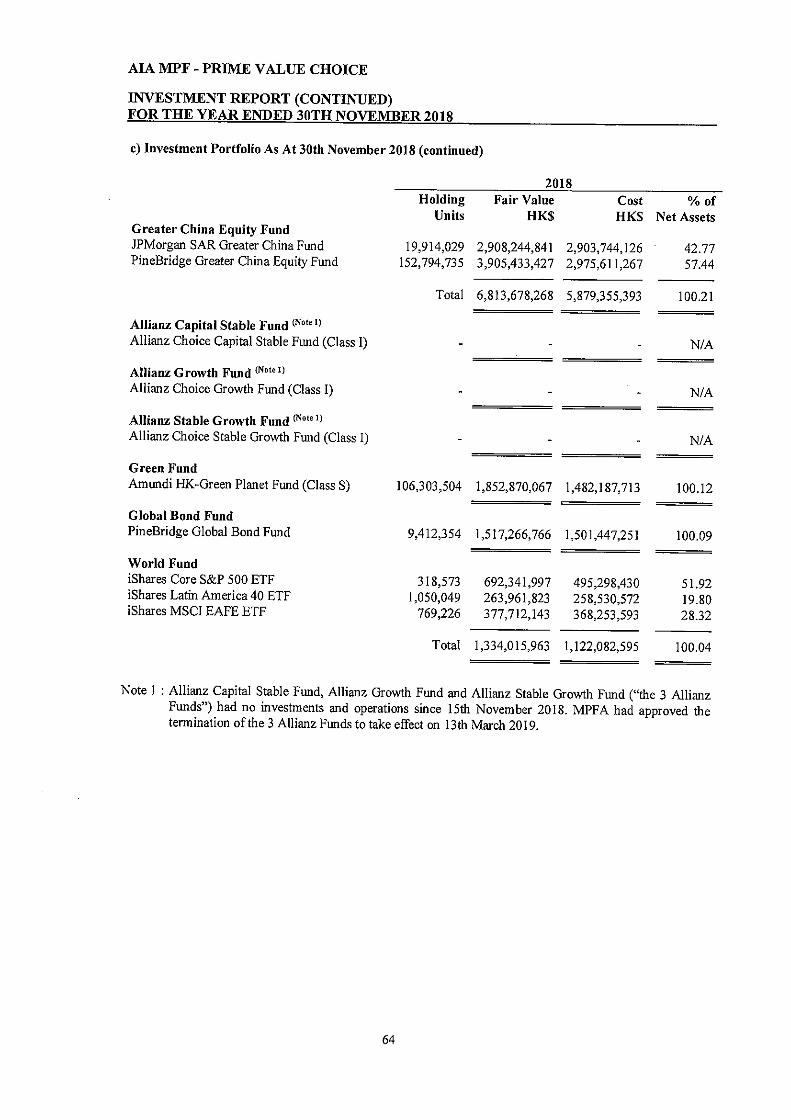
AIA MPF - PRIME VALUE CHOICE
INVESTMENT REPORT (CONTINUED) FOR THE YEAR ENDED 30TH NOVEMBER 2018
c) Investment Portfolio As At 30th November 2018 (continued)
G realer China Equity Fund JPMorgan SAR Greater China Fund PineBridge Greater China Equity Fund
Allianz Capital Stable Fund (Not, 1>
Allianz Choice Capital Stable Fund (Class I)
Allianz Growth Fund (Not,I)
Allianz Choice Growth Fund (Class I)
Allianz Stable Growth Fund (Note 1>
Allianz Choice Stable Growth Fund (Class I)
Green Fund Amundi HK-Green Planet Fund (Class S)
Global Bond Fund PineBridge Global Bond Fund
World Fund iShares Core S&P 500 ETF iShares Latin America 40 ETF iShares MSCI EAFE ETF
2018 Holding Fair Value Cost
Units HK$ HK$
19,914,029 2,908,244,841 2,903,744,126 152,794,735 3,905,433,427 2,975,611,267
Total 6,813,678,268 5,879,355,393
I 06,303,504 1,852,870,067 1,482,187,713
9,412,354 1,517,266,766 1,501,447,251
318,573 1,050,049
769,226
692,341,997 263,961,823 377,712,143
495,298,430 258,530,572 368,253,593
Total 1,334,015,963 1,122,082,595
% of Net Assets
42.77 57.44
I 00.21
NIA
NIA
NIA
100.12
100.09
51.92 19.80 28.32
100.04
Note I : Allianz Capital Stable Fund, Allianz Growth Fund and Allianz Stable Growth Fund ("the 3 Allianz Funds") had no investments and operations since 15th November 2018. MPFA had approved the termination of the 3 Allianz Funds to take effect on 13th March 2019.
64

AIA MPF - PRIME VALUE CHOICE
INVESTMENT REPORT (CONTINUED) FOR THE YEAR ENDED 30TH NOVEMBER 2018
c) Investment Portfolio As At 30th November 2018 (continued)
2018 Holding Fair Value Cost %of
Units HK$ HK$ Net Assets Manager's Choice Fund Harbinger Japanese Equity Fund 1,983,859 40,986,519 36,658,420 0.95 JPMorgan SAR American Fund 1,951,662 511,348,578 460,687,037 11.88 JPMorgan SAR Asian Fund 209,119 115,554,431 106,461,420 2.68 JPMorgan SAR European Fund 1,241,112 279,918,633 298,915,703 6.50 JPMorgan SAR Global Emerging Markets Fund 2,314,751 38,679,487 38,575,071 0.90 JPMorgan SAR Hong Kong Fund 9,243,406 705,364,314 595,122,824 16.39 JPMorgan SAR Japan Fund 582,227 145,940,550 127,569,841 3.39 PineBridge Asian Fund 456,892 173,735,057 178,471,821 4.04 PineBridge Europe Equity Fund 12,542,476 282,205,714 305,416,026 6.56 PineBridge Hong Kong Equity Fund 7,456,742 302,370,900 281,952,000 7.03 PineBridge Japan Equity Fund 9,172,168 177,022,840 166,245,136 4.11 PineBridge US Equity Fund 8,115,991 245,752,222 193,157,373 5.71 JPMorgan SAR Asian Bond Fund 6,124,413 71,104,438 72,465,244 1.65 JPMorgan SAR Global Bond Fund 1,575,075 293,609,307 292,095,867 6.82 PineBridge Asian Bond Fund 1,140,633 118,273,831 112,510,159 2.75 PineBridge Global Bond Fund 4,223,572 681,215,884 689,583,354 15.83
Total 4,183,082,705 3,955,887,296 97.19
Fidelity Capital Stable Fund Fidelity Global Investment Fund -Capital Stable Fund - Class B 73,603,025 966,407,721 935,209,397 100.26
Fidelity Stable Growth Fund Fidelity Global Investment Fund -Stable Growth Fund - Class B 146,783,466 2,078,453,875 1,940,763,612 100.14
Fidelity Growth Fund Fidelity Global Investment Fund -Growth Fund - Class B 133,189,388 2,129,698,307 1,923,916,031 100.13
Asian Bond Fund JPMorgan SAR Asian Bond Fund 82,855,093 961,947,625 936,529,002 99.98
Eurasia Fund iShares MSC! EAFE ETF 542,637 266,450,411 268,055,721 78.59 Tracker Fund of Hong Kong 2,659,349 71,004,618 66,501,207 20.94
Total 337,455,029 334,556,928 99.53
Hong Kong and China Fund Hang Seng China Enterprises Index ETF (Not, 2l 4,363,801 469,108,608 476,132,432 21.50 Tracker Fund of Hong Kong 62,510,824 1,669,039,000 1,549,517,512 76.49
Total 2,138,147,608 2,025,649,944 97.99
Note 2: Formerly known as Hang Seng H-share Index ETF prior to 5th March 2018.
65

AIA MPF - PRIME VALUE CHOICE
INVESTMENT REPORT (CONTINUED) FOR THE YEAR ENDED 30TH NOVEMBER 2018
c) Investment Portfolio As At 30th November 2018 (continued)
American Fund iShares Core S&P 500 ETF iShares Latin America 40 ETF
Age 65 Plus Fund Vanguard Income Fund
Core Accumulation Fund Vanguard Moderate Growth Fund
China HK Dynamic Asset Allocation Fund Value Partners Asset Allocation Fund
2018 Holding Fair Value Cost
Units HK$ HK$
330,150 717,501,830 594,488,216 682,311 171,519,667 168,190,785
889,021,497 762,679,001
42,635,303 441,799,804 440,006,994
150,585,199 1,638,954,245 1,605,256,624
49,576,969 543,234,678 541,664,971
%of Net Assets
80.66 19.28
99.94
100.09
99.92
99.81
Note 3: The underlying approved pooled investment funds as listed above were established in Hong Kong and have been approved by the MPFA and authorised by the SFC.
Note 4: The investments are accounted for on a trade date basis.
66

AIA MPF - PRIME VALUE CHOICE
INVESTMENT REPORT (CONTINUED) FOR THE YEAR ENDED 30TH NOVEMBER 2018
d) Statement of Movement in Portfolio Holdings
Growth Portfolio Harbinger Japanese Equity Fund JPMorgan SAR American Fund. JPMorgan SAR Asian Fund JPMorgan SAR European Fund JPMorgan SAR Global Emerging Markets Fund JPMorgan SAR Hong Kong Fund JPMorgan SAR Japan Fund PineBridge Asian Fund PineBridge Europe Equity Fund PineBridge Hong Kong Equity Fund PineBridge Japan Equity Fund PineBridge US Equity Fund JPMorgan SAR Asian Bond Fund JPMorgan SAR Global Bond Fund PineBridge Asian Bond Fund PineBridge Global Bond Fund
Balanced Portfolio Harbinger Japanese Equity Fund JPMorgan SAR American Fund JPMorgan SAR Asian Fund JPMorgan SAR European Fund JPMorgan SAR Global Emerging Markets Fund JPMorgan SAR Hong Kong Fund JPMorgan SAR Japan Fund PineBridge Asian Fund PineBridge Europe Equity Fund PineBridge Hong Kong Equity Fund PineBridge Japan Equity Fund PineBridge US Equity Fund JPMorgan SAR Asian Bond Fund JPMorgan SAR Global Bond Fund PineBridge Asian Bond Fund PineBridge Global Bond Fund
67
2018 2017 %of %of
Net Assets Net Assets 2.00 8.26 9.18 7.47 6.70 7.86 8.39 9.60 0.47 0.49
16.24 22.31 6.45 2.81 3.82 5.84 7.05 9.56
12.74 8.59 5.02 2.79
11.91 11.50 0.25
4.09 1.00 0.74
2.65 1.01
96.71 100.08
0.68 4.90 8.67 4.21 1.77 2.78 4.60 4.42 1.15 0.73
11.54 11.20 2.42 2.79 2.66 4.13 4.64 4.41 4.95 4.77 2.94 3.01 4.17 8.62 1.69 2.99
11.87 18.68 2.81 6.91
27.54 I 0.11
94.IO 94.66

AIA MPF - PRIME VALUE CHOICE
INVESTMENT REPORT (CONTINUED) FOR THE YEAR ENDED 30TH NOVEMBER 2018
d) Statement of Movement in Portfolio Holdings (Continued)
Capital Stable Portfolio Harbinger Japanese Equity Fund JPMorgan SAR American Fund JPMorgan SAR Asian Fund
JPMorgan SAR European Fund JPMorgan SAR Global Emerging Markets Fund JPMorgan SAR Hong Kong Fund JPMorgan SAR Japan Fund PineBridge Asian Fund PineBridge Europe Equity Fund
PineBridge Hong Kong Equity Fund PineBridge Japan Equity Fund PineBridge US Equity Fund JPMorgan SAR Asian Bond Fund JPMorgan SAR Global Bond Fund JPMorgan SAR HKD Bond Fund PineBridge Asian Bond Fund PineBridge Global Bond Fund PineBridge Hong Kong Dollar Fixed Income Fund
Guaranteed Portfolio MPF Capital Guaranteed Plus Policy
MPF Conservative Fund PineBridge Hong Kong Dollar Money Market Fund
Hong Kong Equity Fund JPMorgan SAR Hong Kong Fund PineBridge Hong Kong Equity Fund
European Equity Fund JPMorgan SAR European Fund
Japan Equity Fund JPMorgan SAR Japan Fund
North American Equity Fund PineBridge US Equity Fund
Asian Equity Fund JPMorgan SAR Asian Fund
68
2018 2017 % of % of
Net Assets Net Assets 0.41 3.63 5.21 3.05
1.16 1.54 2.75 2.66
0.60 6.87 6.32 1.46 2.07 1.75 2.29 2.77 2.65 2.95 2.69 1.77 2.23 2.50 6.22 1.88 2.70
14.76 26.98 1.82 1.73 3.13 6.24
34.23 14.60 3.39 3.20
89.41 90.80
100.03 100.01
99.78 100.02
48.68 51.57 100.07
100.25 100.07
100.20 100.15
100.37 100.37
100.14 100.23
100.18 100.30

AIA MPF - PRIME VALUE CHOICE
INVESTMENT REPORT (CONTINUED) FOR THE YEAR ENDED 30TH NOVEMBER 2018
d) Statement of Movement in Portfolio Holdings (Continued)
Greater China Equity Fund JPMorgan SAR Greater China Fund PineBridge Greater China Equity Fund
Allianz Capital Stable Fund (Notei)
Allianz Choice Capital Stable Fund (Class I)
Allianz Growth Fund (Not'2J
Allianz Choice Growth Fund (Class I)
Allianz Stable Growth Fund (Notell
Allianz Choice Stable Growth Fund (Class I)
Green Fund Amundi HK-Green Planet Fund (Class S)
Global Bond Fund PineBridge Global Bond Fund
World Fund iShares Core S&P 500 ETF iShares Latin America 40 ETF iShares MSC! EAFE ETF
2018 2017 %of %of
Net Assets Net Assets
42.77 57.44 100.23
100.21 100.23
NIA 100.18
NIA 100.10
NIA 100.11
100.12 100.01
100.09 99.95
51.92 53.34 19.80 17.82 28.32 28.56
100.04 99.72
Note 2 : Allianz Capital Stable Fund, Allianz Growth Fund and Allianz Stable Growth Fund ("the 3 Allianz Funds") had no investments and operations since 15th November 2018. MPFA had approved the termination of the 3 Allianz Funds to take effect on 13th March 2019.
69

AIA MPF - PRIME VALUE CHOICE
INVESTMENT REPORT (CONTINUED) FOR THE YEAR ENDED 30TH NOVEMBER 2018
d) Statement of Movement in Portfolio Holdings (Continued)
2018 2017 % of % of
Manager's Choice Fund Net Assets Net Assets Harbinger Japanese Equity Fund 0.95 7.32 JPMorgan SAR American Fund 11.88 6.35 JPMorgan SAR Asian Fund 2.68 4.04 JPMorgan SAR European Fund 6.50 7.02 JPMorgan SAR Global Emerging Markets Fund 0.90 1.49 JPMorgan SAR Hong Kong Fund 16.39 18.10 JPMorgan SAR Japan Fund 3.39 4.06 PineBridge Asian Fund 4.04 6.00 PineBridge Europe Equity Fund 6.56 7.02 PineBridge Hong Kong Equity Fund 7.03 7.71 PineBridge Japan Equity Fund 4.11 4.32 PineBridge US Equity Fund 5.71 13.05 JPMorgan SAR Asian Bond Fund 1.65 JPMorgan SAR Global Bond Fund 6.82 2.22 PineBridge Asian Bond Fund 2.75 6.88 PineBridge Global Bond Fund 15.83 1.24
97.19 96.82
Fidelity Capital Stable Fund Fidelity Global Investment Fund -Capital Stable Fund - Class B 100.26 100.19
Fidelity Stable Growth Fund Fidelity Global Investment Fund -Stable Growth Fund - Class B 100.14 99.93
Fidelity Growth Fund Fidelity Global Investment Fund -Growth Fund - Class B 100.13 99.95
Asian Bond Fund JPMorgan SAR Asian Bond Fund 99.98 99.97
Eurasia Fund iShares MSC! EAFE ETF 78.59 78.67 Tracker Fund of Hong Kong 20.94 20.71
99.53 99.38
Hong Kong and China Fund Hang Seng China Enterprises Index ETF (Note 1) 21.50 18.66 Tracker Fund of Hong Kong 76.49 79.31
97.99 97.97
Note I: Formerly known as Hang Seng H-share Index ETF prior to 5th March 2018.
70

AIA MPF - PRIME VALUE CHOICE
INVESTMENT REPORT (CONTINUED) FOR THE YEAR ENDED 30TH NOVEMBER 2018
d) Statement of Movement in Portfolio Holdings (Continued)
American Fund iShares Core S&P 500 ETF iShares Latin America 40 ETF
Age 65 Plus Fund Vanguard Income Fund
Core Accumulation Fund Vanguard Moderate Growth Fund
China HK Dynamic Asset Allocation Fund Value Partners Asset Allocation Fund
71
2018 2017 %of %of
Net Assets Net Assets 80.66 82.79 19.28 16.90
99.94 99.69
100.09 99.59
99.92 99.63
99.81 97.57
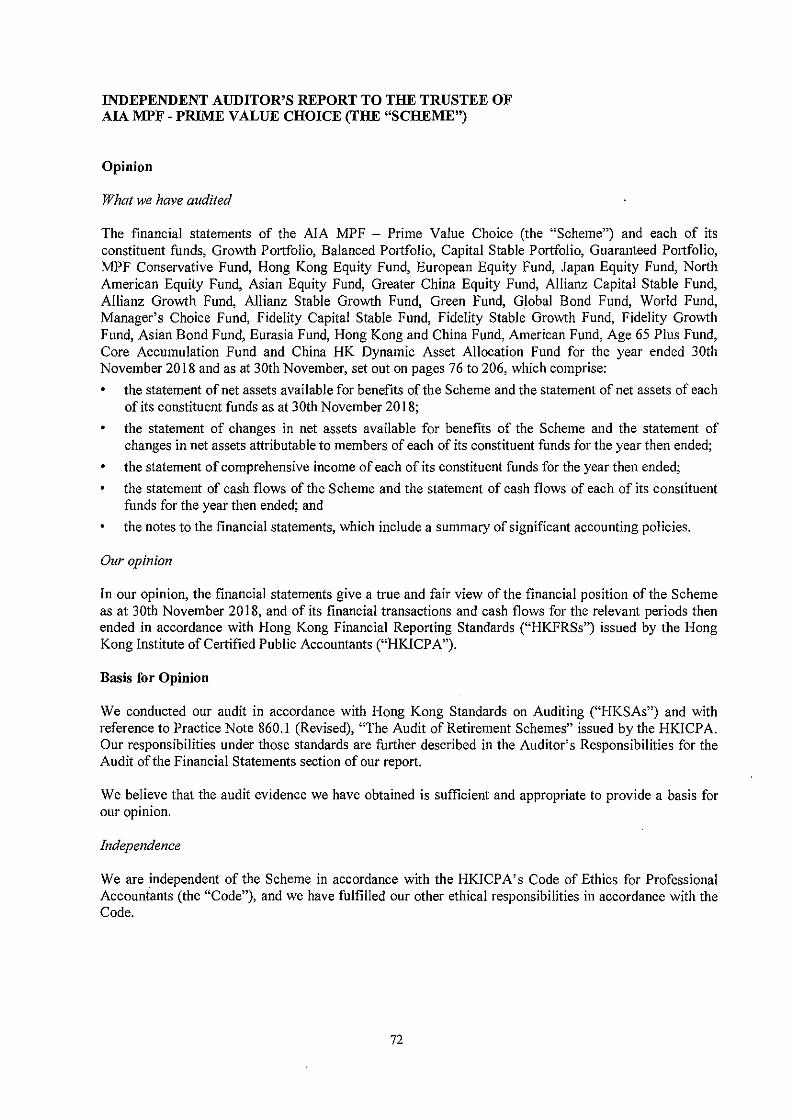
INDEPENDENT AUDITOR'S REPORT TO THE TRUSTEE OF AIA MPF - PRIME VALUE CHOICE (THE "SCHEME")
Opinion
What we have audited
The financial statements of the AJA MPF - Prime Value Choice (the "Scheme") and each of its constituent funds, Growth Portfolio, Balanced Portfolio, Capital Stable Portfolio, Guaranteed Portfolio, MPF Conservative Fund, Hong Kong Equity Fund, European Equity Fund, Japan Equity Fund, North American Equity Fund, Asian Equity Fund, Greater China Equity Fund, Allianz Capital Stable Fund, Allianz Growth Fund, Allianz Stable Growth Fund, Green Fund, Global Bond Fund, World Fund, Manager's Choice Fund, Fidelity Capital Stable Fund, Fidelity Stable Growth Fund, Fidelity Growth Fund, Asian Bond Fund, Eurasia Fund, Hong Kong and China Fund, American Fund, Age 65 Plus Fund, Core Accumulation Fund and China HK Dynamic Asset Allocation Fund for the year ended 30th November 2018 and as at 30th November, set out on pages 76 to 206, which comprise:
• the statement of net assets available for benefits of the Scheme and the statement of net assets of each of its constituent funds as at 30th November 2018;
• the statement of changes in net assets available for benefits of the Scheme and the statement of changes in net assets attributable to members of each of its constituent funds for the year then ended;
• the statement of comprehensive income of each of its constituent funds for the year then ended;
the statement of cash flows of the Scheme and the statement of cash flows of each of its constituent funds for the year then ended; and
• the notes to the financial statements, which include a summary of significant accounting policies.
Our opinion
In our opinion, the financial statements give a true and fair view of the financial position of the Scheme as at 30th November 2018, and of its financial transactions and cash flows for the relevant periods then ended in accordance with Hong Kong Financial Reporting Standards ("HKFRSs") issued by the Hong Kong Institute of Certified Public Accountants ("HKICPA").
Basis for Opinion
We conducted our audit in accordance with Hong Kong Standards on Auditing ("HKSAs") and with reference to Practice Note 860.1 (Revised), "The Audit of Retirement Schemes" issued by the HKICPA. Our responsibilities under those standards are further described in the Auditor's Responsibilities for the Audit of the Financial Statements section of our report.
We believe that the audit evidence we have obtained is sufficient and appropriate to provide a basis for our opinion.
Independence
We are .independent of the Scheme in accordance with the HKICPA's Code of Ethics for Professional Accountants (the "Code"), and we have fulfilled our other ethical responsibilities in accordance with the Code.
72

INDEPENDENT AUDITOR'S REPORT TO THE TRUSTEE OF AIA MPF - PRIME VALUE CHOICE (THE "SCHEME") (CONTINUED)
Emphasis of Matter
We draw attention to Note 2(a) to these financial statements, which states that the Trustee has resolved to terminate Allianz Capital Stable Fund, Allianz Growth Fund and Allianz Stable Growth Fund. As a result, these financial statements have not been prepared on a going concern basis, and are prepared in accordance with the basis set out in Note2(a). Our opinion is not qualified in respect of this matter.
Other Information
The Trustee of the Scheme is responsible for the other information. The other information comprises all of the information included in the annual report other than the financial statements and our auditor's report thereon.
Our opinion on the financial statements does not cover the other information and we do not express any form of assurance conclusion thereon.
In connection with our audit of the financial statements, our responsibility is to read the other information and, in doing so, consider whether the other information is materially inconsistent with the financial statements or our knowledge obtained in the audit or otherwise appears to be materially misstated.
If, based on the work we have performed, we conclude that there is a material misstatement of this other information, we are required to report that fact. We have nothing to report in this regard.
Responsibilities of Trustee for the Financial Statements
The Trustee is responsible for the preparation of financial statements that give a true and fair view in accordance with HKFRSs issued by the HKICPA, and for such internal control as the Trustee determines is necessary to enable the preparation of financial statements that are free from material misstatement, whether due to fraud or error.
In preparing the financial statements, the Trustee is responsible for assessing the Scheme's' ability to continue as a going concern, disclosing, as applicable, matters related to going concern and using the going concern basis of accounting unless the Trustee either intends to liquidate the Scheme and its constituent funds or to cease operations, or has no realistic alternative but to do so.
In addition, the Trustee is required to ensure that the financial statements have been properly prepared in accordance with sections 80, 81, 83 and 84 of the Hong Kong Mandatory Provident Fund Schemes (General) Regulation (the "General Regulation").
73

INDEPENDENT AUDITOR'S REPORT TO THE TRUSTEE OF AIA MPF - PRIME VALUE CHOICE (THE "SCHEME") (CONTINUED)
Auditor's Respousibilities for the Audit of the Fiuaucial Statemeuts
Our objectives are to obtain reasonable assurance about whether the financial statements as a whole are free from material misstatement, whether due to fraud or error, and to issue an auditor's report that includes our opinion. We report our opinion solely to you, as a body, in accordance with section 102 of the General Regulation, and for no other purpose. We do not assume responsibility towards or accept liability to any other person for the contents of this report. Reasonable assurance is a high level of assurance, but is not a guarantee that an audit conducted in accordance with HKSAs will always detect a material misstatement when it exists. Misstatements can arise from fraud or error and are considered material if, individually or in the aggregate, they could reasonably be expected to influence the economic decisions of users taken on the basis of these financial statements. In addition, we are required to assess whether the financial statements of the Scheme have been properly prepared, in all material respects, in accordance with sections 80, 81, 83 and 84 of the General Regulation.
As part of an audit in accordance with HKSAs, we exercise professional judgment and maintain professional scepticism throughout the audit. We also: • Identify and assess the risks of material misstatement of the financial statements, whether due to
fraud or error, design and perform audit procedures responsive to those risks, and obtain audit evidence that is sufficient and appropriate to provide a basis for our opinion. The risk of not detecting a material misstatement resulting from fraud is higher than for one resulting from error, as fraud may involve collusion, forgery, intentional omissions, misrepresentations, or the override of internal control.
• Obtain an understanding of internal control relevant to the audit in order to design audit procedures that are appropriate in the circumstances, but not for the purpose of expressing an opinion on the effectiveness of the Scheme's internal control.
• Evaluate the appropriateness of accounting policies used and the reasonableness of accounting estimates and related disclosures made by the Trustee.
• Conclude on the appropriateness of the Trustee's use of the going concern basis of accounting and, based on the audit evidence obtained, whether a material uncertainty exists related to events or conditions that may cast significant doubt on the Scheme's ability to continue as a going concern. If we conclude that a material uncertainty exists, we are required to draw attention in our auditor's report to the related disclosures in the financial statements or, if such disclosures are inadequate, to modify our opinion. Our conclusions are based on the audit evidence obtained up to the date of our auditor's report. However, future events or conditions may cause the Scheme to cease to continue as a going concern.
• Evaluate the overall presentation, structure and content of the financial statements, including the disclosures, and whether the financial statements represent the underlying transactions and events in a manner that achieves fair presentation.
We communicate with the Trustee regarding, among other matters, the planned scope and timing of the audit and significant audit findings, including any significant deficiencies in internal control that we identify during our audit.
74

INDEPENDENT AUDITOR'S REPORT TO THE TRUSTEE OF AIA MPF - PRIME VALUE CHOICE (THE "SCHEME") (CONTINUED)
Report on Matters under the General Regulation
(a) In our opinion, the financial statements have been properly prepared, in all material respects, in accordance with sections 80, 81, 83 and 84 of the General Regulation; and
(b) We have obtained all the information and explanations which, to the best of our knowledge and belief, are necessary for the purpose of our audit.
PricewaterhouseCoopers Certified Public Accountants
Hong Kong, 28th May 2019
75

AIA MPF - PRIME VALUE CHOICE
STATEMENT OF NET ASSETS AVAILABLE FOR BENEFITS -SCHEME AS AT 30TH NOVEMBER 2018
Note 2018 HK$
Assets Current assets Investments in constituent funds 8 76,824,880,845 Contributions receivable 6
From employers 62,852,152 From members 67,118,007
Amounts receivable on redemption ofunits in constituent funds 224,846,266 Other receivables 13,784,763 Bank balances 211,870,745
Total assets 77,405,352,778
Liabilities Current liabilities Benefits payable 7 92,818,829 Forfeitures payable 144,762,310 Amounts payable on subscription ofunits in constituent funds 207,259,142 Accruals and other payables 150,776,940
Total liabilities 595,617,221
Net assets available for benefits attributable to members 76,809,735,557
On behalf of AIA Company (Trustee) Limited
Director
The accompanying notes are an integral part of these financial statements.
76
2017 HK$
77,845,639,837
41,382,564 51,828,583
320,594,605 21,067,028
201,864,972
78,482,377,589
102,470,788 122,297,706 311,128,993 130,274,314
666,171,801
77,816,205,788

AIA MPF - PRIME VALUE CHOICE
STATEMENT OF CHANGES IN NET ASSETS AVAILABLE FOR BENEFITS- SCHEME FOR THE YEAR ENDED 30TH NOVEMBER 2018
Income Net unrealised (losses)/gains on investments in constituent funds Net realised gains on redemption of units in constituent funds Interest on bank deposits Other income
Total (Ioss)/income
Expenses Bank charges
Total expenses
Net (Ioss)/income
. Contribntions received and receivable
From employers Mandatory Voluntary
From members Mandatory Voluntary
Contribution surcharge
Transfers in
Group transfers in from other schemes Individual transfers in from other schemes
The accompanying notes are an integral part of these financial statements. 77
Note
6
2018 HK$
(6,737,179,590) 2,399,181,825
17,189 841,107
(4,337,139,469)
864,048
864,048
(4,338,003,517)
2,993,046,621 827,464,580
3,218,332,166 253,036,518
7,291,879,885
7,083,615
480,668,973 2,644,788,353
3,125,457,326
2017 HK$
I 0,085,250,067 1,648,928,894
4,794 979,104
11,735,162,859
1,005,465
1,005,465
ll,734,157,394
2,849,534,208 739,549,851
3,032,685,711 957,968,119
7,579,737,889
6,067,443
619,798,207 3,055,647,599
3,675,445,806

AIA MPF - PRIME VALUE CHOICE
STATEMENT OF CHANGES IN NET ASSETS AVAILABLE FOR BENEFITS - SCHEME (CONTINUED) FOR THE YEAR ENDED 30TH NOVEMBER 2018
Benefits paid and payable Retirement/early retirement Death Permanent departure Total incapacity Small balance Refund of additional voluntary contributions to leavers and
offsetting of long service payment/ severance payment
Transfers out Group transfers out to other schemes Individual transfers out to other schemes
Forfeitures
Change in net assets available for benefits attributable to members
Net assets available for benefits attributable to members at the beginning of the year - Members' accounts
Net assets available for benefits attributable to members at the end of the year - Members1 accounts
The accompanying notes are an integral part of these financial statements.
78
Note
7
2018 2017 HK$ HK$
922,661,533 865,852,588 67,249,351 72,213,624
511,979,054 506,050,661 19,954,288 22,890,617
40,092 71,577
702,101,638 1,506,216,530
2,223,985,956 2,973,295,597
678,025,779 548,456,500 4,082,233,860 3,762,014,918
4,760,259,639 4,310,471,418
108,641,945 99,389,549
(1,006,470,231) 15,612,251,968
77,816,205,788 62,203,953,820
76,809,735,557 77,816,205,788

AIA MPF - PRIME VALUE CHOICE
STATEMENT OF CASH FLOWS - SCHEME FOR THE YEAR ENDED 30TH NOVEMBER 2018
Cash flows from operating activities
Net (loss)/income Adjustment for:
- Interest on bank deposits
Net decrease/(increase) in investments in constituent funds Net decrease/(increase) in amounts receivable on redemption of
units in constituent funds Net decrease/(increase) in other receivables Net (decrease)/increase in amounts payable on subscription of units
in constituent funds Net increase in accruals and other payables Interest received on bank deposits
Net cash used in operating activities
Cash flows from financing activities
Contributions and transfers in received Benefits, transfers out paid Forfeitures paid
Net cash generated from financing activities
Net increase in cash and cash equivalents
Cash and cash equivalents at the beginning of the year
Cash and cash equivalents at the end of the year
Analysis of balances of cash and cash equivalents
Bank balances
The accompanying notes are an integral part of these financial statements.
79
Note 2018 HK$
(4,338,003,517)
(17,189)
(4,338,020,706)
1,020,758,992
95,748,339 7,282,265
(103,869,851) 20,502,626
17,189
(3,297,581,146)
10,387,661,814 (6,993,897,554)
(86,177,341)
3,307,586,919
10,005,773
201,864,972
211,870,745
211,870,745
2017 HK$
11,734,157,394
(4,794)
11,734,152,600
(15,613,241,125)
(151,008,137) (6,500,464)
157,198,733 27,082,931
4,794
(3,852,310,668)
11,248,822,196 (7,281,838,051)
(85,996,369)
3,880,987,776
28,677,108
173,187,864
201,864,972
201,864,972

AIA MPF - PRIME VALUE CHOICE
STATEMENT OF NET ASSETS - CONSTITUENT FUNDS AS AT 30TH NOVEMBER 2018
Assets
Current assets Investments
Derivative financial instruments
Amounts receivable on subscription
Amounts receivable on sale of investments
Other receivables Bank balances
Total assets
Liabilities
Current liabilities Derivative financial instruments
Amounts payable on redemption
Amounts payable on purchase of investments
Accruals and other payables
Total liabilities
Net assets attributable to members
On behalf of AIA Company (Trustee) Limited
~~ Director
Note
8 9
9
10
The accompanying notes are an integral part of these financial statements.
Growth Portfolio
HK$
I 0,530,985,402
8,001,226
2,381,086
6,249
383,945,947
10,925,319,910
81,171
14,079,431
2,746,293
18,637,489
35,544,384
10,889,775,526
80
As at 30th November 2018 Balanced Capital Stable Portfolio Portfolio
HK$ HK$
5,102,134,197 3,109,760,235
6,713,320 3,885,785
1,126,838 1,927,342
5,375 4,902
330,240,128 378,785,211
5,440,219,858 3,494,363,475
114,332 57,967
7,835,713 8,871,150
1,164,445 1,269,986
9,260,153 5,950,910
18,374,643 16,150,013
5,421,845,215 3,478,213,462
Guaranteed MPF Portfolio Conservative Fund
HK$
9,168,614,948
15,995,702
2,324,966
9,186,935,616
21,002,981
21,002,981
9,165,932,635
HK$
5,358,106,261
26,108,384
5,384,214,645
10,192,738
4,193,603
14,386,341
5,369,828,304

AJA MPF - PRIME VALUE CHOICE
STATEMENT OF NET ASSETS-CONSTITUENT FUNDS (CONTINUED) AS AT 30TH NOVEMBER 2_!!_18
Hong Kong Note Equity Fund
HK$ Assets Current assets
Investments 8 5,994,590,747 Derivative financial instruments 9 Amounts receivable on subscription 27,411,372 Amounts receivable on sale of investments 6,026,177 Other receivables
Bank balances
Total assets 6,028,028,296
Liabilities Current liabilities
Derivative fmancial instruments 9 Amounts payable on redemption 37,418,523 Amounts payable on purchase of investments 981,316 Accruals and other payables 10,194,992
Total liabilities 48,594,831
Net assets attributable to members lO 5,979,433,465
On behalf of AIA Company (Trustee) Limited
~~ Director
The accompanying notes are an integral part of these financial statements.
81
As at 30th November 2018
European Japan North American Asian Equity Fund Equity Fund Equity Fund Equity Fund
HK$ HK$ HK$ HK$
1,449,718,959 662,964,708 2,499,986,790 3,954,418,559 132 1,321 1,071
2,550,658 13,599,257 13,436,592 7,331,647 754,445 6,679,945 334,562 6,651,997 512,846 222,674 734,085 1,370,461
1,453,537,040 683,467,905 2,514,492,029 3,969,773,735
156,334 70,402 224,827 416,828 3,573,879 12,191,771 10,593,491 14,500,081
343,469 9,563,820 3,114,854 641,524 2,572,381 1,149,395 4,185,354 6,806,140
6,646,063 22,975,388 18,118,526 22,364,573
1,446,890,977 660,492,517 2,496,373,503 3,947,409,162
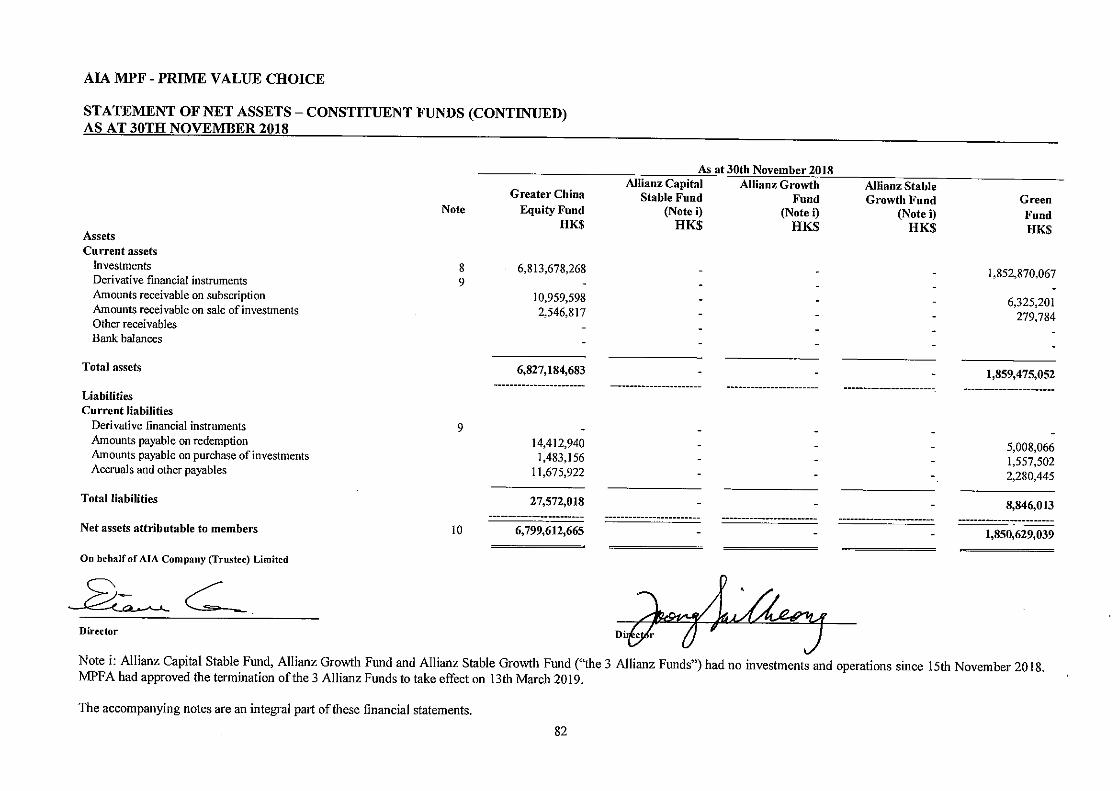
AIA MPF - PRIME VALUE CHOICE
STATEMENT OF NET ASSETS- CONSTITUENT FUNDS (CONTINUED) AS_AT 30TH NOVEMBER 2j)_l8
Assets Current assets
Investments Derivative financial instruments Amounts receivable on subscription Amounts receivable on sale of investments Other receivables Bank balances
Total assets
Liabilities Current liabilities
Derivative financial instruments Amounts payable on redemption Amounts payable on purchase ofinvestrnents Accruals and other payables
Total liabilities
Net assets attributable to members
On behalf of AIA Company (Trustee) Limited
~c____ Director
Note
8 9
9
10
Greater China Equity Fund
HK$
6,813,678,268
I0,959,598 2,546,817
6,827,184,683
14,412,940 1,483,156
11,675,922 --27,572,018
6,799,612,665
As at 30th November 2018 Allianz Capital
Stable Fund (Note i)
HK$
Allianz Growth Fund
(Note i) HK$
H~ Di~~½
Allianz Stable Growth Fund
(Note i) HK$
Green Fund HK$
1,852,870,067
6,325,201 279,784
1,859,475,052
5,008,066 1,557,502 2,280,445
8,846,013
1,850,629,039
Note i: Allianz Capital Stable Fund, Allianz Growth Fund and Allianz Stable Growth Fund ('~he 3 Allianz Funds") had no investments and operations since 15th November 2018. MPFA had approved the termination of the 3 Allianz Funds to take effect on 13th March 2019.
The accompanying notes are an integral part of these financial statements.
82

AJA MPF - PRIME VALUE CHOICE
STATEMENT OF NET ASSETS- CONSTITUENT FUNDS (CONTINUED) AS AT 30TH NOVEMBER 2018
Assets Current assets
Investments Derivative financial instruments Amounts receivable on subscription Amounts receivable on sale of investments Other receivables Bank balances
Total assets
Liabilities Current liabilities
Derivative financial instruments Amounts payable on redemption
Amounts payable on purchase of investments Accruals and other payables
Total liabilities
Net assets attributable to members
On behalf of AIA Company (Trustee) Limited
~c::: Director
Note
8 9
9
10
The accompanying notes are an integral part of these financial statements.
Global Bond
Fund HK$
1,5.17,266,766
11,810,084
422,098
1,529,498,948
141,346 8,014,185
4,347,839
1,118,748 --
13,622,118
1,515,876,830
83
As at 30th November 2018
World Manager's Fidelity Capital Fidelity Stable Fund Choice Fund Stable Fund Growth Fund HK$ HK$ HK$ HK$
1,334,015,963 4,183,082,705 966,407,721 2,078,453,875
1,834,402 8,656,838 3,389,010 3,473,267 128,258 277,353 1,411,273 981,810 394,276 2,105 15,092 32,458 372,091 129,333,385
1,336,744,990 4,321,352,386 971,223,096 2,082,941,410
121,596 81,370 1,941,158 9,031,839 6,239,312 4,688,127
291,031 3,142,983 175,042 938,415 5,149,250 1,091,941 2,432,132
3,292,200 17,405,442 7,331,253 7,295,301
1,333,452,790 4,303,946,944 963,891,843 2,075,646,109

AIA MPF - PRIME VALUE CHOICE
STATEMENT OF NET ASSETS- CONSTITUENT FUNDS (CONTINUED) A_S__AT 30TH NOVEMBER 2018
Assets Current assets
Investments Derivative financial instruments Amounts receivable on subscription Amounts receivable on sale of investments Other receivables Bank balances
Total assets
Liabilities Current liabilities
Derivative financial instruments Amounts payable on redemption Amounts payable on purchase of investments Accruals and other payables
Total liabilities
Net assets attributable to members
On behalf of AJA Company (Trustee) Limited
Director
Note
8
9
9
IO
The accompanying notes are an integral part of these financial statements.
Fidelity Growth Fund HK$
2,129,698,307
3,166,886 548,726 35,009
-2,133,448,928
4,246,666
2,368,819
6,615,485
2,126,833,443
84
o;
As at 30th November 2018
Asian Eurasia Hong Kong and American Bond Fund Fund China Fund Fund
HK$ HK$ HK$ HK$
961,947,625 337,455,029 2,138,147,608 889,021,497
8,729,079 632,338 7,710,139 3,558,771 113,789 75,428 5,690,995 82,610
48,945 120,132 273,750 2,100,874 49,282,127 348,240
970,790,493 340,312,614 2,200,951,001 893,284,868
12,286 80,339 4,526,305 776,195 17,520,898 2,708,270 3,528,379 59,911 333,277
630,577 399,291 1,376,564 631,454
8,685,261 1,247,683 18,897,462 3,753,340
962,105,232 339,064,931 2,182,053,539 889,531,528

AIA MPF - PRIME VALUE CHOICE
STATEMENT OF NET ASSETS- CONSTITUENT FUNDS (CONTINUED) AS AT 3QTH NOVEMBER 2018
Assets Current assets
Investments Derivative financial instruments Amounts receivable on subscription Amounts receivable on sale of investments Other receivables Bank balances
Total assets
Liabilities Current liabilities
Derivative financial instruments Amounts payable on redemption Amounts payable on purchase of investments Accruals and other payables
Total liabilities
Net assets attributable to members
On behalf of AIA Company (Trustee) Limited
~c__ Director
Note
8 9
9
10
The accompanying notes are an integral part of these financial statements.
Age 65 Plus Fund HK$
441,799,804
2,448,059
444,247,863
1,887,525 665,223 293,036 --
2,845,784
441,402,079
85
As at 30th November 2018
China HK Dynamic Core Asset Allocation
Accumulation Fund Fund HK$ HK$
1,638,954,245 543,234,678
7,367,169 2,164,358
1,646,321,414 545,399,036
2,991,527 593,495 1,965,875 1,016,610 513,836
5,974,012 1,107,331
1,640,347,402 544,291,705
Total HK$
75,657,314,964
2,524 207,259,142 40,344,201
4,200,457 1,274,408,003
77,183,529,291
1,558,798 224,846,266
37,375,925 94,867,457
358,648,446
76,824,880,845

AIA MPF - PRIME VALUE CHOICE
STATEMENT OF NET ASSETS - CONSTITUENT FUNDS (CONTINUED) AS AT 30TH N_!>VEMBER 2018
Assets Current assets
Investments Derivative financial instruments
Amounts receivable on subscription
Amounts receivable on sale of investments
Other receivables
Bank balances
Total assets
Liabilities Current liabilities
Derivative financial instruments
Amounts payable on redemption
Amounts payable on purchase of investments
Accruals and other payables
Total liabilities
Net assets attributable to members
On behalf of AIA Company (Trustee) Limited
~c:: Director
Note
8 9
9
10
The accompanying notes are an integral part of these financial statements.
Growth Portfolio
HK$
12,327,767,383
9,207,315
11,572,343
143 17,527,034
12,366,074,218
1,146,139
25,454,792
21.169,702
47,770,633
12,318,303,585
86
As at 30th November 2017
Balanced Portfolio
HK$
5,506,146,912
7,239,639
4,590,581 2,628
323,013,900
5,840,993,660
2,720,167
11,551,721
10.039,058
24,310,946
5,816,682,714
Capital Stable Portfolio
HK$
3,296,920,687
5,507,093 2,257,552
2,164
343,709,418
3,648,396,914
1,754,368
7,699,904
1,581,479
6,301,862
17,337,613
3,631,059,301
.. ~
Guaranteed Portfolio
HK$
8,205,078,039
20,541,641
2,930,911
8,228,550,591
24,087,379
24,087,379
8,204,463,212
MPF Conservative
Fund HK$
4,252,337,870
37,610,341
8,657,356
4,298,605,567
44,727,643
2,552,510
47,280,153
4,251,325,414

AIA MPF - PRIME VALUE CHOICE
STATEMENT OF NET ASSETS - CONSTITUENT FUNDS (CONTINUED) AS AT 30TH NOVEMBER 2018
Hong Kong Note Equity Fund
HK$
Assets Current assets
Investments 8 6,736,249,763
Derivative financial instruments 9
Amounts receivable on subscription 53,571,008
Amounts receivable on sale of investments 2,845,721
Other receivables
Bank balances
Total assets 6,792,666,492
Liabilities Current liabilities
Derivative fmancial instruments 9
Amounts payable on redemption 48,952,867
Amounts payable on purchase of investments 633,401
Accruals and other payables 11,653,037
Total liabilities 61,239,305
Net assets attributable to members 10 6,731,427,187
On behalf of AIA Company (Trustee) Limited
Director
The accompanying notes are an integral part of these financial statements.
87
As at 30th November 2017 European Japan North American Asian
Equity Fund Equity Fund Equity Fund Equity Fund HK$ HK$ HK$ HK$
1,727,869,690 750,128,734 2,295,704,110 4,450,838,370
698 809 2,296 8,322,735 5,809,972 12,355,513 12,665,358 1,780,442 820,899 2,450,247 2,088,499
I, 737,973,565 756,760,414 2,310,509,870 4,465,594,523
332,967 146,069 379,531 882,183
8,749,882 6,987,379 13,839,440 16,602,438
747,477 1,371,789 1,190,574
3,531,952 1,514,577 4,493,213 9,219,183
12,614,801 9,395,502 20,083,973 27,894,378
1,725,358,764 747,364,912 2,290,425,897 4,437,700,145
'~
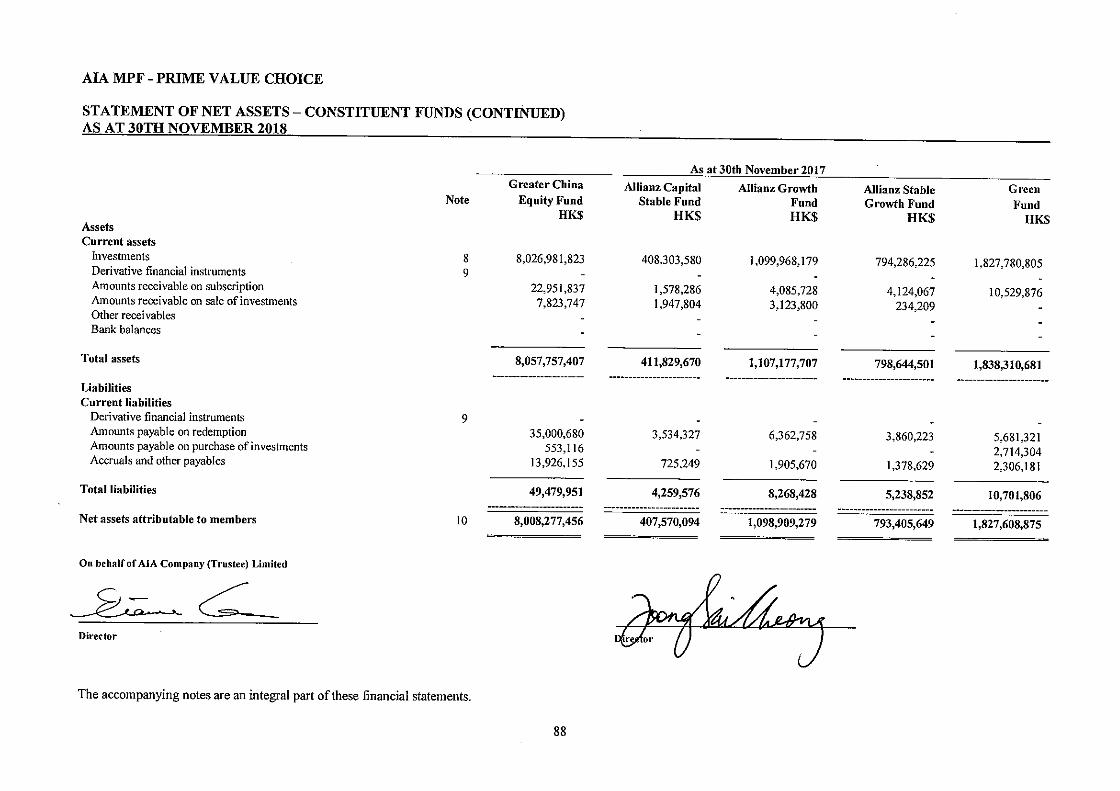
AIA MPF - PRIME VALUE CHOICE
STATEMENT OF NET ASSETS- CONSTITUENT FUNDS (CONTINUED) AS_ AT 30TH NOVEMBER 2018_
Assets Current assets
Investments
Derivative financial instruments Amounts receivable on subscription Amounts receivable on sale of investments Other receivables Bank balances
Total assets
Liabilities Current liabilities
Derivative financial instruments Amounts payable on redemption Amounts payable on purchase of investments Accruals and other payables
Total liabilities
Net assets attributable to members
On behalf of AJA Company (Trustee) Limited
Director
Note
8 9
9
IO
The accompanying notes are an integral part of these financial statements.
Greater China Equity Fund
HK$
8,026,981,823
22,951,837 7,823,747
8,057,757,407
35,000,680 553,116
13,926,155
49,479,951
8,008,277,456
88
As at 30th November 2017
Allianz Capital Allianz Growth Allianz Stable Green Stable Fund Fund Growth Fund Fund
HK$ HK$ HK$ HK$
408,303,580 1,099,968,179 794,286,225 1,827,780,805
1,578,286 4,085,728 4,124,067 10,529,876 1,947,804 3,123,800 234,209
411,829,670 1,107,177,707 798,644,501 1,838,310,681
3,534,327 6,362,758 3,860,223 5,681,321 2,714,304
725,249 1,905,670 1,378,629 2,306,181
4,259,576 8,268,428 5,238,852 10,701,806
407,570,094 1,098,909,279 793,405,649 1,827,608,875

AIA MPF - PRIME VALUE CHOICE
STATEMENT OF NET ASSETS-CONSTITUENT FUNDS (CONTINUED) AS AT 30TH NOVEMBER 2018
As at 30th November 2017 Global Bond World Manager's Fidelity Capital Fidelity Stable
Note Fund Fund Choice Fund Stable Fund Growth Fund HK$ HK$ HK$ HK$ HK$
Assets
Current assets Investments 8 1,299,403,744 1,255,558,954 4,452,023,893 451,589,480 1,195,891,799 Derivative financial instruments 9 Amounts receivable on subscription 14,525,952 4,238,508 14,600,53 I 4,040,895 5,694,354 Amounts receivable on sale of investments 1,949,293 340,917
Other receivables 19,315 1,238
Bank balances 4,523,470 I 52,130,338 -
Total assets 1,315,878,989 1,264,681,164 4,618,756,000 455,630,375 1,201,586,153
Liabilities
Current liabilities Derivative financial instruments 9 219,695 2I0,576 86,891
Amounts payable on redemption 11,884,968 1,996,919 11,324,244 2,662,966 2,937,096
Amounts payable on purchase of investments 2,440,705 2,103,949 3,262,443 1,619,423 409,467
Accruals and other payables 1,316,916 1,326,305 5,920,177 635,884 1,529,609
Total liabilities 15,862,284 5,637,749 20,593,755 4,918,273 4,876,172
Net assets attributable to members 10 1,300,016,705 1,259,043,415 4,598,162,245 450,712,102 1,196,709,981
On behalf of AIA Company (Trustee) Limited
~~ ~ Director
The accompanying notes are an integral part of these financial statements.
89

AIA MPF - PRIME VALUE CHOICE
STATEMENT OF NET ASSETS- CONSTITUENT FUNDS (CONTINUED) AS AT 30TH NOVEMBER 2018
Assets Current assets
Investments
Derivative financial instruments Amounts receivable on subscription
Amounts receivable on sale of investments
Other receivables Bank balances
Total assets
Liabilities Current liabilities
Derivative financial instruments
Amounts payable on redemption
Amounts payable on purchase of investments
Accruals and other payables
Total liabilities
Net assets attributable to members
On behalf of AIA Company (Trustee) Limited
~~ Director
Note
8 9
9
IO
The accompanying notes are an integral part of these financial statements.
Fidelity Growth Fund HK$
1,185,279,278
4,237,025 685,542
1,190,201,845
2,587,229
1,692,970
-4,280,199
1,185,921,646
90
As at 30th November 2017 Asian Eurasia Hong Kong and American
Bond Fund Fund China Fund Fund HK$ HK$ HK$ HK$
760,909,171 328,368,177 2,140,019,767 727,201,669
10,785,503 1,656,766 12,806,856 3,230,825
13,323 144,184 12,608
2,082,671 48,947,386 2,612,721
771,694,674 332,120,937 2,201,918,193 733,057,823
21,170 121,137
5,614,072 917,660 10,899,971 1,472,568
4,539,155 279,077 4,914,385 1,198,862
392,708 494,753 1,793,088 822,280
10,545,935 1,712,660 17,607,444 3,614,847
761,148,739 330,408,277 2,184,310,749 729,442,976

AlA MPF - PRIME VALUE CHOICE
STATEMENT OF NET ASSETS - CONSTITUENT FUNDS (CONTINUED) AS_ AT 30TH NOVEMBER 2018
Assets Current assets
Investments Derivative financial instruments Amounts receivable on subscription Amounts receivable on sale of investments Other receivables Bank balances
Total assets
Liabilities Current liabilities
Derivative fmancial instruments Amounts payable on redemption Amounts payable on purchase of investments Accruals and other payables
Total liabilities
Net assets attributable to members
On behalf of AJA Company (Trustee) Limited
~c:: -Director
Note
8 9
9
IO
The accompanying notes are an integral part of these financial statements.
Age 65 Plus Fund
HK$
215,319,489
3,126,277
218,445,766
1,304,693
837,099 95,769
-
2,237,561
216,208,205
91
As at 30th November 2017
Core China HK Dynamic Accumulation Fund Asset Allocation Fund
HK$ HK$
1,043, 110,80 I 289,459,669
7,404,869 8,680,223
1,050,515,670 298,139,892
2,715,606 1,183,859
114,586
682,093 287,105
3,512,285 1,470,964
1,047,003,385 296,668,928
Total
HK$
77,050,498,061
3,803 311,128,993
56,099,863 195,603
894,546,938
78,312,473,261
8,020,893 320,594,605
30,511,291 107,706,635
466,833,424
77,845,639,837
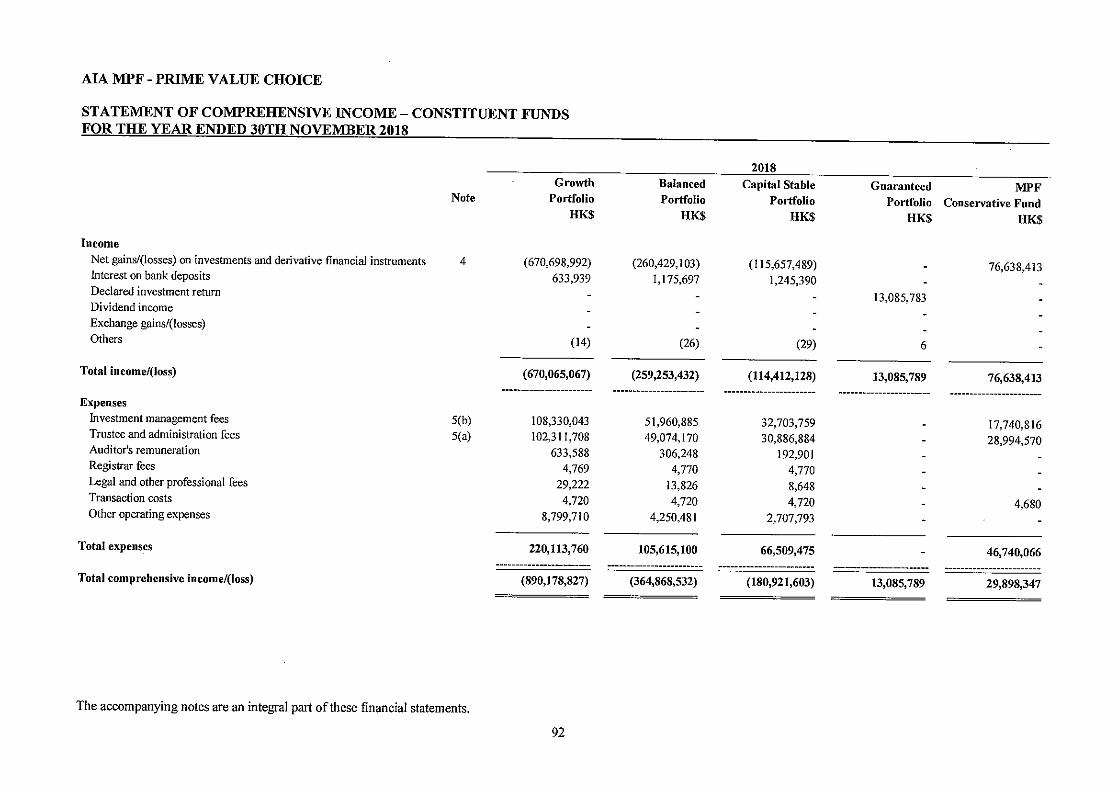
AIA MPF - PRIME VALUE CHOICE
STATEMENT OF COMPREHENSIVE INCOME - CONSTITUENT FUNDS FQ_.8. THE YEAR ENDED 30THNOVEMBER 2018
2018 Growth Balanced Capital Stable Guaranteed MPF
Note Portfolio Portfolio Portfolio Portfolio Conservative Fund HK$ HK$ HK$ HK$ HK$
Income Net gains/(losses) on investments and derivative financial instruments 4 (670,698,992) (260,429,103) (115,657,489) 76,638,413 Interest on bank deposits 633,939 1,175,697 1,245,390 Declared investment return 13,085,783 Dividend income
Exchange gains/(losses)
Others (14) (26) (29) 6
Total income/(loss) (670,065,067) (259,253,432) (114,412,128) 13,085,789 76,638,413
Expenses Investment management fees 5(b) 108,330,043 51,960,885 32,703,759 17,740,816 Trustee and administration fees 5(a) 102,31 1,708 49,074,170 30,886,884 28,994,570 Auditor's remuneration 633,588 306,248 192,901 Registrar fees 4,769 4,770 4,770 Legal and other professional fees 29,222 13,826 8,648 Transaction costs 4,720 4,720 4,720 4,680 Other operating expenses 8,799,710 4,250,481 2,707,793
Total expenses 220,113,760 105,615, 100 66,509,475 46,740,066
Total comprehensive income/(loss) (890,178,827) (364,868,532) (180,921,603) 13,085,789 29,898,347
The accompanying notes are an integral part of these financial statements.
92

AIA MPF - PRIME VALUE CHOICE
STATEMENT OF COMPREHENSIVE INCOME-CONSTITUENT FUNDS (CONTINUED) FOR THE YEAR ENDED 30TH NOVEMBER 2018
Hong Kong European Note Equity Fund Equity Fund
HK$ HK$
Income Net gains/(losses) on investments and derivative financial instruments 4 (402,310,391) (175,836,726) Interest on bank deposits Declared investment return
Dividend income Exchange gains/(losses) 6 6 Others 313 88
Total income/(loss) (402,310,072) (175,836,632)
Expenses Investment management fees S(b) 59,128,760 15,050,230
Trustee and administration fees S(a) 55,843,829 14,214,106
Auditor's remuneration 359,956 85,670
Registrar fees 269 269 Legal and other professional fees 16,154 4,073
Transaction costs 4,680 4,680
Other operating expenses 4,977,929 1,307,187
Total expenses 120,331,577 30,666,215
Total comprehensive income/(loss) (522,641,649) (206,502,847)
The accompanying notes are an integral part of these financial statements.
93
2018
Japan North American Asian Equity Fund Equity Fund Equity Fund
HK$ HK$ HK$
(67,087,857) 80,224,714 (261,050,476)
3 6 6 19
(67,087,854) 80,224,720 (261,050,451)
6,625,780 21,803,678 39,584,576 6,257,681 20,592,363 37,385,433
37,701 133,197 225,503 269 269 269
1,776 5,502 10,634 4,680 4,680 4,680
609,506 1,793,067 3,321,330
13,537,393 44,332,756 80,532,425
(80,625,247) 35,891,964 (341,582,876)

AIA MPF - PRIME VALUE CHOICE
STATEMENT OF COMPREHENSIVE INCOME- CONSTITUENT FUNDS (CONTINUED) FOR THE YEAR ENDED 30TH NOVEMBER 2J)l8
Greater China Allianz Capital Note Equity Fund Stable Fund
(Note i) HK$ HK$
Income
Net gains/(losses) on investments and derivative financial instruments 4 (633,517,482) (19,503,418) Interest on bank deposits Declared investment return
Dividend income
Exchange gains/(losses) 7 (121) Others 116 7,077
Total income/(loss) (633,517,359) (19,496,462)
Expenses
Investment management fees S(b) 69,541,369 3,676,181 Trustee and administration fees S(a) 65,677,960 3,471,515 Auditor's remuneration 422,431 16,603 Registrar fees 269 240
Legal and other professional fees 19,051 1,033 Transaction costs 4,680 4,385 Other operating expenses 5,852,177 331,101
Total expenses 141,517,937 7,501,058
Total comprehensive income/(loss) (775,035,296) (26,997,520)
2018
Allianz Growth Allianz Stable Green Fund Growth Fund Fund
(Note i) (Note i) HK$ HK$ HK$
(92,586,478) (47,492,193) (29,725,849)
(123) (121) 22,597 16,640 73
(92,564,004) (47,475,674) (29,725,776)
9,065,692 6,833,028 12,233,939 8,562,032 6,453,411 15,995,806
41,189 30,887 240 240
2,592 1,926 -. 4,385 4.385 5,238
715,908 549,723
18,392,038 13,873,600 28,234,983
(110,956,042) (61,349,274) (57,960,759)
Note i: Allianz Capital Stable Fund, Allianz Growth Fund and Allianz Stable Growth Fund ("the 3 Allianz Funds") had no investments and operations since 15th November 2018. MPF A had approved the termination of the 3 Allianz Funds to take effect on 13th March 2019.
The accompanying notes are an integral part of these financial statements.
94

AIA MPF - PRIME VALUE CHOICE
STATEMENT OF COMPREHENSIVE INCOME - CONSTITUENT FUNDS (CONTINUED) FOR THE YEAR ENDED 30TH NOVEMBER 2018
Global Bond World Note Fund Fund
HK$ HK$
Income
Net gains/(losses) on investments and derivative financial instruments 4 (62,841,773) (27,462,940) Interest on bank deposits 1,311 Declared investment return Dividend income 21,126,694 Exchange gains/(losses) (6,998) Others
Total income/(loss) (62,841,773) (6,341,933)
Expenses Investment management fees 5(b) 4,396,556 1,864,131
Trustee and administration fees 5(a) 8,793,113 7,989,134
Auditor's remuneration
Registrar fees
Legal and other professional fees
Transaction costs 4,680 4,680
Other operating expenses 422,481
Total expenses 13,194,349 10,280,426
Total comprehensive income/(loss) (76,036,122) (16,622,359)
The accompanying notes are an integral part of these financiai statements.
95
2018
Manager's Fidelity Capital Fidelity Stable Choice Fund Stable Fund Growth Fund
HK$ HK$ HK$
(239,987,684) (13,434,490) (43,566,560) 254,251
(42) 111,100 273,269
(239,733,475) (13,323,390) (43,293,291)
31,298,156 4,944,819 9,627,868 39,132,690 4,670,106 11,396,848
4,713 4,680 4,680 44,218
70,479,777 9,619,605 21,029,396
(310,213,252) (22,942,995) (64,322,687)

AIA MPF - PRIME VALUE CHOICE
STATEMENT OF COMPREHENSIVE INCOME- CONSTITUENT FUNDS (CONTINUED) FOR THE YEAR ENDED 30TH NOvtMBER 2!)18
Fidelity Growth Asian Note Fund Bond Fund
HK$ HK$
Income Net gains/(losses) on investments and derivative financial instruments 4 (58,696,903) (4,621,985) Interest on bank deposits
Declared investment return Dividend income
Exchange gains/(losses) Others 269,851
Total income/(loss) (58,427,052) (4,621,985)
Expenses Investment management fees 5(b) 11,539,740 662,859 Trustee and administration fees 5(a) 10,898,643 5,425,195 Auditor's remuneration
Registrar fees Legal and other professional fees Transaction costs 4,680 4,680 Other operating expenses 100,000
Total expenses 22,443,063 6,192,734
Total comprehensive income/(loss) (80,870,115) (10,814,719)
The accompanying notes are an integral part of these financial statements.
96
2018
Eurasia Hong Kong and American Fund China Fund Fund HK$ HK$ HK$
(38,570,251) (213,574,323) 14,956,628 204 603 1,849
8,348,716 72,070,960 10,860,795 (3,244) (489)
(30,224,575) (141,502,760) 25,818,783
318,156 4,129,894 1,793,660 2,121,042 13,766,316 4,891,802
4,680 4,680 4,680 105,657 271.475
2,549,535 17,900,890 6,961,617
(32,774,110) (159,403,650) 18,857,166

AIA MPF - PRIME VALUE CHOICE
STATEMENT OF COMPREHENSIVE INCOME - CONSTITUENT FUNDS (CONTINUED) FOR THE YEAR ENDED 30TH NOVEMBER 2018
2018
China HK Dynamic Core Asset
Note Age 65 Plus Fund Accumulation Fund Allocation Fund HK$ HK$ HK$
Income Net gains/(losses) on investments and derivative financial instruments 4 (1,997,921) (18,853,061) (7,189,461)
Interest on bank deposits
Declared investment return Dividend income
Exchange gains/(losses) Others
Total income/(loss) (1,997,921) (18,853,061) (7,189,461)
Expenses Investment management fees S(b) Trustee and administration fees S(a) 1;649,642 6,782,699 3,894,145
Auditor's remuneration 17,570 49,066 16,412
Registrar fees 269 213 208
Legal and other professional fees 700 2,998 1,000
Transaction costs 4,698 4,698 4,700
Other operating expenses 283,171 973,332 384,586
Total expenses 1,956,050 7,813,006 4,301,051
Total comprehensive income/(loss) (3,953,971) (26,666,067) (11,490,512)
The accompanying notes are an integral part of these financial statements.
97
Total HK$
(3,334,874,051)
3,313,244
13,085,783
l 12,407,165
(11,062)
701,038
(3,205,377,883)
524,854,575
567,132,843
2,568,922 17,333
119,135
126,242
37,800,832
1,132,619,882
(4,337,997,765)

AIA MPF - PRIME VALUE CHOICE
STATEMENT OF COMPREHENSIVE INCOME- CONSTITUENT FUNDS (CONTINUED) FOR THE YEAR ENDED 30TH_NOVEMBER 2018
Growth Balanced Note Portfolio Portfolio
HK$ HK$
Income Net gains on investments and derivative financial instruments 4 2,812,664,885 854,113,182
Interest on bank deposits 186,831 628,384
Declared investment return
Dividend income Exchange gains/(losses)
Others (157) (84)
--Total income 2,812,851,559 854,741,482
--Expenses
Investment management fees S(b) 100,681,169 48,800,402
Trustee and administration fees S(a) 95,087,770 46,089,269
Auditor's remuneration 604,575 293,036
Registrar fees 4,781 4,781
Legal and other professional fees 26,827 13,186
Transaction costs 4,688 4,688
Other operating expenses 10,929,153 5,372,925
Total expenses 207,338,963 I 00,578,287
Total comprehensive income 2,605,512,596 754,163,195
The accompanying notes are an integral part of these financial statements.
98
2017
Capital Stable Guaranteed MPF Portfolio Portfolio Conservative Fund
HK$ HK$ HK$
386,328,983 38,572,665 518,784
12,140,719
(84) 38
386,847,683 12,140,757 38,572,665
31,161,839 10,382, l06
29,430,625 23,885,519
186,902
4,781
8,504 4,664 4,679
3.480,173
64,277,488 34,272,304
322,570,195 12,140,757 4,300,361

AIA MPF - PRIME VALUE CHOICE
STATEMENT OF COMPREHENSIVE INCOME - CONSTITUENT FUNDS (CONTINUED) FOR THE YEAR ENDED 30TH NOVEMBER 2018
2017
Hong Kong European Japan North American Asian Note Equity Fund Equity Fund Equity Fund Equity Fund Equity Fund
HK$ HK$ HK$ HK$ HK$
Income Net gains on investments and derivative financial instruments 4 1,568,748,170 429,877,794 177,020,307 432,944,683 1,005,168,884
Interest on bank deposits
Declared investment return
Dividend income Exchange gains/(losses) (261) (250) (250) (261) (250)
Others 31
Total income 1,568,747,940 429,877,544 177,020,057 432,944,422 1,005,168,634
Expenses Investment management fees 5(b) 54,933,589 14,115,967 5,767,655 18,059,621 36,906,192
Trustee and administration fees 5(a) 51,881,723 13,331,747 5,447,230 17,056,309 34,855,848
Auditor's remuneration 330,305 80,513 32,755 109,132 209,483
Registrar fees 280 280 280 280 280
Legal and other professional fees 14,589 3,748 1,529 4,812 9,797
Transaction costs 4,679 4,679 4,679 4,679 4,679
Other operating expenses 6,050,482 1,604,507 702,210 2,046,155 4,090,384
Total expenses 113,215,647 29,141,441 11,956,338 37,280,988 76,076,663
Total comprehensive income 1,455,532,293 400,736,103 165,063,719 395,663,434 929,091,971
The accompanying notes are an integral part of these financial statements.
99

AIA MPF - PRIME VALUE CHOICE
STATEMENT OF COMPREHENSIVE INCOME- CONSTITUENT FUNDS (CONTINUED) FOR THE YEAR ENDED 30TH NOVEMBER 2018
2017 Greater China Allianz Capital Allianz Growth Allianz Stable Green
Note Equity Fund Stable Fund Fund Growth Fund Fund HK$ HK$ HK$ HK$ HK$
Income
Net gains on investments and derivative financial instruments 4 1,921,414,990 44,940,560 249,005,739 118,983,910 352,485,155 Interest on bank deposits
Declared investment return
Dividend income
Exchange gains/(losses) (261) (350) (350) (350) 2,497 Others 1
Total income 1,921,414,730 44,940,210 249,005,389 118,983,560 352,487,652
Expenses
Investment management fees 5(b) 65,066,446 3,347,810 8,947,545 6,468,251 9,821,327 Trustee and administration fees 5(a) 61,451,644 3,161,820 8,450,459 6,108,904 13,405,258 Auditor's remuneration 391,236 19,099 50,863 36,775 (3) Registrar fees 280 280 280 280 Legal and other professional fees 17,180 891 2,377 1,722 Transaction costs 4,679 4,679 4,679 4,679 4,679 Other operating expenses 7,139,351 449,007 1,048,695 780.547 116,119
Total expenses 134,070,816 6,983,586 18,504,898 13,401,158 23,347,380
Total comprehensive income 1,787,343,914 37,956,624 230,500,491 105,582,402 329,140,272
The accompanying notes are an integral part of these financial statements.
l00
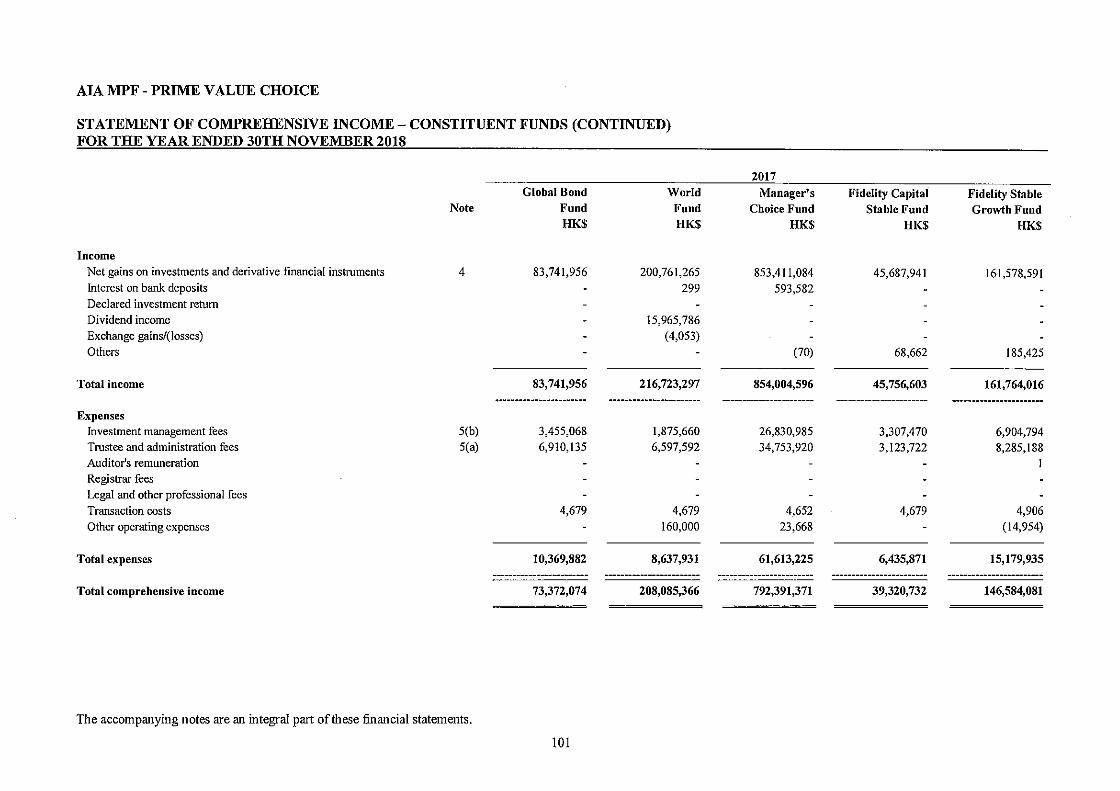
AJA MPF - PRIME VALUE CHOICE
STATEMENT OF COMPREHENSIVE INCOME- CONSTITUENT FUNDS (CONTINUED) FOR THE YEAR ENDED 30TH NOVEMBER 2018
2017 Global Bond World Manager's Fidelity Capitai Fidelity Stable
Note Fund Fund Choice Fund Stable Fund Growth Fund HK$ HK$ HK$ HK$ HK$
Income Net gains on investments and derivative financial instmments 4 83,741,956 200,761,265 853,411,084 45,687,941 161,578,591 Interest on bank deposits 299 593,582 Declared investment return Dividend income 15,965,786 Exchange gains/(losses) (4,053)
Others (70) 68,662 185,425
Total income 83,741,956 216,723,297 854,004,596 45,756,603 161,764,016
Expenses Investment management fees S(b) 3,455,068 1,875,660 26,830,985 3,307,470 6,904,794 Trustee and administration fees S(a) 6,910,135 6,597,592 34,753,920 3,123,722 8,285,188 Auditor1s remuneration
Registrar fees
Legal and other professional fees
Transaction costs 4,679 4,679 4,652 4,679 4,906 Other operating expenses 160,000 23,668 (14,954)
Total expenses 10,369,882 8,637,931 61,613,225 6,435,871 15,179,935
Total comprehensive income 73,372,074 208,085,366 792,391,371 39,320,732 146,584,081
The accompanying notes are an integral part of these financial statements.
101
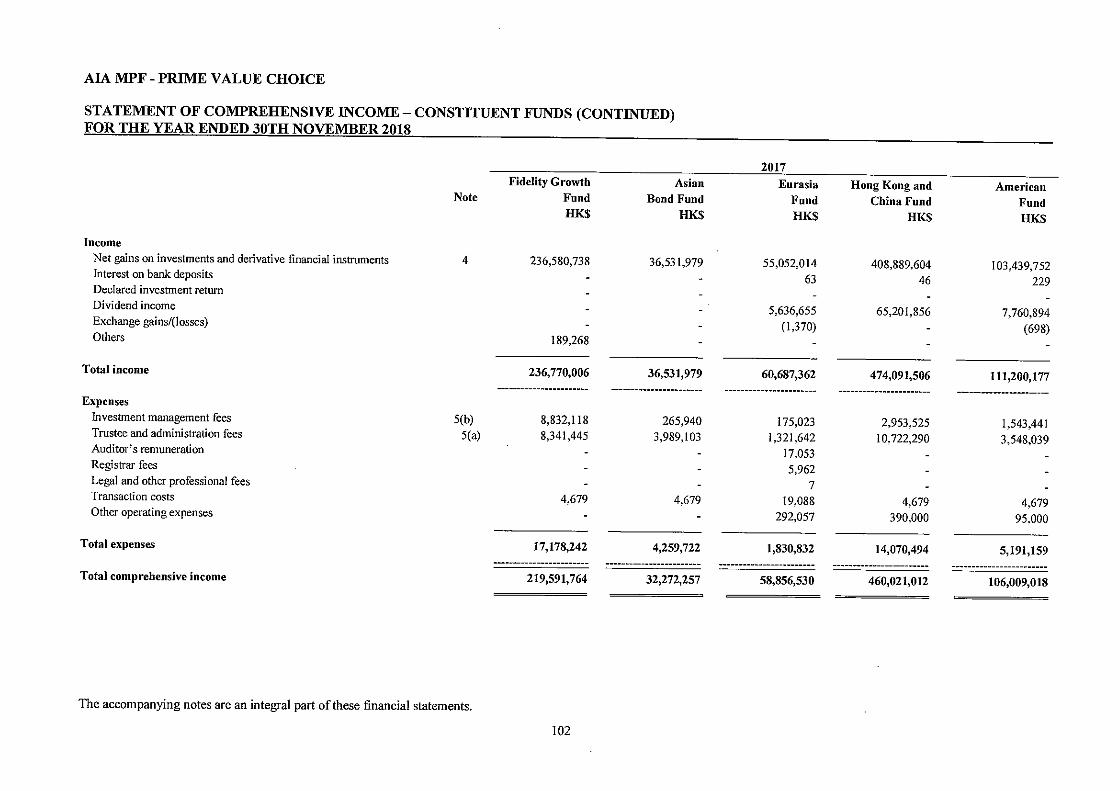
AIA MPF - PRIME VALUE CHOICE
STATEMENT OF COMPREHENSIVE INCOME- CONSTITUENT FUNDS (CONTINUED) FQR THE YE~ ENDED J_0TH NOVEMBER 2018
2017 Fidelity Growth Asian Eurasia Hong Kong and American
Note Fund Bond Fund Fund China Fund Fund HK$ HK$ HK$ HK$ HK$
Income
Net gains on investments and derivative financial instruments 4 236,580,738 36,531,979 55,052,014 408,889.604 103,439,752 Interest on bank deposits 63 46 229 Declared investment return
Dividend income 5,636,655 65,201,856 7,760,894 Exchange gains/(losses) (1,370) (698) Others 189,268
Total income 236, 770,006 36,531,979 60,687,362 474,091,506 111,200,177
Expenses Investment management fees 5(b) 8,832,118 265,940 175,023 2,953,525 1,543,441 Trustee and administration fees 5(a) 8,341,445 3,989,103 1,321,642 10,722,290 3,548,039 Auditor's remuneration 17,053 Registrar fees 5,962 Legal and other professional fees 7 Transaction costs 4.679 4,679 19,088 4,679 4,679 Other operating expenses 292,057 390,000 95.000
Total expenses 17,178,242 4,259,722 1,830,832 14,070,494 5,191,159
Total comprehensive income 219,591,764 32,272,257 58,856,530 460,021,012 106,009,018
The accompanying notes are an integral part of these financial statements.
102

AIA MPF - PRIME V ALOE CHOICE
STATEMENT OF COMPREHENSIVE INCOME- CONSTITUENT FUNDS (CONTINUED) FOR THE YEAR ENDED 30TH NOVEMBER 2018
2017
Income Net gains on investments and derivative financial instruments
Interest on bank deposits
Declared investment return
Dividend income
Exchange gains/(losses) Others
Total income
Expenses Investment management fees
Trustee and administration fees
Auditor's remuneration
Registrar fees
Legal and other professional fees
Transaction costs
Other operating expenses
Total expenses
Total comprehensive income
Note
4
5(b)
5(a)
Core Age 65 Plus Fund Accumulation Fund
(Note 1) (Note 1) HK$ HK$
4,011,795 53,319,679
4,011,795 53,319,679
406,652 2,114,906
469 56,978
75 237
128,735 150,757
779 3,122
34,213 477,000
570,923 2,803,000
3,440,872 50,516,679
China HK Dynamic Asset
Allocation Fund
(Note 2) HK$
9,068,660
9,068,660
550,363
15,759
173
3
1,953
81,573
649,824
8,418,836
Total
HK$
12,644,344,965
1,928,218
12,140,719
94,565,191
(6,207)
443,030
12,753,415,916
470,603,943
500,309,122 2,434,931
23,3IO
384,664
132,762
45,348,265
1,019,236,997
11,734,178,919
Note I: For Age 65 Plus Fund and Core Accumulation fund, the period is from !st April 2017 ( date of commencement of operations) to 30th November 2017. Note 2: For China HK Dynamic Asset Allocation Fund, the period is from 4th July 2017 (date of commencement of operations) to 30th November 2017.
The accompanying notes are an integral part of these financial statements.
103

AIA MPF - PRIME VALUE CHOICE
STATEMENT OF CHANGES IN NET ASSETS ATTRIBUTABLE TO MEMBERS- CONSTITUENT FUNDS FQR THE YEAR ENDED 30TH NOVEMBER 2018
2018
Growth Balanced Capital Stable Note Portfolio Portfolio Portfolio
HK$ HK$ HK$
Balance at the beginning of the year 12,318,303,585 5,816,682,714 3,631,059,301
Proceeds on subscription of units 10 1,047,704,572 759,475,138 625,206,112 Payments on redemption of units 10 (1,586,053,804) (789,444,105) (597,130,348)
Net subscription/(redemption) (538,349,232) (29,968,967) 28,075,764
Total comprehensive income/(Ioss) for the year (890, I 78,827) (364,868,532) (180,921,603)
Balance at the end of the year 10,889,775,526 5,421,845,215 3,478,213,462
The accompanying notes are an integral part of these financial statements.
104
MPF Guaranteed Conservative
Portfolio Fund· HK$ HK$
8,204,463,212 4,251,325,414
2,760,555,073 3,869,908,136 (1,812,171,439) (2,781,303,593)
948,383,634 1,088,604,543
13,085,789 29,898,347
9,165,932,635 5,369,828,304
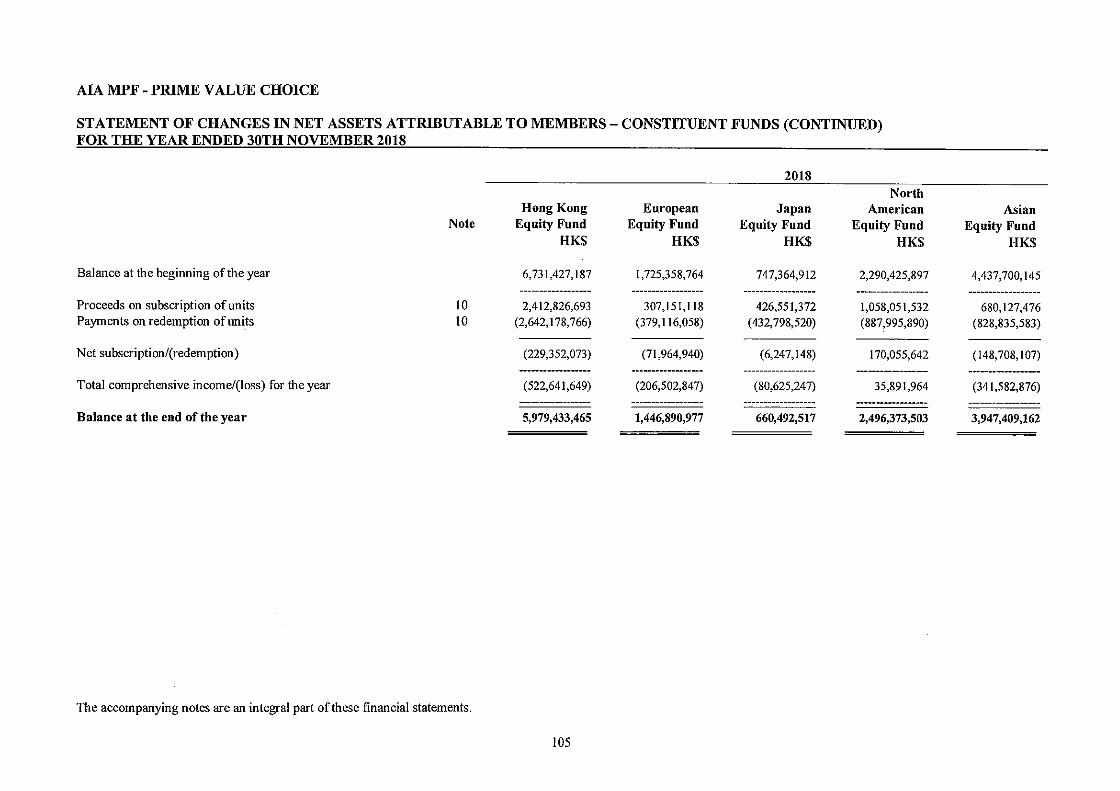
AIA MPF - PRIME VALUE CHOICE
STATEMENT OF CHANGES IN NET ASSETS ATTRIBUTABLE TO MEMBERS- CONSTITUENT FUNDS (CONTINUED) FOR THE YEAR ENDED 30TH NOVEMBER 2018
2018 North
Hong Kong European Japan American Note Equity Fund Equity Fund Equity Fund Equity Fund
HK$ HK$ HK$ HK$
Balance at the beginning of the year 6,731,427, I 87 1,725,358,764 747,364,912 2,290,425,897
Proceeds on subscription of units 10 2,412,826,693 307,151,1]8 426,551,372 1,058,051,532 Payments on redemption of uni.ts 10 (2,642, I 78,766) (379,116,058) (432,798,520) (887,995,890)
Net subscription/(redemption) (229,352,073) (71,964,940) (6,247,148) 170,055,642
Total comprehensive income/(loss) for the year (522,641,649) (206,502,847) (80,625,247) 35,891,964
Balance at the end of the year 5,979,433,465 1,446,890,977 660,492,517 2,496,373,503
The accompanying notes are an integral part of these financial statements.
105
Asian Equity Fund
HK$
4,437,700,145
680,127,476 (828,835,583)
(148,708,107)
(341,582,876)
3,947,409,162

AIA MPF - PRIME VALUE CHOICE
STATEMENT OF CHANGES IN NET ASSETS ATTRIBUTABLE TO MEMBERS- CONSTITUENT FUNDS (CONTINUED) FORTHE YEAR ENDED 30TH: NOVEMBER 2018
2018 Allianz Capital Allianz Growth Allianz Stable
Greater China Stable Fund Fund Growth Fund Note Equity Fund (Note i) (Note i) (Note i)
HK$ HK$ HK$ HK$
Balance at the beginning of the year 8,008,277,456 407,570,094 1,098,909,279 793,405,649
Proceeds on subscription of units IO 1,227,404,698 147,391,213 143,023,115 163,288,524 Payments on redemption of units IO (1,661,034,193) (527,963,787) (1,130,976,352) (895,344,899)
Net subscription/(redemption) (433,629,495) (380,572,574) (987,953,237) (732,056,375)
Total comprehensive income/(loss) for the year (775,035,296) (26,997,520) (] 10,956,042) (61,349,274)
Balance at the end of the year 6,799,612,665 - -
Green Fund HK$
1,827,608,875
552,181,070 (471,200,147)
80,980,923
(57,960,759)
1,850,629,039
Note i: Allianz Capital Stable Fund, Allianz Growth Fund and Allianz Stable Growth Fund ("the 3 Allianz Funds") had no investments and operations since 15th November 2018. MPFA had approved the termination of the 3 Allianz Funds to take effect on 13th March 2019.
The accompanying notes are an integral part of these financial statements.
106

AIA MPF - PRIME VALUE CHOICE
STATEMENT OF CHANGES IN NET ASSETS ATTRIBUTABLE TO MEMBERS-CONSTITUENT FUNDS (CONTINUED) FOR THE YEAR ENDED 30TH NOVEMBER 2018_
2018 Fidelity
Global World Manager's Capital Stable Note Bond Fund Fund Choice Fund Fund
HK$ HK$ HK$ HK$
Balance at the beginning of the year 1,300,016,705 I ,259,043,415 4,598,162,245 450,712,102
Proceeds on subscription of units IO 959,038,760 374,318,593 853,846,268 787,898,563 Payments on redemption of units IO (667,142,513) (283,286,859) (837,848,317) (25 I, 775,827)
Net subscription/(redemption) 291,896,247 91,031,734 15,997,951 536,122,736
Total comprehensive income/(loss) for the year (76,036,122) (16,622,359) (310,213,252) (22,942,995)
Balance at the end of the year 1,515,876,830 1,333,452,790 4,303,946,944 963,891,843
The accompanying notes are an integral part of these financial statements.
107
Fidelity Stable Growth Fund
HK$
1,196,709,981
1,250,663,120 (307,404,305)
943,258,815
(64,322,687)
2,075,646,109

AIA MPF - PRIME VALUE CHOICE
STATEMENT OF CHANGES IN NET ASSETS ATTRIBUTABLE TO MEMBERS- CONSTITUENT FUNDS (CONTINUED) FOR THE YEAR ENDED 30TH NOVEl\'lBER 2018
2018 Fidelity Asian Hong Kong and
Note Growth Fund Bond Fund Eurasia Fund China Fund HK$ HK$ HK$ HK$
Balance at the beginning of the year 1,185,921,646 761,148,739 330,408,277 2,184,310,749
Proceeds on subscription of units IO 1,309,518,440 562,051,492 146,326, I 70 1.271,023,172 Payments on redemption of units IO (287,736,528) (350,280,280) (104,895,406) (1,113,876,732)
Net subscription/(redemption) 1,021,781,912 211,771,212 41,430,764 157,146,440
Total comprehensive income/(loss) for the year (80,870,115) (10,814,719) (32,774,110) (159,403,650)
Balance at the end of the year 2, 126,833,443 962,105,232 339,064,931 2,182,053,539
The accompanying notes are an integral part of these financial statements,
108
American Fund HK$
729,442,976
518,680,558 (377,449,172)
141,231,386
18,857,166
889,531,528

AIA MPF - PRIME VALUE CHOICE
STATEMENT OF CHANGES IN NET ASSETS ATTRIBUTABLE TO MEMBERS- CONSTITUENT FUNDS (CONTINUED) FOR THE YEAR ENDED 30TH NOVEMBER 2018
2018 Core China HK
Age 65 Plus Accumulation Dynamic Asset Note Fund Fund Allocation Fund Total
HK$ HK$ HK$ HK$
Balance at the beginning of the year 2 I 6,208,205 1,047,003,385 296,668,928 77,845,639,837
Proceeds on subscription of units 10 432,118,312 964,126,812 446,000,180 26,056,456,282 Payments on redemption ofnnits 10 (202,970,467) (344,116,728) (186,886,891) (22,739,217,509)
Net subscription/(redemption) 229,147,845 620,010,084 259, I 13,289 3,317,238,773
Total comprehensive income/(loss) for the year (3,953,971) (26,666,067) (11,490,512) (4,337,997,765)
Balance at the end of the year 441,402,079 1,640,347,402 544,291,705 76,824,880,845
The accompanying notes are an integral part of these financial statements.
109

AIA MPF - PRIME VALUE CHOICE
STATEMENT OF CHANGES IN NET ASSETS ATTRIBUTABLE TO MEMBERS- CONSTITUENT FUNDS (CONTINUED) FOR THE YEAR ENDED 30TH NOVEMBER 20J8
2017
Growth Balanced Capital Stable Guaranteed Note Portfolio Portfolio Portfolio Portfolio
HK$ HK$ HK$ HK$
Balance at the beginning of the year 9,991,705,828 5,016,834,246 3,286,829,499 8,086,648,708
Proceeds on subscription of units 10 1,041,360,338 700,296,817 505,084,511 3, I 38,689,880 Payments on redemption of units IO (l,320,275,177) (654,611,544) (483,424,904) (3,033,016,133)
Net subscription/(redemption) (278,914,839) 45,685,273 21,659,607 105,673,747
Total comprehensive income/(loss) for the year 2,605,512,596 754,163,195 322,570,195 12,140,757
Balance at the end of the year 12,318,303,585 5,816,682,714 3,631,059,301 8,204,463,212
The accompanying notes are an integral part of these financial statements,
110
MPF Conservative
Fund HK$
3,710,642,775
2,298,976,720
(l,762,594,442)
536,382,278
4,300,361
4,251,325,414

AIA MPF - PRIME VALUE CHOICE
STATEMENT OF CHANGES IN NET ASSETS ATTRIBUTABLE TO MEMBERS- CONSTITUENT FUNDS (CONTINUED) FOR THE YEAR ENDED 30TH NOVE~E_RJ!!l-8_
2017 North
Hong Kong European Japan American Note Equity Fund Equity Fund . Equity Fund Equity Fund
HK$ HK$ HK$ HK$
Balance at the beginning of the year 5,524,280,093 1,327,167,582 572,568,841 1,692,391,035
Proceeds on subscription of units 10 1,748,207,353 388,997,897 273,957,871 732,122,627 Payments on redemption of units 10 ( I ,996,592,552) (391,542,818) (264,225,519) (529,751,199)
Net subscription/(redemption) (248,385,199) (2,544,921) 9,732,352 202,371,428
Total comprehensive income/(loss) for the year 1,455,532,293 400,736,103 165,063,719 395,663,434
Balance at the end of the year 6,731,427,187 1,725,358,764 747,364,912 2,290,425,897
The accompanying notes are an integral part of these financial statements.
111
Asian Equity Fund
HK$
3,462,340,173
839,946,563 (793,678,562)
46,268,001
929,091,971
4,437,700,145

AJA MPF - PRIME VALUE CHOICE
STATEMENT OF CHANGES IN NET ASSETS ATTRIBUTABLE TO MEMBERS- CONSTITUENT FUNDS (CONTINUED) FOR THE X)i;_J\R ENDED 30TB NOVEMBER 201_8_
2017 Greater China Allianz Capital Allianz Growth Allianz Stable
Note Equity Fund Stable Fund Fund Growth Fund HK$ HK$ HK$ HK$
Balance at the beginning of the year 6,438,554,665 334,504,443 877,822, 179 640,568,450
Proceeds on subscription of units IO 1, 148,810,969 122,384,826 153,626,043 168,108,879 Payments on redemption of units IO (1,366,432,092) (8.7,275,799) (163,039,434) (120,854,082)
Net subscription/(redemption) (217,621,123) 35,109,027 (9,413,391) 47,254,797
Total comprehensive income/(loss) for the year 1,787,343,914 37,956,624 230,500,491 105,582,402
Balance at the end of the year 8,008,277,456 407,570,094 1,098,909,279 793,405,649
The accompanying notes are an integral part of these financial statements.
112
Green Fund HK$
1,309,603,432
498,768,259 (309,903,088)
188,865,171
329,140,272
1,827,608,875

AIA MPF - PRIME VALUE CHOICE
STATEMENT OF CHANGES IN NET ASSETS ATTRIBUTABLE TO MEMBERS- CONSTITUENT FUNDS (CONTINUED) FOR THE YEAR ENDED 30TH NOVEMBER 2018
2017 Fidelity
Global World Manager's Capital Stable Note Bond Fund Fund Choice Fund Fund
HK$ HK$ HK$ HK$
Balance at the beginning of the year 1,023,394,324 873,964,651 3,588,372,844 303,457,182
Proceeds on subscription of units 10 722,438,982 4 I 0,989,310 884,799,243 290,963,002 Payments on redemption of units 10 (519,188,675) (233,995,912) (667,401,213) (183,028,814)
Net subscription/(redemption) 203,250,307 176,993,398 217,398,030 107,934,188
Total comprehensive income/(loss) for the year 73,372,074 208,085,366 792,391,371 39,320,732
Balance at the end of the year 1,300,016,705 1,259,043,415 4,598,162,245 450,712,102
The accompanying notes are an integral part of these financial statements.
113
Fidelity Stable Growth Fund
HK$
761,244,931
498,309,907 (209,428,938)
288,880,969
146,584,081
1,196,709,981

AIA MPF - PRIME VALUE CHOICE
STATEMENT OF CHANGES IN NET ASSETS ATTRIBUTABLE TO MEMBERS- CONSTITUENT FUNDS (CONTINUED) FOR THE YEAR ENDED 30TH NOVEMBER 2_0_18
2017 Fidelity Asian Hong Kong and
Note Growth Fund Bond Fund Eurasia Fund China Fund HK$ HK$ HK$ HK$
Balance at the beginning of the year 782,222, 122 579,461,017 193,021,238 1,446,032,402
Proceeds on subscription of units 10 379,410,738 377,597,240 152,645,424 1,029,196,981 Payments on redemption of units 10 (195,302,978) (228,181,775) (74,114,915) (750,939,646)
Net subscription/(redemption) 184,107,760 149,415,465 78,530,509 278,257,335
Total comprehensive income/(]oss) for the year 219,591,764 32,272,257 58,856,530 460,021,012
Balance at the end of the year 1,185,921,646 761,148,739 330,408,277 2,184,310,749
The accompanying notes are an integral part of these financial statements.
114
American Fund HK$
408,766,052
416,771,827 (202,103,921)
214,667,906
106,009,018
729,442,976

AIA MPF - PRIME VALUE CHOICE
STATEMENT OF CHANGES IN NET ASSETS ATTRIBUTABLE TO MEMBERS- CONSTITUENT FUNDS (CONTINUED) FOR TlIE YEAR ENDED 30TH NOVEMBER 2018
2017 Core China HK
Age 65 Plus Accumulation Dynamic Asset Note Fund Fund Allocation Fund Total
(Note 1) (Note 1) (Note 2) HK$ HK$ HK$ HK$
Balance at the beginning of the period 62,232,398,712
Proceeds on subscription of units IO 282,376,425 1, 122,960, I 65 320,277,280 20,648,076,077 Payments on redemption of units IO (69,609,092) (126,473,459) (32,027,188) (16,769,013,871)
Net subscription/(redemption) 212,767,333 996,486,706 288,250,092 3,879,062,206
Total comprehensive income/(Ioss) for the period 3,440,872 50,516,679 8,418,836 11,734,178,919
Balance at the end of the period 216,208,205 1,047,003,385 296,668,928 77,845,639,837
Note I: For Age 65 Plus Fund and Core Accumulation fund, the period is from !st April 2017 (date of commencement of operations) to 30th November 2017. Note 2: For China HK Dynamic Asset Allocation Fund, the period is from 4th July 2017 (date of commencement ofoperations) to 30th November 2017.
The accompanying notes are an integral part of these financial statements.
115

AIA MPF - PRIME VALUE CHOICE
STATEMENT OF CASH FLOWS-CONSTITUENT FUNDS FOR THE YEAR ENDED 30TH NOVEMBER 2018
Cash flows from operating activities
Total comprehensive income/(loss) for the year Adjustment for:
Interest on bank deposits
Dividend income
Operating profit/(loss) before working capital changes
Net (increase)/decrease in investments
Net (increase)/decrease in amounts receivable on sale of investments
Net (increase)/decrease in other receivables
Net increase/(decrease) in amounts payable on.purchase of investments
Net increase/(decrease) in accruals and other payables
Net increase in derivative financial instruments
Cash generated from/(used in) operations
Interest on bank deposits received
Dividend income received
Net cash generated from/(used in) operating activities
Cash flows from financing activities
Receipts on subscription
Payments on redemption
Net cash generated from/(used in) financing activities
Net increase/(decrease) in cash and cash equivalents Cash and cash equivalents at the beginning of the year
Cash and cash equivalents at the end of the year
Analysis of balances of cash and cash equivalents
Cash at banks
The accompanying notes are an integral part of these financial statements.
Growth Portfolio Balanced portfolio
HK$ HK$
(890,178,827) (364,868,532)
(633,939) (1,175,697)
(890,812,766) (366,044,229)
1,796,781,981 404,012,715
9,191,257 3,463,743
2,746,293 1,164,445
(2,532,213) (778,905)
(1,064,968) (2,605,835)
914,309,584 39,211,934
627,833 1,172,950
914,937,417 40,384,884
1,048,910,66 I 760,001,457
(1,597,429,165) (793,160,113)
(548,518,504) c3.3,1s8,6s6)
366,418,913 7,226,228 17,527,034 323,013,900
383,945,947 330,240,128
383,945,947 330,240,128
116
2018 Capital Stable Guaranteed Portfolio MPF Conservative
Portfolio Fund
HK$ HK$ HK$
(180,921,603) 13,085,789 29,898,347
(1,245,390)
(182,166,993) 13,085,789 29,898,347
187,160,452 (963,536,909) (1,105,768,391) 330,210 605,945 8,657,356
(311,493)
(350,952) 1,641,093 (1,696,401)
2,964,823 (949,845,175) (1,065,571,595)
1,242,652
--4,207,475 (949,845,175) (1,065,571,595)
626,827,420 2,765,101,012 3,881,410,093 (595,959,102) (1,815,255,837) (2,815,838,498)
30 868,318 949,845,175 1,065,571,595
35,075,793 343,709,418
378,785,211
378,785,211

AIA MPF - PRIME VALUE CHOICE
STATEMENT OF CASH FLOWS - CONSTITUENT FUNDS (CONTINUED) FOR THE YEAR ENDED 30TH NOVEMBER 2018
Cash flows from operating activities
Total comprehensive income for the year Adjustment for;
Interest on bank deposits Dividend income
Operating pro:fit/(loss) before working capital changes
Net (increase)/decrease in investments
Net (increase)/decrease in amounts receivable on sale of investments
Net (increase)/decreasc in other receivables
Net increase/(decrease) in amounts payable on purchase of investments
Net increase/(decrease) in accruals and other payables
Net increase in derivative financial instruments
Cash generated :from/(used in) in operations
Interest on bank deposits received Dividend income received
Net cash generated from/(used in) operating activities
Cash flows from financing activities
Receipts on subscription
Payments on redemption
Net cash generated from/(used in) financing activities
Net increase/(decrcase) in cash and cash equivalents Cash and cash equivalents at the beginning of the year
Cash and cash equivalents at the end of the year
Analysis of.balances of cash and cash equivalents Cash at banks
The accompanying notes are an integral part of these financial statements.
Hong Kong Equity Fund HK$
(522,64 I ,649)
(522,641,649)
741,659,016
(3,180,456)
347,915
(1,458,045)
214,726,781
214,726,781
2,438,986,329
(2,653,713,110)
(214,726,781)
117
2018 European Equity Japan Equity Fund North American Asian Equity Fund
Fund Equity Fund HK$ HK$ HKS HK$
(206,502,847) (80,625,247) 35,891,964 (341,582,876)
(206,502,847) (80,625,247) 35,891,964 (341,582,876)
278,150,731 87,164,026 (204,282,680) 496,419,81 I
1,025,997 (5,859,046) 2,115,685 (4,563,498)
(512,846) (222,674) (734,085) (1,370,461)
343,469 8,816,343 1,743,065 (549,050)
(959,571) (365,182) (307,859) (2,413,043)
(176,067) (76,179) (154,704) (464,130)
71,368,866 8,832,041 (165,728,614) 145,476,753
71,368,866 8,832,041 (165,728,614) 145,476,753
312,923,195 418,762,087 1,056,970,453 685,461,187
(384,292,061) (427,594,128) (891,24 I ,839) (830,937,940)
(71,368,866) (8,832,041) 165,728,614 (145,476,753)
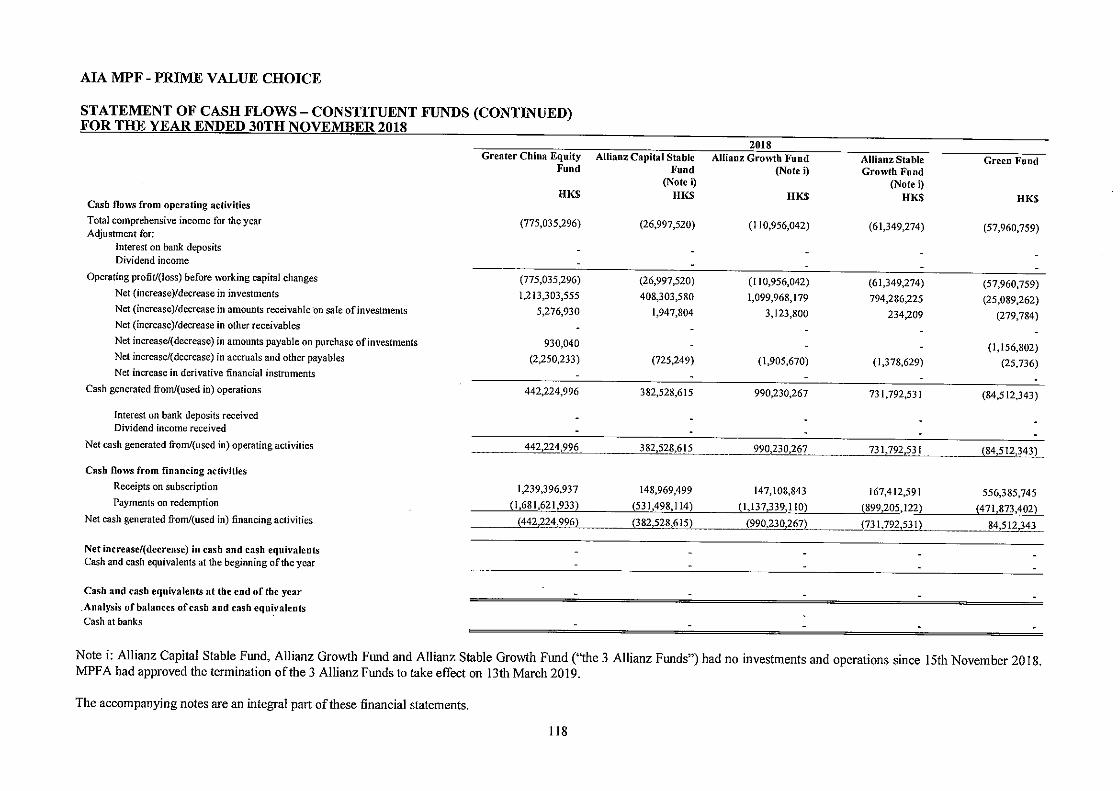
AJA MPF - PRIME VALUE CHOICE
STATEMENT OF CASH FLOWS- CONSTITUENT FUNDS (CONTINUED) FOR THE YEAR ENDED 30TH NOVEMBER 2018
Cash flows from operating activities
Total comprehensive income for the year Adjustment for:
Interest on bank deposits Dividend income
Operating profit/(loss) before working capital changes
Net (increase)/decrease in investments
Net (increase)/decrease in amounts receivable ·on sale of investments
Net (increase)/decrease in other receivables
Net increase/(decrease) in amounts payable on purchase of investments
Net increase/(decrease) in accruals and other payables
Net increase in derivative financial instruments
Cash generated from/(used in) operations
Interest on bank deposits received Dividend income received
Greater China Equity Fund
HK$
(775,035,296)
(775,035,296)
1,213,303,555
5,276,930
930,040
(2,250,233)
442,224,996
2018 Allianz Capital Stable Allianz Growth Fund
Fund (Note i) (Note i)
HK$ HK$
(26,997,520) (I 10,956,042)
(26,997,520) (I 10,956,042)
408,303,580 1,099,968,179
1,947,804 3,123,800
(725,249) (1,905,670)
382,528,615 990,230,267
Net cash generated from/(used in) operating activities 442,224,996 382,528,615 990,230,267
Cash flows from financing activities
Receipts on subscription
Payments on redemption
Net cash generated from/(used in) financing activities
Net increase/(dccrcase) in cash and cash equivalents Cash and cash equivalents at the beginning of the year
Cash and cash equivalents at the end of the year
.Analysis of balances of cash and cash equi.valcnts Cash at banks
1,239,396,937
(1,681,621,933)
(442,224,996)
148,969,499
(531,498,114)
(382,528,615)
147,108,843
(l,137,339,110)
(990,230,267)
Allianz Stable Growth Fund
(Note i) HKS
(61,349,274)
(61,349,274)
794,286,225
234,209
(1,378,629)
731,792,531
731,792,531
I 67,412,591
(899,205,122)
(731,792,531)
Green Fund
HK$
(57,960,759)
(57,960,759)
(25,089,262)
(279,784)
(1,156,802)
(25,736)
(84,512,343)
(84,512,343)
556,385,745
(471,873,402)
84,512,343
Note i: Allianz Capital Stable Fw,d, Allianz Growth Fw,d and Allianz Stable Growth Fw,d ("the 3 Allianz Fw,ds") had no investments and operations since 15th November 2018, MPFA had approved the termination of the 3 Allianz Fw,ds to take effect on 13th March 2019.
The accompanying notes are an integral part of these financial statements.
118

AJA MPF - PRIME VALUE CHOICE
STATEMENT OF CASH FLOWS - CONSTITUENT FUNDS (CONTINUED) FOR THE YEAR ENDED 30TH NOVEMBER 2018
Cash flows from operating activities
Total comprehensive income for the year Adjustment for:
Interest on bank deposits
Dividend income
Operating profit/(loss) before working capital changes
Net (increase)/decrease in investments
Net (increase)/decrease in amounts receivable on sale of investments
Net (increase)/decrease in other receivables
Net increase/(decrease) in amounts payable on purchase ofinvestments
Net increase/(decrease) in accruals and other payables
Net increase in derivative financial instruments
Cash generated from/(used in) operations
Interest on bank deposits received
Dividend income received
Net cash generated from/(used in) in operating activities
Cash flows from financing activities
Receipts on subscription
Payments on redemption
Net cash generated from/(used in) financing activities
Net decrease in cash and cash equivalents
Cash and cash equivalents at the beginning of the year
Cash and cash equivalents at the end of the year
Analysis of balances of cash and cash equivalents
Cash at banks
The accompanying notes are an integral part of these financial statements.
Global Bond Fund
HK$
(76,036,122)
(76,036,122)
(217,863,022)
1,949,293
(422,098)
1,907,134
(198,168)
(78,349)
(290,741,332)
(290,741,332)
961,754,628
(671,013,296)
290,741,332
119
World Fund
HK$
(16,622,359)
(1,311)
(21,126,694)
(37,750,364)
(78,457,009)
212,659
(374,961)
(1,812,918)
(387,890)
(88,980)
(I 18,659,463)
1,311
21,126,694
j97,531,458)
376,722,699
(283,342,620)
93,380,079
(4,151,379)
4,523,470
372,091
372,091
2018 Manager's Choice
Fund HK$
(310,213,252)
(254,251)
(3 I 0,467,503)
268,941,188
(277,353)
(119,460)
(770,927)
(5,521)
(42,699,576)
253,384
(42,446,192)
859,789,961
(840,140,722)
19,649,239
(22,796,953)
152,130,338
129,333,385
129,333,385
Fidelity Capital Stable fund
HK$
(22,942,995)
(22,942,995)
(514,818,241)
(1,411,273)
(15,092)
(1,619,423)
456,057
(540,350,967)
(540,350,967)
788,550,448
(248,199,481)
540,350,967
Fidelity Stable Growth Fund
HK$
(64,322,687)
(64,322,687)
(882,562,076)
(981,810)
(32,458)
(234,425)
902,523
(947,230,933)
(947,230,933)
1,252,884,207
(305,653,274)
947,230,933

AIA MPF - PRIME VALUE CHOICE
STATEMENT OF CASH FLOWS- CONSTITUENT FUNDS (CONTINUED) FOR THE YEAR ENDED 30TH NOVEMBER 2J)l8
Cash Dows from operating activities
Total comprehensive income for the year Adjustment for:
Interest on bank deposits
Dividend income
Operating profit/(loss) before working capital changes
Net (increase)/decrease in investments
Net (increase)/decrease in amounts receivable on sale of investments
Net (increase)/decrease in other receivables
Net increase/(decrease) in amounts payable on purchase of investments
Net increase/(decrease) in accruals and other payables
Net decrease in derivative financial instruments
Cash generated from/(used in) operations
Interest on bank deposits received
Dividend income received
Net cash generated from/(used in) operating activities
Cash flows from financing activities
Receipts on subscription
Payments on redemption
Net cash generated from/(used in) financing activities
Net increase/(decrease) in cash and cash equivalents Cash and cash equivalents at the beginning of the year
Cash and cash equivalents at the end of the year
Analysis of balances of cash and cash equivalents
Cash at banks
The accompanying notes are an integral part of these financial statements.
Fidelity Growth Fund HK$
(80,870,115)
(80,870,115)
(944,419,029)
136,816
(35,009)
675,849
(1,024,511,488)
(1,024,511,488)
1,310,588,579
(286,077,091)
1,024,511,488
120
Asian Bond Fund
HK$
(I0,814,719)
(I0,814,719)
(201,038,454)
(113,789)
(l,OI0,776)
237,869
(212,739,869)
(212,739,869)
564,107,916
(351,368,047)
212,739,869
2018 Eurasia Fund Hong Kong and American Fund
China Fund HK$ HK$ HK$
(32,774,110) (159,403,650) 18,857,166
(204) (603) (1,849) (8,348,716) (72,070,960) (10,860,795)
(41,123,030) (23J,475,21J) 7,994,522
(9,086,852) 1,872,159 (161,819,828) (75,428) (5,690,995) (82,6!0) (35,622) 24,052 (261,142)
(219,166) (4,914,385) (865,585) (95,462) (416,524) (190,826)
(8,884) (40,798)
(50,644,444) (240,600,906) (155,266,267)
204 603 1,849 8,348,716 72,070,960 10,860,795
j42,295,524) (168,529,343) (144,403,623)
147,350,598 1,276,119,889 518,352,612 (105,036,871) (l,!07,255,805) (376,213,470)
42,3 JJ,727 168,864,084 142,JJ9,142
18,203 334,741 (2,264,481) 2,082,671 48,947,386 2,612,721
2,100,874 49,282,127 348,240
2,100,874 49,282,127 348,240

AIA MPF - PRIME VALUE CHOICE
STATEMENT OF CASH FLOWS - CONSTITUENT FUNDS (CONTINUED) FOR THE YEAR ENDED 30TH NOVEMBER 2018
Cash flows from operating activities
Total comprehensive income for the period Adjustment for:
Interest on bank deposits
Dividend income
Operating profit before working capital changes
Net (increase)/decrease in investments
Net (increase)/decrease in amounts receivable on sale of investments
Net (increase)/decrease in other receivables
Net increase/(decrease) in amounts payable on purchase of investments
Net increase/(decrease) in accruals and other payables
Net decrease in derivative financial instruments
Cash generated from/ (used in) operations
Interest on bank deposits received
Dividend income received
Net cash generated from/(used in) operating activities
Cash flows from financing activities
Receipts on subscription
Payments on redemption
Net cash generated from/(used in) financing activities
Net increase/(dccrcasc) in cash and cash equivalents Cash and cash equivalents at the beginning of the period
Cash and cash equivalents at the end of the period
Analysis of balances of cash and cash equivalents
Cash at banks
The accompanying notes are an integral part of these financial statements,
Age 65 PtuS Fund
HK$
(3,953,971)
(3,953,971)
(226,480,315)
(171,876)
197,267
(230,408,895)
(230,408,895)
432,796,530
(202,387,635)
230,408,895
121
Core Accumulation Fund HK$
(26,666,067)
(26,666,067)
(595,843,444)
1,851,289
334,517
(620,323,705)
(620,323,705)
964,164,512
(343,840,807)
620,323,705
2018 China HK Dynamic Asset
Allocation Fund HK$
(11,490,512)
(I 1,490,512)
(253,775,009)
226,731
(265,038,790)
(265,038,790)
452,516,045
( I 87,477,255)
265,038,790
Total
HJ($
(4,337,997,765)
(3,313,244)
112,407,165)
(4,453,718,174)
1,393,183,097
15,755,662
(3,992,396)
6,864,634
(12,839,178)
(6,460,816)
(3,061,207,171)
3,300,786
112,407,165
(2,945,499,220)
26,160,326,133
(22,834,965,848)
3,325,360,285
379,861,065 894,546,938
1,274,408,003
1,274,408,003

AJA MPF - PRIME VALUE CHOICE
STATEMENT OF CASH FLOWS - CONSTITUENT FUNDS (CONTINUED) FOR THE YEAR ENDED 30TH NOVEMBER 2018
Cash flows from operating activities
Total comprehensive income for the year Adjustment for:
Interest o~ bank deposits
Dividend income
Operating profit/(loss) before working capital changes
Net increase in investments Net (increase)/decrease in amounts receivable on sale of investments Net (increase)/decrease in other receivables Net increase/(decrease) in amounts payable on purchase of investments Net increase/(decrease) in accruals and other payables Net decrease in derivative financial instruments
Cash generated from/(used in) operations
Interest on bank deposits received Dividend income received
Net cash generated from/(used in) operating activities
Cash flows from financing activities Receipts on subscription Payments on redemption
Net cash generated from/(used in) financing activities
Net increase/(dccrease) in cash and cash equivalents Cash and cash equivalents at the beginning of the year
Cash and cash equivalents at the end of the year
Analysis of balances of cash and cash equivalents Cash at banks
The accompanying notes are an integral part of these financial statements.
Growth Portfolio
HK$
2,605,512,596
(186,831)
2,605,325,765
(2,574,559,342) (8,703,516)
(2,362,823) 3,386,744 1,146,139
24,232,967
187,760
24,420,727
1,037,070,003 (1,307,486,210)
(270,416,207)
(245,995,480) 263,522,514
17,527,034
17,527,034
122
Balanced portfolio
HK$
754,163,195
(628,384)
753,534,811
(681,171,368) (2,118,887)
992,776 2,405,027
73,642,359
626,580
74,268,939
697,148,951 (650,911,545)
46,237,406
120,506,345 202,507,555
323,013,900
323,013,900
2017 Capital Stable Guaranteed Portfolio MPF Conservative
Portfolio Fund
HK$ HK$ HK$
322,570,195 12,140,757 4,300,361
(518,784)
322,051,411 12,140,757 4,300,361
(218,945,340) (114,011,041) (538,721,150) 1,248 (2,930,911) (6,293,169)
1,581,479 315,249 268,717
1,517,881 106,521,928 (104,801,195) (540,445,241)
517,497
107,039,425 (104,801,195) (540,445,241)
502,063,728 3,144,025,705 2,272,549,104 (480,908,273) (3,039,224,510) (1,732,103,863)
21,155,455 104,801,195 540,445,24 I
128,194,880 215,514,538
343,709,418
343,709,418

AIA MPF - PRIME VALUE CHOICE
STATEMENT OF CASH FLOWS-CONSTITUENT FUNDS (CONTINUED) FOR THE YEAR ENDED 30TH NOVEMBER 2018
Cash flows from operating activities Total comprehensive income for the year Adjustment for:
Interest on bank deposits Dividend income
Operating profit before working capital changes
Net increase in investments Net (increase)/decrease in amounts receivable on sale of investments Net (increase)/decrease in other receivables Net increase/(decrease) in amounts payable on purchase of investments _Net increase/(decrease) in accruals and other payables Net decrease in derivative fmancial instruments
Cash generated :from/(used in) in operations
Interest on bank deposits received Dividend income received
Net cash generated from/(used in) operating activities
Cash flows from financing activities Receipts on subscription Payments on redemption
Net cash generated from/(used in) financing activities
Net increasc/(decreasc) in cash and cash equivalents Cash and cash equivalents at the beginning of the year
Cash and cash equivalents at the end of the year
Analysis of balances of cash and cash equivalents
Cash at banks
The accompanying notes are an integral part of these financial statements.
Hong Kong Equity Fund HK$
1,455,532,293
1,455,532,293
(1,198,848,598) (2,714,485)
(1,550,724) 2,021,267
254,439,753
254,439,753
1,711,960,884 (1,966,400,637)
(254,439,753)
123
European Equity Fund HK$
400,736,103
400,736,103
(396,069,711) (260,012)
277,646 298,312
4,982,338
4,982,338
382,710,694 (387,693,032)
(4,982,338)
2017 Japan Equity Fund
HK$
165,063,719
165,063,719
(178,569,340) (386,601)
(25,288) 92,525
130,323 (13,694,662)
(13,694,662)
273,485,470 (259,790,808)
13,694,662
North American Equity Fund
HK$
395,663,434
395,663,434
(601,637,319) (2,450,247)
(4,503,966) 703,151 341,693
(211,883,254)
(211,883,254)
731,569,285 (519,686,031)
211,883,254
Asian Equity Fund
HK$
929,091,971
929,091,971
(978,451,077) (755,188)
463,095 910,554 790,801
(47,949,844)
(47,949,844)
833,753,538 (785,803,694)
47,949,844

AIA MPF - PRIME VALUE CHOICE
STATEMENT OF CASH FLOWS- CONSTITUENT FUNDS (CONTINUED) FOR TilE YEAR ENDED J0TH NOVEMBER 2018
Cash flows from operating activities Total comprehensive income for the year Adjustment for:
Interest on bank deposits Dividend income
Operating profit before working capital changes
Net increase in investments Net (increase)/decrease in amounts receivable on sale of investments Net (increase)/decrease in other receivables Net increase/(decrease) in amounts payable on purchase of investments Net increase/(decrease) in accruals and other payables Net decrease in derivative financial instruments
Cash generated from/(used in) operations
Interest on bank deposits received Dividend income received
Net cash generated from/(used in) operating activities
Cash flows from financing activities
Receipts on subscription Payments on redemption
Net cash generated from/(used in) financing activities
Net increase/(decrease) in cash and cash equivalents Cash and cash equivalents at the beginning of the year
Cash and cash equivalents at the end of the year
Analysis of balances of cash and cash equivalents Cash at banks
The accompanying notes are an integral part of these financial statements.
Greater China Equity Fund
HK$
1,787,343,914
1,787,343,914
(1,573,363,025) (5,492,593)
142,956 2,747,626
211,378,878
211,378,878
1,135,464,650 (1,346,843,528)
(211,378,878)
124
Allianz Capital Stable Fund
HK$
37,956,624
37,956,624
(73,045,073) (1,753,421)
90,811
(36,751,059)
(36,751,059)
121,551,254 (84,800,195)
36,751,059
2017 Allianz Growth Fund
HK$
230,500,491
230,500,491
(220,145,923) (2,674,029)
(90,248) 321,601
7,911,892
7,911,892
150,294,370 (158,206,262)
j7,9I 1,892)
Allianz Stable Growth Fund
HK$
105,582,402
105,582,402
(152,382,345) 41,256
(I) 206,709
(46,551,979)
(46,551,979)
164,964,022 (118,412,043)
46,551,979
Green Fund
HK$
329,140,272
329,140,272
(516,604,033)
(364,633) (18,127)
(187,846,521)
(187,846,521)
495,117,797 (307,271,276)
I 87,846,521

AJA MPF - PRIME VALUE CHOICE
STATEMENT OF CASH FLOWS-CONSTITUENT FUNDS (CONTINUED) FOR THE YEAR ENDED 30TH NOVEMBER 2018
Cash flows from operating activities Total comprehensive income for the year Adjustment for:
Interest on bank deposits Dividend income
Operating profit before working capital changes
Net increase in investments Net (increase)/decrease in amounts receivable on sale of investments Net (increase)/decrease in other receivables Net increase/(decrease) in amounts payable on purchase ofinvestments Net increase/(decrease) in accruals and other payables Net decrease in derivative financial instruments
Cash generated from/(used in) operations
Interest on bank deposits received Dividend income received
Net cash generated from/(used in) in operating activities
Cash flows from financing activities
Receipts on subscription Payments on redemption
Net cash generated from/(used in) financing activities
Net increase in cash and cash equivalents
Cash and cash equivalents at the beginning of the year
Cash and cash equivalents at the end of the year
Analysis of balances of cash and cash equivalents
Cash at banks
The accompanying notes are an integral part of these financial statements.
Global Bond Fund
HK$
73,372,074
73,372,074
(272,059,157) (1,664,622)
1,855,515 39,676
196,749 (198,259,765)
( I 98,259,765)
714,253,326 (515,993,561)
198,259,765
125
World Fund
HK$
208,085,366
(299) (15,965,786) 192,119,281
(381,428,830) (340,917)
154,546 (148,839)
343,971 191,070
(189,109,718)
299 15,965,786
(173,143,633)
408,919,886 (232,881,438)
I 76,038,448
2,894,815
1,628,655
4,523,470
4,523,470
2017 Manager's Choice Fidelity Capital Fidelity Stable
Fund Stable fund Growth Fund HK$ HK$ HK$
792,391,371 39,320,732 146,584,081
(593,582)
791,797,789 39,320,732 146,584,081
(1,106,929,329) (147,692,194) (432,135,961) 614,055
(1,427,103) 1,619,423 (488,077) 1,620,847 200,388 195,496
72,692 -----
(314,865,104) (105,937,596) (285,844,46 I)
593,377
(314,271,727) (105,937,596) (285,844,461)
880,337,727 288,089,258 495,413,947 (667,868,718) (182,151,662) (209,569,486)
212,469,009 105,937,596 285,844,461
(101,802,718)
253,933,056
152,130,338
152,130,338

AIA MPF - PRIME VALUE CHOICE
STATEMENT OF CASH FLOWS- CONSTITUENT FUNDS (CONTINUED) FOR THE YEAR ENDED 30TH NOVEMBER 2018
Cash flows from operating activities Total comprehensive income for the year Adjustment for:
Interest on bank deposits Dividend income
Operating profit before working capital changes
Net increase in investments Net (increase)/decrease in amounts receivable on sale of investments Net (increase)/decrease in other receivables Net increase/(decrease) in amounts payable on purchase of investments Net increase/(decrease) in accruals and other payables Net decrease in derivative financial instruments
Cash generated from/(used in) operations
Interest on bank deposits received Dividend income received
Net cash generated from/(used in) operating activities
Cash flows from financing activities
Receipts on subscription Payments on redemption
Net cash generated from/(used in) financing activities
Net increase in cash and cash equivalents Cash and cash equivalents at the beginning of the year
Cash and cash equivalents at the end of the year
Analysis of balances of cash and cash equivalents Cash at banks
The accompanying notes are an integral part of these financial statements.
Fidelity Growth Fund HK$
219,591,764
219,591,764
(401,908,487) (524,752)
584,771
(182,256,704)
(182,256,704)
377,352,711 (195,096,007)
182,256,704
126
Asian Bond Fund
HK$
32,272,257
32,272,257
(181,881,918) 2,019,361
3,555,765 71,884
(143,962,651)
(143,962,651)
371,496,928 (227,534,277)
143,962,651
2017 Eurasia Fund Hong Kong and American Fund
China Fund HJ($ HK$ HK$
58,856,530 460,021,012 106,009,018
(63) (46) (229) (5,636,655) (65,201,856) (7,760,894) 53,219,812 394,819,110 98,247,895
(136,566,295) (728,808,565) (318,772,554) 70,455 25,431 299,018 75,412
5,099 1,609,779 (1,772,407) 388,746 1,043,529 359,136
19,613 112,058 (82,837,139) (331,037,129) (221,750,460)
63 46 229 5,636,655 65,201,856 7,760,894
j77,200,421) (265,835,227) (213,989,337)
151,400,128 1,027,580,558 415,900,923 (73,516,577) (743,452,996) (201,493,524)
77,883,551 284,127,562 214,407,399
683,130 18,292,335 418,062 1,399,541 30,655,051 2,194,659
2,082,671 48,947,386 2,612,721
2,082,671 48,947,386 _2,612,721

AIA MPF - PRIME VALUE CHOICE
STATEMENT OF CASH FLOWS-CONSTITUENT FUNDS (CONTINUED) FOR THE YEAR ENDED 30TH NOVEMBER 2018
Cash flows from operating activities Total comprehensive income for the period Adjustment for:
Interest on bank deposits Dividend income
Operating profit before working capital changes
Net increase in investments Net (increase)/decrease in amounts receivable on sale of
investments Net (increase)/decrease in other receivables Net increase/(decrease) in amounts payable on purchase of
investments Net increase/(decrease) in accruals and other payables Net decrease in derivative financial instruments
Cash generated from/ (used in) operations
Interest on bank deposits received Dividend income received
Net cash generated from/(used in) operating activities
Cash flows from financing activities
Receipts on subscription Payments on redemption
Net cash generated from/(used in) financing activities
Net increase/(dccrease) in cash and cash equivalents Cash and cash equivalents at the beginning of the period
Cash and cash equivalents at the end of the period
Analysis of balances of cash and cash equivalents
Cash at banks
Age 65 Plus Fund
HK$ (Note I)
3,440,872
3,440,872
(215,319,489)
837,099 95,769
(210,945,749)
(210,945,749)
279,250,148 (68,304,399) 210,945,749
Core Accumulation Fund HK$
(Note I)
50,516,679
50,516,679
(1,043,110,801)
114,586 682,093
(991,797,443)
(991,797,443)
1,115,555,296 (123,757,853)
991,797,443
2017 China HK Dynamic Asset
Allocation Fund HK$
(Note 2)
8,418,836
8,418,836
(289,459,669)
287,105
(280,753,728)
(280,753,728)
311,597,057 (30,843,329) 280,753,728
Total
Hl<S
11,734,178,919
(1,928,218) 94,565,191)
11,637,685,510
(15,672,597,934)
(36,J 16,975) 554,407
(949,313) 18,230,660 7,222,358
(4,046,171,287)
1,925,851 94,565,191
(3,949,680,245)
20,490,877,348 · (16,618,005,734)
3,872,871,614
(76,808,631) 971,355,569
894,546,938
894,546,938
Note I: For Age 65 Plus Fund and Core Accumulation fund, the period is from !st April 2017 ( date of commencement of operations) to 30th November 2017. Note 2: For China HK Dynamic Asset Allocation Fund, the period is from 4th July 2017 (date of commencement of operations) to 30th November 2017.
The accompanying notes are an integral part of these financial statements.
127
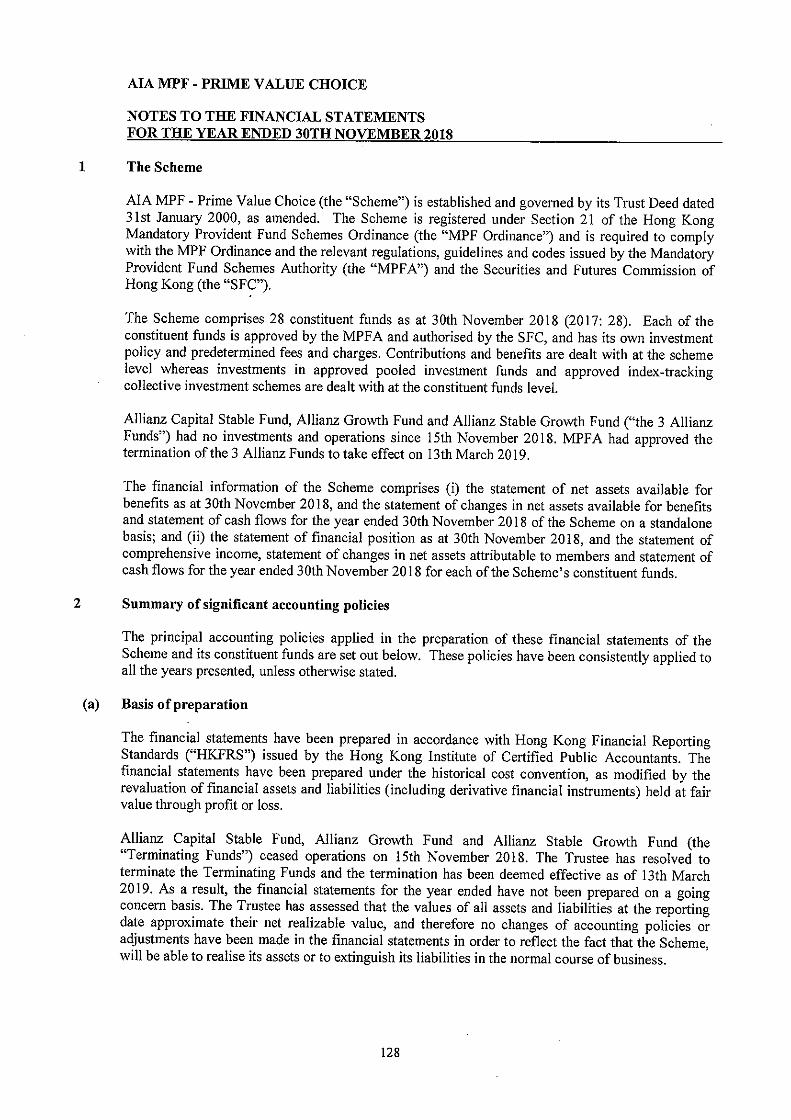
AIA MPF - PRIME VALUE CHOICE
NOTES TO THE FINANCIAL STATEMENTS FOR THE YEAR ENDED 30TH NOVEMBER 2018
1 The Scheme
AIA MPF - Prime Value Choice (the "Scheme") is established and governed by its Trust Deed dated 31st January 2000, as amended. The Scheme is registered under Section 21 of the Hong Kong Mandatory Provident Fund Schemes Ordinance (the "MPF Ordinance") and is required to comply with the MPF Ordinance and the relevant regulations, guidelines and codes issued by the Mandatory Provident Fund Schemes Authority (the "MPFA") and the Securities and Futures Commission of Hong Kong (the "SFC").
The Scheme comprises 28 constituent funds as at 30th November 2018 (2017: 28). Each of the constituent funds is approved by the MPF A and authorised by the SFC, and has its own investment policy and predetermined fees and charges. Contributions and benefits are dealt with at the scheme level whereas investments in approved pooled investment funds and approved index-tracking collective investment schemes are dealt with at the constituent funds level.
Allianz Capital Stable Fund, Allianz Growth Fund and Allianz Stable Growth Fund ("the 3 Allianz Funds") had no investments and operations since 15th November 2018. MPFA had approved the termination of the 3 Allianz Funds to take effect on 13th March 2019.
The financial information of the Scheme comprises (i) the statement of net assets available for benefits as at 30th November 2018, and the statement of changes in net assets available for benefits and statement of cash flows for the year ended 30th November 2018 of the Scheme on a standalone basis; and (ii) the statement of financial position as at 30th November 2018, and the statement of comprehensive income, statement of changes in net assets attributable to members and statement of cash flows for the year ended 30th November 2018 for each of the Scheme's constituent funds.
2 Summary of significant accounting policies
The principal accounting policies applied in the preparation of these financial statements of the Scheme and its constituent funds are set out below. These policies have been consistently applied to all the years presented, unless otherwise stated.
(a) Basis of preparation
The financial statements have been prepared in accordance with Hong Kong Financial Reporting Standards ("HKFRS") issued by the Hong Kong Institute of Certified Public Accountants. The financial statements have been prepared under the historical cost convention, as modified by the revaluation of financial assets and liabilities (including derivative financial instruments) held at fair value through profit or loss.
Allianz Capital Stable Fund, Allianz Growth Fund and Allianz Stable Growth Fund (the "Terminating Funds") ceased operations on 15th November 2018. The Trustee has resolved to terminate the Terminating Funds and the termination has been deemed effective as of 13th March 2019. As a result, the financial statements for the year ended have not been prepared on a going concern basis. The Trustee has assessed that the values of all assets and liabilities at the reporting date approximate their net realizable value, and therefore no changes of accounting policies or adjustments have been made in the financial statements in order to reflect the fact that the Scheme, will be able to realise its assets or to extinguish its liabilities in the normal course of business.
128

AIA MPF - PRIME VALUE CHOICE
NOTES TO THE FINANCIAL STATEMENTS (CONTINUED) FOR THE YEAR ENDED 30TH NOVEMBER 2018
2 Summary ofsiguificaut accouutiug policies (coutiuued)
(a) Basis ofpreparatiou (coutiuued)
The preparation of financial statements in conformity with HKFRS requires AIA Company (Trustee) Limited (the "Trustee") to make judgments, estimates and assumptions that affect the application of accounting policies and the reported amounts of assets and liabilities, income and expenses. The estimates and associated assumptions are based on historical experience and various other factors that are believed to be reasonable under the circumstances, the results of which form the basis of making the judgments about carrying values of assets and liabilities that are not readily apparent from other sources. Actual results may differ from these estimates.
All references to net assets throughout the financial statements refer to net assets attributable to members unless otherwise stated. All the Scheme and its constituent funds' assets and liabilities are held for the purpose of being traded or are expected to be realised within one year.
Standards and amendments to existing standards effective I st December 2017
There are no standards, interpretations or amendments to existing standards that are effective for the first time for the financial year beginning 1st December 2017 that have a material impact on the Scheme and its constituent funds.
New standards and amendments issued but not effective for the financial year beginning 1st December 201 7 and not early adopted
HKFRS 9 'Financial Instruments' addresses the classification, measurement and derecognition of financial assets and liabilities. It replaces the multiple classification and measurement models in HKAS 39 and is effective for reporting periods beginning on or after 1st January 2018.
Classification and measurement of debt assets will be driven by the entity's business model for managing the financial assets and the contractual cash flow characteristics of the financial assets. A debt instrument is measured at amortised cost if the objective of the business model is to hold the financial asset for the collection of the contractual cash flows and the contractual cash flows under the instrument solely represent payments of principal and interest ("SPPI"). A debt instrument is measured at fair value through other comprehensive income if the objective of the business model is to hold the financial asset both to collect contractual cash flows from SPPI and to sell. All other debt instruments must be recognised at fair value through profit or loss. An entity may however, at initial recognition, irrevocably designate a fmancial asset as measured at fair value through profit or loss if doing so eliminates or significantly reduces a measurement or recognition inconsistency. Derivative and equity instruments are measured at fair value through profit or loss unless, for equity instruments not held for trading, an irrevocable option is taken to measure at fair value through other comprehensive income. HKFRS 9 also introduces a new expected credit loss impairment model.
On adoption of HKFRS 9 the Scheme and its constituent funds' investment portfolio will continue to be classified as fair value through profit or loss. Other financial assets which are held for collection will continue to be measured at amortised cost with no material impact expected from application of the new impairment model. As a result, the adoption of HKFRS 9 is not expected to have a material impact on the Scheme and its constituent funds' financial statements.
There are no other HKFRSs or HK (IFRIC) interpretations that are not yet effective that would be expected to have a material impact on the Scheme and its constituent funds.
129

AIA MPF - PRIME VALUE CHOICE
NOTES TO THE FINANCIAL STATEMENTS (CONTINUED) FOR THE YEAR ENDED 30TH NOVEMBER 2018
2 Summary of significant accounting policies (continued)
(b) Investments
All investments have been classified by the Trustee as financial assets at fair value through profit or loss. These financial assets are classified as held for trading or designated by the Trustee at fair value through profit or loss at inception. ·
Purchases and sales of investments are accounted for on the trade date basis. Investments are initially recognised at fair value, excluding transaction costs which are expensed as incurred, and are subsequently re-measured at fair value. Realised and unrealised gains and losses on investments are included in the statement of changes in net assets available for benefits for the Scheme and the statement of comprehensive income for the constituent funds in the period in which they arise. Investments are derecognised when the rights to receive cash flows from the investments have expired or have been transferred and the Scheme and its constituent funds have transferred substantially all risks and rewards of ownership.
Investments in unitised constituent funds are valued at their respective closing net asset value per unit. Investments in approved pooled investment funds and approved index-tracking collective investment schemes are valued at their respective closing bid prices. The value attributable to the approved pooled investment funds which are insurance policies is the value of the right to claim against the insurance company.
(c) Derivative financial instruments
Derivatives including forward foreign exchange contracts are recognised at fair value on the date on which a derivative contract is entered into and are subsequently re-measured at their fair value. Fair values are obtained from quoted market prices in active markets and valuation techniques, as appropriate. All derivatives are carried as assets when fair value is positive, and as liabilities when fair value is negative. The best evidence of the fair value of a derivative at initial recognition is the transaction price. Subsequent changes in the fair value of any derivatives are recognised immediately in the income statement of comprehensive income of the constituent funds.
( d) Income and expenses
Declared investment return is recognised when declared by the underlying investment. Dividend income from investments is brought into account on the ex-dividend dates. Interest income is recognised on a time-proportion basis using the effective interest method. Other income is accounted for on an accruals basis.
Expenses are accounted for on an accruals basis.
130

AIA MPF - PRIME VALUE CHOICE
NOTES TO THE FINANCIAL STATEMENTS (CONTINUED) FOR THE YEAR ENDED 30TH NOVEMBER 2018
2 Summary of significant accounting policies (continued)
(e) Translation of foreign currencies
(i) Functional and presentation currency
Items included in the financial statements of the Scheme and its constituent funds are measured using the currency of the primary economic environment in which they operate (the "functional currency"). The financial statements are presented in Hong Kong dollars, which is the functional and presentation currency of the Scheme and its constituent funds.
(ii) Transactions and balances
Foreign currency transactions are translated into the functional currency using the exchange rates prevailing at the dates of the transactions. Foreign currency assets and liabilities are translated into the functional currency using the exchange rate prevailing at the year end date.
Foreign exchange gains and losses arising from translation are included in the statement of changes in net assets available for benefits for the Scheme and the statement of comprehensive income for the constituent funds.
Foreign exchange gains and losses relating to cash and cash equivalents are presented in the statement of changes in net assets available for benefits for the Scheme and the statement of comprehensive income for the constituent funds within exchange losses. Foreign exchange gains and losses relating to the financial assets and liabilities carried at fair value through profit or loss are presented in the statement of changes in net assets available for benefits within net unrealised losses on investments in constituent funds and net realised gains on redemption of units in constituent funds for the Scheme and in the statement of comprehensive income within net gains/(losses) on investments for the constituent funds.
(I) Proceeds and payments on issue and redemption of units
The net asset value of the constituent funds is computed on each business day. Prices for issues and redemptions on each business day are based on the closing valuation of that business day.
Proceeds and payments for units subscribed and redeemed are included in the statement of changes in net assets attributable to members of the respective constituent funds.
(g) Cash and cash equivalents
For the purposes of the statement of cash flows, cash and cash equivalents comprise bank deposits with a maturity of three months or less from the date of placement, net of bank overdraft, if any.
(h) Amounts receivable on sale of investments/payable on purchase of investments
Amounts receivable on sale of investments/payable on purchase of investments represent receivables for investments sold and payables for investments purchased that have been contracted for but not yet settled or delivered by the end of the year respectively.
(i) Contributions
Contributions are accounted for on an accruals basis.
131

AJA MPF - PRIME VALUE CHOICE
NOTES TO THE FINANCIAL STATEMENTS (CONTINUED) FOR THE YEAR ENDED 30TH NOVEMBER 2018
2 Summary of significant accounting policies ( continued)
(j) Benefits
Benefits are accounted for on an accruals basis.
(k) Transfers in/out
Transfer-in amounts are recognised when the right to receive payment is established. Transfer-out amounts are accounted for when the obligation to make payment is established.
(I) Forfeitures
If a member ceases to be a member, the part of the employer's voluntary balance not otherwise disposed of in accordance with the rules of the Scheme may be applied in reducing the contributions of the employer, or in such other manner as the Trustee may determine, having consulted the employers (including payment to the employers). Forfeitures arising from such cases which have not been designated for the benefit of existing members and which have not been returned to the employers would be treated as liabilities of the Scheme.
(m) Redeemable value/uuits
The redeemable value attributable to the Guaranteed Portfolio and the redeemable units issued by all other constituent funds, which are redeemable at the holder's option and are classified as equity in accordance with the HKAS 32 (Amendment).
Should the redeemable value's/units' terms or conditions change such that they do not comply with the strict criteria contained in the HKAS 32 (Amendment), the redeemable value/units would be reclassified to a financial liability from the date the instrument ceases to meet the criteria. The financial liability would be measured at the instrument's fair value at the date of reclassification. Any difference between the carrying value of the equity instrument and fair value of the liability on the date of reclassification would be recognised in equity.
Redeemable value/units are redeemed at the members' option. The redeemable value is issued value based on the ratio of outstanding holding balance of the Guaranteed Portfolio's net assets attributable to members as at the close of business on the relevant dealing day, and the redeemable units are issued at prices based on the respective constituent funds' net asset value per unit as at the close of business on the relevant dealing day. The net ·asset value per unit of the respective constituent fund is calculated by dividing the net assets attributable to members with the total number of outstanding units of the respective constituent funds.
(n) Interest in structured entities
A structured entity is an entity that has been designed so that voting or similar rights are not the dominant factor in deciding who controls the entity, such as when any voting rights relate to administrative tasks only, and the relevant activities are directed by means of contractual arrangements. A structured entity often has some or all of the following features or attributes: (a) restricted activities, (b) a narrow and well-defined objective, such as to provide investment opportunities for investors by passing on risks and rewards associated with the assets of the structured entity to investors, ( c) insufficient equity to permit the structured entity to finance its activities without subordinated financial support and ( d) financing in the form of multiple contractually linked instruments to investors that create concentrations of credit or other risks.
132

AIA MPF - PRIME VALUE CHOICE
NOTES TO THE FINANCIAL STATEMENTS (CONTINUED) FOR THE YEAR ENDED 30TH NOVEMBER 2018
2 Summary of significant accounting policies (continued)
(n) Interest in structured entities (continued)
The Scheme and its constituent funds consider all of their investments in other funds ("Underlying Funds") to be investments in unconsolidated structured entities. The Scheme and its constituent funds invest in Underlying Funds whose objective is to achieve long term capital growth. The Underlying Funds are managed by investment managers who apply various investment strategies to accomplish their respective investment objectives.
The Scheme's and its constituent funds' maximum exposures to losses arising from their interests in these unconsolidated structured entities are limited to the carrying amount of the assets. The change in fair value of each Underlying Fund is included in the statement of comprehensive income in 'net gains on investments and derivative financial instruments'.
(o) Offsetting financial instruments
Financial assets and liabilities are offset and the net amount reported in the statement of financial position when there is a legally enforceable right to offset the recognised amounts and there is an intention to settle on a net basis, or realise the asset and settle the liability simultaneously.
3 Financial risk management
The Scheme and its constituent funds are exposed to various risks which are discussed below.
(a) Strategy in using financial instruments
Growth Portfolio The primary objective of the Growth Portfolio is to maximise its long term capital appreciation in Hong Kong dollar terms. The secondary objective is to outperform Hong Kong salary inflation over the long term. The Growth Portfolio seeks to achieve these investment objectives through a professionally managed portfolio, invested in two or more approved pooled investment funds (and to the extent permitted, any other permissible investment as approved by the MPFA and SFC).
The Growth Portfolio asset allocation policy is normally to have an equity content of 90% with the balance invested in bonds and cash. Investments may be made in any market in any country where permitted by the Hong Kong Mandatory Provident Fund Schemes (General) Regulation (the "General Regulation").
Balanced Portfolio The primary objective of the Balanced Portfolio is to maximise its long term capital appreciation in Hong Kong dollar terms within moderate risk parameters. The secondary objective is to outperform Hong Kong price inflation over the long term. The Balanced Portfolio seeks to achieve these investment objectives through a professionally managed portfolio, invested in two or more approved pooled investment funds (and to the extent permitted, any other permissible investment as approved by the MPF A and SFC).
The Balanced Portfolio asset allocation policy is normally to have an equity content of 50% with the remainder in cash and bonds. Investments may be made in any market in any country where permitted by the General Regulation.
133

AIA MPF - PRIME VALUE CHOICE
NOTES TO THE FINANCIAL STATEMENTS (CONTINUED) FOR THE YEAR ENDED 30TH NOVEMBER 2018
3 Financial risk management (continued)
(a) Strategy in using financial instruments (continued)
Capital Stable Portfolio The primary objective of the Capital Stable Portfolio is to minimise its short term capital risk in Hong Kong dollar terms. The secondary objective is to enhance returns over the long term through limited exposure to global equities. The Capital Stable Portfolio seeks to achieve these investment objectives through a professionally managed portfolio, invested in two or more approved pooled investment funds ( and to the extent permitted, any other permissible investment as approved by the MPFA and SFC). The Capital Stable Portfolio does not guarantee the repayment of capital.
The Capital Stable Portfolio asset allocation policy is normally to have the greater proportion of assets invested in bonds and cash, with the balance invested in equities. Investments may l;>e made in any market in any country where permitted by the General Regulation.
Guaranteed Portfolio The primary objective of the Guaranteed Portfolio is to minimise capital risk in Hong Kong dollar terms. The secondary objective is to achieve a stable, consistent and predictable rate of return.
Due to the nature and inclusion of the guarantee, it is possible that there may be a dilution in performance of the Guaranteed Portfolio.
Except for a small portion that may be held in cash or cash based investments for operational purposes, the Guaranteed Portfolio is a feeder fund investing solely in an approved pooled investment fund. The underlying approved pooled investment fund is a guaranteed insurance policy investing entirely in a pooled investment fund approved by the MPF A in the form of a unit trust which invests at least 70% of its non-cash assets in bonds and other fixed income instruments either denominated in Hong Kong dollars or, if they are not denominated in Hong Kong dollars, the effective currency exposure shall be hedged back into Hong Kong dollars in order to ensure that the approved pooled investment fund in the form of a unit trust has an effective currency exposure of at least 70% to the Hong Kong dollar. The remaining assets of the approved pooled investment fund will be held in cash and/or deposits. When investing in a pooled investment fund in the form of a unit trust approved by the MPF A, the underlying investments of such pooled investment fund shall be used to determine whether the relevant percentage limits stated in this section are adhered to. For the avoidance of doubt, units or shares of such pooled investment fund shall not be treated as equity investments for purposes of this section.
The investments of the approved pooled investment fund in the form of a unit trust in bonds are required to comply with the minimum credit rating requirements set by the MPF A in Guidelines on Debt Securities (Guidelines III.I), where appropriate. ·
134

AIA MPF - PRIME VALUE CHOICE
NOTES TO THE FINANCIAL STATEMENTS (CONTINUED) FOR THE YEAR ENDED 30TH NOVEMBER 2018
3 Financial risk management (continued)
(a) Strategy in using financial instruments (continued)
A1P F Conservative Fund The objective of the MPF Conservative Fund is to preserve principal value. The MPF Conservative Fund does not guarantee the repayment of capital.
Except for a small portion to be held in cash or cash based investments for operational purposes, the MPF Conservative Fund is a feeder fund investing solely in an approved pooled investment fund. The underlying approved pooled investment fund is a money market fund investing in deposits and debt securities subject to the restrictions set out in section 3 7 of the General Regulation.
The investments of the underlying approved pooled investment fund in debt securities are required to comply with the minimum credit rating requirements set by the MPFA in Guidelines on Debt Securities (Guidelines III. I), where appropriate.
Hong Kong Equity Fund The Hong Kong Equity Fund is a portfolio management fund investing in two or more approved pooled investment funds and/or approved ITC!Ss. The Hong Kong Equity Fund seeks to provide long term capital appreciation through the underlying approved pooled investment funds and/ or approved iTCISs which invest primarily in securities of companies either listed, based or operating principally in Hong Kong. Implementation of the investment policy is considered to be of high inherent risk.
The Hong Kong Equity Fund is a portfolio management fund investing in two or more approved pooled investment funds and/or approved ITC!Ss which have majority of assets invested in Hong Kong equities. The Hong Kong Equity Fund may hold up to 30% of the assets -in bonds, cash or cash based investments for operational purposes.
European Equity Fund The European Equity Fund is a feeder fund investing solely in an approved pooled investment fund. The investment objective of the European Equity Fund is to provide investors with long term capital growth through the underlying approved pooled investment fund which consists primarily of securities of companies based or operating principally in countries in Western Europe.
A portion of the underlying investment fund may be invested in companies which are based or operating in other countries in Eastern Europe.
Except for a small portion that may be held in cash or cash based investments for operational purposes, the European Equity Fund will invest solely in an approved pooled investment fund whos·e asset allocation policy is normally to have the greater proportion of assets invested in equities and convertib Jes, primarily in the European market, with the remainder in cash and bonds.
Japan Equity Fund The Japan Equity Fund is a feeder fund investing solely in an approved pooled investment fund. The investment objective of the Japan Equity Fund is to provide investors with long term capital growth through the underlying approved pooled investment fund which consists primarily of securities of companies based or operating principally in Japan.
135

AJA MPF - PRIME VALUE CHOICE
NOTES TO THE FINANCIAL STATEMENTS (CONTINUED) FOR THE YEAR ENDED 30TH NOVEMBER 2018
3 Financial risk management ( continued)
(a) Strategy in using financial instruments (continued)
Japan Equity Fund (continued) Except for a small portion that may be held in cash or cash based investments for operational purposes, the Japan Equity Fund will invest solely in an approved pooled investment fund whose asset allocation policy is normally to have the greater proportion of assets invested in equities and convertibles, primarily in the Japan market, with the remainder in cash and bonds.
North American Equity Fund The North American Equity Fund is a feeder fund investing entirely in an approved pooled investment fund. The North American Equity Fund seeks to provide long term capital appreciation through the underlying approved pooled investment fund which consists primarily of shares in US companies.
Except for a small portion to be held in cash or cash based investments for operational purposes, the North American Equity Fund is a feeder fund investing solely in an approved pooled investment fund whose asset allocation policy is normally to have the greater proportion of assets invested in equities and convertibles, primarily in the US market, with the remainder in cash and bonds.
Asian Equity Fund The Asian Equity Fund is a feeder fund investing entirely in an approved pooled investment fund. The investment objective of the Asian Equity Fund is to provide investors with long term capital growth in US dollar terms through a portfolio consisting primarily of securities of companies based or operating principally in the Asia-Pacific region, excluding Japan and Hong Kong.
Except for a small portion that may be held in cash or cash based investments for operational purposes, the Asian Equity Fund will invest solely in an approved pooled investment fund whose asset allocation policy is normally to have a maximum equity content of 100% with the remainder in cash or bonds.
Greater China Equity Fund The Greater China Equity Fund is a portfolio management fund investing in two or more approved pooled investment funds and/or approved ITCISs. The Greater China Equity Fund seeks to provide long term capital appreciation through the underlying approved pooled investment funds and/or approved ITCISs which invest primarily in securities of companies based or operating principally in the Greater China Region i.e. the People's Republic of China, Hong Kong, Macau and Taiwan - the majority of these companies will be listed on a stock exchange in Hong Kong and Taiwan. Implementation of the investment policy is considered to be of high inherent risk.
The Greater China Equity Fund is a portfolio management fund investing in two or more approved pooled investment funds and/or approved ITCISs which have majority of assets invested in Greater China equities. The Greater China Equity Fund may hold up to 30% of the assets in bonds, cash or cash based investments for operational purposes.
136
AIA MPF - PRIME VALUE CHOICE
NOTES TO THE FINANCIAL STATEMENTS (CONTINUED) FOR THE YEAR ENDED 30TH NOVEMBER 2018
3 Financial risk management (continued)
(a) Strategy in using financial instruments (continued)
Allianz Capital Stable Fund (Note 1!
The Allianz Capital Stable Fund is a feeder fund investing entirely in an approved pooled investment fund. The objective of the Allianz Capital Stable Fund is to provide investors with capital preservation combined with steady capital appreciation over the long term by investing in a diversified portfolio of global equities and fixed-interest securities through the underlying approved pooled investment fund. This Allianz Capital Stable Fund is designed for members who are willing to assume a relatively low level of risk. The Allianz Capital Stable Fund does not guarantee the repayment of capital.
Except for a small portion that may be held in cash or cash based investments for operational purposes, the Allianz Capital Stable Fund is intended to invest entirely in an approved pooled investment fund. This approved pooled investment fund is expected to invest 30% of its assets in equities and 70% in fixed-interest securities. The fixed income portion will consist of a range of instruments issued in countries around the world.
The equity portion of the approved pooled investment fund will be invested primarily in the Hong Kong, Japan, North American and European markets with a smaller proportions being invested, at the discretion of the Manager, in other Asian countries and emerging markets.
Allianz Growth Fund (No" 1!
The Allianz Growth Fund is a feeder fund investing entirely in an approved pooled investment fund. The objective of the Allianz Growth Fund is to maximise long term overall returns by investing primarily in global equities through the underlying approved pooled investment fund. This Allianz Growth Fund is designed for members who are willing to assume a relatively higher level of risk to achjeve potentially higher long-term returns.
Except for a small portion that may be held in cash or cash based investments for operational purposes, the Allianz Growth Fund is intended to invest entirely in an approved pooled investment fund. This approved pooled investment fund, may invest in the countries comprised in the MSC! World Index which covers all the major world stock markets including those in Japan, North America, Asia and Europe.
Allianz Stable Growth Fund (Nor, I)
The Allianz Stable Growth Fund is a feeder fund investing entirely in an approved pooled investment fund. The objective of the Allianz Stable Growth Fund is to achieve a stable overall return over the long term by investing in a diversified portfolio of global equities and fixed-interest securities through the underlying approved pooled investment fund. This Allianz Stable Growth Fund is designed for members who are willing to assume a medium level of risk.
Except for a small portion that may be held in cash or cash based investments for operational purposes, the Allianz Stable Growth Fund is intended to invest entirely in an approved pooled investment fund. This approved pooled investment fund, is expected to invest 50% of its assets in equities and 50% in fixed-interest securities. The fixed income portion will consist of a range of instruments issued in countries around the world. The equity portion of the approved pooled investment fund will be invested primarily in the Hong Kong, Japan, North American and European markets with a smaller proportion being invested, at the discretion of the Manager, in other Asian countries and emerging markets.
Note I: Allianz Capital Stable Fund, Allianz Growth Fund and Allianz Stable Growth Fund ("the 3 Allianz Funds") had no investments and operations since 15th November 2018. MPF A had approved the termination of the 3 Allianz Funds to take effect on 13th March 2019.
137

AIA MPF - PRIME VALUE CHOICE
NOTES TO THE FINANCIAL STATEMENTS (CONTINUED) FOR THE YEAR ENDED 30TH NOVEMBER 2018
3 Financial risk management (continued)
(a) Strategy in using financial instruments (continued)
Green Fund The Green Fund is a feeder fund investing entirely in an approved pooled investment fund. The objective of the Green Fund is to provide investors with long term capital appreciation through well diversified investments in global equities principally by investing in companies according to (I) their environmental ratings and (2) financial performance expectations, with a view to outperforming the MSC! World Index over the medium to long term.
The Green Fund is intended to invest entirely in an approved pooled investment fund. With an exception of a small portion that may be held in cash or cash based investments or other short-term bonds permitted by the General Regulation for operational and cash management purpose, most of the assets of this approved pooled investment funds are invested in equity securities. Subject to the limitations required by the General Regulation, this approved pooled investment fund may also invest in exchange traded funds and in convertible bonds or authorised unit trust or authorised mutual fund permitted by the General Regulation for performance management purposes.
The geographical distribution of investments will be driven purely by bottom-up stock selection processes based on the securities comprised in the MSC! World Index which covers all the major world stock markets including but not limited to North America, Europe, Asia and Japan. The Green Fund will not invest in emerging market equities.
Global Bond Fund The Global Bond Fund is a feeder fund investing solely in an approved pooled investment fund. The investment objective of the Global Bond Fund is to seek long term stable return from a combination of current income and capital appreciation by investing in a portfolio of debt securities in the international markets, issued by government, supranational organizations and corporates.
Except for a small portion that may be held in cash or cash based investments for operational purposes, the Global Bond Fund will invest solely in an approved pooled investment fund that normally invests in a portfolio of debt securities in the international market, issued by governments, supranational organizations and corporates.
The investments of the underlying approved pooled investment fund in debt securities are required to comply with the minimum credit rating requirements set by the MPF A in Guidelines on Debt Securities (Guidelines III.I), where appropriate.
World Fund The World Fund is a portfolio management fund investing entirely in approved Index-tracking Collective Investment Schemes (ITC!Ss). The investment objective of the World Fund is to seek a long term capital appreciation by investing in a combination of global equity market index-tracking funds. The World Fund is not an index-tracking fund.
The World Fund will invest mainly in approved ITC!Ss that track equity market indices that cover Large Cap companies in their respective markets around the world. A greater proportion of the assets will primarily be invested in equity market indices that track North American, European, Far Eastern and Australasian markets and a smaller proportion will be invested in Latin American markets. The remaining assets will be held in cash or cash based investments for operational and/or hedging purposes.
138

AIA MPF - PRIME VALUE CHOICE
NOTES TO THE FINANCIAL STATEMENTS (CONTINUED) FOR THE YEAR ENDED 30TH NOVEMBER 2018
3 Financial risk management (continued)
(a) Strategy in using financial instruments (continued)
Manager's Choice Fund The Manager's Choice Fund seeks to achieve long term capital appreciation through a professionally managed portfolio, invested in two or more approved pooled investment funds and/or approved ITCISs. The Manager's Choice Fund attempts to perform dynamic asset allocation in order to maximise long term capital appreciation. The Manager's Choice Fund would be suitable to investors who are willing to accept an above average level of risk in order to achieve long term capital appreciation.
Depending on the global market condition, the Manager's Choice Fund may allocate from 10% to 90% of its assets in equities, with the balance invested in bonds, money market instruments and cash. Investments may be made in the above mentioned asset classes and may be in various markets globally where permitted by the General Regulation. The allocations will change based on the investment manager's view on the economic and market outlook, with higher allocation to equity when equity market outlook is positive, balanced allocation when equity market outlook is neutral and higher allocation to bonds, money market instruments and cash when equity market outlook is negative.
Fidelity Capital Stable Fund The Fidelity Capital Stable Fund is a feeder fund investing entirely in an approved pooled investment fund. The Fidelity Capital Stable Fund aims to produce a positive return over the long term and to focus investment towards less volatile assets of bonds and cash whilst retaining some equity exposure. It also aims to maintain a broad geographic diversification with a bias towards Hong Kong, and to ensure that the risk to the capital base is limited in the short term. The Fidelity Capital Stable Fund does not guarantee the repayment of capital.
Except for a small portion that may be held in cash or cash based investments for operational purposes, the Fidelity Capital Stable Fund invests entirely in an approved pooled investment fund. This approved pooled investment fund is expected to invest 30% of its assets in equities and 70% in bonds and cash. The fund will be invested primarily in Hong Kong, Japan, Asia Pacific ex Japan ex Hong Kong, Americas and European markets.
Fidelity Stable Growth Fund The Fidelity Stable Growth Fund is a feeder fund investing entirely in an approved pooled investment fund. The Fidelity Stable Growth Fund aims to generate a positive return over the long term and to broadly diversify the portfolio as to asset type as between equities and bonds. It also aims to maintain a broad geographic diversification with a bias towards Hong Kong, and to limit the volatility of returns in the short term.
Except for a small portion that may be held in cash or cash based investments for operational purposes, the Fidelity Stable Growth Fund invests entirely in an approved pooled investment fund. This approved pooled investment fund is expected to invest 50% of its assets in equities and 50% in bonds and cash. The fund will be invested primarily in Hong Kong, Japan, Asia Pacific ex Japan ex Hong Kong, Americas and European markets.
Fidelity Growth Fund The Fidelity Growth Fund is a feeder fund investing entirely in an approved pooled investment fund. The Fidelity Growth Fund aims to build real wealth over the long term, to focus investment into the global equity markets and to have the flexibility to invest in global bonds. It also aims to maintain a broad geographic diversification with a bias towards Hong Kong and to manage the volatility of returns in the short term.
139

AIA MPF - PRIME VALUE CHOICE
NOTES TO THE FINANCIAL STATEMENTS (CONTINUED) FOR THE YEAR ENDED 30TH NOVEMBER 2018
3 Financial risk management (continued)
(a) Strategy in using financial instruments (continued)
Fidelity Growth Fund (continued) Except for a small portion that may be held in cash or cash based investments for operational purposes, the Fidelity Growth Fund invests entirely in an approved pooled investment fund. This approved pooled investment fund is expected to invest 90% of its assets in equities and 10% in bonds and cash. The fund will be invested primarily in Hong Kong, Japan, Asia Pacific ex Japan ex Hong Kong, Americas and European markets.
Asian Bond Fund The Asian Bond Fund is a feeder fund investing solely in an approved pooled investment fund. The investment objective of the Asian Bond Fund is to seek long term capital growth by primarily investing in a portfolio of bonds in the Asia-Pacific region (excluding Japan), issued by, amongst others, government, supranational organizations and corporates.
Except for a small portion that may be held in cash or cash based investments for operational purposes, the Asian Bond Fund will invest solely in an approved pooled investment fund whose proposed asset allocation policy is to invest 70% to 100% of assets in bonds within the Asia-Pacific region (excluding Japan), including but not limited to Australia, Hong Kong, Korea, Malaysia, New Zealand, Singapore and Thailand; and 0% to 30% of assets in bonds outside the Asia-Pacific region (excluding Japan), including but not limited to US dollar denominated bonds such as US treasury inflation-protected securities and treasury bonds for defensive purpose during periods of perceived uncertainty and volatility.
The investments of the underlying approved pooled investment fund in bonds are required to comply with the minimum credit rating requirements set by the MPF A in Guidelines on Debt Securities (Guidelines III. I), where appropriate.
Eurasia Fund The Eurasia Fund is a portfolio management fund investing entirely in approved ITCISs. The investment objective of the Eurasia Fund is to seek a long term capital appreciation by investing in a combination of European, Australasian and Far Eastern equity market index-tracking funds. The Eurasia Fund is not an index-tracking fund.
Except for a small portion to be held in cash or cash based investments for operational and/or hedging purposes, the Eurasia Fund will invest solely in approved ITCISs that track European, Australasian and Far Eastern equity market indices.
Hong Kong and China Fund The Hong Kong and China Fund is a portfolio management fund investing entirely in approved ITCISs. The investment objective of the Hong Kong and China Fund is to seek a long term capital appreciation by investing in a combination of equity market index-tracking funds that track Hong Kong equity market indices that measure the performance of companies listed in Hong Kong (including China incorporated enterprises listed in Hong Kong in the form of H Shares). The Hong Kong and China Fund is not an index-tracking fund.
Except for a small portion to be held in cash or cash based investments for operational and/or hedging purposes, the Hong Kong and China Fund will invest solely in approved ITCISs that track Hong Kong equity market indices that measure the performance of companies listed in Hong Kong (including China incorporated enterprises listed in Hong Kong in the form of H Shares).
140

AIA MPF - PRIME VALUE CHOICE
NOTES TO THE FINANCIAL STATEMENTS (CONTINUED) FOR THE YEAR ENDED 30TH NOVEMBER 2018
3 Financial risk management (continued)
(a) Strategy in using financial instruments (continued)
American Fund The American Fund is a portfolio management fund investing entirely in approved ITCISs. The investment objective of the American Fund is to seek a long term capital appreciation by investing in a combination of North and South American equity market index-tracking funds. The American Fund is not an index-tracking fund.
Except for a small portion to be held in cash or cash based investments for operational and/or hedging purposes, the American Fund will invest solely in approved ITCISs that track North and South American equity market indices.
Age 65 Plus Fund The Age 65 Plus Fund is a feeder fund investing entirely in an approved pooled investment fund, namely, the Vanguard Income Fund. The investment objective of the Age 65 Plus Fund is to provide stable growth to Members in a globally diversified manner.
The investment manager of the Vanguard Income Fund will adopt a passive investment strategy in managing the portfolio by investing substantially all of the assets in constituent securities included in the Reference Portfolio of the Age 65 Plus Fund using sampling techniques. The investment manager of the Vanguard Income Fund will seek to hold a range of securities that, in the aggregate, approximate the Reference Portfolio of the Age 65 Plus Fund in terms of the key characteristics: (i) for the equity investments, they will consist of a broadly diversified collection of stocks that approximate those included in the Reference Portfolio of the Age 65 Plus Fund in terms of factors such as country weightings, industry weightings, market capitalization and other financial characteristics of stocks; and (ii) for the bond investments, they will be made in consideration of factors such as country weightings, duration and cash flow. At the time of launch, the Reference Portfolio of the Age 65 Plus Fund is identified as follows: 20% FTSE MPF All-World Index (HKD unhedged total return) + 77% Citi MPF World Government Bond Index (HKD hedged total return) + 3 % cash or money market instruments providing a return at MPF Prescribed Savings Rate (HKD unhedged total return). The Reference Portfolio is subject to change from time to time. Please visit www.hkifa.org.hk for further information.
Sampling techniques are an approach whereby the investment manager of the Vanguard Income Fund tracks the Reference Portfolio of the Age 65 Plus Fund by investing in a representative portion, or sample, of the full list of the constituent securities of the Reference Portfolio of the Age 65 Plus Fund such that the overall characteristics of the portion of securities invested by the Vanguard Income Fund would be similar to those of the full list of constituent securities of the Reference Portfolio of the Age 65 Plus Fund.
Under such sampling techniques, the vast majority of the Vanguard Income Fund's holdings will be constituent securities that are within the universe of the Reference Portfolio of the Age 65 Plus Fund, except in limited circumstances where it is in the best interest of the Vanguard Income Fund. Such limited circumstances may include but not limited to where:
(i) it is not possible or it is difficult to buy or hold constituent securities (e.g. due to liquidity or restrictions of ownership of such constituent securities);
141

AIA MPF - PRIME VALUE CHOICE
NOTES TO THE FINANCIAL STATEMENTS (CONTINUED) FOR THE YEAR ENDED 30TH NOVEMBER 2018
3 Financial risk management (continued)
(a) Strategy in using financial instruments (continued)
Age 65 Plus Fund (continued) (ii) the holding of non-constituent securities which were originally constituent securities is, in the opinion of the investment manager of the Vanguard Income Fund, more cost efficient to reflect the overall characteristics of the Reference Portfolio of the Age 65 Plus Fund;
(iii) investment in the constituent securities is not the most efficient way to reflect the performance of the Reference Portfolio of the Age 65 Plus Fund, for example when it is more cost efficient to invest in the non-constituent securities which reflect the overall characteristics of the Reference Portfolio of the Age 65 Plus Fund;
(iv) the non-constituent securities which are, in the reasonable opinion of the investment manager of the Vanguard Income Fund, likely to form part of the Reference Portfolio of the Age 65 Plus Fund within six months of acquisition;
(v) the non-constituent securities which the investment manager of the Vanguard Income Fund considers to be an appropriate substitute for the constituent securities of the Reference Portfolio of the Age 65 Plus Fund having regard to investment objectives of the Vanguard Income Fund; and
(vi) to gain exposure to permissible securities in countries where such access is otherwise limited.
Such investment strategy aims to provide consistent investment returns in relation to the Reference Portfolio of the Age 65 Plus Fund in a cost efficient manner.
Through such underlying investment, the Age 65 Plus Fund will indirectly hold 20% of its net assets in Higher Risk Assets (such as global equities), with the remainder investing in Lower Risk Assets (such as global bonds and money market instruments). The asset allocation of Higher Risk Assets may vary between 15% and 25% due to differing price movements of various equity and bond markets. There is no prescribed allocation for investments in any specific countries or currencies.
142

AIA MPF - PRIME VALUE CHOICE
NOTES TO THE FINANCIAL STATEMENTS (CONTINUED) FOR THE YEAR ENDED 30TH NOVEMBER 2018
3 Financial risk management (continned)
(a) Strategy in using financial instruments (continued)
Core Accumulation Fund The Core Accumulation Fund is a feeder fund investing entirely in an approved pooled investment fund, namely, the Vanguard Moderate Growth Fund. The investment objective of the Core Accumulation Fund is to provide capital growth to Members by indirectly investing in a globally diversified manner.
The investment manager of the Vanguard Moderate Growth Fund will adopt a passive investment strategy in managing the portfolio by investing substantially all of the assets in constituent securities included in the Reference Portfolio of the Core Accumulation Fund using sampling techniques. The investment manager of the Vanguard Moderate Growth Fund will seek to hold a range of securities that, in the aggregate, approximate the Reference Portfolio of the Core Accumulation Fund in terms of the key characteristics: (i) for the equity investments, they will consist of a broadly diversified collection of stocks that approximate those included in the Reference Portfolio of the Core Accumulation Fund in terms of factors such as country weightings, industry weightings, market capitalization and other financial characteristics of stocks; and (ii) for the bond investments, they will be made in consideration of factors such as country weightings, duration and cash flow. At the time of launch, the Reference Portfolio of the Core Accumulation Fund is identified as follows: 60% FTSE MPF All-World Index (HKD unhedged total return) + 37% Citi MPF World Government Bond Index (HKD hedged total return) + 3% cash or money market instruments providing a return at MPF Prescribed Savings Rate (HKD unhedged total return). The Reference Portfolio is subject to change from time to time. Please visit www.hkifa.org.hk for further information.
Sampling techniques are an approach whereby the investment manager of the Vanguard Moderate Growth Fund tracks the Reference Portfolio of the Core Accumulation Fund by investing in a representative portion, or sample, of the full list of the constituent securities of the Reference Portfolio of the Core Accumulation Fund such that the overall characteristics of the portion of securities invested by the Vanguard Moderate Growth Fund would be similar to those of the full list of constituent securities of the Reference Portfolio of the Core Accumulation Fund.
Under such sampling techniques, the vast majority of the Vanguard Moderate Growth Fund's holdings will be constituent securities that are within the universe of the Reference Portfolio of the Core Accumulation Fund, except in limited circumstances where it is in the best interest of the Vanguard Moderate Growth Fund. Such limited circumstances may include but not limited to where:
(i) it is not possible or it is difficult to buy or hold constituent securities ( e.g. due to liquidity or restrictions of ownership of such constituent securities);
(ii) the holding of non-constituent securities which were originally constituent securities is, in the opinion of the investment manager of the Vanguard Moderate Growth Fund, more cost efficient to reflect the overall characteristics of the Reference Portfolio of the Core Accumulation Fund;
(iii) investment in the constituent securities is not the most efficient way to reflect the performance of the Reference Portfolio of the Core Accumulation Fund, for example when it is more cost efficient to invest in the non-constituent securities which reflect the overall characteristics of the Reference Portfolio of the Core Accumulation Fund;
143

AIA MPF - PRIME VALUE CHOICE
NOTES TO THE FINANCIAL STATEMENTS (CONTINUED) FOR THE YEAR ENDED 30TH NOVEMBER 2018
3 Financial risk management (continued)
(a) Strategy in using financial instruments (continued)
Core Accumulation Fund (continued) (iv) the non-constituent securities which are, in the reasonable opinion of the investment manager of the Vanguard Moderate Growth Fund, likely to form part of the Reference Portfolio of the Core Accumulation Fund within six months of acquisition;
(v) the non-constituent securities which the investment manager of the Vanguard Moderate Growth Fund considers to be an appropriate substitute for the constituent securities of the Reference Portfolio of Core Accumulation Fund having regard to investment objectives of the Vanguard Moderate Growth Fund; and
(vi) to gain exposure to permissible securities in countries where such access is otherwise limited.
Such investment strategy aims to provide consistent investment returns in relation to the Reference Portfolio of the Core Accumulation Fund in a cost efficient manner.
Through such underlying investment, the Core Accumulation Fund will indirectly hold 60% of its net assets in Higher Risk Assets (such as global equities), with the remainder investing in Lower Risk Assets (such as global bonds and money market instruments). Although the Core Accumulation Fund will target to indirectly hold 60% assets in Higher Risk Assets (such as global equities), with the remainder investing in Lower Risk Assets (such as global bonds and money market instruments), the asset allocation to Higher Risk Assets may vary between 55% and 65% due to differing price movements of various equity and bond markets. There is no prescribed allocation for investments in any specific countries or currencies.
China HK Dynamic Asset A/location Fund The China HK Dynamic Asset Allocation Fund is a feeder fund investing entirely in an approved pooled investment fund, Value Partners Asset Allocation Fund, a sub fund of Value Partners Choice Investment Funds. The objective of the China HK Dynamic Asset Allocation Fund is to aim to achieve long-term capital growth potential with medium-high volatility through the Value Partners Asset Allocation Fund which (i) mainly invests in Hong Kong and China equities and debt securities, with up to 9% of its assets investing in exchange-traded funds that track the price of gold, and (ii) performs dynamic asset allocation. The China HK Dynamic Asset Allocation Fund is suitable to investors who are willing to accept an above average level of risk in order to aim to achieve longterm capital growth potential.
Depending on the China and Hong Kong market conditions, Value Partners Asset Allocation Fund may, through investing in other approved pooled investment funds, allocate between I 0% to 90% of its assets to Hong Kong and China equities, with the remaining balance mainly invested in Hong Kong and China debt securities (including debt securities that are denominated in offshore Renminbi, "Offshore RMB Bonds") and up to 9% of its assets investing in exchange-traded funds that track the price of gold.
The equities will be selected from the FTSE MPF Hong Kong Index by the adoption of a screening model, which aims to identify investment opportunities within the FTSE MPF Hong Kong Index through analyzing multiple quantitative data such as valuation, return on equity, volatility, and market capitalisation.
144

AIA MPF - PRIME VALUE CHOICE
NOTES TO THE FINANCIAL STATEMENTS (CONTINUED) FOR THE YEAR ENDED 30TH NOVEMBER 2018
3 Financial risk management ( continued)
(a) Strategy iu using financial instruments (continued)
China HK Dynamic Asset Allocation Fund (continued) The majority of the debt securities will be China and Hong Kong debt securities issued by (i) companies or issuers listed, established in or operating principally in, or which derive or are expected to derive a significant portion of their earnings or revenues from or which have part of their assets, production activities or other business interests based in or related to China and/or Hong Kong, and (ii) governments and government related entities in China or Hong Kong. Offshore RMB Bonds may be invested, including fixed and floating rate securities, convertible bonds and notes issued or distributed outside China by sovereigns, government agencies, supra-nationals, banks, corporations and exempt authorities. Currently, debt securities issued within China will not be invested. Debt securiti~s issued by issuers (including corporations, government and government related entities) established outside China and Hong Kong but within the Asian region, and which are linked to or have part of their operations, revenue, assets, production activities or other business interests based in or related to China and / or Hong Kong, may also be invested.
Value Partners Asset Allocation Fund, through investing in other approved pooled investment funds, may invest up to 9% of its assets in exchange-traded funds that track the price of gold and are approved by the MPF A as permissible investments from time to time.
The asset allocation of the Value Partners Asset Allocation Fund will change based on its investment manager's view on the economic and market outlook, with higher allocation to equity when equity market outlook is positive, balanced allocation between equity and debt securities when equity market outlook is neutral and higher allocation to debt securities and cash when equity market outlook is negative.
(b) Market price risk
Market price risk is the risk that the value of a financial instrument will fluctuate as a result of changes in market prices, whether those changes are caused by factors specific to the individual instrument or factors affecting all instruments in the market.
The investments are subject to market price risk arising from uncertainties about the future prices of the investments.
The constituent funds' market price risk is managed through diversification of the underlying investment portfolio of the approved pooled investment funds and index-tracking collective investment schemes held. The market exposures arising from investments in approved pooled investment funds for each of the constituent funds are disclosed in note 8 of these financial statements.
145
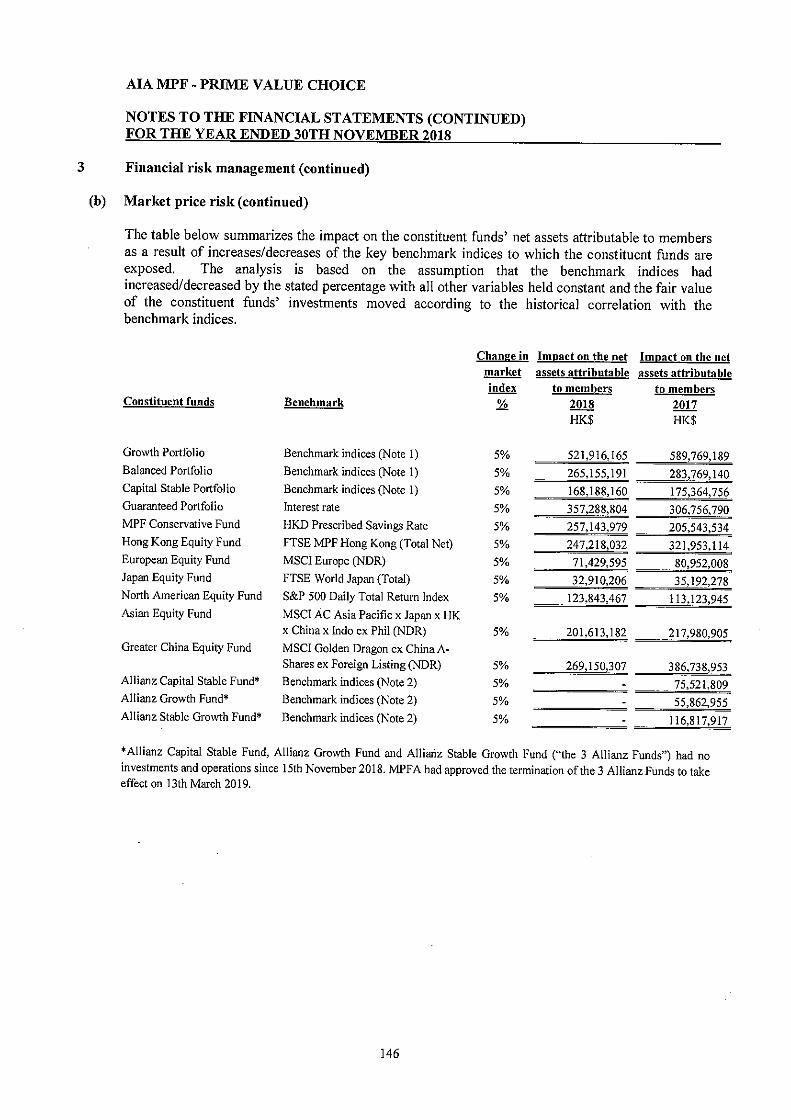
AIA MPF - PRIME VALUE CHOICE
NOTES TO THE FINANCIAL STATEMENTS (CONTINUED) FOR THE YEAR ENDED 30TH NOVEMBER 2018
3 Financial risk management ( continned)
(b) Market price risk (continued)
The table below summarizes the impact on the constituent funds' net assets attributable to members as a result of increases/decreases of the key benchmark indices to which the constituent funds are exposed. The analysis is based on the assumption that the benchmark indices had increased/decreased by the stated percentage with all other variables held constant and the fair value of the constituent funds' investments moved according to the historical correlation with the benchmark indices.
Change in lmJ!act on the net Im11act on the net market assets attributable assets attributable index to members to members
Constituent funds Benchmark % 2018 2017 HK$ HK$
Growth Portfolio Benchmark indices (Note I) 5% 521,916,165 589,769,189 Balanced Portfolio Benchmark indices (Note I) 5% 265,155,191 283,769,140 Capital Stable Portfolio Benchmark indices (Note I) 5% 168,188,160 175,364,756 Guaranteed Portfolio Interest rate 5% 357,288,804 306,756,790 MPF Conservative Fund HKD Prescribed Savings Rate 5% 257,143,979 205,543,534 Hong Kong Equity Fund FTSE MPF Hong Kong (Total Net) 5% 247,218,032 321,953,114 European Equity Fund MSC! Europe (NDR) 5% 71,429,595 80,952,008 Japan Equity Fund FTSE World Japan (Total) 5% 32,910,206 35,192,278 North American Equity Fund S&P 500 Daily Total Return Index 5% 123,843,467 113,123,945 Asian Equity Fund MSC! AC Asia Pacific x Japan x HK
x China x lndo ex Phil (NDR) 5% 201,613,182 217,980,905 Greater China Equity Fund MSC! Golden Dragon ex China A-
Shares ex Foreign Listing (NDR) 5% 269,150,307 386,738,953 Allianz Capital Stable Fund* Benchmark indices (Note 2) 5% 75,521,809 Allianz Growth Fund* Benchmark indices (Note 2) 5% 55,862,955 Allianz Stable Growth Fund* Benchmark indices (Note 2) 5% 116,817,917
'Allianz Capital Stable Fund, Allianz Growth Fund and Allianz Stable Growth Fund ("the 3 Allianz Funds") had no
investments and operations since 15th November 2018. MPFA had approved the termination of the 3 Allianz Funds to take effect on 13th March 2019.
146

3
(b)
AIA MPF - PRIME VALUE CHOICE
NOTES TO THE FINANCIAL STATEMENTS (CONTINUED) FOR THE YEAR ENDED 30TH NOVEMBER 2018
Financial risk management (continued)
Market price risk (continued)
Im(!act on the net Imuact on the net Change in assets attributable assets attributable
market index to members to members Constituent funds Benchmark %· 2018 2017
HK$ HK$
Green Fund MSC! The World Index 5% 93,547,083 90,975,515
Global Bond Fund Citi WBIG ex MBS in USD 5% 482,197,832 573,534,J 14
World Fund Benchmark indices (Note 3) 5% 65,282,544 61,645,346
11.4% Manager1s Choice Fund Volatility (2017: 3.7%) 477,706,947 171,254,084
Fidelity Capital Stable Fund Benchmark indices (Note 4) 5% 48,577,997 23,555,338
Fidelity Stable Growth Fund Benchmark indices (Note 4) 5% 105,684,095 61,348,758
Fidelity Growth Fund Benchmark indices (Note 4) 5% 109,215,298 60,638,916
Asian Bond Fund JPM Customized Asian Bond Index 5% 314,849,352 190,880,995
Eurasia Fund Benchmark indices (Note 5) 5% 15,601,812 15,104,050
Hong Kong and China Fund Benchmark indices (Note 6) 5% 100,859,092 100,067,661
American Fund Benchmark indices (Note 7) 5% 39,475,775 31,959,188
Age 65 Pl us Fund Benchmark indices (Note 8) 5% 53,524,360 24,765,736
Core Accumulation Fund Benchmark indices (Note 8) 5% 200,609,602 175,133,521
China HK Dynamic Asset Benchmark indices (Note 9) Allocation Fund 5% 25,413,154 17,410,394
The Trustee and the Investment Managers have used their view of what would be a reasonable shift in each key market to estimate the change for use in the market sensitivity analysis above.
Disclosures above are shown in absolute terms, changes and impacts could be positive or negative. Changes in benchmark indices percentage are revised annually depending on the current view of the Trustee and the Investment Managers on market volatility and other relevant factors.
As at 30th November 2018 and 2017, except for Growth Portfolio, Balanced Portfolio and Capital Stable Portfolio, the benchmark indices used are same as those used for the underlying investment funds. The benchmark indices used compose of the following indices:
Growth Balanced CaQital Stable
Portfolio Portfolio Portfolio
Note 1: FTSE MPF Hong Kong (Total Return) 30.0% 17.0% 10.0%
FTSE MPF Asia Pacific ex Japan ex Hong Kong 12.0% 6.5% 4.0%
(Total Return) MPF Prescribed Savings Rate 3.0% 5.0% 10.0%
FSTE World Government Bond Index (35% HK$ 7.0% 45.0% 60.0% hedged) (Previously known as ;;Citigroup World
Government Bond Index (35%HK$ hedged)")
FTSE MPF USA (Total Return) 18.0% 10.0% 6.0%
FTSE MPF Europe (Total Return) 18.0% 10.0% 6.0%
FTSE MPF Japan (Total Return) 12.0% 6.5% 4.0%
147

AJA MPF - PRIME VALUE CHOICE
NOTES TO THE FINANCIAL STATEMENTS (CONTINUED) FOR THE YEAR ENDED 30TH NOVEMBER 2018
3 Financial risk management (continued)
(b) Market price risk (continued)
Note 2: FTSE MPF Hong Kong (Total Return) FTSE All World Asia Pacific ex Japan And Hong Kong Index (Total Return) FTSE Japan Index FTSE All World North America Index (Total Return) FTSE All World Ew-ope Index (Total Return) FTSE WGBI All Mattrrities USO (Previously known as "Citigroup WGBI All Mattrrities USO") FTSE WGBI All Mattrrities USO (Hedged) (Previously known as "Citigroup WGBI All Matw-ities USO (hedged)") MPFA Prescribed Savings Rate
Note 3: MSC! EAFE OTR Net S&P Latin America 40 Index S&P 500 Index
Note 4: FTSE MPF Hong Kong Index FTSE All-World Asia Pacific ex Japan ex Hong Kong Index FTSE World Japan Index FTSE AJI-World North America Index FTSE AJI-World Ew-ope Index FTSE MPF World Government Bond Index, 25% Hedged to HKO (Previously known as "Citi MPF World Government Bond Index, 25% Hedged to HKO") I Month HIBOR
Note5: MSCIEAFEOTRNet Hang Seng Index (Total Return)
Note 6: Hang Seng Index (Total Return) Hang Seng China Enterprise Index (Total Return)
Note 7: S&P 500 (Price Return) S&P Latin America 40 OTR Net
148
Allianz Capital Stable Fund
10.00% 4.00%
4.00% 6.00%
6.00%
45.00%
15.00%
10.00%
Fidelity Capital Stable Fund
10.0% 4.0%
4.0% 6.0% 6.0%
60.0%
10.0%
Allianz Allianz Growth Stable Fund
Growth Fund 17.00% 6.50%
6.50% 10.00%
10.00%
33.75%
11.25%
5.00%
Fidelity Stable
Growth Fund 17.0% 6.5%
6.5% 10.0% 10.0% 45.0%
5.0%
30.00% 12.00%
12.00% 18.00%
18.00%
5.25%
1.75%
3.00%
World Fund 30.0% 20.0% 50.0%
Fidelity Growth Fund
30.0% 12.0%
12.0% 18.0% 18.0% 7.0%
3.0%
Ew-asia Fund 80.0% 20.0%
Hong Kong and China Fund
80.0% 20.0%
American Fund 80.0% 20.0%

AIA MPF - PRIME VALUE CHOICE
NOTES TO THE FINANCIAL STATEMENTS (CONTINUED) FOR THE YEAR ENDED 30TH NOVEMBER 2018
3 Financial risk management (continued)
(b) Market price risk (continued)
Note 8: FTSE MPF All World Index (HKD Unhedged Total Return) FTSE MPF World Government Bond Index (HKD Hedged Total Return)* (Prior to !st April 2019, known as "Citi MPF World Government Bond Index (HKD Hedged Total Return)") MPFA Prescribed Savings Rate (HKD hedged total return)
Note 9: FTSE MPF Hong Kong Index Marki! iBoxx ALBI HK 3 Month HIBOR
(c) Interest rate risk
Age 65 Plus Fund
20.0%
77.0%
3.0%
Core Accumulation
Fund 60.0%
37.0%
3.0%
China HK Dynamic Asset
Allocation Fund 50.0% 25.0% 25.0%
Interest rate risk is the risk that the value of a fmancial instrument will fluctuate due to changes in market interest rates.
Except for bank balances, the majority of the financial assets and liabilities of the Scheme and its constituent funds are non-interest bearing. As a result, the Scheme and its constituent funds are not subject to significant amounts of risk due to fluctuations in the prevailing levels of market interest rates. However, certain constituent funds are indirectly exposed to interest rate risk in respect of their underlying investment funds that invest in debt securities and money market instruments, and is reflected under market price risk.
The Scheme and its constituent funds had interest bearing bank deposits ofHK$170,356,301 (2017: HK:$143,879,731) and HK$1,210,039,061 (2017: HK$828,008,505) respectively as at year end and are therefore exposed to interest rate risk on these bank deposits.
As at year end, should the relevant market interest rates have risen/lowered by 1 % with all other variables held constant, the increase/decrease in net assets of the Scheme and its constituent funds for the year would amount to approximately HK$1,703,563 (2017: HK:$1,438,797) and HK$ 12, 100,391 (2017: HK$8,280,085) respectively, arising mainly from the increase/decrease in the bank interest income.
149

AIA MPF - PRIME VALUE CHOICE
NOTES TO THE FINANCIAL STATEMENTS (CONTINUED) FOR THE YEAR ENDED 30TH NOVEMBER 2018
3 Financial risk management (continued)
( d) Credit and cnstody risk
Credit risk is the risk that a counterparty will be unable to pay amounts in full when due.
The maximum exposure to credit risk at year end is the carrying amount of the financial assets as shown in the statement of net assets available for benefits for the Scheme and the statement of net assets for the constituent funds. None of the assets is impaired nor past due but not impaired.
The Scheme's financial assets which are potentially subject to concentrations of credit risk consist principally of bank deposits. As at 30th November 2018, bank deposits of HK$2 l l,870,745 (2017: HK$201,864,972) are placed with Citibank N.A. with a credit rating by Moody's of Al (2017: Al).
Certain transactions entered into by the constituent funds may expose them to risks associated with counterparties not able to fulfil their obligations. To mitigate this risk, the constituent funds only buy and sell through brokers who have been approved as an acceptable counterparty according to the Managers' inteqial counterparty credit review procedures.
All derivative financial instruments represent outstanding forward foreign exchange contracts as disclosed in note 9. The counterparty of these forward foreign exchange contracts is The Hongkong and Shanghai Banking Corporation Limited with a credit rating by S&P of A (2017: A).
The constituent funds' financial assets which are potentially subject to concentrations of credit risk consist principally of bank deposits and investments held with the custodian. The table below summarises the assets placed with the banks and custodian at 30th November 2018 and 2017:
150

3
(d)
AIA MPF - PRIME VALUE CHOICE
NOTES TO THE FINANCIAL STATEMENTS (CONTINUED) FOR THE YEAR ENDED 30TH NOVEMBER 2018
Financial risk management (continned)
Credit and cnstody risk (continned)
Bank Custodian At 30th November 2018 Bank and custodian HK$ HK$
Growth Portfolio Citibank N.A. 3,857,645 10,530,985,402
Dah Sing Bank Limited 380,088,302
Balanced Portfolio Citibank N.A 3,302,401 5,102,134,197
Dab Sing Bank Limited 326,937,727
Capital Stable Portfolio Citibank N.A. 3,812,230 3,109,760,235
Dab Sing Bank Limited 243,166,800
OCBC Wing Hang Bank Limited 131,806,181
Guaranteed Portfolio Citibank N.A. * 9,168,614,948
MPF Conservative Fund Citibank N.A. 5,358,106,261
Hong Kong Equity Fund Citibank N.A 5,994,590,747
European Equity Fund Citibank N.A. 1,449,718,959
Japan Equity Fund Citibank N.A. 662,964,708
North American Equity Fund Citibank N.A 2,499,986,790
Asian Equity Fund Citibank N.A. 3,954,418,559
Greater China Equity Fund Citibank N.A. 6,813,678,268 Allianz Capital Stable Fund (Note i) Citibank N .A
Allianz Growth Fund (Note i) Citibank N.A Allianz Stable Growth Fund (Note i) Citibank N.A.
Green Fund Citibank N.A. 1,852,870,067
Global Bond Fund Citibank N.A. 1,517,266,766
World Fund Citibank N.A. 372,091 1,334,015,963
Manager's Choice Fund Citibank N.A. 1,293,334 4,183,082,705
Dah Sing Bank Limited 128,040,05 I
Fidelity Capital Stable Fund Citibank N.A. 966,407,721
Fidelity Stable Growth Fund Citibank N.A. 2,078,453,875
Fidelity Growth Fund Citibank N.A. 2,129,698,307
Asian Bond Fund Citibank N.A. 961,947,625
Eurasia Fund Citibank N.A. 2,100,874 337,455,029
Hong Kong and China Fund Citibank N.A. 49,282,127 2,138,147,608
American Fund Citibank N.A. 348,240 889,021,497
Age 65 Plus Fund Citibank N .A. 441,799,804
Core Accumulation Fund Citibank N.A. 1,638,954,245
China HK Dynamic Asset Allocation Fund Citibank N.A 543,234,678
Credit Source of rating credit rating
Al Moody's
A2 Moody's
Al Moody's
A2 Moody's
Al Moody's
A2 Moody's
Al Moody's
Al Moody's
Al Moody's
Al Moody's
Al Moody's
Al Moody's
Al Moody's
Al Moody's
Al Moody's
Al Moody's
Al Moody's
Al Moody's
Al Moody's
Al Moody's
Al Moody's
Al Moody's
A2 Moody's
Al Moody's
Al Moody's
Al Moody's
Al Moody's
Al Moody's
Al Moody's
Al Moody's
Al Moody's
Al Moody's
Al Moody's
Note i: Allianz Capital Stable Fund, Allianz Growth Fund and Allianz Stable Growth Fund ("the 3 Allianz Funds")
had no investments and operations since 15th November 2018. MPF A had approved the termination of the 3 Allianz Funds to take effect on 13th March 2019.
* represents custodian of the underlying investments
151

AIA MPF - PRIME VALUE CHOICE
NOTES TO THE FINANCIAL STATEMENTS (CONTINUED) FOR THE YEAR ENDED 30THNOVEMBER 2018
3 Financial risk management (continued)
(d) Credit and custody risk ( continued)
Source of
Bank Custodian Credit credit
At 30th November 2017 Bank and custodian HK$ HK$ rating rating
Growth Portfolio Citibank N .A 175,270 12,327,767,383 Al Moody's
Dah Sing Bank Limited 17,351,764 AJ Moody's
Balanced Portfolio Citibank N.A. 3,230,139 5,506,146,912 Al Moody's Dah Sing Bank Limited 319,783,761 AJ Moody's
Capital Stable Portfolio Citibank N.A. 3,437,095 3,296,920,687 Al Moody's Dah Sing Bank Limited 254,742,600 Al , Moody's
OCBC Wing Hang Bank Limited 85,529,723 Al Moody's
Guaranteed Portfolio Citibank N .A.* 8,205,078,039 Al Moody's
MPF Conservative Fund Citi_bank N .A 4,252,337,870 Al Moody's Hong Kong Equity Fund Citibank N .A 6,736,249,763 Al Moody's
European Equity Fund Citibank N.A. 1,727,869,690 Al Moody's Japan Equity Fund Citibank N.A. 750,128,734 Al Moody's
North American Equity Fund Citibank N .A 2,295,704,110 Al Moody's
Asian Equity Fund Citibank N .A. 4,450,838,370 Al Moody's
Greater China Equity Fund Citibank N .A. 8,026,981,823 Al Moody's
Allianz Capital Stable Fund Citibank N .A. 408,303,580 Al Moody's
Allianz Growth Fund Citibank N .A. 1,099,968,179 Al Moody's
AJlianz Stable Growth Fund Citibank N .A. 794,286,225 Al Moody's
Green Fund Citibank N.A. 1,827,780,805 Al Moody's
Global Bond Fund Citibank N .A. 1,299,403,744 Al Moody's
World Fund Citibank N.A. 4,523,470 1,255,558,954 Al Moody's Manager's Choice Fund Citibank N .A. 1,529,682 4,452,023,893 Al Moody's
Dah Sing Bank Limited 150,600,656 Al Moody's Fidelity Capital Stable Fund Citibank N .A. 451,589,480 Al Moody's
Fidelity Stable Growth Fund Citibank N .A. 1,195,891,799 Al Moody's Fidelity Growth Fund Citibank N .A. 1,185,279,278 Al Moody's Asian Bond Fund Citibank N .A. 760,909,171 Al Moody's
Eurasia Fund Citibank N .A. 2,082,671 328,368,177 Al Moody's Hong Kong and China Fund Citibank N .A. 48,947,386 2,140,019,767 Al Moody's American Fund Citibank N .A. 2,612,721 727,201,669 Al Moody's Age 65 Plus Fund Citibank N .A. 215,319,489 Al Moody's
Core Accumulation Fund Citibank N.A. 1,043,1!0,801 Al Moody's China HK Dynamic Asset
'Allocation Fund Citibank N.A. 289,459,669 Al Moody's
* represents custodian of the underlying investments
152
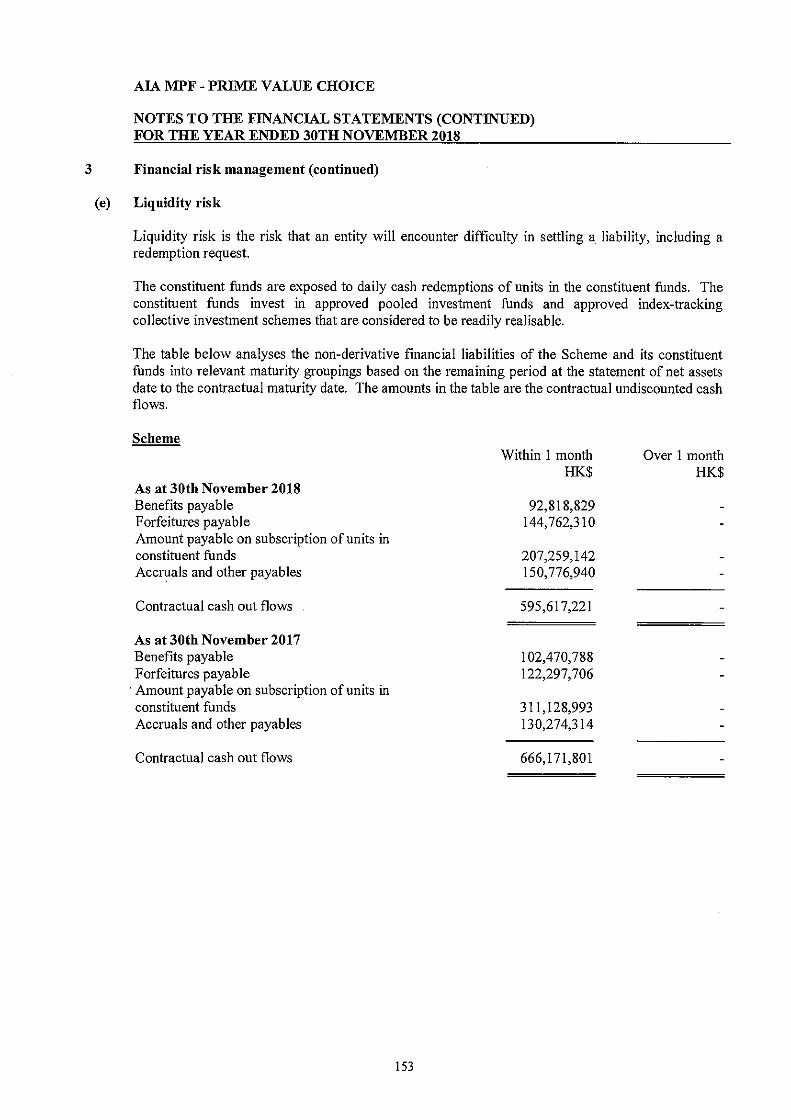
AJA MPF - PRIME VALUE CHOICE
NOTES TO THE FINANCIAL STATEMENTS (CONTINUED) FOR THE YEAR ENDED 30TH NOVEMBER 2018
3 Financial risk management (continued)
(e) Liquidity risk
Liquidity risk is the risk that an entity will encounter difficulty in settling a liability, including a redemption request.
The constituent funds are exposed to daily cash redemptions of units in the constituent funds. The constituent funds invest in approved pooled investment funds and approved index-tracking collective investment schemes that are considered to be readily realisable.
The table below analyses the non-derivative financial liabilities of the Scheme and its constituent funds into relevant maturity groupings based on the remaining period at the statement of net assets date to the contractual maturity date. The amounts in the table are the contractual undiscounted cash flows.
Scheme
As at 30th November 2018 Benefits payable Forfeitures payable Amount payable on subscription of units in constituent funds Accruals and other payables
Contractual cash out flows
As at 30th November 2017 Benefits payable Forfeitures payable
· Amount payable on subscription of units in constituent funds Accruals and other payables
Contractual cash out flows
153
Within 1 month HK.$
92,818,829 144,762,310
207,259,142 150,776,940
595,617,221
102,470,788 122,297,706
311,128,993 130,274,314
666,171,801
Over 1 month HK$

AIA MPF- PRIME VALUE CHOICE
NOTES TO THE FINANCIAL STATEMENTS (CONTINUED) FOR THE YEAR ENDED 30TH NOVEMBER 2018
3 Financial risk management ( continued)
(e) Liquidity risk (continued)
Constituent fonds As at 30th November 2018
Less than 7 days 7 days to 12 months
Amounts
Amounts payable on
payable on purchase of Accruals and Contractual redemption investments Total other payables Total cash outflows
HK$ HK$ HK$ HK$ HK$ HK$ Growth Portfolio 14,079,431 2,746,293 16,825,724 18,637,489 18,637,489 35,463,213 Balanced Portfolio 7,835,713 1,164,445 9,000,158 9,260,153 9,260,153 18,260,311 Capital Stable Portfolio 8,871,150 1,269,986 10,141,136 5,950,910 5,950,910 16,092,046 Guaranteed Portfolio 21,002,981 21,002,981 21,002,981 MPF Conservative Fund 10,192,738 10,192,738 4,193,603 4,193,603 14,386,341 Hong Kong Equity Fund 37,418,523 981,316 38,399,839 10,194,992 10,194,992 48,594,831 European Equity Fund 3,573,879 343,469 3,917,348 2,572,381 2,572,381 6,489,729 Japan Equity Fund 12,191,771 9,563,820 21,755,591 1,149,395 1,149,395 22,904,986 North American Equity Fund 10,593,491 3,114,854 13,708,345 4,185,354 4,185,354 17,893,699 Asian Equity Fund 14,500,081 641,524 15,141,605 6,806,140 6,806,140 21,947,745 Greater China Equity Fund 14,412,940 1,483,156 15,896,096 11,675,922 11,675,922 27,572,018 Allianz Capital Stable Fund*
Allianz Growth Fund*
Allianz Stable Growth Fund*
Green Fund 5,008,066 1,557,502 6,565,568 2,280,445 2,280,445 8,846,013 Global Bond Fund 8,014,185 4,347,839 12,362,024 1,118,748 1,118,748 13,480,772 World Fund 1,941,158 291,031 2,232,189 938,415 938,415 3,170,604 Manager's Choice Fund 9,031,839 3,142,983 12,174,822 5,149,250 5,149,250 17,324,072 Fidelity Capital Stable Fund 6,239,312 6,239,312 1,091,941 1,091,941 7,331,253 Fidelity Stable Growth Fund 4,688,127 175,042 4,863,169 2,432,132 2,432,132 7,295,301 Fidelity Growth Fund 4,246,666 4,246,666 2,368,819 2,368,819 6,615,485 Asian Bond Fund 4,526,305 3,528,379 8,054,684 630,577 630,577 8,685,261 Eurasia Fund 776,195 59,911 836,106 399,291 399,291 1,235,397 Hong Kong and China Fund 17,520,898 17,520,898 1,376,564 1,376,564 18,897,462 American Fund 2,708,270 333,277 3,041,547 631,454 631,454 3,673,001 Age 65 Plus Fund 1,887,525 665,223 2,552,748 293,036 293,036 2,845,784 Core Accumulation Fund 2,991,527 1,965,875 4,957,402 1,016,610 1,016,610 5,974,012 China HK Dynamic Asset
Allocation Fund 593,495 593,495 513,836 513,836 1,107,331
Total 224,846,266 37,375,925 262,222,191 94,867,457 94,867,457 357 089,648
* Allianz Capital Stable Fund, Allianz Growth Fund and Allianz Stable Growth Fund ("the 3 Allianz Funds") had no investments and operations since 15th November 2018. MPFA had approved the termination of the 3 Allianz Funds to take effect on 13th March 2019.
154

3
(e)
AJA MPF - PRIME VALUE CHOICE
NOTES TO THE FINANCIAL STATEMENTS (CONTINUED) FOR THE YEAR ENDED 30TH NOVEMBER 2018
Financial risk management (continued)
Liquidity risk (continued)
Constituent funds As at 30th November 2017
Less than 7 days 7 days to 12 months
Amounts
Amounts payable on
payable on purchase of Accruals and
redemption investments Total other payables Total
HK$ HK$ HK$ HK$ HK$ Growth Portfolio 25,454,792 25,454,792 21,169,702 21,169,702
Balanced Portfolio 11.551,721 11,551,721 10,039,058 10,039,058
Capital Stable Portfolio 7,699,904 1,581,479 9,281,383 6,301,862 6,301,862
Guaranteed Portfolio 24,087,379 24,087,379
MPF Conservative Fund 44,727,643 44,727,643 2,552,510 2,552,510
Hong Kong Equity Fund 48,952,867 633,401 49,586,268 I 1,653,037 11,653,037
European Equity Fund 8,749,882 8,749,882 3,531,952 3,531,952
Japan Equity Fund 6,987,379 747,477 7,734,856 1,514,577 1,514,577
North American Equity Fund 13,839,440 1,371,789 15,211,229 4,493,213 4,493,213
Asian Equity Fund 16,602,438 1,190,574 17,793,012 9,219,183 9,219,183
Greater China Equity Fund 35,000,680 553,116 35,553,796 13,926,155 13,926,155
Allianz Capital Stable Fund 3,534,327 3,534,327 725,249 725,249
Allianz Growth Fund 6,362,758 6,362,758 1,905,670 1,905,670
Allianz Stable Growth Fund 3,860,223 3,860,223 1,378,629 1,378,629
Green Fund 5,681,321 2,714,304 8,395,625 2,306,181 2,306,181
Global Bond Fund 11,884,968 2,440,705 14,325,673 1,316,916 1,316,916
World Fund 1,996,919 2,103,949 4,100,868 1,326,305 1,326,305
Manager's Choice Fund 11,324,244 3,262,443 14,586,687 5,920,177 5,920,177
Fidelity Capital Stable Fund 2,662,966 1,619,423 4,282,389 635,884 635,884
Fidelity Stable Growth Fund 2,937,096 409,467 3,346,563 1,529,609 1,529,609
Fidelity Growth Fund 2,587,229 2,587,229 1,692,970 1,692,970
Asian Bond Fund 5,614,072 4,539,155 10,153,227 392,708 392,708
Eurasia Fund 917,660 279,077 1,196,737 494,753 494,753
Hong Kong and China Fund 10,899,971 4,914,385 15,814,356 1,793,088 1,793,088
American Fund 1,472,568 1,198,862 2,671,430 822,280 822,280
Age 65 Plus Fund 1,304,693 837,099 2,141,792 95,769 95,769
Core Accumulation Fund 2,715,606 114,586 2,830,192 682,093 682,093
China HK Dynamic Asset 1,183,859 1,183,859 287,105 287,105
Allocation Fund
Total 320,594,605 30,511,291 351,105,896 I 07,706,635 107,706,635
155
Contractual
cash outflows
HK$ 46,624,494
21,590,779
15,583,245
24,087,379
47,280,153
61,239,305
12,281,834
9,249,433
19,704,442
27,012,195
49,479,951
4,259,576
8,268,428
5,238,852
10,701,806
15,642,589
5,427,173
20,506,864
4,918,273
4,876,172
4,280,199
10,545,935
1,691,490
17,607,444
3,493,710
2,237,561
3,512,285
1,470,964
458,812,531

AIA MPF - PRIME VALUE CHOICE
NOTES TO THE FINANCIAL STATEMENTS (CONTINUED) FOR THE YEAR ENDED 30TH NOVEMBER 2018
3 Financial risk management ( continued)
(e) Liquidity risk (continued)
Units are redeemable on demand at the members' option.
As at 30th November 2018 and 2017, no individual member held more than I 0% of each constituent fund's units.
The Scheme and its constituent funds manage their liquidity risk by investing predominantly in investments that are expected to be able to realise within I month or less. The following table illustrates the expected liquidity of non-derivatives assets held:
Scheme
As at 30th November 2018 Total assets
As at 30th November 2017 Total assets
Constituent funds
Growth Portfolio Balanced Portfolio Capital Stable Portfolio Guaranteed Portfolio MPF Conservative Fund Hong Kong Equity Fund European Equity Fund Japan Equity Fund North American Equity Fund Asian Equity Fund Greater China Equity Fund Allianz Capital Stable Fund* Allianz Growth Fund*
Allianz Stable Growth Fund* Green Fund Global Bond Fund World Fund Manager's Choice Fund Fidelity Capital Stable Fund Fidelity Stable Growth Fund Fidelity Growth Fund Asian Bond Fund Eurasia Fund Hong Kong and China Fund American Fund Age 65 Plus Fund Core Accumulation Fund
Within 1 month HK$
77,385,246,884
78.464,019.172
Over 1 month HK$
20,105,894
18.358.417
As at 30th November 2018 7 days to 12
Less than 7 days months HK$ HK$
10,925,319,910 5,440,219,858 3,494,363,475 9,186,935,616 5,384,214,645 6,028,028,296 1,453,536,908
683,466,584 . 2,514,492,029
3,969,772,664 6,827,184,683
1,859,475,052 1,529,498,948 1,336,727,050 4,321,352,386
971,223,096 2,082,941,410 2,133,448,928
970,790,493 340,304,025
2,200,830,869 893,259,700 444,247,863
1,646,321,414
17,940
8,589 120,132 25,168
China HK Dynamic Asset Allocation Fund --~5'--'4"'5"',3-'-'99'-'-,0"-'3'-"6 _____ _ 77,183,354,938 171.829
As at 30th November 2017 7 days to 12
Less than 7 days months HK$ HK$
12,366,074,218 5,840,993,660 3,648,396,914 8,228,550,591 4,298,605,567 6,792,666,492 1,737,972,867
756,759,605 2,310,509,870 4,465,592,227 8,057,757,407
411,829,670 1,107,177,707
798,644,501 1,838,310,681 1,315,878,989 1,264,661,849 4,618,756,000
455,630,375 1,201,586,153 l, 190,201,845
771,694,674 332,107,614
2,201,774,009 733,045,215 218,445,766
1,050,515,670 298,139,892
78,312,280,028
19,315
13,323 144,184
12,608
189,430
* Allianz Capital Stable Fm1d, Allianz Growth Fm1d and Allianz Stable Growth Fm1d ("the 3 Allianz Fm1ds") had no investments and operations since 15th November 2018. MPFA had approved the termination of the 3 Allianz Fm1ds to take effect on 13th March 2019.
156

AIA MPF - PRIME VALUE CHOICE
NOTES TO THE FINANCIAL STATEMENTS (CONTINUED) FOR THE YEAR ENDED 30TH NOVEMBER 2018
3 Financial risk management (continued)
(e) Liquidity risk (continued)
The table below analyses the constituent funds' derivative financial instruments in a net loss position for which the contractual maturities are considered to be essential to an understanding of the timing of cash flows based on the constituent funds' investment strategy.
Net settled forward foreign exchange contracts
As at 30th November 2018 Growth Portfolio Balanced Portfolio Capital Stable Portfolio European Equity Fund Japan Equity Fund North American Equity Fund Asian Equity Fund Global Bond Fund World Fund Manager's Choice Fund Eurasia Fund American Fund
As at 30th November 2017 Growth Portfolio Balanced Portfolio Capital Stable Portfolio European Equity Fund Japan Equity Fund North American Equity Fund Asian Equity Fund Global Bond Fund World Fund Manager's Choice Fund Eurasia Fund American Fund
157
1-3 months HK$
81,171 114,332 57,967
156,202 69,081
224,827 415,757 141,346 121,596 81,370 12,286 80,339
1,146,139 2,720,167 1,754,368
332,269 145,260 379,531 879,887 219,695 210,576
86,891 21,170
121,137

AIA MPF - PRIME VALUE CHOICE
NOTES TO THE FINANCIAL STATEMENTS (CONTINUED) FOR THE YEAR ENDED 30TH NOVEMBER 2018
3 Financial risk management ( continued)
(I) Currency risk
Currency risk is the risk that the value of assets and liabilities will fluctuate due to changes in foreign exchange rates.
As at 30th November 2018 and 2017, the Scheme and its constituent funds had assets and liabilities mainly denominated in Hong Kong dollar, the functional and presentation currency, and United States dollar. Since Hong Kong dollar is pegged to United States dollar, the currency risk is considered minimal. In addition, the constituent funds have entered into forward foreign exchange contracts designed to hedge some or all of the exposure to United States dollar. Please refer to note 9 for details on forward foreign exchange contracts.
(g) Fair value estimation
The Scheme and its constituent funds classify fair value measurements using a fair value hierarchy that reflects the significance of the inputs used in making the measurements. The fair value hierarchy has the following levels:
• Quoted prices ( unadjusted) in active markets for identical assets or liabilities (level 1 ). • Inputs other than quoted prices included within level 1 that are observable for the a.sset or
liability, either directly (that is, as prices) or indirectly (that is, derived from prices) (level 2). • Inputs for the asset or liability that are not based on observable market data (that is, unobservable
inputs) (level 3).
The level in the fair value hierarchy within which the fair value measurement is categorised in its entirety is determined on the· basis of the lowest level input that is significant to the fair value measurement in its entirety. For this purpose, the significance of an input is assessed against the fair value measurement in its entirety. If a fair value measurement uses observable inputs that require significant adjustment based on unobservable inputs, that measurement is a level 3 measurement. Assessing the significance of a particular input to the fair value measurement in its entirety requires judgment, considering factors specific to the asset or liability.
The determination of what constitutes "observable" requires significant judgment by the Scheme and its constituent funds. The Scheme and its constituent funds consider observable data to be such market data that is readily available, regularly distributed or updated, reliable and verifiable, not proprietary, and provided by independent sources that are actively involved in the relevant market.
158

AIA MPF - PRIME VALUE CHOICE
NOTES TO THE FINANCIAL STATEMENTS (CONTINUED) FOR THE YEAR ENDED 30TH NOVEMBER 2018
3 Financial risk management (continued)
(g) Fair value estimation (continued) The following table analyses within the fair value hierarchy the financial assets of the Scheme and the financial assets and liabilities of its constituent funds measured at fair value at 30th November 2018 and 2017:
Scheme
As at 30th November 2018 Assets Financial assets held for trading: - Investment funds
As at 30th November 2017 Assets Financial assets held for trading: - Investment funds
Constituent fonds As at 30th November 2018
Assets Financial assets held for trading: Growth Portfolio Balanced Portfolio Capital Stable Portfolio Guaranteed Portfolio MPF Conservative Fund Hong Kong Equity Fund European Equity Fund Japan Equity Fund North American Equity Fund Asian Equity Fund Greater China Equity Fund Allianz Capital Stable Fund* Allianz Growth Fund * Allianz Stable Growth Fund*
Green Fund
Global Bond Fund World Fund Manager's Choice Fund
Fidelity Capital Stable Fund
Fidelity Stable Growth Fund Fidelity Growth Fund Asian Bond Fund Eurasia Fund Hong Kong and China Fund
American Fund Age 65 Plus Fund Core Accumulation Fw,d China HK Dynamic Asset Allocation Fund Total
Level 2 HK$
Total HK$
76,824,880,845 76,824,880,845
77,845,639,837 77,845,639,837
Investment funds HK$
I 0,530,985,402 5,102,134,197 3,109,760,235 9,168,614,948 5,358,106,261 5,994,590,747 1,449,718,959
662,964,708 2,499,986,790 3,954,418,559 6,813,678,268
1,852,870,067
1,517,266,766
1,334,0 I 5,963 4,183,082,705
966,407,721
2,078,453,875 2,129,698,307
961,947,625 337,455,029
2,138,147,608 889,021,497 441,799,804
1,638,954,245 543,234,678
75,657,314,964
Level 2 Derivative financial
instruments Total HK$ HK$
I 0,530,985,402 5,102,134,197 3,109,760,235 9,168,614,948 5,358,106,261 5,994,590,747
132 1,449,719,091 1,321 662,966,029
2,499,986,790 1,071 3,954,419,630
6,813,678,268
1,852,870,067
1,517,266,766 1,334,015,963 4,183,082,705
966,407,721
2,078,453,875 2,129,698,307
961,947,625 337,455,029
2,138,147,608 889,021,497 441,799,804
1,638,954,245 543,234,678
2,524 75,657,317,488
* Allianz Capital Stable Fund, Allianz Growth Fund and Allianz Stable Growth Fund ("the 3 Allianz Funds") had no investments and operations since 15th November 2018. MPFA had approved the termination of the 3 Allianz Funds to take effect on 13th March 2019.
159

AIA MPF - PRIME VALUE CHOICE
NOTES TO THE FINANCIAL STATEMENTS (CONTINUED) FOR THE YEAR ENDED 30TH NOVEMBER 2018
3 Financial risk management ( continued)
(g) Fair value estimation (continued)
Constituent funds (continued)
As at 30th November 2018
Liabilities Financial liabilities held for trading: Growth Portfolio Balanced Portfolio Capital Stable Portfolio European Equity Fund Japan Equity Fund North American Equity Fund Asian Equity Fund Global Bond Fund World Fund Manager's Choice Fund Eurasia Fund American Fund Total
As at 30th November 2017
Assets Financial assets held for trading: Growth Portfolio Balanced Portfolio Capital Stable Portfolio Guaranteed Portfolio rvlPF Conservative Fund Hong Kong Equity Fund European Equity Fund Japan Equity Fund North American Equity Fund Asian Equity Fund Greater China Equity Fund
Allianz Capital Stable Fund Allianz Growth Fund
Allianz Stable Growth Fund Green Fund Global Bond Fund World Fund Manager's Choice Fund Fidelity Capital Stable Fund Fidelity Stable Growth Fund Fidelity Growth Fund Asian Bond Fund Eurasia Fund Hong Kong and China Fund American Fund Age 65 Plus Fund Core Accumulation Fund China HK Dynamic Asset Allocation Fund Total
160
Level 2 Derivative financial
instruments HK$
81.171 114,332
57,967 156,334 70,402
224,827 416,828
141,346 121,596
81,370 12,286 80,339
1,558,798
Level 2 Derivative financial
Investment funds instruments HK$ HK$
12,327,767,383 5,506,146,912 3,296,920,687 8,205,078,039 4,252,337,870 6,736,249,763 1,727,869,690 698
750,128,734 809 2,295,704,110
4,450,838,370 2,296 8,026,981,823
408,303,580 1,099,968,179
794,286,225 1,827,780,805 1,299,403,744 1,255,558,954 4,452,023,893
451,589,480 1,195,891,799 1,185,279,278
760,909,171 328,368,177
2,140,019,767 727,201,669 215,319,489
1043,110,801 289,459,669
77,050,498,061 3,803
Total HK$
81,171
114,332
57,967 156.334 70,402
224,827
416,828 141,346
121,596 81,370
12,286 80,339
1,558,798
Total HK$
12,327,767,383 5,506,146,912 3,296,920,687 8,205,078,039 4,252,337,870 6,736,249,763 1,727,870,388
750,129,543 2,295,704,110 4,450,840,666 8,026,981,823
408,303,580 1,099,968,179
794,286,225 1,827,780,805 1,299,403,744 1,255,558,954 4,452,023,893
451,589,480 1,195,891,799 1,185,279,278
760,909,171 328,368,177
2,140,019,767 727,201,669 215,319,489
1043,110,801 289 459,669
77,050,501,864

AIA MPF - PRIME VALUE CHOICE
NOTES TO THE FINANCIAL STATEMENTS (CONTINUED) FOR THE YEAR ENDED 30TH NOVEMBER 2018
3 Financial risk management (continued)
(g) Fair value estimation (continued)
Constituent funds (continued)
As at 30th November 2017
Liabilities Financial liabilities held for trading: Growth Portfolio Balanced Portfolio Capital Stable Portfolio European Equity Fund Japan Equity Fund North American Equity Fund Asian Equity Fund Global Bond Fund World Fund Manager's Choice Fund Eurasia Fund American Fund Total
Level 2 Derivative financial
instruments HK$
1,146,139
2,720,167 1,754,368
332,967 146,069 379,531 882,183 219,695
210,576 86,891 21,170
121,137
8,020,893
Total HK$
1,146,139 2,720,167 1,754,368
332,967 146,069 379,531
882,183 219,695 210,576
86,891 21,170
121,137
8,020 893
The investments held by the Scheme and its constituent funds are not traded in active markets and are valued based on quoted prices supported by observable inputs, and are therefore classified within level 2. The other financial assets and financial liabilities held by the Scheme and its constituent funds are carried at value that reflects a reasonable approximation of their fair value.
There has been no transfers between levels for the year ended 30th November 2018 and the year/period ended 30th November 2017.
(h) Capital risk management
The capital of the constituent funds is represented by the units in the constituent funds, and shown as net assets attributable to members in the statement of net assets. The amount of net assets attributable .to members for each constituent fund can change significantly on a daily basis as the constituent funds are subject to daily subscriptions and redemptions at the discretion of members. Subscriptions and redemptions of units during the year are shown in the statement of changes in net assets attributable to members. The constituent funds' objective when managing capital is to safeguard the constituent funds' ability to continue as a going concern in order to provide retirement benefits to members. In order to achieve the investment objectives, the constituent funds endeavour to invest their capital in accorda9ce with the investment policies as outlined in note 3(a), whilst maintaining sufficient liquidity to meet redemption requests. Such liquidity is augmented by the holding of liquid investments.
The Trustee and the Investment Managers monitor capital on the basis of the value of net assets attributable to members.
161

AIA MPF - PRIME VALUE CHOICE
NOTES TO THE FINANCIAL STATEMENTS (CONTINUED) FOR THE YEM ENDED 30TH NOVEMBER 2018
4 Net gains/(losses) on investments and derivative financial instruments
Growth Portfolio HK$
Net unrealised gains/(losses) on investments (1,829,439,909)
Net realised gains/(losses) on sales of investments 1,161,429,090
Net unrealised gains/(losses) on derivative financial instruments 1,064,968
Net realised gains/(losses) on derivative financial instruments (3,753,141)
Net gains/(losses) on investments and derivative financial instruments (670,698,992)
European Equity Fund
HK$
Net unrealised gains/(losses) on investments (217.103,717)
_Net realised gains/(losses) on sales of investments 48,933,159
Net unrealised gains/(losses) on derivative financial instruments 176,067
Net realised gains/(losses) on derivative financial instruments (7,842,235)
Net gains/(losses) on investments and derivative financial instruments (175,836,726)
Balanced Portfolio
HK$
(686,356,763)
431,195,953
2,605,835
(7,874,128)
(260,429,103)
Japan Equity Fund
HK$
(] 18,453,107)
54,781,374
76,179
(3,492,303)
(67,087,857)
2018 MPF
Capital Stable Guaranteed Conservative Hong Kong Portfolio Portfolio Fund Equity Fund
HK$ HK$ HK$ HK$
(342,860,869) 56,498.351 (1.264,551,224)
230,232,751 20,140,062 862,240,833
1,696,401
(4,725,772)
(115,657,489) 76,638,413 (402,310,391)
2018 North American Asian Greater China Allianz Capital
Equity Fund Equity Fund Equity Fund Sable Fund (Note i)
HK$ HK$ HK$ HK$ (Note i)
( 12.060.536) (370,273,555) ( 1,568.133,378)
101,474,516 129,213,031 934.6 I 5.896 (19,503,418)
154,704 464,130
(9,343,970) (20,454,082)
80,224,714 (261,050,476) (633,517,482) (19,503,418)
Note i: Allianz Capital Stable Fund, Allianz Growth Fund and Allianz Stable Growth Fund ("the 3 Allianz Funds'') had no investments and operations since 15th November 2018. MPFA had approved the termination of the 3 Allianz Funds to take effect on 13th March 2019.
162

AJA MPF - PRIME VALUE CHOICE
NOTES TO THE FINANCIAL STATEMENTS (CONTINUED) FOR THE YEAR ENDED 30TH NOVEMBER 2018
4 Net gains/(losses) on investments and derivative financial instruments (continued)
Net unrealised gains/(losses) on investments
Net realised gains/(losses) on sales of investments
Net unrealised gains/(losses) on derivative financial instruments
Net realised gains/(losses) on derivative financial instruments
Allianz Growth
Fund (Note i)
HK$
(92,586,478)
Allianz Stable Growth Fund
(Note i) HK$
(47,492,193)
Green Fund
HK$
(69,318,606)
39,592,757
2018
Global Bond Fund
HK$
(61,160,832)
3,897,775
78,349
(5,657,065)
World Fund
HK$
Manager's Choice
Fund
HK$
(53,748,556) (602,587,833)
31,465,161
88,980
(5,268,525)
365,736,614
5,521
(3,141,986)
Fidelity Capital Stable
Fund
HK$
(18,492,160)
5,057,670
Net losses on investments and derivative financial instruments (92,586,478) (47,492,193) (29,725,849) (62,841,773) (27,462,940) (239,987,684) (13,434,490)
Net unrealised gains/(losses) on investments
Net realised gains/(losses) on sales of investments
Net unrealised gains/(losses) on derivative financial instruments
Net realised gains/(losses) on derivative financial instruments
Net gains/(losses) on investments and derivative financial instruments
Fidelity Stable Growth Fund
HK$
(50,056,282)
6,489,722
(43,566,560)
Fidelity Growth Fund HK$
(75,492,832)
16,795,929
(58,696,903)
2018
Asian Bond Fund
HK$
(6,797,588)
2,175,603
(4,621,985)
Eurasia Fund HK$
(40,485,450)
2,442,270
8,884
(535,955)
(38,570,251)
Hong Kong China Fund HK$
(265,712,427)
52,138,104
(213,574,323)
American Fund HK$
(8,863,012)
26,856,770
40,798
(3,077,928)
14,956,628
Note i: Allianz Capital Stable Fund, Allianz Growth Fund and Allianz Stable Growth Fund ("the 3 Allianz Funds") had no investments and operations since 15th November 2018. MPFA
had approved the termination of the 3 Allianz Funds to take effect on 13th March 2019.
163

AIA MPF - PRIME VALUE CHOICE
NOTES TO THE FINANCIAL STATEMENTS (CONTINUED) FOR THE YEAR ENDED 30TH NOVEMBE_B._2018
4 Net gains/(losses) on investments and derivative financial instruments (continued)
Net unrealised gains/(losses) on investments
Net realised gains/(losses) on sales of investments
Net unrealized gains/(losses) on derivative financial instruments
Net realised gains/(Iosses) on derivative financial instruments
Net losses on investments and derivative financial instruments
Age 65 Plus Fund HK$
(2,123,766)
125,845
(1,997,921)
164
2018
Core Accumulation Fund HK$
(19,443,070)
590,009
(18,853,061)
China HK Dynamic Asset Allocation
Fund HK$
(7,486,940)
297,479
(7,189,461)
Total HK$
(7,634,504,061)
4,368,336,284
6,460,816
75,167,090
(3,334,874,051)

AIA MPF - PRIME VALUE CHOICE
NOTES TO THE FINANCIAL STATEMENTS (CONTINUED) FOR THE YEAR ENDED 30TH NOVEMBER 2018
4 Net gains/(Iosses) on investments and derivative financial instruments (continued)
2017
MPF Balanced Capital Stable Guaranteed Conservative Hong Kong
Growth Portfolio Portfolio Portfolio Portfolio Fund Equity Fund HK$ HK$ HK$ HK$ HK$ HK$
Net unrea1ised gains/(losses) on investments 2,113,343,979 609,539,948 270,156,545 30,864,573 1,433,594,532
Net realised gains/(losses) on sales of investments 700,467,045 250,503,005 120,065,654 7,708,092 135,153,638
Net unrealised gains/(losses) on derivative financial instruments (1,146,139) (2,405,028) (1,517,881)
Net realised gains/(losses) on derivative financial instruments (3,524,743) (2,375,335)
Net gains on investments and derivative financial instruments 2,812,664,885 854,113,182 386,328,983 38,572,665 1,568,748,170
2017 European Japan North American Asian Greater China Allianz Capital
Equity Fund Equity Fund Equity Fund Equity Fund Equity Fund Sable Fund HK$ HK$ HK$ HK$ HK$ HK$
Net unrealised gains/(losses) on investments 407,886,291 159,355,927 405,319,569 953,225,013 1,789,355,230 41,273,644
Net realised gains/(losses) on sales of investments 31,107,108 21,389,529 37,949,269 75,582,125 132,059,760 3,666,916
Net unrealised gains/(losses) on derivative financial instruments (298,312) (130,324) (341,693) (790,802)
Net realised gains/(losses) on derivative financial instruments (8,817,293) (3,594,825) (9,982,462) (22,847,452)
Net gains on investments and derivative financial instruments 429,877,794 177,020,307 432,944,683 1,005,168,884 1,921,414,990 44,940,560
165

4
AIA MPF - PRIME VALUE CHOICE
NOTES TO THE FINANCIAL STATEMENTS (CONTINUED) FQRTHE YEAR ENDED 30TH N_OVEMBER 2018
Net gains/(Iosses) on investments and derivative financial instruments (continned)
2017 Allianz
Growth Allianz Stable Green Global Bond Fund Growth Fund Fund Fund HK$ HK$ HK$ HK$
Net unrea1ised gains/(losses) on investments 229,190,980 112,167,417 344,464,364 86,897,351
Net realised gains/(losses) on sales of investments 19,814,759 6,816,493 8,020,791 2,780,557
Net unrealised gains/(losses) on derivative financial instruments (196,748)
Net realised gains/(losses) on derivative financial instruments (5,739,204)
Net gains on investments and derivative financial instruments 249,005,739 118,983,910 352,485,155 83,741,956
2017
Fidelity Stable Fidelity Growth Asian Growth Fund Fund Bond Fund
HK$ HK$ HK$
Net unrealised gains/(losses) on investments 158,615,765 230,228,873 35,951.529
Net realised gains/(losses) on sales of investments 2,962,826 6,351,865 580,450
Net unrealised gains/(losses) on derivative financial instruments
Net realised gains/(losses) on derivative financial instruments
Net gains on investments and derivative financial instruments 161,578,591 236,580,738 36,531,979
166
Manager's Fidelity World Choice Capital Stable
Fund Fund Fund HK$ HK$ HK$
198,363,593 742,439,789 42,451,990
8,027,736 113,338,414 3,235,951
(191,069) (72,691)
(5,438,995) (2,294,428)
200,761,265 853,411,084 45,687,941
Hong Kong Eurasia China American
Fund Fund Fund HK$ HK$ HK$
55,046.732 397.479.662 IOl.845.893
552,550 I 1.409,942 4,641,321
(19,613) (112,057)
(527,655) (2,935,405)
55,052,014 408,889,604 103,439,752

AIA MPF - PRIME VALUE CHOICE
NOTES TO THE FINANCIAL STATEMENTS (CONTINUED) FOR THE YEAR ENDED 30TH N()VE:_M}3E_~ 2Q18
4 Net gains/(losses) on investments and derivative financial instruments (continued)
Net unrealised gains/(losses) on investments
Net realised gains/(losses) on sales of investments
Net unrealized gains/(losses) on derivative financial instruments
Net realised gains/(losses) on derivative financial instruments
Net gains on investments and derivative financial instruments
Age 65 Plus Fund HK$
3,916,576
95,219
4,011,795
167
2017
Core Accumulation Fund HK$
53,140,691
178,988
53,319,679
China HK Dynamic Asset Allocation
Fund HK$
9,056,647
12,013
9,068,660
Total HK$
11,015,173,I03
1,704,472,016
(7,222,357)
68,077,797
12,644,344,965

AJA MPF - PRIME VALUE CHOICE
NOTES TO THE FINANCIAL STATEMENTS (CONTINUED) FOR THE YEAR ENDED 30TH NOVEMBER 2018
5 Transactions with associates/related parties
Except as disclosed below and in note 8, the Scheme and its constituent funds did not have any transactions and balances with related parties including the Trustee, the Managers and their associates or delegates during the year ended 30th November 2018 and the year/period ended 30th November 2017. Associates or delegates of the Investment Manager are those as defined in the Ordinance established by the MPF A.
(a) Trustee and administration fees
The Trustee, AIA Company (Trustee) Limited, and the administrator, AIA International Limited (prior to 1st October 2018, AIA Pension and Trustee Co. Ltd.), are entitled to receive a fee in aggregate calculated on the net asset value of the respective constituent funds, other than the Guaranteed Portfolio, MPF Conservative Fund, Global Bond Fund, American Fund, World Fund, Asian Bond Fund, Eurasia Fund, Hong Kong and China Fund, Age 65 Plus Fund and Core Accumulation Fund, at an annual rate of 0.85%. The applicable annual rate for MPF Conservative Fund, Global Bond Fund, World Fund, Asian Bond Fund, Eurasia Fund, Hong Kong and China Fund and American Fund is 0.6%. The applicable annual rates for Age 65 Plus Fund and Core Accumulation Fund is 0.495%.
The trustee and administration fees for the MPF Conservative Fund are deducted in accordance with section 37 of the General Regulation.
For the Guaranteed Portfolio, the trustee and administration fees are charged on the underlying investment, which is an insurance policy.
The trustee and administration fees are calculated and accrued on each valuation day and payable monthly in arrears.
168

AIA MPF - PRIME VALUE CHOICE
NOTES TO THE FINANCIAL STATEMENTS (CONTINUED) FOR THE YEAR ENDED 30TH NOVEMBER 2018
5 Transactions with associates/related parties (continued)
(a) Trustee and administration fees (continued)
The trustee and administration fees for each constituent fund incurred during the year ended 30th November 2018 and the year/period ended 30th November 2017 are disclosed in the statement of comprehensive income of the constituent funds. The trustee and administration fees payable as at 30th November 2018 and 2017 were as follows:
Growth Portfolio Balanced Portfolio Capital Stable Portfolio Guaranteed Portfolio MPF Conservative Fund Hong Kong Equity Fund European Equity Fund Japan Equity Fund North American Equity Fund Asian Equity Fund Greater China Equity Fund Allianz Capital Stable Fund* Allianz Growth Fund* Allianz Stable Growth Fund * Green Fund Global Bond Fund World Fund Manager's Choice Fund Fidelity Capital Stable Fund Fidelity Stable Growth Fund Fidelity Growth Fund Asian Bond Fund Eurasia Fund Hong l(ong and China Fund American Fund Age 65 Plus Fund Core Accumulation Fund China HK Dynamic Asset Allocation Fund
Total
2018 HK$
7,579,122 3,777,026 2,427,554
2,620,278 4,126,300 1,033,807
456,802 1,719,118 2,756,329 4,704,542
1,283,043 745,060 652,093
2,991,174 529,8 JO
1,180,768 1,150,007
467,136 166,570
1,057,999 431,918 175,175 651,555 372,064
43,055,250
2017 HK$
8,601,143 4,055,189 2,530,790
2,085,585 4,739,257 1,199,587
517,845 1,557,035 3,154,441 5,674,133
284,428 767,090 551,657
1,248,886 629,238 612,415
3,191,687 308,286 822,268 821,728 367,061 160,779
1,075,699 352,536
83,842 411,293 198,349
46,002,247
* Allianz Capital Stable Fund, Allianz Growth Fund and Allianz Stable Growth Fund ("the 3 AIJianz Funds") had no investments and operations since 15th November 2018. MPFA had approved the termination of the 3 Allianz Funds to take effect on 13th March 2019.
(b) Investment management fees
The Investment Managers, PineBridge Investments Hong Kong Limited, JF Asset Management Limited, Allianz Global Investors Asia Pacific Limited, Amundi Hong Kong Limited and FIL Investment Management (Hong Kong) Limited are entitled to receive a fee calculated on the net asset value of the respective constituent funds, other than the Guaranteed Portfolio, MPF Conservative Fund, Fidelity Stable Growth Fund, Green Fund, Global Bond Fund, World Fund, Manager's Choice Fund, Asian Bond Fund, Eurasia Fund, Hong Kong and China Fund, American Fund, Age 65 Plus Fund, Core Accumulation Fund and China HK Dynamic Asset Allocation Fund, at an annual rate of 0.9%. The applicable annual rate for the Guaranteed Portfolio is 0.65%. The applicable annual rate for the MPF Conservative Fund is 0.36%. The applicable annual rate for the Global Bond Fund is 0.30%. The applicable annual rate for the World Fund is 0.14%. The applicable annual rate for the Asian Bond Fund is between 0.05% and 0.08%.
169

AIA MPF - PRIME VALUE CHOICE
NOTES TO THE FINANCIAL STATEMENTS (CONTINUED) FOR THE YEAR ENDED 30TH NOVEMBER 2018
5 Transactions with associates/related parties (continued)
(b) Investment management fees ( continued)
The applicable annual rate for the Eurasia Fund is 0.09%. The applicable annual rate for the Hong Kong and China Fund is 0. 18%. The applicable annual rate for the American Fund is 0.22%. The applicable annual rate for the Manager's Choice Fund is between 0.65% and 0.69%. The applicable annual rate for the Fidelity Stable Growth Fund is between 0.69% and 0.90%. The applicable annual rate for the Green Fund is between 0.62% and 0.66%.
The investment management fees for the MPF Conservative Fund are deducted in accordance with section 37 of the General Regulation.
For the Guaranteed Portfolio, the investment management fees are charged on the underlying investment, which is an insurance policy.
No investment management fees for Age 65 Plus Fund, Core Accumulation Fund and China HK Dynamic Asset Allocation Fund.
The fees are calculated and accrued on each valuation day and payable monthly in arrears.
170
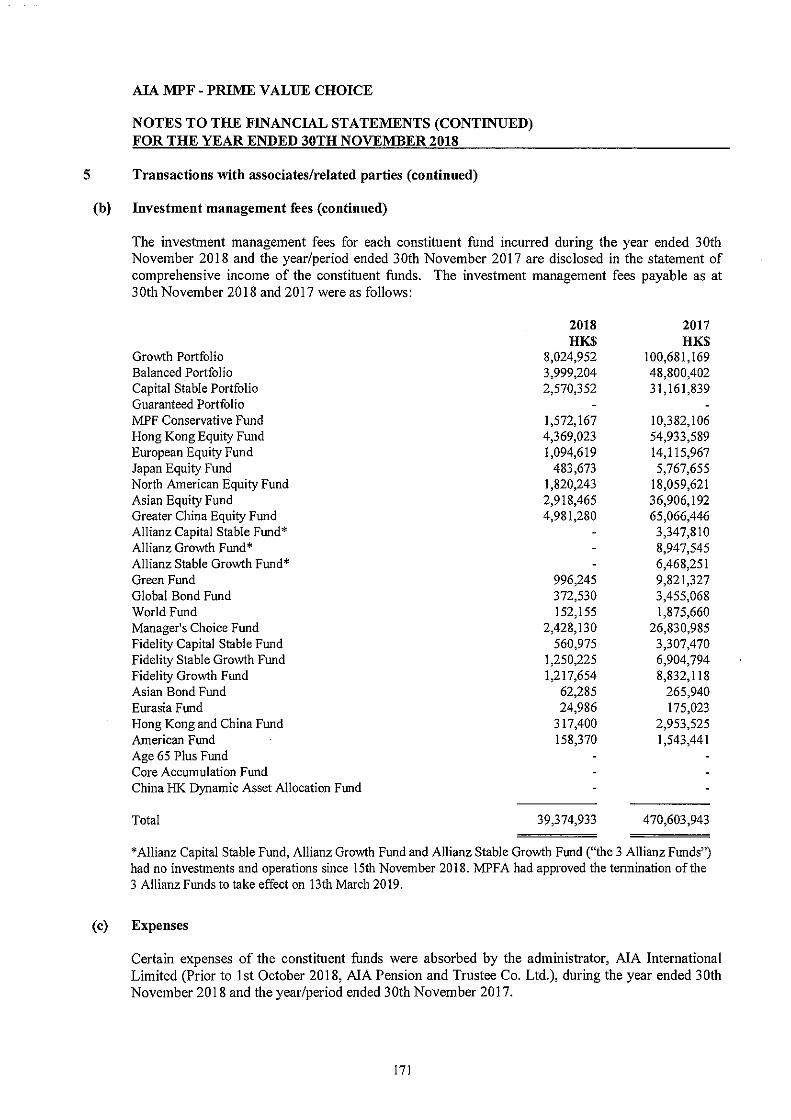
AIA MPF - PRIME VALUE CHOICE
NOTES TO THE FINANCIAL STATEMENTS (CONTINUED) FOR THE YEAR ENDED 30TH NOVEMBER 2018
5 Transactions with associates/related parties (continued)
(b} Investment management fees (continued)
The investment management fees for each constituent fund incurred during the year ended 30th November 2018 and the year/period ended 30th November 2017 are disclosed in the statement of comprehensive income of the constituent funds. The investment management fees payable as at 30th November 2018 and 2017 were as follows:
Growth Portfolio Balanced Portfolio Capital Stable Portfolio Guaranteed Portfolio MPF Conservative Fund Hong Kong Equity Fund European Equity Fund Japan Equity Fund North American Equity Fund Asian Equity Fund Greater China Equity Fund Allianz Capital Stable Fund* Allianz Growth Fund* Allianz Stable Growth Fund* Green Fund Global Bond Fund World Fund Manager's Choice Fund Fidelity Capital Stable Fund Fidelity Stable Growth Fund Fidelity Growth Fund Asian Bond Fund Eurasia Fund Hong Kong and China Fund American Fund Age 65 Plus Fund Core Accumulation Fund China HK Dynamic Asset Allocation Fund
Total
2018 HK$
8,024,952 3,999,204 2,570,352
1,572,167 4,369,023 1,094,619
483,673 1,820,243 2,918,465 4,981,280
996,245 372,530 152,155
2,428,130 560,975
1,250,225 1,217,654
62,285 24,986
3 I 7,400 158,370
39,374,933
2017 HK$
100,681,169 48,800,402 31,161,839
10,382,106 54,933,589 14,115,967 5,767,655
18,059,621 36,906,192 65,066,446 3,347,810 8,947,545 6,468,251 9,821,327 3,455,068 1,875,660
26,830,985 3,307,470 6,904,794 8,832,118
265,940 175,023
2,953,525 1,543,44 I
470,603,943
* Allianz Capital Stable Fund, Allianz Growth Fund and Allianz Stable Growth Fund ("the 3 Allianz Funds") had no investments and operations since 15th November 2018. MPFA had approved the termination of the 3 Allianz Funds to take effect on 13th March 2019.
(c) Expenses
Certain expenses of the constituent funds were absorbed by the administrator, AIA International Limited (Prior to ]st October 2018, AIA Pension and Trustee Co. Ltd.), during the year ended 30th November 2018 and the year/period ended 30th November 2017.
171

AIA MPF - PRIME VALUE CHOICE
NOTES TO THE FINANCIAL STATEMENTS (CONTINUED) FOR THE YEAR ENDED 30TH NOVEMBER 2018
6 Contributions
Mandatory contributions for both employers and employee/self-employed members are 5% of the employee/self-employed members' relevant income, subject to the minimum and maximum relevant income levels as described below:
Each employee member with monthly relevant income of HK$7,100 or more; and self-employed member with monthly relevant income of HK$7, I 00 or more or with yearly relevant income of HK$85,200 would be required to pay mandatory contributions up to the maximum monthly relevant income ofHK$30,000 or yearly relevant income ofHK$360,000.
Any contributions made to the Scheme· by the employers or employee/self-employed members in excess of their mandatory contributions are voluntary contributions.
7 Benefits
Members will become entitled to benefits in respect of mandatory contributions to the Scheme in the circumstances set out in the MPF Ordinance. Currently, these circumstances include where the members (i) reach the age of 65; (ii) permanently cease employment, after reaching the age of 60; (iii) become totally incapacitated; (iv) permanently depart from Hong Kong; (v) die or (vi) have the right to _claim a small balance pursuant to the MPF Ordinance.
Members will become entitled to benefits in respect of voluntary contributions to the Scheme in circumstances set out in the Trust Deed and the relevant participation agreement. Benefits are paid to members via the Trustee on behalf of the Scheme.
172

8
AIA MPF - PRIME VALUE CHOICE
NOTES TO THE FINANCIAL STATEMENTS (CONTINUED) FOR THE YEAR ENDED 30TH NOVEMBER 2018
Investments
2018 2017 The Scheme HK$ HK$
Investments in constituent funds Growth Portfolio 10,889,775,526 12,318,303,585 Balanced Portfolio 5,421,845,215 5,816,682,714 Capital Stable Portfolio 3,478,213,462 3,631,059,301 Guaranteed Portfolio 9,165,932,635 8,204,463,212 MPF Conservative Fund 5,369,828,304 4,251,325,414 Hong Kong Equity Fund 5,979,433,465 6,731,427,187 European Equity Fund I ,446,890,977 1,725,358,764 Japan Equity Fund 660,492,517 747,364,912 North American Equity Fund 2,496,373,503 2,290,425,897 Asian Equity Fund 3,947,409,162 4,437,700,145 Greater China Equity Fund 6,799,612,665 8,008,277,456 Allianz Capital Stable Fund (Note i) 407,570,094 Allianz Growth Fund (Note i) 1,098,909,279 Allianz Stable Growth Fund (Note i) 793,405,649 Green Fund 1,850,629,039 1,827,608,875 Global Bond Fund 1,515,876,830 1,300,016,705 World Fund 1,333,452,790 1,259,043,415 Manager's Choice Fund 4,303,946,944 4,598,162,245 Fidelity Capital Stable Fund 963,891,843 450,712,102 Fidelity Stable Growth Fund 2,075,646,109 1,196,709,981 Fidelity Growth Fund 2,126,833,443 1,185,921,646 Asian Bond Fund 962,105,232 761,148,739 Eurasia Fund 339,064,931 330,408,277 Hong Kong and China Fund 2,182,053,539 2,184,310,749 American Fund 889,531,528 729,442,976 Age 65 Plus Fund 441,402,079 216,208,205 Core Accumulation Fund 1,640,347,402 1,047,003,385 China HK Dynamic Asset Allocation Fund 544,291,705 296,668,928
Investments at fair value 76,824,880,845 77,845,639,837
Investments at cost 71,886,577,999 66,170,157,401
Note i: Allianz Capital Stable Fund, Allianz Growth Fund and Allianz Stable Growth Fund ("the 3 Allianz Funds") had no investments and operations since 15th November 2018. MPFA had approved the termination of the 3 Allianz Funds to take effect on 13th March 2019.
173

AIA MPF - PRIME VALUE CHOICE
NOTES TO THE FINANCIAL STATEMENTS (CONTINUED) FOR THE YEAR ENDED 30TH NOVEMBER 2018
8 Investments ( continued)
Constituent funds
2018 2017 Fair Value % of Net Fair Value % of Net
HK$ Assets HK$ Assets Growth Portfolio Harbinger Japanese Equity Fund 217.473,332 2.00 1,018,019,088 8.26 JPMorgan SAR American Fund 999.653,395 9.18 920,459,6 II 7.47 JPMorgan SAR Asian Bond Fund 30,898.442 0.25 JPMorgan SAR Asian Fund 728,994,270 6.70 967,831,469 7.86 JPMorgan SAR European Fund 914,027,603 8.39 1.182,109,058 9.60 JPMorgan SAR Global Bond Fund 445,000,450 4.09 122,808.078 I.DO JPMorgan SAR Global Emerging Markets Fund 51,569,052 0.47 60,723,687 0.49 JPMorgan SAR Hong Kong Fund I .768,424,096 16.24 2,748,042,929 22.31 JPMorgan SAR Japan Fund 702,603,739 6.45 345,763,632 2.81 PineBridge Asian Bond Fund 1 91,761.386 0.74 PineBridge Asian Fund1 416,104,619 3.82 719,262,581 5.84 PineBridge Europe Equity Fund' 768,008.067 7.05 1,178,142,275 9.56 PineBridge Global Bond Fund' 288,569,805 2.65 124,082,813 1.01 PineBridge Hong Kong Equity Fund1 1,387,059,591 12.74 1,058,178,171 8.59 PineBridge Japan Equity Fund 1 546,115,774 5.02 343,637,306 2.79 PineBridge US Equity Fund' 1,297,381,609 11.91 I .416,046,857 I 1.50
I 0,530,985,402 96.71 I 2,327,767,383 100.08
Investments at cost 8,901,513, I 11 8,868,855,183
Balanced Portfolio Harbinger Japanese Equity Fund 36,750,130 0.68 285,055,270 4.90 JPMorgan SAR American Fund 469,977,483 8.67 245,165,581 4.21 JPMorgan SAR Asian Bond Fund 91,707,303 1.69 173,774,171 2.99 JPMorgan SAR Asian Fund 95,988,765 1.77 161,423,954 2.78 JPMorgan SAR European Fund 249,478,854 4.60 256,864,494 4.42 JPMorgan SAR Global Bond Fund 643,714,684 11.87 1,086,615,747 18.68 JPMorgan SAR Global Emerging Markets Fund 62,444,626 1.15 42,650,853 0.73 JPMorgan SAR Hong Kong Fund 625,886,098 11.54 651,571,301 11.20 JPMorgan SAR Japan Fund 131,187,850 2.42 162,253,713 2.79 PineBridge Asian Bond Fund1 152,544,787 2.81 402,231,780 6.91 PineBridge Asian Fund1 144,313,045 2.66 240,341.357 4.13 PineBridge Europe Equity Fund1 251,520,612 4.64 256,5 I 9,828 4.41 PineBridge Global Bond Fund1 1,493,301,486 27.54 587,956,001 I 0.11 PineBridge Hong Kong Equity Fund' 268,301,090 4.95 277,707.197 4.77 PineBridge Japan Equity Fund 1 159,147,688 2.94 174,799,442 3.01 PineBridge US Equity Fund1 225,869,696 4.17 501,216,223 8.62
5,102,134,197 94.10 5,506,146,912 94.66
Investments at cost 4,692,279,655 4.409,935,607
174

8
AIA MPF - PRIME VALUE CHOICE
NOTES TO THE FINANCIAL STATEMENTS (CONTINUED) FOR THE YEAR ENDED 30TH NOVEMBER 2018
Investments ( continned)
Constituent funds (continued)
2018 2017 Fair Value % of Net Fair Value % of Net
HK$ Assets HK$ Assets Capital Stable Portfolio Harbinger Japanese Equity Fund 14,088,748 0.41 131,770,969 3.63 JPMorgan SAR American Fund 181,247,449 5.21 110,548,993 3.05 JPMorgan SAR Asian Bond Fund 65,508,739 1.88 97,945,471 2.70 JPMorgan SAR Asian Fund 40,335,639 1.16 55,888,727 1.54 JPMorgan SAR European Fund 95,556,140 2.75 96,498,899 2.66 JPMorgan SAR Global Bond Fund 513,238,459 14.76 979,697,340 26.98 JPMorgan SAR Global Emerging Markets Fund 20,921,549 0.60 JPMorgan SAR HKD Bond Fund 63,421,338 1.82 62,653,524 1.73 JPMorgan SAR Hong Kong Fund 239,034,322 6.87 229,540,904 6.32 JPMorgan SAR Japan Fund 50,830,557 1.46 75,006,987 2.07 PineBridge Asian Bond Fund1 I 08,966,627 3.13 226,713,002 6.24 PineBridge Asian Fund1 60,655,160 1.75 83,163,956 2.29 PineBridge Europe Equity Fund1 96,336,189 2.77 96,378,897 2.65 PineBridge Global Bond Fund1 I, 190,524,903 34.23 530,102,275 14.60 PineBridge Hong Kong Dollar Fixed Income Fund1 II 7,853,625 3.39 I 16,362,678 3.20 PineBridge Hong Kong Equity Fund1 102,465,855 2.95 97,831,366 2.69 PineBridge Japan Equity Fund' 61,667,750 1.77 80,805,923 2.23 PineBridge US Equity Fund' 87,107,186 2.50 226,010,776 6.22
3,109,760,235 89.41 3,296,920,687 90.80
Investments at cost 2,925,902,461 2,770,202,044
2018 2017 Fair Value % of Net Fair Value % of Net
HK$ Assets HK$ Assets Guaranteed Portfolio
MPF Capital Guaranteed Plus Policy' 9,168,614,948 100.03 8,205,078,039 100.01
Investments at cost 8,328,023,181 7,377,572,060
The Guaranteed Portfolio invests in the MPF Capital Guaranteed Plus Policy (the "underlying fund"). The overall market exposures for the underlying fund were as follows:
Bonds Investment fund
175
% of investments of the underlying fund 2018 2017
4% 96%
100%
5% 95%
100%

AJA MPF - PRIME VALUE CHOICE
NOTES TO THE FINANCIAL STATEMENTS (CONTINUED) FOR THE YEAR ENDED 30TH NOVEMBER 2018
8 Investments ( continued)
Constituent funds (continued)
Guaranteed Portfolio (continued)
The following table shows the net market exposures of the underlying fund:
% of investments of the underlying fund
Asia ex Hong Kong Europe Hong Kong North America
l\1PF Conservative Fund PineBridge Hong Kong Dollar Money Market Fund1
Investments at cost
2018 Fair Value % of Net
HK$ Assets
5,358, I 06,261 99.78
5,161,578,418
2018 2017
68% 62% 7% 9%
18% 20% 7% 9%
100% !00%
2017 Fair Value % of Net
HK$ Assets
4,252,337,870 100.02
4,112,308,378
The MPF Conservative Fund invests in PineBridge Hong Kong Dollar Money Market Fund (the "underlying fund"). The overall market exposures for the underlying fund were as follows:
Certificates of deposits
Canada China Japan Macau South Korea
Hong Kong Equity Fund PineBridge Hong Kong Equity Fund1
JPMorgan SAR Hong Kong Fund
Investments at cost
2018 Fair Value
HK$
3,083,753,607 2,9!0,837,140
5,994,590,747
5,261,458,155
176
% of investments of the underlying fund 2018 2017
100% 100%
% of investments of the underlying fund 2018 2017
16% 84% 67%
5% 18% 10%
100% 100%
2017 % ofNet Fair Value % ofNet
Assets HK$ Assets
51.57 6,736,249,763 I00.07 48.68
100.25 6,736,249,763 I00.07
4,738,565,947

8
AIA MPF - PRIME VALUE CHOICE
NOTES TO THE FINANCIAL STATEMENTS (CONTINUED) FOR THE YEAR ENDED 30TH NOVEMBER 2018
Investments (continned)
Constitnent funds (continued)
2018 Fair Value % of Net
HK$ Assets European Equity Fund
JPMorgan SAR European Fund 1,449,718,959 100.20
Investments at cost 1,180,117,375
2017 Fair Value % of Net
HK$ Assets
l,7'27,869,690 100.15
1,241,164,389
The European Equity Fund invests in the JPMorgan SAR European Fund (the "underlying fund"). The overall market exposures for the underlying fund were as follows:
Listed equities
Belgium Denmark Finland France Germany Italy Netherlands Norway Spain Sweden Switzerland United Kingdom
177
% of investments of the underlying fund 2018 2017
100% 100%
% of investments of the underlying fund 2018 2017
2% 2% 3% 3% 3% 1%
14% 18% 12% 16% 3% 2% 9% 9% 3% 3% 6% 4% 4% 2%
16% 16% 25% 24%
100% 100%

8
AIA MPF - PRIME VALUE CHOICE
NOTES TO THE FINANCIAL STATEMENTS (CONTINUED) FOR THE YEAR ENDED 30TH NOVEMBER 2018
Investments (continued)
Constituent funds (continued)
2018 2017 Fair Value % of Net Fair Value % of Net
HK$ Assets HK$ Assets Japan Equity Fund
JPMorgan SAR Japan Fund 662,964,708 100.37 750.128,734 100.37
Investments at cost 549,242.253 517,953,172
The Japan Equity Fund invests in the JPMorgan SAR Japan Fund (the "underlying fund"). The overall market exposures for the underlying fund were as follows:
Listed equities
Japan
North American Equity Fund PineBridge US Equity Fund'
Investments at cost
% of investments of the underlying fund 2018 2017
100% 100%
% of investments of the underlying fund 2018 2017
100% 100%
2018 2017 Fair Value % of Net Fair Value % of Net
HK$ Assets HK$ Assets
2,499,986,790 100.14 2,295,704,110 100.23
1,721,451,836 1,505,108,620
The North American Equity Fund invests in the PineBridge US Equity Fund (the "underlying fund"). The overall market exposures for the underlying fund were as follows:
% of investments of the underlying fund 2018 2017
Listed equities 100% 100%
The following table shows the net market exposures of the underlying fund:
% of investments of the underlying fund 2018 2017
USA 100% 100%
178

AIA MPF - PRIME VALUE CHOICE
NOTES TO THE FINANCIAL STATEMENTS (CONTINUED) FOR THE YEAR ENDED 30TH NOVEMBER 2018
8 Investments (continued)
Constituent funds (continued)
2018 Fair Value % of Net
HK$ Assets Asian Equity Fund
JPMorgan SAR Asian Fund 3,954,418,559 100.18
Investments at cost 2,950,245,797
2017 Fair Value % of Net
HK$ Assets
4,450,838,370 100.30
3,076,392,053
The Asian Equity Fund invests in the JPMorgan SAR Asian Fund (the "underlying fund"). The overall market exposures for the underlying fund were as follows:
Listed equities
Australia Hong Kong India Indonesia Korea New Zealand Philippine Singapore Taiwan Thailand USA
Greater China Equity Fund PineBridge Greater China Equity Fund1
JPMorgan SAR Greater China Fund
Investments at cost
179
2018 Fair Value
HK$
3,905,433,427
2,908,244,841
6,813,678,268
5,879,355,393
% of investments of the underlying fund 2018 2017
100% 100%
% of investments of the underlying fund 2018 2017
31% 31% 1% 2%
18% 14% 2% 2%
22% 28% 2% 1%
1% 6% 4%
14% 15% 2% 1% 2% 1%
100% 100%
2017 % of Net Fair Value % of Net
Assets HK$ Assets
57.44 8,026,981,823 100.23
42.77
100.21 8,026,981,823 100.23
5,524,525,570

AIA MPF - PRIME VALUE CHOICE
NOTES TO THE FINANCIAL STATEMENTS (CONTINUED) FOR THE YEAR ENDED 30TH NOVEMBER 2018
8 Investments ( continued)
Constituent funds (continued)
Allianz Capital Stable Fund (Note i) Allianz Choice Capital Stable Fund (Class I)
Investments at cost
2018 Fair Value % of Net
HK$ Assets
N/A
2017 Fair Value % of Net
HK$ Assets
408,303,580 I 00.18
351,506,579
The Allianz Capital Stable Fund invests in the Allianz Choice Capital Stable Fund (Class I) (the "underlying fund"). The overall market exposures for the underlying fund were as follows:
Bonds Listed equities
% of investments of the underlying fund 2018 2017
60% 40%
100%
The following table shows the net market exposures of the underlying fund:
Asia ex Hong Kong ex Japan Europe Hong Kong Japan North America Others
% of investments of the underlying fund 2018 2017
26% 24% 20% 16% 13%
1%
100%
Note i: Allianz Capital Stable Fund, Allianz Growth Fund and Allianz Stable Growth Fund ("the 3 Allianz Funds") had no investments and operations since 15th November 2018. MPFA had approved the termination of the 3 Allianz Funds to take effect on 13th March 2019.
180

8
AIA MPF - PRIME VALUE CHOICE
NOTES TO THE FINANCIAL STATEMENTS (CONTINUED) FOR THE YEAR ENDED 30TH NOVEMBER 2018
Investments ( continued)
Constituent funds (continued) 2018
Fair Value % ofNet HK$ Assets
Allianz Growth Fund (Note i) Allianz Choice Growth Fund (Class I) NIA
Investments at cost
2017 Fair Value % of Net
HK$ Assets
1,099,968,179 JOO.IO
750,735,002
The Allianz Growth Fund invests in the Allianz Choice Growth Fund (Class I) (the "underlying fund"). The overall market exposures for the underlying fund were as follows:
Bonds Listed equities
% of investments of the underlying fund 2018 2017
1% 99%
100%
The following table shows the net market exposures of the underlying fund:
Asia ex Hong Kong ex Japan Europe Hong Kong Japan North America
% of investments of the underlying fund 2018 2017
11% 20% 36% 14% 19%
100%
Note i: Allianz Capital Stable Fund, Allianz Growth Fund and Allianz Stable Growth Fund ("the 3 Allianz Funds") had no investments and operations since 15th November 2018. MPFA had approved the termination of the 3 Allianz Funds to take effect on 13th March 2019.
181

AIA MPF - PRIME VALUE CHOICE
NOTES TO THE FINANCIAL STATEMENTS (CONTINUED) FOR THE YEAR ENDED 30TH NOVEMBER 2018
8 Investments ( continued)
Constituent funds ( continued)
Allianz Stable Growth Fund (Note i) Allianz Choice Stable Growth Fund (Class 0
Investments at cost
2018 Fair Value
HK$ % of Net
Assets
NIA
2017 Fair Value % of Net
HK$ Assets
794,286,225 100.11
625,703.313
The Allianz Stable Growth FW1d invests in the Allianz Choice Stable Growth FW1d (Class I) (the "W1derlying fund"), The overall market exposures for the W1derlying fund were as follows:
Bonds Listed equities
% of investments of the underlying fund 2018 2017
40% 60%
100%
The following table shows the net market exposures of the W1derlying fund:
Asia ex Hong Kong ex Japan Europe Hong Kong Japan North America Others
% of investments of the underlying fund 2018 2017
21% 22% 26% 15% 15%
1%
100%
Note i: Allianz Capital Stable Fund, Allianz Growth Fund and Allianz Stable Growth Fund ("'the 3 Allianz Funds") had no investments and operations since 15th November 2018. MPFA had approved the termination of the 3 Allianz Funds to take effect on 13th March 2019.
2018 2017 Fair Value % ofNet Fair Value % ofNet
HK$ Assets HK$ Assets Green Fund
Amundi HK-Green Planet Fund (Class S) 1,852,870,067 100.12 1.827,780,805 100.01
Investments at cost 1,482,187,713 1,387.779,845
182

AIA MPF - PRIME VALUE CHOICE
NOTES TO THE FINANCIAL STATEMENTS (CONTINUED) FOR THE YEAR ENDED 30TH NOVEMBER 2018
8 Investments (continued)
Constituent funds (continued)
Green Fund (continued)
The Green Fund invests in the Amundi HK-Green Planet Fund (Class S) (the "underlying fund"). The overall market exposures for the underlying fund were as follows:
% of investments of the underlying fund
Listed equities Money market instruments
2018 2017
98% 2%
100%
99% 1%
100%
The following table shows the net market exposures of the underlying fund:
Asia ex Hong Kong ex Japan Europe Hong Kong Japan North America Others
Global Bond Fund PineBridge Global Bond Fund 1
Investments at cost
2018 Fair Value
HK$
1,517,266,766
1,501,447,251
% of investments of the underlying fund 2018 2017
3% 3% 22% 23% 35% 36% 9% 9%
28% 29% 3%
100% 100%
2017 % of Net Fair Value % of Net
Assets HK$ Assets
100.09 1,299,403,744 99.95
1,222,423,397
The Global Bond Fund invests in the PineBridge Global Bond Fund (the "underlying fund"). The overall market exposures for the underlying fund were as follows:
% of investments of the underlying fund 2018 2017
Bonds 100% 100%
183

AIA MPF - PRIME VALUE CHOICE
NOTES TO THE FINANCIAL STATEMENTS (CONTINUED) FOR THE YEAR ENDED 30TH NOVEMBER 2018
8 Investments ( continued)
Constituent funds (continued)
Global Bond Fund ( continued)
The following table shows the net market exposures of the underlying fund:
% of investments of the underlying fund
Australia Canada Denmark European Monetary Union France Germany Italy Japan Mexico Netherlands Portugal South Africa Spain Supranational Sweden Switzerland United Kingdom United States of America
World Fund iShares Core S&P 500 ETF iShares Latin America 40 ETF iShares MSCI EAFE ETF
Investments at cost
2018 Fair Value
HK$
692,341,997 263,961,823 377,712,143
1,334,015,963
1,122,082,595
184
% of Net Assets
51.92 19.80 28.32
100.04
2018 2017
2% 1%
8% 4% 6% 9%
1% 2% 1% 5% 1%
5% 9%
46%
100%
2017 Fair Value
HK$
671,580,590 224,409,325 359,569,039
1,255,558,954
989,877,030
3% 4% 1%
13%
3% 1% 3%
5% 1% 1% 6%
10% 49%
100%
% of Net Assets
53.34 17.82 28.56
99.72

8
AIA MPF - PRIME VALUE CHOICE
NOTES TO THE FINANCIAL STATEMENTS (CONTINUED) FOR THE YEAR ENDED 30TH NOVEMBER 2018
Investments (continued)
Constituent funds (continued)
2018 2017 Fair Value % of Net Fair Value % of Net
HK$ Assets HK$ Assets Manager's Choice Fund Harbinger Japanese Equity Fund 40,986,519 0.95 336,440,052 7.32
JPMorgan SAR American Fund 511,348,578 11.88 292, I 08,243 6.35
JPMorgan SAR Asian Bond Fund 71,104,438 1.65 JPMorgan SAR Asian Fund 115,554,431 2.68 185,570,409 4.04
JPMorgan SAR European Fund 279,918,633 6.50 322,988,710 7.02 JPMorgan SAR Global Bond Fund 293,609,307 6.82 102,184,214 2.22
JPMorgan SAR Global Emerging Markets Fund 38,679,487 0.90 68,469,677 1.49 JPMorgan SAR Hong Kong Fund 705,364,314 16.39 832,117,734 18.10 JPMorgan SAR Japan Fund 145,940,550 3.39 186,910,457 4.06 PineBridge Asian Bond Fund1 118,273,831 2.75 316,332,941 6.88
PineBridge Asian Fund1 173,735,057 4.04 276,071,093 6.00 PineBridge Europe Equity Fund 1 282,205,714 6.56 322,688,196 7.02 PineBridge Global Bond Fund1 681,215,884 15.83 56,761,957 1.23
PineBridge Hong Kong Equity Fund1 302,370,900 7.03 354,703,821 7.71
PineBridge Japan Equity Fund1 177,022,840 4.11 198,667,351 4.32 PineBridge US Equity Fund 1 245,752,222 5.71 600,009,038 13.05
4,183,082,705 97.19 4,452,023,893 96.81
Investments at cost 3,955,887,296 3,622,240,651
2018 2017 Fair Value % of Net Fair Value % of Net
HK$ Assets HK$ Assets Fidelity Capital Stable Fund
Fidelity Global Investment Fund-Capital Stable Fund -Class B 966,407,721 100.26 451,589,480 100.19
Investments at cost 935,209,397 401,898,996
The Fidelity Capital Stable Fund invests in the Fidelity Global Investment Fund-Capital Stable Fund - Class B (the "underlying fund"). The overall market exposures for the underlying fund were as follows:
Bonds Listed equities
185
% of investments of the underlying fund 2018 2017
66% 34%
100%
64% 36%
100%

AIA MPF - PRIME VALUE CHOICE
NOTES TO THE FINANCIAL STATEMENTS (CONTINUED) FOR THE YEAR ENDED 30TH NOVEMBER 2018
8 Investments (continued)
Constituent funds (continued)
Fidelity Capital Stable Fund (continued) The following table shows the net market exposures of the underlying fund:
% of investments of the underlying fund
Asia Pacific Equities Europe Equities Other Bonds Hong Kong Dollar Bonds Hong Kong Equities Japan Equities United States Equities
Fidelity Stable Growth Fund Fidelity Global Investment Fund-Stable Growth Fund -
Class B
Investments at cost
Bonds Listed equities
2018 2017
4% 5% 7% 7%
58% 52% 7% 11%
11% 12% 5% 5% 8% 8%
100% 100%
2018 2017 Fair Value % of Net Fair Value % of Net
HK$ Assets HK$ Assets
2,078,453,875 100.14 1,195,891,799 99.93
1,940,763,612 1,008,145,254
% of investments of the underlying fund 2018 2017
46% 54%
100%
44% -56%
100%
The following table shows the net market exposures of the underlying fund:
Asia Pacific Equities Europe Equities Other Bonds Hong Kong Dollar Bonds Hong Kong Equities Japan Equities United States Equities
186
% of investments of the underlying fund 2018 2017
7% 8% 10% 11% 41% 36%
5% 6% 18% 19% 7% 8%
12% 12%
100% 100%

AIA MPF - PRIME VALUE CHOICE
NOTES TO THE FINANCIAL STATEMENTS (CONTINUED) FOR THE YEAR ENDED 30TH NOVEMBER 2018
8 Investments (continued)
Constituent funds (continued)
2018 Fair Value % of Net
HK$ Assets Fidelity Growth Fund
Fidelity Global Investment Fund-Growth Fund - Class B 2,129,698,307 100.13
Investments at cost 1,923,916,031
2017 Fair Value % of Net
HK$ Assets
1,185,279,278 99.95
904,004,170
The Fidelity Growth Fund invests in the Fidelity Global Investment Fund-Growth Fund - Class B (the "underlying fund"). The overall market exposures for the underlying fund were as follows:
Bonds Listed equities
% of investments of the underlying fund 2018 2017
6% 94%
100%
4% 96%
100%
The following table shows the net market exposures of the underlying fund:
Asia Pacific Equities Europe Equities Other Bonds Hong Kong Dollar Bonds Hong Kong Equities Japan Equities United States Equities
Asian Bond Fund JPMorgan SAR Asian Bond Fund
Investments at cost
% of investments of the underlying fund 2018 2017
12% 13% 18% 18%
5% 2% 1% 1%
31% 33% 13% 13% 20% 20%
100% 100%
2018 2017 Fair Value % of Net Fair Value % of Net
HK$ Assets HK$ Assets
961,947,625 99.98 760,909,171 99.97
936,529,002 728,692,960
The Asian Bond Fund invests in the JPMorgan SAR Asian Bond Fund (the "underlying fund"). The overall market exposures for the underlying fund were as follows:
% of investments of the underlying fund 2018 2017
Bonds 100% 100%
187
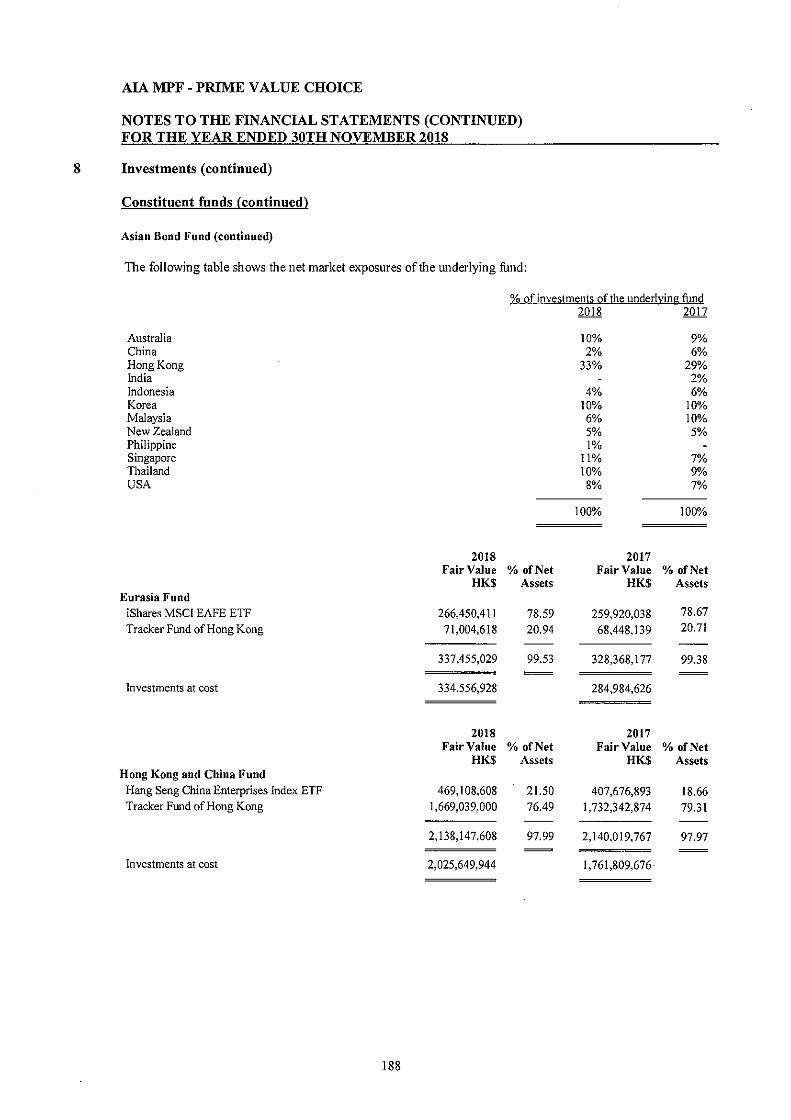
AIA MPF - PRIME VALUE CHOICE
NOTES TO THE FINANCIAL STATEMENTS (CONTINUED) FOR THE YEAR ENDED 30TH NOVEMBER 2018
8 Investments (continued)
Constituent funds (continued)
Asian Bond Fund (continued)
The following table shows the net market exposures of the underlying fund:
% of investments of the underly:ing fund
Australia China Hong Kong India Indonesia Korea Malaysia New Zealand Philippine Singapore Thailand USA
Eurasia Fund iShares MSC! EAFE ETF Tracker Fund of Hong Kong
Investments at cost
Hong Kong and China Fund Hang Seng China Enterprises Index ETF Tracker Fund of Hong Kong
Investments at cost
188
2018 Fair Value % of Net
HK$ Assets
266,450,411 78.59 71,004,618 20.94
337,455,029 99.53
334,556,928
2018 Fair Value % ofNet
HK$ Assets
469,108,608 21.50 1,669,039,000 76.49
2,138,147,608 97.99
2,025,649,944
2018 2017
10% 9% 2% 6%
33% 29% 2%
4% 6% 10% 10% 6% 10% 5% 5% 1%
11% 7% 10% 9%
8% 7%
100% 100%
2017 Fair Value % ofNet
HK$ Assets
259.920,038 78.67
68,448,139 20.71
328,368,177 99.38
284,984,626
2017 Fair Value % ofNet
HK$ Assets
407,676,893 18.66 1,732,342,874 79.31
2,140,019,767 97.97
1,761,809,676

AJA MPF - PRIME VALUE CHOICE
NOTES TO THE FINANCIAL STATEMENTS (CONTINUED) FOR THE YEAR ENDED 30TH NOVEMBER 2018
8 Investments (continued)
Constituent funds (continued)
American Fund i Shares Core S&P 500 ETF iShares Latin America 40 ETF
Investments at cost
Age 65 Plus Fund Vanguard Income Fund
Investments at cost
2018 Fair Value % of Net
HK$ Assets
717,501,830 80.66 171,519,667 19.28
889,021,497 99.94
762,679,001
2018 Fair Value % of Net
HK$ Assets
441,799,804 100.09
440,006,994
The Age 65 Plus Fund invests in the Vanguard Income Fund (the "underlying fund"). The overall market exposures for the underlying fund were as follows:
2017 Fair Value % of Net
HK$ Assets
603,895,325 82.79 123,306,344 16.90
727,201,669 99.69
591,996,161
2017 Fair Value % of Net
HK$ Assets
215,319,489 99.59
211,402,913
% of investments of the underlying fund
Bonds Listed equities
189
2018 2017
79% 21%
100%
78% 22%
100%

AIA MPF - PRIME VALUE CHOICE
NOTES TO THE FINANCIAL STATEMENTS (CONTINUED) FOR THE YEAR ENDED 30TH NOVEMBER 2018
8 Investments ( continned)
Constituent funds ( continned)
Age 65 Plus Fund (continued)
The following table shows the net market exposures of the underlying fund:
% of investments of the underlying fund
Australia Austria Belgium Canada Denmark Finland France Germany Hong Kong Ireland Italy Japan Mexico Netherlands South Africa Spain Sweden Switzerland United Kingdom United States
2018 Fair Value % of Net
HK$ Assets Core Accumulation Fund Vanguard Moderate Growth Fund 1,638,954,245 99.92
Investments at cost 1,605,256,624
The Age 65 Plus Fund invests in the Vanguard Income Fund (the "underlying fund"). The overall market exposures for the underlying fund were as follows:
2018 2017
2% 2% 1% 1% 2% 2% 2% 2% 1% 1% 1% 8% 8% 5% 6% 4% 5% 1% 1% 6% 7% 9% 9% 1% 1% 2% 2% 1% 1% 4% 4%
1% 1% 1% 6% 6%
43% 40%
l00% 100%
2017 Fair Value % of Net
HK$ Assets
1.043, 110,80 I 99.63
989,970,110
% of investments of the underlying fund
Bonds Listed equities
190
2018 2017
38% 62%
100%
37% 63%
100%

AIA MPF - PRIME VALUE CHOICE
NOTES TO THE FINANCIAL STATEMENTS FOR THE YEAR ENDED 30TH NOVEMBER 2018
8 Investments (continued)
Constituent funds (continued)
Core Accumulation Fund (continued)
The following table shows the net market exposures of the underlying fund:
Australia Austria Belgium Brazil Canada Cayman Islands China Denmark France Germany Hong Kong India Ireland Italy Japan Netherlands Singapore South Africa South Korea Spain Sweden Switzerland Taiwan United Kingdom United States
China HK Dynamic Asset Allocation Fund
Value Partners Asset Allocation Fund
Investments at cost
2018 Fair Value
HK$
543,234,678
541,664,971
% of investments of the underlj'.!ng fund 2018 2017
2% 2% 1%
1% 1% 1% 1% 3% 2% 1% 1% 1% 1% 1% 1% 5% 5% 4% 4% 4% 5% 1% 1% 1% 1% 3% 4% 9% 9% 2% 2%
1% 1% 1% 1% 1% 2% 3% 1% 1% 2% 2% 1% 1% 5% 6%
48% 43%
100% !00%
2017 % of Net Fair Value % of Net
Assets HK$ Assets
99.81 289,459,669 97.57
280,403,022
The China HK Dynamic Asset Allocation Fund invests in the Value Partners Asset Allocation Fund (the "underlying fund"). The overall market exposures for the underlying fund were as follows:
Bonds Listed equities
191
% of investments of the underlying fund 2018 2017
66% 34%
!00%
27% 73%
100%

AIA MPF - PRIME VALUE CHOICE
NOTES TO THE FINANCIAL STATEMENTS FOR THE YEAR ENDED 30TH NOVEMBER 2018
8 Investments ( continued)
Constituent funds (continued)
China HK Dynamic Asset Allocation Fund (continued)
The following table shows the net market exposures of the underlying fund:
China Hong Kong Singapore
% of investments of the underlying fund 2018 2017
6% 93%
1%
100%
9% 90%
1%
100%
1 The Trustee of the underlying funds is AIA Company (Trustee) Limited, the Trustee of the Scheme as at 30fu November 2018 and 2017.
2 The insurer of the policy is AIA Company Limited which is the intermediate holding company of the Trustee of the Scheme as at 30th November 2018 and 2017.
192

AIA MPF - PRIME VALUE CHOICE
NOTES TO THE FINANCIAL STATEMENTS (CONTINUED) FOR THE YEAR ENDED 30TH NOVEMBER 2018
9 Derivative financial instruments
Derivative financial instruments represent outstanding forward foreign exchange contracts. Forward foreign exchange contracts are entered into to manage exposure to fluctuations in foreign exchange rates. Outstanding forward foreign exchange contracts as at 30th November 2018 and 2017 were as follows:
As at 30th November 2018
Contract to deliver In exchange for Settlement Date Fair Value
HK$
Growth Portfolio USD 43.588,727 HKD 340,890,000 14th December 2018 (81,171)
Balanced Portfolio USD 83,944,714 HKD 656,540,000 14th December 2018 (114,332)
Capital Stable Portfolio USD 42,560,509 HKD 332,870,000 14th December 2018 (57,967)
European Equity Fund USD 75,123,395 HKD 586,278,000 28th February 2019 (156,209)
USD 14,146 HKD 110,368 28th February 2019 (60)
USD 17,604 HKD 137,387 28th February 2019 (33)
HKD 65,697 USD 8,412 28th February 20 I 9 (28)
HKD 93,917 USD 12,030 28th February 2019 (4)
(156,334)
HKD 95,912 USD 12,288 28th February 2019 10
HKD 134,508 USD 17,237 28th February 2019 48
HKD 167,270 USD 21,437 28th February 2019 74
132
Japan Equity Fund USD 33,095,513 HKD 258,284,000 28th February 2019 (68,818)
USD 319,760 HKD 2,496,543 28th February 2019 (591)
USD 170,480 HKD 1,329,985 28th February 2019 (833)
HKD 366,043 USD 46,871 28th February 2019 ( 155)
HKD 110,293 USD 14,128 28th February 2019 (5)
(70,402)
HKD 261,715 USD 33,530 28th February 2019 26
HKD 389,735 USD 49,940 28th February 2019 111
HKD 2,671,978 USD 342,437 28th February 2019 1,184
1,321
193

AIA MPF - PRIME VALUE CHOICE
NOTES TO THE FINANCIAL STATEMENTS (CONTINUED) FOR THE YEAR ENDED 30TH NOVEMBER 2018
9 Derivative financial instruments ( continued)
As at 30th November 2018 {continued)
Contract to deliver In exchange for Settlement Date Fair Value HK$
North American Equity Fund USO 107,790,421 HKO 841,218,000 28th February 2019 (224,136)
USO 19,676 HKO 153,562 28th February 2019 (36)
USO 120,069 HKO 936,637 28th February 2019 (655)
(224,827)
Asian Equity Fund USD 200,407,345 HKD 1,564,019,000 28th February 2019 (416,721)
USO 32,880 HKD 256,609 28th February 2019 (61)
HKO 108,214 USO 13,857 28th February 2019 (46)
HKD 6,038 USO 773 28th February 2019
(416,828)
HKO 274,103 USD 35,117 28th February 2019 27
HKD 185,988 USD 23,832 28th February 2019 53
HKD 2,215,566 USD 283,920 28th February 2019 794
HKD 445,233 USO 57,061 28th February 2019 197
1,071
Global Bond Fund USD 67,975,321 HKO 530,493,000 28th February 2019 (141,346)
World Fund USD 58,449,297 HKD 456,150,000 28th February 2019 (121,538)
USO 11,821 HKD 92,221 28th February 2019 (58)
(121,596)
Manager's Choice Fund USD 42,796,187 HKD 333,990,000 27th February 20 I 9 (81,370)
Eurasia Fund USD 5,903,488 HKD 46,072,000 28th February 2019 (12,276)
USD 1,817 HKD 14,171 28th February 2019 (IO)
(12,286)
American Fund USD 38,602,932 HKD 301,265,000 28th February 2019 (80,270)
USD 14,189 HKD 110,697 28th February 2019 (69)
(80,339)
194

AIA MPF - PRIME VALUE CHOICE
NOTES TO THE FINANCIAL STATEMENTS (CONTINUED) FOR THE YEAR ENDED 30TH NOVEMBER 2018
9 Derivative financial instruments ( continued)
Derivative financial instruments represent outstanding forward foreign exchange contracts. Forward foreign exchange contracts .are entered into to manage exposure to fluctuations in foreign exchange rates. Outstanding forward foreign exchange contracts as at 30th November 2018 and 2017 were as follows:
As at 30th November 2017
Contract to deliver In exchange for Settlement Date Fair Value
HK$
Growth Portfolio USD 27,936,420 HKD 217,000,000 15th December 2017 (1,146.139)
Balanced Portfolio USD 68,493,168 HKD 532,120,000 15th December 2017 (2,720,167)
Capital Stable Portfolio USD 44,174,567 HKD 343,190,000 15th December 2017 (1,754,368)
European Equity Fund USD 88,497.332 HKD 689,996,000 28th February 2018 (332,343)
USD 74,602 HKD 581.313 28th February 2018 (624)
(332,967)
HKD 532,131 USD 68,247 28th February 2018 236
HKD 774,961 USD 99,395 28th February 2018 373
HKD 92,660 USD 11,882 28th February 2018 28
HKD 27,504 USD 3,527 28th February 20 I 8 10
HKD 592,013 USD 75,900 28th February 2018 51
698
Japan Equity Fund USD 1,896 HKD 14,783 28th February 2018 (10)
USD 12,678 HKD 98,851 28th February 20 I 8 (48)
USD 38,852,863 HKD 302,928,000 28th February 2018 (145,908)
USD 2,975 1-IKD 23,192 28th February 2018 (13)
USD 35,368 HKD 275,798 28th February 2018 (90)
(146,069)
HKD 841,267 USD 107,936 28th February 20 I 8 693
HKD 328,359 USD 42,109 28th February 2018 116
809
195

AIA MPF - PRIME VALUE CHOICE
NOTES TO THE FINANCIAL STATEMENTS (CONTINUED) FOR THE YEAR ENDED 30TH NOVEMBER 2018
9 Derivative financial instruments ( continued)
As at 30th November 2017 /continued)
Contract to deliver
North American Equity Fund USD
Asian Equity Fund
Global Bond Fw,d
USD
USD
USD
USD
USD
HKD
HKD
HKD
HKD
USD
USD
USD
USD
31,617
100,950,262
61,584
234,838,652
30,387
30,699
1,098,889
1,349,360
1,318,938
835,400
116,058
174,061
57,815,129
158,420
In exchange for
HKD 246,464
HKD 787,089,000
HKD 480,126
HKD 1.830.990,000
HKD 236,904
HKD 239,325
USD 140,936
USD 173,066
USD 169,222
USD 107,104
HKD 904,723
HKD 1,357,117
HKD 450,773,000
HKD I ,234,437
196
Settlement Date
28th February 2018
28th February 2018
28th February 2018
28th February 2018
28th February 2018
28th February 2018
28th February 20 I 8
28th February 2018
28th February 2018
28th February 2018
28th February 2018
28th February 2018
28th February 2018
28th February 2018
Fair Value HK$
(162)
(379,109)
(260)
(379,531)
(881,913)
(128)
(142)
(882,183)
487
650
1,087
72
2,296
(596)
(654)
(217,119)
(1,326)
(219,695)

AIA MPF - PRIME VALUE CHOICE
NOTES TO THE FINANCIAL STATEMENTS (CONTINUED) FOR THE YEAR ENDED 30TH NOVEMBER 2018
9 Derivative financial instruments (continued)
As at 30th November 2017 (continued)
Contract to deliver In exChange for Settlement Date Fair Value
HK$
World Fund USD 56,036,836 HKD 436,908,000 28th February 201.8 (210,440)
USD 31,935 HKD 248,973 28th February 2018 (134)
(210,576)
Manager's Choice Fund USD 4,073 HKD 31,758 27th February 2018 (18)
USD 19,969,090 HKD 155,695,000 27th February 2018 (86,029)
USD 15,936 HKD 124,176 27th February 2018 (141)
USD 104,272 HKD 812,946 27th February 2018 (489)
USD 35,419 HKD 276,127 27th February 2018 (179)
USD 11,687 HKD 91,139 27th February 2018 (35)
(86,891)
Eurasia Fund USD 5,623,589 HKD 43,846,000 28th February 2018 (21,119)
USD 7,259 HKD 56,590 28th February 2018 (31)
USD 3,915 HKD 30,518 28th February 2018 ( 18)
USD 647 HKD 5,045 28th February 2018 (2)
(21,170)
American Fund USD 17,559 HKD 136,879 28th February 2018 (90)
USD 21,745 HKD 169,545 28th February 2018 (82)
USD 32,150,626 HKD 250,672,000 28th February 2018 (120,738)
USD 21,325 HKD 166,166 28th February 2018 (178)
USD 26,422 HKD 206,057 28th February 2018 (49)
(121,137)
197

AJA IVIl'F - PRIME VALUE CHOICE
NOTES TO THE FINANCIAL STATEMENTS (CONTINUED) FOR THE YEAR ENDED 30TH NOVEMBER 2018
10 Net assets attributable to members per unit and units in issue
2018 MPF
Growth Balanced Capital Stable Guaranteed Conservative Hong Kong Portfolio Portfolio Portfolio Portfolio Fund Equity Fund
Opening outstanding units 48,262,618 27,364,430 19,144,625 NIA 38,063,618 19,358,503 Units issued . 4,089,082 3,591,180 3,315,193 NIA 34,601,469 6,916,774 Units redeemed (6,164,429) (3,732,285) (3,172,184) NIA (24,868,808) (7,518,218)
Closing outstanding units 46,187,271 27,223,325 19,287,634 NIA 47,796,279 18,757,059
HK$ HK$ HK$ HK$ HK$ HK$ Net assets attributable to members per unit 235.77 199.16 180.33 NIA 112.34 318.78
2017 MPF
Growth Balanced Capital Stable Guaranteed Conservative HougKong Portfolio Portfolio Portfolio Portfolio Fund Equity Fund
Opening outstanding units 49,422,836 27,121,127 19,021,245 NIA 33,258,428 20,105,223 Units issued 4,572,773 3,526,938 2,785,010 NIA 20,594,686 5,678,157 Units redeemed (5,732,991) (3,283,635) (2,661,630) NIA (15,789,496) (6,424,877)
Closing outstanding units 48,262,618 27,364,430 19,144,625 NIA 38,063,618 19,358,503
HK$ HK$ HK$ HK$ HK$ HK$ Net assets attributable to members per unit 255.23 212.56 189.66 NIA 111.69 347.72
198

10
AIA MPF - PRIME VALUE CHOICE
NOTES TO THE FINANCIAL STATEMENTS (CONTINUED) FOR THE YEAR ENDED 3_!ffll_NOVEMBER 2018
Net assets attributable to members per uuit and units in issue (continued)
European Japan Equity Fund Equity Fund
Opening outstanding units 7,336,907 3,973,128 Units issued 1,307,974 2,304,873 Units redeemed (1,615,732) (2,335,074)
Closing outstanding units 7,029,149 3,942,927
HK$ HK$ Net assets attributable to members per unit 205.84 167.51
European Japan Equity Fnnd Equity Fund
Opening outstanding units 7,352,054 3,912,858 Units issued 1,799,479 1,683,666 Units redeemed (1,814,626) (1,623,396)
Closing outstanding units 7,336,907 3,973,128
HK$ HK$ Net assets attributable to members per unit 235.16 188.10
North American Equity Fund
10,182,822 4,510,879
(3,816,030)
10,877,671
HK$ 229.49
North American Equity Fund
9,162,933 3,610,721
(2,590,832)
10,182,822
HK$ 224.93
2018 Allianz
Asian Greater China Capital Stable Equity Fund Equity Fund Fund
(Note i) 18,561,821 35,468,200 2,859,190 2,812,178 5,436,088 1,035,502
(3,429,002) (7,344,399) (3,894,692)
17,944,997 33,559,889
HK$ HK$ HK$ 219.97 202.61 N/A
2017 Allianz
Asian Greater China Capital Stable Equity Fund Equity Fund Fund
18,309,806 36,484,302 2,598,375 3,791,973 5,718,528 902,018
(3,539,958) (6,734,630) (641,203)
18,561,821 35,468,200 2,859,190
HK$ HK$ HK$ 239.07 225.78 142.54
Note i: Allianz Capital Stable Fund, Allianz Growth Fund and Allianz Stable Growth Fund ("the 3 Allianz Funds") had no investments and operations since 15th November 2018. MPFA had approved the termination of the 3 Allianz Funds to take effect on 13th March 2019.
199

10
AIA MPF - PRIME VALUE CHOICE
NOTES TO THE FINANCIAL STATEMENTS (CONTINUED) FOR TH}: YEAR ENDED 30TH NOVEMBER ~018
Net assets attributable to members per uuit aud uuits in issue (continued)
Allianz Growth Allianz Stable Fund Growth Fund
(Note i) (Note i) Opening outstanding units 5,611,938 4,813,939 Units issued 729,640 992,126 Units redeemed (6,341,578) (5,806,065)
Closing outstanding units - -
HK$ HK$ Net assets attributable to members per unit NIA NIA
Allianz Growth Allianz Stable Fund Growth Fund
Opening outstanding units 5,653,353 4,501,150 Units issued 876,513 1,096,000 Units redeemed (917,928) (783,211)
Closing outstanding units 5,611,938 4,813,939
HK$ HK$ Net assets attributable to members per unit 195.82 164.81
2018 Green Global Bond Manager's Choice Fund Fund World Fund Fund
11,046,806 10,773,565 9,200,798 25,357,613 3,274,061 8,034,771 2,665,607 4,695,948
(2,799,763) (5,609,935) (2,019,868) (4,609,433)
11 521,104 13,198,401 9,846,537 25,444,128
HK$ HK$ HK$ HK$ 160.62 114.85 135.42 169.15
2017 Green Global Bond Manager's Choice Fund Fund World Fund Fund
9,780,644 9,036,798 7,766,940 24,007,088 3,305,765 6,155,113 3,257,863 5,362,540
(2,039,603) (4,418,346) {1,824,005) (4,012,015)
11,046,806 10,773,565 9,200,798 25,357,613
HK$ HK$ HK$ HK$ 165.44 120.66 136.84 181.33
Note i: Allianz Capital Stable Fund, Allianz Growth Fund and Allianz Stable Growth Fund ("the 3 Allianz Funds") had no investments and operations since 15th November 2018. MPFA had approved the termination of the 3 Allianz Funds to take effect on 13th March 2019.
200

AIA MPF - PRIME VALUE CHOICE
NOTES TO THE FINANCIAL STATEMENTS (CONTINUED) FOR THE YEAR ENDED 30TH NOVEMBER 2018
10 Net assets attributable to members per unit and units in issue (continued)
2018 Fidelity Capital Fidelity Stable Fidelity Growth Asian Hong Kong and American
Stable Fund Growth Fund Fund Bond Fund Eurasia Fund China Fund Fund
Opening outstanding units 3,759,255 8,891,946 8,149,690 7,074,204 1,943,893 12,602,980 3,813,746 Units issued 6,713,616 9,587,268 9,482,057 5,216,429 859,764 7,233,305 2,603,033 Units redeemed (2,104,372) (2,286,778) (1,967,804) (3,264,769) (618,529) (6,352,449) (1,900,099)
Closing outstanding units 8,368,499 16,192,436 15,663,943 9,025,864 2,185,128 13,483,836 4,516,680
HK$ HK$ HK$ HK$ HK$ HK$ HK$ Net assets attributable to members per unit 115.18 128.18 135.77 106.59 155.16 161.82 196.94
2017 Fidelity Capital Fidelity Stable Fidelity Growth Asian Hong Kong and American
Stable Fund Growth Fund Fund Bond Fund Eurasia Fund China Fund Fund
Opening outstanding units 2,816,984 6,571,900 6,722,798 5,656,825 1,436,556 10,744,357 2,576,176 Units issued 2,537,196 3,983,142 2,903,524 3,581,458 980,936 6,737,075 2,373,547 Units redeemed (1,594,925) (1,663,096) (1,476,632) (2,164,079) (473,599) (4,878,452) (1,135,977)
Closing outstanding units 3,759,255 8,891,946 8,149,690 7,074,204 1,943,893 12,602,980 3,813,746
HK$ HK$ HK$ HK$ HK$ HK$ HK$ Net assets attributable to members per unit 119.89 134.58 145.51 107.59 169.97 173.31 191.26
201

AIA MPF - PRIME VALUE CHOICE
NOTES TO THE FINANCIAL STATEMENTS (CONTINUED) FOR THE YEAR ENDED 30TH NOVEMBER 2018
10 Net assets attributable to members per unit and units in issue (continued)
Opening outstanding units Units issued Units redeemed
Closing outstanding units
Net assets attributable to members per unit
Opening outstanding units Units issued Units redeemed
Closing outstanding units
Net assets attributable to members per unit
Age 65 Plus Fund
209,811,198 420,041,429
(197,451,293)
432,401,334
HK$ 1.0208
Age 65 Plus Fund
278,189,130 (68,377,932)
209,811,198
HK$ 1.0304
202
2018 Core Accumulation China HK Dynamic
Fund Asset Allocation Fund
969,415,577 2,734,196 882,460,749 4,037,075
(315,439,859) (1,695,896)
1,536,436,467 5,075,375
HK$ HK$ 1.0676 107.24
2017 Core Accumulation China HK Dynamic
Fund Asset Allocation Fund
1,090,230,298 3,034,865 (120,814,721) (300,669)
969,415 577 2 734,196
HK$ HK$ 1.0800 108.50

AIA MPF - PRIME VALUE CHOICE
NOTES TO THE FINANCIAL STATEMENTS (CONTINUED) FOR THE YEAR ENDED 30TH NOVEMBER 2018
11 Payments charged to Defanlt Investment Strategy ("DIS") constitnent fnnds or scheme or members who invest in the constituent funds
In accordance with the Mandatory Provident Fund legislation, the aggregate of the payment for services of the Core Accumulation Fund and Age 65 Plus Fund must not, in a single day, exceed a daily rate of 0. 75% per annum of the net asset value of each of the Core Accumulation Fund and Age 65 Plus Fund divided by the number of days in the year.
The above aggregate payments for services include, but is not limited to , the fees paid or payable for the services provided by the Trustee, the Administrator, the Investment Manager, the Custodian and the Sponsor and/or promoter(if any) of the AIA MPF - Prime Value Choice and the underlying investment fund(s) of each of the Core Accumulation Fund and Age 65 Plus Fund, and such fees are calculated as a percentage of the net asset value of each of the DIS Constituent Fund and their underlying investment fund(s), but do not include any out-of-pocket expenses incurred by each of the Core Accumulation Fund and Age 65 Plus Fund and their underlying investment fund(s).
In accordance with the Mandatory Provident Fund legislation, the total amount of all payment are charged to or imposed on a DIS Constituent Fund or members who invest in a DIS Constituent Fund, for out-of-pocket expenses incurred by the Trustee on a recurrent basis in the discharge of the Trustee's duties to provide services in relation to a DIS Constituent Fund, shall not in a single year exceed 0.2% of the net asset value of each of the Core Accumulation Fund and Age 65 Plus Fund.
For this purpose, out-of-pocket expense include, for example, annual audit expense, printing or postage expenses relating to recurrent activities (such as issuing annual benefit statements), recurrent legal and professional expenses, safe custody charge which are customarily not calculated as a percentage of the net asset value and transactions cost incurred by a DIS Constituent Fund in connection with the recurrent acquisition of investments for the DIS Constituent Fund (including, for example, costs incurred in acquiring underlying investment funds) and annual statutory expenses( such as compensation fund levy where relevant) of the DIS Constituent Fund.
Out-of-pocket expenses that are not incurred on a recurrent basic may still be charged to or imposed on a DIS Constituent Fund and such out-of-pocket expenses are not subject to the above statutory limit.
Payment for services, out-of-pocket expenses and other payment charged to the DIS constituent funds are disclosed below. Payment for services and out-of-pocket expenses are those defined in the MPF Ordinance.
203
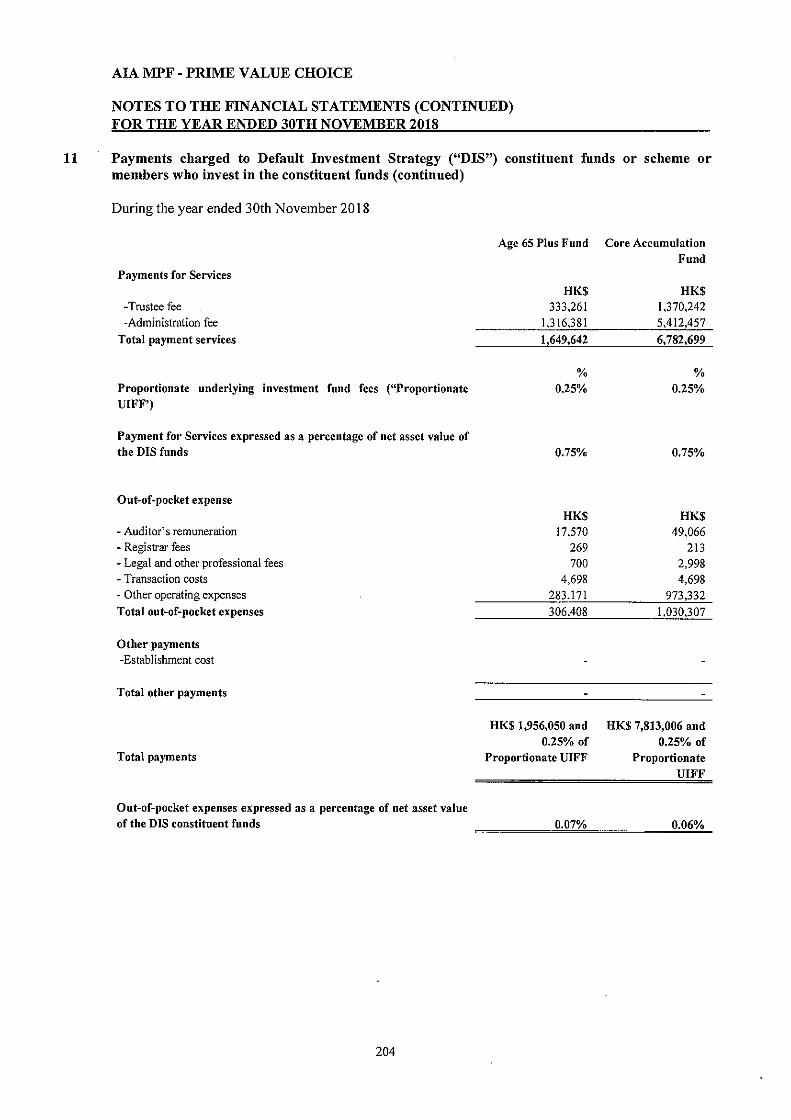
AIA MPF - PRIME VALUE CHOICE
NOTES TO THE FINANCIAL STATEMENTS (CONTINUED) FOR THE YEAR ENDED 30TH NOVEMBER 2018
11 Payments charged to Default Investment Strategy ("DIS") constituent funds or scheme or members who invest in the constituent funds (continued)
During the year ended 30th November 2018
Payments for Services
-Trustee fee -Administration fee
Total payment services
Proportionate underlying investment fund fees ("Proportionate UIFF')
Payment for Services expressed as a percentage of net asset value of the DIS funds
Out-of-pocket expense
- Auditor's remuneration
- Registrar fees - Legal and other professional fees
- Transaction costs - Other operating expenses
Total out-of-pocket expenses
Other payments -Establishment cost
Total other payments
Age 65 Plus Fund Core Accumulation Fund
HK$ 333,261
IJ16J81 1 649,642
% 0.25%
0.75%
HK$ 17,570
269 700
4,698 283.171 306,408
HK$ 1,370,242 5,412,457 6,782,699
% 0.25%
0.75%
HK$ 49.066
213 2,998 4,698
973,332 1,030,307
HK$ 1,956,050 and HK$ 7,813,006 and 0.25% of 0.25% of
Total payments Proportionate UIFF Proportionate UIFF
Out-of-pocket expenses expressed as a percentage of net asset value of the DIS constituent funds 0.07% 0.06% -----=a.a .... ____ ..,.;==-
204

AJA MPF - PRIME VALUE CHOICE
NOTES TO THE FINANCIAL STATEMENTS (CONTINUED) FOR THE YEAR ENDED 30TH NOVEMBER 2018
11 Payments charged to Default Investment Strategy ("DIS") constituent funds or scheme or members who invest in the constituent funds (continued)
During the period from !st April 2017 (date of commencement of operations) to 30th November 2017
Payments for Services
-Trustee fee -Administration fee
Total payment services
Proportionate underlying investment fund fees ("Proportionate UIFF')
Payment for Services expressed as a percentage of net asset value of the DIS funds
Out-of-pocket expense
- Auditor's remuneration - Registrar fees - Legal and other professional fees - Transaction costs - Other operating expenses Total out-of-pocket expenses
Other payments -Establishment cost
Total other payments
Age 65 Plus Fund Core Accumulation
HK$ 82,152
324,500 406,652
% 0.25%
0.75%
HK$ 469
75 128,735
779 34,213
164,271
Fund
HK$ 427,254
1,687,652 2,114,906
% 0.25%
0.75%
HK$ 56,978
237 150,757
3,122 477,000 688,094
HK$ 570,923 and HK$ 2,803,000 and 0.25% of 0.25% of
Total payments Proportionate UIFF Proportionate UIFF
Out-of-pocket expenses expressed as a percentage of net asset value of the DIS constituent funds 0.08% 0.07%
12 Bank loans, overdrafts and other borrowings
The Scheme and its constituent funds had no bank loans, overdrafts and other borrowings as at 30th November 2018 and 2017.
13 Accrued benefits of the Scheme
The total accrued benefits vested in the members' accounts amounted to HK.$75,865,494,782 as at 30th November 2018 (2017: HK.$76,850,741,547).
205

AIA MPF - PRIME VALUE CHOICE
NOTES TO THE FINANCIAL STATEMENTS (CONTINUED) FOR THE YEAR ENDED 30TH NOVEMBER 2018
14 Taxation
The Scheme is not subject to Hong Kong profits tax as it is considered as a recognized retirement scheme and not carrying on a business in Hong Kong according to the Inland Revenue Department Practice Note No.23.
15 Soft commission arrangements
During the year ended 30th November 20 I 8 and the year/period ended 30th November 2017, the Managers and their associates/related parties did not enter into any soft commission arrangements with brokers in relation to dealings in the assets of the Scheme and its constituent funds.
16 Security lending arrangements
During the year ended 30th November 2018 and the year/period ended 30th November 2017, the Scheme and its constituent funds did not enter into any security lending arrangements.
17 Negotiability of assets
There were no statutory or contractual requirements restricting the negotiability of the assets of the Scheme and its constituent funds as at 30th November 2018 and 20 I 7.
18 Commitments
The Scheme and its constituent funds had no commitments as at 30th November 2018 and 2017.
19 Contingent liabilities
The Scheme and its constituent funds had no contingent liabilities as at 30th November 2018 and 2017.
20 Marketing expenses
There have been no advertising expenses, promotional expenses or commissions or brokerage fees paid or payable to the MPF intermediaries deducted from the Scheme or its constituent funds during the year ended 30th November 2018 and the year/period ended 30th November 2017.
21 Subsequent event
Allianz Capital Stable Fund, Allianz Growth Fund and Allianz Stable Growth Fund ("the 3 Allianz Funds") had no investments and operations since 15th November 2018. MPFA had approved the termination of the 3 Allianz Funds to take effect on 13th March 2019.
No other significant events have occurred since the year end date which would impact on the financial position of the Scheme disclosed in the statement of net assets available for benefits as at 30th November 2018 or on the results and cash flows of the Scheme for the year ended on that date.
22 Approval of financial statements
The financial statements were approved by the Trustee on 28th May 2019.
206

INDEPENDENT AUDITOR'S ASSURANCE REPORT TO THE TRUSTEE OF AlA MPF -PRIME VALUE CHOICE ("THE SCHEME")
We have audited the financial statements of the Scheme and its constituent funds (hereafter referred to as the "Scheme") for the year ended 30th November 2018 in accordance with Hong Kong Standards on Auditing and with reference to Practice Note 860.1 (Revised) "The Audit of Retirement Schemes" issued by the Hong Kong Institute of Certified Public Accountants (the "HKICPA"), and have issued an unqualified auditor's report thereon dated 28 May 2019.
Pursuant to section 102 of the Hong Kong Mandatory Provident Fund Schemes (General) Regulation (the "General Regulation"), we are required to report whether the Scheme complied with certain requirements of the Hong Kong Mandatory Provident Fund Schemes Ordinance (the "Ordinance") and the General Regulation.
Trustee's Responsibility
The General Regulation requires the Trustee to ensure that:
(a) proper accounting and other records are kept in respect of the constituent funds of the Scheme, the Scheme assets and all financial transactions entered into in relation to the Scheme;
(b) the requirements specified in the guidelines made by the Mandatory Provident Fund Schemes Authority (the "MPFA") under section 28 of the Ordinance with respect to forbidden investment practices and the requirements of sections 37(2), 51 and 52 and Part X of, and Schedule 1 to, the General Regulation are complied with;
(c) the requirements under sections 34DB(1)(a), (b), (c) and (d), 34DC(1), and 34DD(1) and (4) of the Ordinance are complied with; and
(d) the Scheme assets are not subject to any encumbrance, otherwise than as permitted by the General Regulation.
Our Independence and Quality Control
We have complied with the independence and other ethical requirements of the Code of Ethics for Professional Accountants issued by the HKICPA, which is founded on fundamental principles of integrity, objectivity, professional competence and due care, confidentiality and professional behavior.
Our firm applies Hong Kong Standard on Quality Control 1 issued by the HKICPA and accordingly maintains a comprehensive system of quality control including documented policies and procedures regarding compliance with ethical requirements, professional standards and applicable legal and regulatory requirements.
Auditor's Responsibility
Our responsibility is to report solely to the Trustee, in accordance with section 102 of the General Regulation, on the Scheme's compliance with the above requirements based on the results of the procedures performed by us, and for no other purpose. We do not assume responsibility towards or accept liability to any other person for the contents of this report.
(1)

INDEPENDENT AUDITOR'S ASSURANCE REPORT TO THE TRUSTEE OF AlA MPF - PRIME VALUE CHOICE ("THE SCHEME") (CONTINUED)
Auditor's Responsibility (Continued)
We conducted our engagement in accordance with Hong Kong Standard on Assurance Engagements 3000 (Revised), "Assurance Engagements Other Than Audits or Reviews of Historical Financial Information" and with reference to Practice Note 860.1, (Revised) "The Audit of Retirement Schemes" issued by the HKICP A. We have planned and performed our work to obtain reasonable assurance on whether the Scheme has complied with the above requirements.
We have planned and performed such procedures as we considered necessary with reference to the procedures recommended in Practice Note 860.1 (Revised), which included reviewing, on a test basis, evidence obtained from the Trustee regarding the Scheme's compliance with the above requirements.
We believe that the evidence we have obtained is sufficient and appropriate to provide a basis for our opinion.
Opinion
Based on the foregoing:
(a) in our opinion:
(i) proper accounting and other records have been kept during the year ended 30th November 2018 in respect of the constituent funds of the Scheme, the Scheme assets and all financial transactions entered into in relation to the Scheme; and
(ii) the requirements specified in the guidelines made by the MPFA under section 28 of the Ordinance with respect to forbidden investment practices and the requirements of sections 37(2), 51 and 52 and Part X of, and Schedule 1 to, the General Regulation have been complied with, in all material respects, as at 30th November 2018, 31st August 2018 and 29th March 2018; and
(iii) the requirements specified in the Ordinance under sections 34DB(1)(a), (b), (c) and (d), 34DC(1) and 34DD(1) and (4)(a) with respect to the investment of accrued benefits and control of payment for services relating to Core Accumulation Fund and Age 65 Plus Fund have been complied with, in all material respects, as at 30th November 2018, 31st August 2018 and 29th March 2018;and
(iv) the requirements specified in section 34DD(4)(b) of the Ordinance with respect to the controls of out-of-pocket expenses of the Core Accumulation Fund and Age 65 Plus Fund have been complied with, in all material respects, as at 30th November 2018.
(b) as at 30th November 2018, the Scheme assets were not subject to any encumbrance, otherwise than as permitted by the General Regulation.
(2)

INDEPENDENT AUDITOR'S ASSURANCE REPORT TO THE TRUSTEE OF AlA MPF- PRIME VALUE CHOICE ("THE SCHEME") (CONTINUED)
Other Matter
The requirements specified in the Ordinance under sections 34D1(1) and (2) and 34DK(2) with respect to the transfer of accrued benefits to an account and specified notice, and 34DJ(2), (3), (4) and (5) with respect to locating scheme members relating to Core Accumulation Fund and Age 65 Plus Fund are not applicable to the Trustee during the year ended 30th November 2018 as the Trustee has completed the relevant transitional provisions. Accordingly, there is no reporting on these sections.
Intended Users and Purpose
This report is intended solely for submission by the Trustee to the MPFA pursuant to section 102 of the General Regulation, and is not intended to be, and should not be, used by anyone for any other purpose.
PricewaterhouseCoopers Certified Public Accountants
Hong Kong, 28 May 2019

AIA MPF - PRIME VALUE CHOICE
FOR THE YEAR ENDED 30 NOVEMBER 2018
INFORMATION ON FUND EXPENSE RATIO
2018
Fund expense ratio %
Growth Portfolio 1.97%
Balanced Portfolio 1.94%
Capital Stable Portfolio 1.93%
Guaranteed Portfolio 1.59%
MPF Conservative Fund 0.98%
Hong Kong Equity Fund 1.91%
European Equity Fund 1.93%
Japan Equity Fund 1.92%
North American Equity Fund 1.90%
Asian Equity Fund 1.94%
Greater China Equity Fund 1.92%
Allianz Capital Stable Fund 1.89%
Allianz Growth Fund 1.90%
Allianz Stable Growth Fund 1.89%
Green Fund 1.62%
Global Bond Fund 0.98%
World Fund 0.98%
Manager's Choice Fund 1.66%
Fidelity Capital Stable Fund 1.79%
Fidelity Stable Growth Fund 1.64%
Fidelity Growth Fund 1.81%
Asian Bond Fund 0.78%
Eurasia Fund 0.98%
Hong Kong and China Fund 0.98%
American Fund 0.97%
Age 65 Plus Fund 0.82%
Core Accumulation Fund 0.81%
China HK Dynamic Asset Allocation Fund 1.20%
Top Related