


Languages
Pages
Legal


AGSIP 13 – Resource Economics
John Rolfe and Jill Windle
Central Queensland University
Developing a benefit transfer database for NRM issues in
Queensland
AGSIP 13 – Resource Economics
Resource Economics• Three key areas of focus
– Production economics – The costs of making changes
– Valuing community preferences – Benefits of making changes
– Market based instruments – Best tools for generating incentives

AGSIP 13 – Resource Economics
Project team for valuing community preferences
• Main researchers – Jill Windle (CQU)– John Rolfe (CQU) – project leader
• Funded by– AGSIP = state allocated funding for
agricultural issues under the National Action Plan for Salinity and Water Quality

AGSIP 13 – Resource Economics
Background to study• Know very little about:
– Private costs of providing NRM outcomes– Public benefits of better NRM outcomes
• AgSIP #13: – Private (farm level) costs – modelling– Private (farm level) costs – revealed (MBIs) – Public benefits
• Assessing environmental values– Nonuse values are important as well as use values– Remote as well as local communities have preferences for regional
improvements – Cannot always collect primary data – need to use Benefit Transfer
AGSIP 13 – Resource Economics
Justifying NRM funding • Know very little about the private costs
of improving NRM practices• (Although modelling and other work is helping to
address this)
• And almost nothing about the community preferences/public values for improving NRM
• Investments in NRM are rarely made in an economics framework• Funding allocations in a policitical framework• Some focus on effectiveness by CMAs/NRM groups

AGSIP 13 – Resource Economics
The use of benefit estimates• Focus is on estimating public benefits of
better NRM outcomes • Could then be compared to:
a)Private (farm level) costs – modellingb)Private (farm level) costs – revealed (MBIs)
• Public benefits will include:a)Nonuse values are important as well as use valuesb)Remote as well as local communities have
preferences for regional improvements

AGSIP 13 – Resource Economics
The issues in using specific studies for benefit transfer
• Most studies focused on particular issues, not designed to transfer to other situations
• Values may be sensitive to characteristics – Populations involved– The way the tradeoffs are framed– The scope at which the issue is pitched– The scale of the tradeoffs

AGSIP 13 – Resource Economics
The need to develop a database of values
– Focus was to develop a template of public values for NRM improvements • NRM groups and government could then
access to make summary assessments of benefits
• Starting point for evaluation of investments
– Few previous studies available– Most designed for specific circumstances
• Not necessarily easy to transfer

AGSIP 13 – Resource Economics
The data collection in this study– Primary data collected to develop template
• Technique used was Choice modelling– Non-market valuation technique– Assesses values held by communities and public
• Data collected in a survey questionnaire• This study – 3 survey formats – 1300 surveys

AGSIP 13 – Resource Economics
Focus of study • Identify the importance of non-use values• Identify the values for improvements in 3
key areas of the investment plans– Healthy vegetation– Healthy waterways– Healthy soils
• Identify sensitivity to regional issues• Identify sensitivity to framing issues

AGSIP 13 – Resource Economics
Use and non-use values• Asked to rated a series of questions representing use and non-use values -
From 1 most to 5 (least important)
• Percentage of respondents scoring values with a “1” or”2”
0102030405060708090
100
Use value Option value Bequestvalue
Existencevalue
Quasi-optionvalue
perc
enta
ge
Brisbane
Toow’mba
Mackay
Rockh’ton
AGSIP 13 – Resource Economics
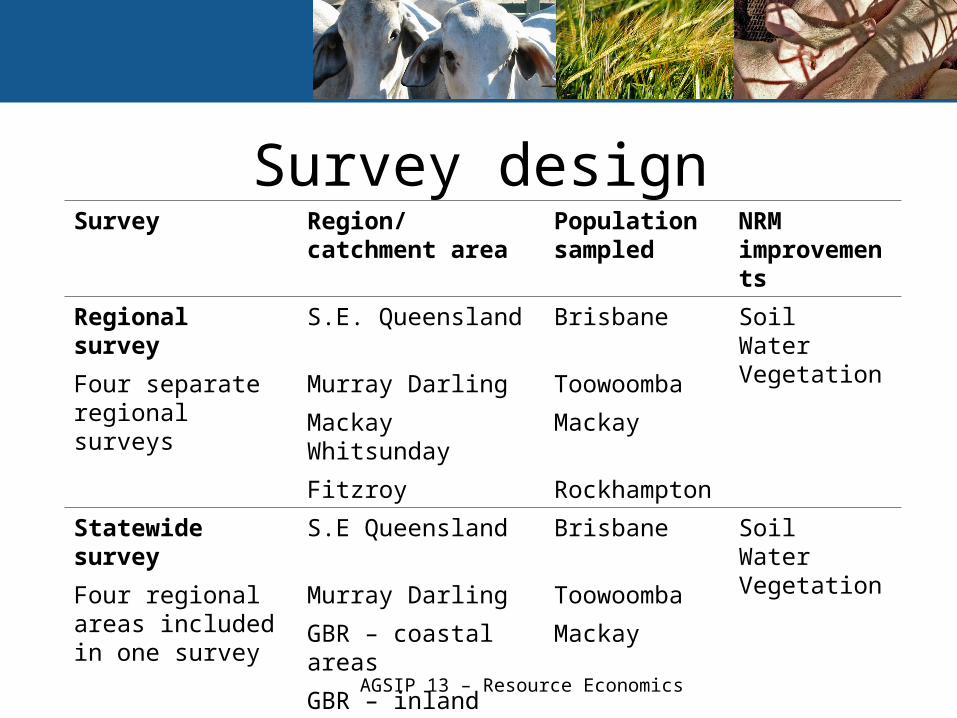
Survey designSurvey Region/catchment
areaPopulation sampled
NRM improvements
Regional survey S.E. Queensland Brisbane SoilWater Vegetation
Four separate regional surveys
Murray Darling Toowoomba
Mackay Whitsunday Mackay
Fitzroy Rockhampton
Statewide survey S.E Queensland Brisbane SoilWater Vegetation
Four regional areas included in one survey
Murray Darling Toowoomba
GBR – coastal areas Mackay
GBR – inland areas
Fitzroy longitudinal survey
Fitzroy Brisbane Water Vegetation
One regional survey Rockhampton

AGSIP 13 – Resource Economics
Regional areas

AGSIP 13 – Resource Economics
Regional choice set example

AGSIP 13 – Resource Economics

AGSIP 13 – Resource Economics
Summary of annual values Soil Water Vegetation
$ value of each 1% improvement
Brisbane – South East Queensland
Regional model 3.05 3.42 3.01
Statewide model1 5.34 4.99 7.69
Toowoomba – Murray Darling
Regional model 4.02 6.28 2.35
Mackay – Mackay Whitsunday
Regional model 4.60 7.82 2.42
Rockhampton – Fitzroy Basin
Regional model 3.70 6.69 4.48
Pooled models
Regional model 3.72 5.80 2.88
Statewide model 4.64 6.62 4.54

AGSIP 13 – Resource Economics
Coefficient values for attributes by different respondent classes
Latent class modelLatent class model
-0.20
-0.10
0.00
0.10
0.20
0.30
0.40
Class 1 24%
Class 2 17%
Class 3 39%
Class 4 20%
coef
fice
nt
Soil
Water
Veg

AGSIP 13 – Resource Economics
Values over time in the Fitzroy basin
00.5
11.5
22.5
33.5
44.5
5
2000 2001 2002 2003 2005 2000 2001 2005
Brisbane Rockhampton
$ p
er 1
% i
mp
rove
men
t
0
0.02
0.04
0.06
0.08
0.1
0.12
$ p
er 1
km i
mp
rove
men
t
Vegetation Waterways
AGSIP 13 – Resource Economics
How to use results
• A related project involved running a competitive tender to improve vegetation management in the Fitzroy
• Auction process run in mid-2006• About $200K committed in payments to landholders • Is it possible to demonstrate that this investment is
worthwhile?• Fitzroy population values vegetation in good condition
at $4.48 per 1%• Brisbane population (state-wide) estimates are $7.69
per 1%

AGSIP 13 – Resource Economics
Outcomes of bid process in FBA

AGSIP 13 – Resource Economics
Results of competitive tender
• Agreements signed over 13,647 ha with landholders
• About 0.21% of Fitzroy Basin
• FBA biodiversity Tender cost $180,000 for 2 years = $90,000 for one year
• Values from just Fitzroy and Brisbane populations = $255,473

AGSIP 13 – Resource Economics
Estimating valuesRockhampton and
Fitzroy Basin1 Brisbane
Population2 193,722 1,508,161
Average household size 2.5 3.3
No of households 77,489 457,018
Survey response rate 72% 50%
Valid households 55,792 228,509
Household value for an improvement in 13,647ha
$0.43 $0.74
Total value - $/year $23,991 $169,097
Total value - $/year $193,087

AGSIP 13 – Resource Economics
What are the implications for salinity management?
• ‘Healthy soils’ and ‘healthy waterways’ have community values
• Use values are not as important as non-use values to wider population– Investments for productivity worthwhile?
• There is not much difference in values between regional and state populations– Bulk of values derived from major centres– Not much justification on benefits side for ‘regional
specific’ policies

AGSIP 13 – Resource Economics
Implications for salinity investment
• The estimated values are reasonably modest– But are annual values for 15 years
• Not all salinity projects to improve soils and vegetation will be justified with these values
• But value estimates are very broad without ‘specific issue’ context

AGSIP 13 – Resource Economics
The importance of option values• Previous work by Rolfe and Windle
(AJARE 2005) has estimated option values for water resource development
• Shown to be significant– Enough to dampen the viability of extensive
development
• The assessment of option values / dealing with risk are key issues for salinity

AGSIP 13 – Resource Economics
Getting some perspective• Focus here is on improving the investment
decision– At the broad level at least– More complex when we go to the case study
level
• But many groups are not even making cost-effective allocations, let alone efficient ones

AGSIP 13 – Resource Economics
Comparing priority setting with a benefits index
0.00
50.00
100.00
150.00
200.00
250.00
300.00
350.00
400.00
450.00
1 11 21 31 41 51 61 71
$/T
BS
3
0
0.5
1
1.5
2
2.5
3
3.5
Lev
el o
f P
rio
rity
Relative bid value Priority assigned

AGSIP 13 – Resource Economics
Looking to the future• Starting to fill information gap on costs and
benefits of achieving NRM targets outlined in regional plans– Economic information for impact assessment and cost
benefit analysis• Choice modelling evaluation survey designed for
application of benefit transfer – results can be transferred to Qld catchments not directly surveyed.
• Results are a good start but still very general – challenge is to now get more specific
Top Related