


Languages
Pages
Legal


FIRST 5 SACRAMENTO COMMISSION 2750 Gateway Oaks Dr., Suite 330
Sacramento, CA 95833
AGENDA
Friday, January 31, 2019 – 1:00-3:00 PM
Members: Steve Wirtz (Chair), David Gordon (Vice Chair), Olivia Kasirye Advisory Committee Member(s): Tony Smith, Robin Blanks Staff: Julie Gallelo, Carmen Garcia-Gomez Consultant: Applied Survey Research
1. Call to order and Roll Call
2. Public Comments on Off-Agenda Items
3. Approve Draft Action Summary of November 15, 2019
4. General Evaluation Update - Applied Survey Research
5. Staff Update
6. Review Q1 BMU Dashboard
7. Review and Approve 2018-19 Evaluation Report
8. Committee Member Comments a. Miscellaneous b. Future Agenda Items/Presentations
First 5 Sacramento Page 1 of 99 Evaluation Committee Meeting January 31, 2019

FIRST 5 SACRAMENTO COMMISSION 2750 Gateway Oaks Dr., Suite 330
Sacramento, CA 95833
DRAFT ACTION SUMMARY
Friday, November 15, 2019 – 2:00-4:00 PM
Members: Steve Wirtz (Chair), David Gordon (Vice Chair), Olivia Kasirye Advisory Committee Member(s): Tony Smith, Robin Blanks Staff: Julie Gallelo, Carmen Garcia-Gomez, Gail Syputa Absent: Dave Gordon Consultant: Applied Survey Research
1. Call to order and Roll Call Action: Meeting was called to order at 2:00PM. A quorum was established and introductions by attendees.
2. Public Comments on Off-Agenda Items Action: None.
3. Approve Draft Action Summary of October 16, 2019 Action: Kasirye/Blanks. Approved as recommended.
4. Approval of Report: Reduction of African American Perinatal and Infant Deaths
Action: Blanks/Kasirye. Approved after comments and changes from discussion are incorporated into the document.
5. Updates from other Committees
Sustainability, Financial Planning, Advisory, Strategic Planning Action: None
6. Committee Member Comments
a. Miscellaneous b. Future Agenda Items/Presentations Action: The RAACD report will be presented to the Commission in January 2020. Adjourned: 4:18PM
Respectfully submitted,
Gail Syputa, Clerk First 5 Sacramento Commission
First 5 Sacramento Page 2 of 99 Evaluation Committee Meeting January 31, 2019

Summary of Evaluation Activities for
First 5 Sacramento
Jan 2020
Strategy Component Task
RAACD PREGNANCY PEER SUPPORT
PUBLIC EDUCATION CAMPAIGN
− Pulled 2019-20 Q1 data, reviewing today
− Meeting with PH, F5, and RSE to plan evaluation strategy for the county-wide campaign
Birth & Beyond
HOME VISITING − Completed CPS recurrence data analysis and working on full report.
Syst Sustainability − Preparing to gather Q1 2019-20 data from staff
Annual Report − Pulled down all FY 18-19 data from Persimmony
− Gathered and analyzed related data from contractors
− Presenting draft FY 2018-19 Annual Report today
Special Studies − Planning phase to determine special studies in the spring
Strategic Plan − Concluded process through prioritization of outcomes and allocated funds
− Draft Strategic Plan report submitted to F5 staff for review
Timeline
Jan Feb Mar Apr May Jun
RAACD report PREZ
Annual report EC PREZ
B&B report DUE Graphics PREZ
Strat Plan Write plan
Finalize plan
PREZ
First 5 Sacramento Page 3 of 99 Evaluation Committee Meeting January 31, 2019

FIRST 5 SACRAMENTO
RAACD Quarterly Dashboard 2019-20
RBA Category
Indicator Q1 n Q1 %
Denominator
How Much?
Number of women with 1+ service (Includes new and rollover clients; excludes Nonconsenters)
103
Number of women with 1+ service ( new clients only; excludes Nonconsenters)
37
Number of women with 1+ service, by trimester at entry Q1 Intakes 37
<12 weeks (1st trimester) 37 4 11%
13-26 weeks (Second Trimester) 37 22 59%
27-end of pregnancy (third trimester) 37 11 30%
Number of women with safe sleep risk factors at intake Q1 Intakes
Does not have a plan for a car seat 37 12 32%
Planning to co-sleep 37 9 24%
Does not have crib 37 22 92%
Number of women with birth risk factors at intake Q1 Intakes
Not receiving regular prenatal care 37 1 3%
2 or more prior miscarriages 37 0 0%
Nutritional Deficiencies 37 7 19%
Alcohol and Drug use 37 3 8%
Tobacco use 37 5 14%
Depression indicated by PhQ-9 (Moderate to High) 37 9 24%
Number of women provided referrals to address birth risk factors Q1 Intakes
Prenatal care / OBGYN 37 3 8%
Breastfeeding or nutrition support (WIC) 37 19 51%
Alcohol & Drug 37 2 5%
Mental Health (referred to Wellspace social worker) 37 8 22%
Financial stability 37 12 32%
Infant Safe Sleep Training & Crib 37 37 100%
Car Seat Education/Seat 37 36 97%
PHQ-9 Completion Q1 Intakes and
Deliveries
Mothers who completed PHQ-9 assessment at Intake 37 37 100%
Mothers who completed PHQ-9 assessment post-delivery 29 28 97%
First 5 Sacramento Page 4 of 99 Evaluation Committee Meeting January 31, 2019

RBA Category
Indicator Q1 n Q1 %
Denominator
How Well?
Number of women who followed up on referrals to address birth risk factors
Q1 Intakes
Prenatal care / OBGYN 3 0 0%
Breastfeeding or nutrition support (WIC) 19 7 37%
Alcohol & Drug 2 1 50%
Mental Health (referred to Wellspace social worker) 8 3 38%
Financial stability 12 5 42%
Infant Safe Sleep Training & Crib 37 8 22%
Car Seat Education/Seat 36 6 17%
Level of program completion (out of those who have exited) Q1 Exits
First Trimester entries: Mothers with minimum number of visits prior to birth (21+)
2 0 0%
Second Trimester entries: Mothers with minimum number of visits prior to birth (10+)
9 3 33%
Third Trimester entries: Mothers with minimum number of visits prior to birth (6+)
7 1 14%
All cohorts: Mothers who completed minimum numbers of prenatal visits
18 4 22%
Mothers who received at least 1 postpartum visit with BMU advocate
18 12 67%
Status at Exit (out of those who have exited) Q1 Exits
Completed program: Completed the minimum prenatal AND postpartum service requirements
18 4 22%
Partially completed program: Completed either minimum prenatal OR postpartum service requirements
18 8 44%
Miscarriage or Termination of Pregnancy 18 0 0%
Dropped out of program 18 1 6%
First 5 Sacramento Page 5 of 99 Evaluation Committee Meeting January 31, 2019
RBA Category
Indicator Q1 n Q1 %
Denominator
Better Off?
Status of safe sleep risk factors Post-Delivery Matched sets with
Intake and Q1 Exits
%pre %post
Co-sleeping 23 48% 52%
Does not have crib 24 36% 4%
Baby sleeping on back 26 75% 92%
Status of Risk Factors Q1 Exits
% of mothers using alcohol and drug use 30 0 0%
% of mothers using tobacco 30 0 0%
Birth Outcomes Q1 Exits
Number of babies born 30 30
Single delivery 30 28 93%
Multiple delivery (twins) 30 2 7%
First trimester entry cohort 30 1 3%
Second trimester entry cohort 30 17 57%
Third trimester entry cohort 30 12 40%
Babies born with a healthy birth outcome (not LBW, not pre-term) 30 24 80%
Single delivery 28 24 86%
Multiple delivery (twins) 2 0 0%
First trimester entry cohort 1 1 100%
Second trimester entry cohort 17 14 82%
Third trimester entry cohort 12 9 75%
Babies that were low birth weight 30 4 13%
Single delivery 28 2 7%
Multiple delivery (twins) 2 2 100%
First trimester entry cohort 1 0 0%
Second trimester entry cohort 17 2 12%
Third trimester entry cohort 12 2 17%
First 5 Sacramento Page 6 of 99 Evaluation Committee Meeting January 31, 2019

Indicator Q1 n Q1 %
Denominator Babies that were preterm 30 5 17%
Single delivery 28 3 11%
Multiple delivery (twins) 2 2 100%
First trimester entry cohort 1 0 0%
Second trimester entry cohort 17 2
12%
Third trimester entry cohort 12 3 25%
Deliveries that were stillbirths (fetal death) 30 0 0%
Babies who had a well-baby visit with pediatrician at program exit 30 21 70%
Babies who were exclusive breastfeeding at hospital (of mothers with post survey)
30 18 60%
Babies with any breastfeeding at hospital (of mothers with post survey) 30 23 77%
Infant deaths prior to mother exiting program 30 0 0%
First 5 Sacramento Page 7 of 99 Evaluation Committee Meeting January 31, 2019
T a b l e o f C o n t e n t s
F I R S T 5 S A C R A M E N T O : E V A LU A T I O N R E P O R T F Y 2 0 1 8 - 2 0 1 9 — i
f Fwell
First 5 Sacramento Page 8 of 99 Evaluation Committee Meeting January 31, 2019
T A B LE O F C O N T E N T S
F I R S T 5 S A C R A M E N T O : E V A LU A T I O N R E P O R T F Y 2 0 1 8 - 2 0 1 9 — i
Table of Contents
Executive Summary ....................................................................................................................................... 1
Profile of First 5 Clients ............................................................................................................................... 15
Result 1: DECREASE INFANT DEATH ............................................................................................................ 19
Result 2: INCREASE PREVALENCE AND DURATION OF BREASTFEEDING ..................................................... 28
Result 3: DECREASE DENTAL DISEASE ......................................................................................................... 32
Result 4: INCREASE UTILIZATION OF MEDICAL HOMES ............................................................................... 37
Result 5: INCREASE ACCESSIBILITY TO AFFORDABLE QUALITY CHILD CARE ................................................ 40
Result 6: INCREASE USE OF QUALITY CHILD CARE PRACTICES..................................................................... 42
Result 7: INCREASE CHILDREN’S, FAMILIES’, AND SCHOOLS’ READINESS FOR KINDERGARTEN .................. 49
Result 8: INCREASE FAMILY CONNECTIONS TO COMMUNITY RESOURCES ................................................. 64
Result 9: INCREASE USE OF EFFECTIVE PARENTING .................................................................................... 70
Result 10: DECREASE CHILD MALTREATMENT AND DEATH ........................................................................ 80
Systems Sustainability Plan Update 2018-19............................................................................................... 84
Communications Strategies and Results ..................................................................................................... 86
Evaluation Success and Next Steps .............................................................................................................. 87
First 5 Sacramento Page 9 of 99 Evaluation Committee Meeting January 31, 2019

T A B LE O F F I G U R E S
F I R S T 5 S A C R A M E N T O : E V A LU A T I O N R E P O R T F Y 2 0 1 8 - 2 0 1 9 — i i
Table of Figures
Three-Year Rolling Average Rate of Infant Death in Sacramento County ................................ 4
Expenses, by Content Area..................................................................................................... 10
Percentage of Expenditures, by Agency Type ........................................................................ 10
First 5 Sacramento Strategic Hierarchy, FY2018-2021 ........................................................... 11
First 5 Sacramento Results Evaluation Framework ................................................................ 12
Level of Data for First 5 Sacramento Programs ...................................................................... 13
Reach of First 5 Sacramento, 2018-2019 ............................................................................... 15
Ethnicity of First 5 Sacramento Children Compared to County, 2018-19 .............................. 16
Map of Families Served, 2018-19 ........................................................................................... 16
First 5 Sacramento Family Information Form Intake Data: Parent Information ..................... 17
First 5 Sacramento Family Information Form Intake Data: Child Information ....................... 17
Percentage of Parents Who Read with their Child at Least Five Times Per Week* ................ 18
Percentage of Babies Born Premature, by Race/Ethnicity ..................................................... 19
Rate of Infant Mortality (Deaths per 1,000 live births) .......................................................... 20
Percent of SSB Participants Practicing Infant Safe Sleep Behaviors, By Race ......................... 24
Percentage of Mothers who Exclusively Fed Baby Breast Milk in the Hospital ...................... 28
RBA Dashboard — WIC DHHS/CRP-WIC Breastfeeding Services ............................................ 29
Percentage of Pre-Kindergarten Children (Sac) and Kindergarten Children (CA) with Untreated Decay .................................................................................................................... 32
Percentage of Children with a Dental Visit in the Previous Year (Medi-Cal only) ................... 33
RBA Dashboard — Early Smiles Dental Screenings................................................................. 34
Results of Early Smiles Dental Screenings, by Ethnicity, 2018-19 (Numbers) ........................ 34
Results of Early Smiles Dental Screenings, by Ethnicity, 2018-19 (Percentages) ................... 35
Percentage of Dental Home Referrals Given and Utilized, 2018-19 ...................................... 35
Percentage of Children 0-5 with Health Insurance ................................................................ 37
Percentage of Children Ages 3-6 With Well-Child Visit in Previous Year (Medi-Cal Managed Care only) .............................................................................................. 38
Medical/Dental Provider and Utilization Amongst Birth & Beyond and School Readiness Clients ................................................................................................................... 39
Percentage of $52,080 Annual Income Needed for Cover Cost of Child Care ....................... 40
Capacity of Child Care System: Percent of 0-5 Year-Olds Who Can Be Accommodated in a Licensed Child Care Center or Family Child Care Home .................................................. 41
First 5 Sacramento Page 10 of 99 Evaluation Committee Meeting January 31, 2019

T A B LE O F F I G U R E S
F I R S T 5 S A C R A M E N T O : E V A LU A T I O N R E P O R T F Y 2 0 1 8 - 2 0 1 9 — i i i
Percentage of Children Ages 0-5 who Attend a Preschool Site with a Quality Rating ............ 42
RBA Dashboard — Child Action, Inc. ...................................................................................... 43
Results of Pre- and Post-ECERS-R Assessments, Child Action Participants ............................. 44
RBA Dashboard — Preschool Bridging Model Plus ................................................................. 45
Results of Pre and Post CLASS Assessments, PBM+ Participants, 2018-19 ............................ 46
Percentage of Children 3-4 Years Old Enrolled in Preschool .................................................. 49
RBA Dashboard — School Readiness: Playgroups .................................................................. 50
RBA Dashboard — School Readiness: Preschool .................................................................... 53
Percentage of Children Ages 0-2 and 3-5 Enrolled in Special Education ............................... 54
Diagnoses of Sacramento County Children Ages 3-5 Enrolled in Special Education, 2018-19 .................................................................................................................................. 55
RBA Dashboard — School Readiness: Screenings and Referrals ............................................ 55
RBA Dashboard — School Readiness: Family Support and Engagement ................................ 56
Percentage of children whose families report reading at home at least five days per week . 57
RBA Dashboard — School Readiness: Transition Summer Camp ........................................... 58
Change in Average Kindergarten Readiness Score Amongst Transition Summer Camp Participants ............................................................................................................................ 59
RBA Dashboard: School Readiness: Help Me Grow ................................................................ 61
Percent of Children Screened for ASQ/ ASQ-SE, by Cut-Off ................................................... 62
RBA Dashboard — 2-1-1......................................................................................................... 64
Community Connections Group Attendance, 2018-19 .......................................................... 66
Changes in Parent Attitudes Related to Support and Connectedness ................................... 68
Substantiated Allegations of Child Abuse per 1,000 Children Ages 0-5, by Race/Ethnicity .... 70
RBA Dashboard — Birth & Beyond: Overall ........................................................................... 70
RBA Dashboard — Birth & Beyond: FRC Enhanced Core ........................................................ 71
RBA Dashboard — Birth & Beyond: Parent Education ........................................................... 72
RBA Dashboard — Birth & Beyond: Home Visitation Services ............................................... 73
Changes in 2018-19 AAPI Scores for Birth & Beyond Home Visitation Clients ....................... 74
Substantiated Maltreatment within 12 Months of Intake, all Subgroups, Children 0-5 ......... 75
Substantiated Recurrence of Maltreatment within 12 Months of Intake, Children 0-5 ......... 75
RBA Dashboard — Birth & Beyond: CalWORKs Home Visitation Services .............................. 76
RBA Dashboard — Birth & Beyond: Crisis Intervention Services ............................................ 78
RBA Dashboard — Crisis Nursery: Safe and Emergency Care ................................................ 80
RBA Dashboard — Crisis Nursery: Crisis Intervention ............................................................ 81
First 5 Sacramento Page 11 of 99 Evaluation Committee Meeting January 31, 2019

E X E C U T I V E S U M M A R Y
FI RST 5 SA C RAME N T O: E VALUAT I ON RE PO R T FY 2 018 -2 01 9 — 1
Executive Summary
Introduction First 5 Sacramento uses tobacco tax revenue through Proposition 10 to fund a range of essential
prevention and early intervention programs for Sacramento County children ages 0-5 and their families.
During Fiscal Year 2018-19, First 5 invested a total of $20.6 million. This report describes the services
provided and outcomes for First 5-funded services in FY 2018-19 during the 2018-2021 Strategic Plan
period. Using a Results-Based Accountability (RBA) framework, this report addresses the following
questions:
• What are the current needs in Sacramento County as they relate to each strategic plan result?
Which community trends are we trying to influence?
• How much service was provided? How many people were served, and what types of service did
they receive?
• How well were the services provided? Were they implemented as intended?
• Is anybody better off as a result of the services?
Profile of First 5 Sacramento Clients FY 2018-19
DEMOGRAPHICS
• First 5 Sacramento’s services continued to have broad reach around the county. First 5 served
44,874 duplicated clients, including parents, children, and providers. Additionally, 19,976
unduplicated individuals received a direct service, including 7,150 children, which represents 6%
of the county’s children ages 0-5, down from serving 13% of the county’s children in 2017-181.
Additionally, many more children and parents were reached indirectly through systems change
efforts and/ or programs that don’t collect individual level data, such as Baby-Friendly hospitals,
and public education campaigns on pregnancy stress, safe sleep, and oral health.
1 6% = 7,150 served in 2018-19, as percent of county population for children 0-5 (117,791), based upon Kidsdata.org, 2018. This reduction in the number of children served reflects the FY 2018-19 Strategic Plan budget, which reflected a 22% reduction in funding.
First 5 Sacramento Page 12 of 99 Evaluation Committee Meeting January 31, 2019

E X E C U T I V E S U M M A R Y
FI RST 5 SA C RAME N T O: E VALUAT I ON RE PO R T FY 2 018 -2 01 9 — 2
• The majority of clients served reflected communities of color. The largest group served was
consistently Hispanic/Latino families, who made up 38% of all children and another 15% of
children were African American, higher proportions than found across the county’s child
population. Most (72%) children and parents’ primary language was English, and another 18%
spoke Spanish.
The Family Information Form (FIF) provided valuable information about First 5 clients’ demographic
characteristics as well as their wellbeing vis-à-vis First 5’s strategic plan priority areas, goals, and desired
results. Intake forms were gathered from 8,914 adults and 7,868 children. Findings included the
following:
• Half of children are read to by their parents at least five times a week. Among parents who
engaged in First 5-funded school readiness services and who completed pre and post Family
Information Forms, there was a significant increase in the percentage of parents reading to their
child(ren) at least five times a week, from 44% (pre) to 52% (post).
• Parents have strong social and resource connections. Amongst the 953 parents with both
intake and follow up data, there was a statistically significant increase in the percentage of
parents who knew which resources to contact for help with basic needs, and for advice on child-
rearing.
• The majority of children reportedly received timely health and dental services. Eighty nine
percent of parents said their child had been to a well-child checkup in the past 12 months. This
rate of routine pediatric visits is much higher than it is amongst participants with claims data from
Sacramento County’s four Medi-Cal plans, which averages 73%. According to First 5 parents, 57%
of parents with children over 18 months old said they had taken their child to a dentist in the last
year, which is more favorable than the 2017 countywide Medi-Cal average of 20% for children
ages 1-2 and 43% for children ages 3-52. However, 9% of parents suspect their child has
untreated cavities (2018-19).
• Food/nutrition services were the most commonly utilized community program/services. Two-
thirds of adults (68%) reported using food/nutrition services (such as WIC, CalFresh, Food Bank,
etc.) in the past six months, representing the most frequently used services.
• While less than half of all families (43%) reported reading regularly with their children,
approximately three-quarters of families engaged in other supportive activities with their
children. The majority of families (81%) reported sitting and sharing a meal together at least 5
times per week, and 73% of families reported practicing a bedtime routine, and talking with their
child about what happened during the day (72%) at least 5 times per week. Seventy percent of
families reported playing one-on-one with their child at least 5 times per week, and 67% of
families told stories or sang songs together at least 5 times per week, indicating positive and
regular parent-child interaction.
2 California Health & Human Services Agency, Dental Utilization Measures and Sealant Data by County and Age Calendar Year 2013 to 2017. Accessed at: https://data.chhs.ca.gov/dataset/d17f628d-6e9f-4ac9-9025-931565bb033d/resource/a93db54e-b82b-46fe-8f02-7dc5e64af22a/download/mdsd-sealants-data-by-county-ethnicity-age-cy-2013-to-2017-jan19.csv.
First 5 Sacramento Page 13 of 99 Evaluation Committee Meeting January 31, 2019
E X E C U T I V E S U M M A R Y
FI RST 5 SA C RAME N T O: E VALUAT I ON RE PO R T FY 2 018 -2 01 9 — 3
Result 1: Decrease Infant Death First 5 Sacramento’s investment to reduce African American infant death included three interlocking
strategies that were both direct service and systemic in nature: the Perinatal Education Campaign, Safe
Sleep Baby, and the Pregnancy Peer Support program. Achievements in FY 2018-19 included the
following:
• The Pregnancy Peer Support program helped African American mothers reduce socio-economic
and health risk factors and deliver healthy babies. Through Her Health First’s Black Mothers
United program, 215 women received weekly contact including education, referrals and any
other support needed to address risks to healthy birth. There were 102 live births in the program,
including 92 singletons and 10 twins. Of these, 83% were born at a healthy birth weight, 80%
were born full term, and combined, 76% had a healthy birth outcome (birth that is at healthy
weight and full term).
• Safe Sleep Baby showed statistically significant impacts on parents’ knowledge and practices
related to safe sleep strategies. There were 883 individuals who received the Safe Sleep Baby
training, 31% of whom were African American, and 44% resided in RAACD’s targeted zip codes.
Pre and post measures indicated significant increases in knowledge as well as use of practices
that promote safe sleep. In addition, Safe Sleep Baby trained 292 community-based service
providers and one medical provider, and 450 cribs were provided by the Cribs4Kids program to
parents and caregivers, approximately 36% of which went to African American parents.
• Runyon-Saltzman, Inc (RSE), First 5, Sacramento County Public Health, the Sac Healthy Baby
Collaborative, and community partners developed strategies for the next Perinatal Education
Campaign. Additionally, the annual Pride & Joy Community Baby Shower reached 113 people,
104 of which were pregnant or new mothers. There were 2,170 visits to the SacHealthyBaby
website by 1,874 users.
• First 5 supported a systems approach to reinforce collaborative efforts to decrease infant death.
Efforts include serving on the Reduction of African American Child Deaths (RAACD) Steering
Committee to help bring about systemic impact across partners, as well as exploring
reimbursement potential for the Pregnancy Peer Support program.
• Taken together, efforts from these strategies to reduce African American child death have shown
signs of positive impact. Overall for African Americans in the County, between 2012-14 and 2015-
17, there was a:
• 23% decrease in the rate of African American infant deaths, and a 42% decrease in
disparity with all infant deaths among other races.
• 2% decrease in the percentage of African American babies born preterm, and a 6%
decrease in disparity between African American preterm births and all other preterm
births.
• 57% decrease in African American infant sleep related deaths, and a 68% decrease in
disparity between deaths amongst African American babies and babies of other races.
First 5 Sacramento Page 14 of 99 Evaluation Committee Meeting January 31, 2019

E X E C U T I V E S U M M A R Y
FI RST 5 SA C RAME N T O: E VALUAT I ON RE PO R T FY 2 018 -2 01 9 — 4
Three-Year Rolling Average Rate of Infant Death in Sacramento County
Source: Sacramento County, Department of Health Services, Public Health Division, Epidemiology Program, Birth Statistical Master Files. Rate is per 1,000 live births.
Result 2: Increase Prevalence and Duration of Breastfeeding
• Women, Infants and Children and Community Resource Project, Inc. reached 3,237 mothers and
providers to promote breastfeeding. In 2018-19, participating women received one-on-one
support with a lactation consultant funded by First 5, as well as drop-in support, and a helpline.
Thirty-two providers received training and education to promote breastfeeding.
• Mothers served by First 5-funded WIC programs are more likely than the national average to be
exclusively breastfeeding at six months. The combined percent of DHHS WIC clients and CRP WIC
clients exclusively breastfeeding at 6 months (25.9%) was slightly less than the state (26.3%), but
higher than the national averages (24.9%)3.
• First 5 promoted systems change policies to ensure that the breastfeeding services and supplies
provided through Medi-Cal are accessible to new moms. First 5 additionally assessed and
advocated for federal and state legislative actions to fill gaps in services that might emerge, while
advocating for appropriate county responses. Efforts included updating their Policy Priorities and
promoting Baby-Friendly hospital designation.
Result 3: Decrease Dental Disease • Early Smiles screened and served 9,799 children to prevent and address oral health needs. In
2018-19, Early Smiles provided dental health screenings, fluoride varnishes, and dental health
information to 9,799 children at schools and community events. Slightly more than one-quarter
(26%) of the children screened through the Early Smiles mobile dental program had untreated
tooth decay and needed follow-up dental services. In 2018-19, 80% percent of children were
successfully assisted (through referral) in establishing a dental home, and 41% of those children
attended a dental visit based upon the referral.
3 Source: https://www.cdc.gov/breastfeeding/data/reportcard.htm. Retrieved December 9, 2019
10.8 11.0
9.28.3
3.9 3.8 4.0 4.3
4.6 4.5 4.5 4.7
2012-2014 2013-2015 2014-2016 2015-2017
African AmericanInfantsAll Other Infants
County-WideAverage
First 5 Sacramento Page 15 of 99 Evaluation Committee Meeting January 31, 2019
E X E C U T I V E S U M M A R Y
FI RST 5 SA C RAME N T O: E VALUAT I ON RE PO R T FY 2 018 -2 01 9 — 5
• First 5 continued to invest in systemic approaches to oral health. During 2018-19, First 5
increased the coordination of public education messaging about dental disease, participated in
the Medi-Cal Dental Advisory Committee (MCDAC) and Sacramento County’s Oral Health
Strategic Plan (SCOHSP), and secured an alternate revenue source for mobile dental services.
Result 4: Increase Utilization of Medical Homes • Amongst First 5-supported families participating in Birth & Beyond and School Readiness
programs, almost all had a medical home at intake (92%) but were less likely to have a dental
home (66%).
• First 5 increased the coordination of public education messaging around the importance of a
medical home, well child check-ups, and maternal mental health. To achieve this, First 5
Sacramento met with 3 Geographic Managed Care health plans and one hospital system to share
targeted messaging on the needs of families, and the importance of well child visits, and asked
for their collaboration in adopting these priorities.
• First 5 assessed and advocated for federal and state legislative actions related to the Affordable
Care Act and supported local efforts to fill gaps in services in Sacramento.
Result 5: Increase Accessibility to Affordable Quality Child Care
• First 5 identified and advocated for federal, state, and local legislation that increases access to
child care. In addition to tracking and supporting priority bills and Governor Newsom’s “Parent
Agenda,” First 5 participated in the City of Sacramento’s Child Care Hearing, which convened local
government and business leaders (including First 5 Sacramento’s Executive Director and
Commissioner Sneeringer) about the ongoing crisis for families and potential solutions to increase
affordable and quality child care throughout the city of Sacramento. Chair Serna gave opening
remarks and highlighted First 5 Sacramento’s ongoing investment in improving quality child care.
• First 5 attracted additional attention for their advocacy work on child care when the Blue Ribbon
Commission Report highlighted First 5 as a key partner and advocate on child care.
• There was a net gain in the number of sites within the First 5 network, from 46 California State
Preschool Programs (CSPP) sites to 60 CSPP sites, resulting in hundreds more children having
access to quality, affordable child care.
Result 6: Increase Use of Quality Care Practices • Child Action, Inc.’s Quality Child Care Collaborative (QCCC) helped 111 early educators increase
the quality of 104 classrooms. The Quality Child Care Collaborative (QCCC) provided support to
licensed and license-exempt child care providers through workshops, environmental assessments
(ECERS-R, FCCERS-R, and ITERS-R), coaching, and workshops. Child Action increased the quality of
early care and education in partner classrooms, as seen by statistically significant improvements
in the ECERS-R domains of Activities, Space and Furnishings, and Parents and Staff.
• The Preschool Bridging Model Plus (PBM+) supported 125 early educators in the private sector to
increase their quality of care. Through Classroom Assessment Scoring System (CLASS)
First 5 Sacramento Page 16 of 99 Evaluation Committee Meeting January 31, 2019

E X E C U T I V E S U M M A R Y
FI RST 5 SA C RAME N T O: E VALUAT I ON RE PO R T FY 2 018 -2 01 9 — 6
assessments, instructional support, site development, developmental and health screenings,
PBM+ helped children aged 0-5 and their families gain a quality early education and be prepared
for the transition to kindergarten. Improvements in the fall to spring CLASS assessments were
consistent with previous years’ data, with statistically significant gains in all three dimensions of
the preschool classroom tool: Emotional Support, Classroom Organization, and Instructional
Support, and statistically significant gains in both dimensions of the toddler classroom tool:
Emotional and Behavioral Support and Engaged Support for Learning.
• First 5 employed financial resource strategies to support the increased use of quality child care
practices. These efforts included encouraging school districts to include early care and education
in their Local Control and Accountability Plans (LCAPs) and to direct funding for children aged 0-5
and their parents.
Result 7: Increase Children’s, Families’, and Schools’ Readiness for Kindergarten
• Nine school districts prepared 4,796 of Sacramento’s most vulnerable children and 4,083 of their
parents/caregivers to be ready for school. The districts provided services at 46 sites to promote
school readiness among children ages 0-5 and their families, with programs such as preschool,
developmental playgroups, summer kindergarten transition camps and transition activities,
health and developmental screenings and referrals, family literacy, and parent education,
engagement and support. In 2018-19, two school districts served 97 children in 40 preschool
slots, and six school districts served 378 children in kindergarten transition summer camps.
• Transition Summer Camp students showed improvement across all three kindergarten
readiness skill areas, with 59% of students improving in kindergarten academics, 44%
improving in self-regulation, and 24% improving in social expression.
• School districts conducted 11,9564 screenings for 3,9695 children to identify potential
delays or concerns related to child development, speech/language, vision, and/or
hearing. As a result, 14% of children screened were provided referrals for
speech/language, followed by vision (9%), developmental needs (2%), and hearing (1%).
• Help Me Grow has a robust inaugural year of child assessments and linkages. HMG received 862
calls to the call line and conducted intakes on 235 children and their families. Additionally, 408
children aged 0-5 were screened through Help Me Grow for assessments related to child
development, speech/language, vision, and/or hearing.
• Of the 408 unduplicated children screened for developmental delays, half of all children
screened on the ASQ were flagged with possible developmental delays, and two-fifths of
all children screened on the ASQ-SE were flagged with possible developmental delays.
Parents of these children were guided through full developmental assessments and
connections to needed services.
4 Duplicated number of total screens 5 Unduplicated number of children across all screens
First 5 Sacramento Page 17 of 99 Evaluation Committee Meeting January 31, 2019

E X E C U T I V E S U M M A R Y
FI RST 5 SA C RAME N T O: E VALUAT I ON RE PO R T FY 2 018 -2 01 9 — 7
Result 8: Increase Family Connections to Community Resources
• Sacramento County’s 2-1-1 helped connect 7,498 parents with a child ages 0 to 5 to critical
community resources. 2-1-1 provided referrals to callers seeking information on Family Resource
Centers (9%), followed by mother and infant care/ pediatrics (3.3%), breastfeeding or nutrition
support (CalFresh/WIC and Formula/Baby food, 1.7%), and child care providers (1.3%). In follow-
up calls made to clients, a high level of customer satisfaction was found, in that nearly all
respondents reported that the information provided was accurate and that they would
recommend 2-1-1 to family and friends.
• Community Connections Groups (CCG) created enduring social bonds and service connections to
over 872 families in 14 groups throughout Sacramento communities. Participating families
attended a total of 342 meetings. The central benefit of group participation identified by group
leaders and participants was creating connections to other families and local community
resources. In 2018-19, 96% of parents reported that they planned to stay in touch with other
members after the group ended. Most notably, as a result of participation in their group, 96% of
parents indicated feeling they are more likely to take their child to another program that benefits
their development (such as a playgroup, library, FRC activity, pre-school, etc.).
• Across multiple First 5 programs, parents’ knowledge of social support and community resources
is strong. Amongst the 953 parents with both intake and follow up data, there was a statistically
significant increase in the percentage of parents who knew which resources to contact for help
with basic needs, and for advice on child-rearing.
Result 9: Increase Use of Effective Parenting • Birth & Beyond directly served 1,300 children and 3,900 parents/caregivers through one or more
support services for pregnant women, children aged 0-5, and their families/caregivers, including
enhanced core services, parent education classes, home visitation, and crisis intervention when
needed. CalWORKs funding was secured to provide additional home visiting services.
• The gateway to FRC services is through “light touch” services, referred to as Enhanced Core
services, and includes community events, referral, and informational and other support services,
such as stress reduction activities, parent education, and peer support groups. Family Resource
Centers offered 6,641 services to 928 families (and 476 children), including education classes
related to car seat safety, child development, and life skills.
• The FRCs offered evidence-based Parent Education classes such as the Nurturing Parenting
Program (NPP) and Making Parenting a Pleasure to 964 parents, and 2,707 Play Care services
were provided to children to their parents could attend the classes.
• The FRCs also provided Home Visitation services. Services were provided to 1,191 families in
2018-19, 12% (242) of whom were referred by CPS. Furthermore, parents at all three tiers of
service (prevention, intervention, and treatment) showed statistically significant improvements in
the Adolescent and Adult Parenting Inventory (AAPI), a tool that measures parents’ risk for child
maltreatment. Overall, across all service dosage levels, 11% of CPS-involved children participating
in Birth & Beyond home visitation experienced a substantiated allegation of child abuse within 12
First 5 Sacramento Page 18 of 99 Evaluation Committee Meeting January 31, 2019
E X E C U T I V E S U M M A R Y
FI RST 5 SA C RAME N T O: E VALUAT I ON RE PO R T FY 2 018 -2 01 9 — 8
months of intake; the rate of recurrence across the county was 10%. However, amongst those
higher levels of service, the rate of recurrence is actually lower than the countywide rate.
• The CalWORKs Home Visitation program supports families on CalWORKs through home visitation
services using the Healthy Families America model, with the hope of addressing additional family
and child hardships to ensure that each family can meet their family stability goals. Healthy
Families America helped 24 adults and 32 children through 174 home visitations as well as
conducted 9 developmental screenings. The most common service referrals made were for
mental health (10), housing support (5), and work readiness (5). The referrals most likely to be
followed up were early learning settings or parent/ child interaction activity (3), housing support
(3), and immigration legal services (2).
• Crisis Intervention Services served 1,671 families with significant resource needs, helping to
increase their knowledge of community resources, increase their perception of social support,
and reduce their stress. Pre- and post-tests of Crisis Intervention Services clients indicated
increased parental knowledge about where to get help and information, perception of the level
of support they have among their family, friends, or in their community, and decreased stress.
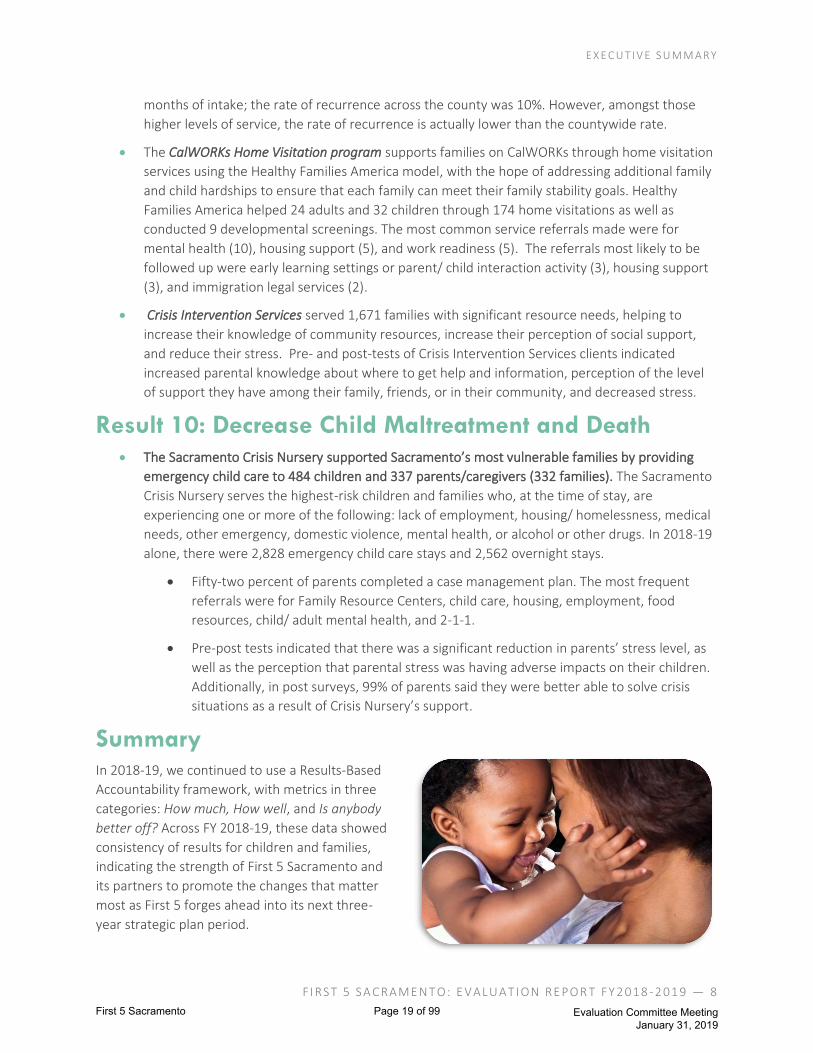
Result 10: Decrease Child Maltreatment and Death • The Sacramento Crisis Nursery supported Sacramento’s most vulnerable families by providing
emergency child care to 484 children and 337 parents/caregivers (332 families). The Sacramento
Crisis Nursery serves the highest-risk children and families who, at the time of stay, are
experiencing one or more of the following: lack of employment, housing/ homelessness, medical
needs, other emergency, domestic violence, mental health, or alcohol or other drugs. In 2018-19
alone, there were 2,828 emergency child care stays and 2,562 overnight stays.
• Fifty-two percent of parents completed a case management plan. The most frequent
referrals were for Family Resource Centers, child care, housing, employment, food
resources, child/ adult mental health, and 2-1-1.
• Pre-post tests indicated that there was a significant reduction in parents’ stress level, as
well as the perception that parental stress was having adverse impacts on their children.
Additionally, in post surveys, 99% of parents said they were better able to solve crisis
situations as a result of Crisis Nursery’s support.
Summary In 2018-19, we continued to use a Results-Based
Accountability framework, with metrics in three
categories: How much, How well, and Is anybody
better off? Across FY 2018-19, these data showed
consistency of results for children and families,
indicating the strength of First 5 Sacramento and
its partners to promote the changes that matter
most as First 5 forges ahead into its next three-
year strategic plan period.
First 5 Sacramento Page 19 of 99 Evaluation Committee Meeting January 31, 2019

I N T R O D U C T I O N
FI RST 5 SA C RAME N T O: E VALUAT I ON RE PO R T FY 2 018 -2 01 9 — 9
Introduction
Background First 5 Sacramento uses tobacco tax funds through Proposition 10 to fund a range of essential prevention
and early intervention programs for Sacramento County children ages 0-5 and their families. This report
describes the services provided and outcomes for First 5-funded services in 2018-19. Using a Results-
Based Accountability framework, this report addresses the following questions:
• What are the current needs in Sacramento County as they relate to each strategic plan result?
Which community trends are we trying to influence?
• How much service was provided? How many people were served, and what types of service did
they receive?
• How well were the services provided? Were they implemented as intended?
• Is anybody better off as a result of the services?
Data for this evaluation report come from a variety of sources, including secondary data on community
indicators, service and outcome data in the agency’s database (Persimmony), Family Information Form
intake and follow up data, and special evaluation reports such as the evaluation of the Reducing African
American Infant and Child Deaths (RAACD) Initiative.
First 5 Sacramento Page 20 of 99 Evaluation Committee Meeting January 31, 2019

I N T R O D U C T I O N
FI RST 5 SA C RAME N T O: E VALUAT I ON RE PO R T FY 2 018 -2 01 9 — 10
Investments in Children, Families and Communities During FY 2018-19, First 5 invested a total of $20.6 million. The figure below shows how funds were
distributed across the different strategic result and administrative areas. The areas that received the
highest percentage of funding were Effective Parenting and School Readiness.
Expenses, by Content Area
Expense Area FY 2018-19
Effective Parenting 51%
School Readiness 20%
Health Access 7%
Child Care 5%
Administration 5%
Dental 3%
Nutrition 3%
Evaluation 2%
Community Building 2%
Source: FY 2018-19, First 5 Sacramento.
The table below shows expenditures by agency type from FY2018-19, with the largest percentage of
investment going to community-based agencies.
Percentage of Expenditures, by Agency Type
Agency Type FY 2018-19
Community-Based Agencies 59%
School Districts/COE 24%
County Government Agencies 2%
First 5 Commission 13%
Other Entities/Institutions 2%
Source: FY 2018-19, First 5 Sacramento.
First 5 Sacramento’s Strategic Hierarchy 2018-2021 The figure below shows First 5 Sacramento’s Strategic Hierarchy for fiscal years 2018-2021. This hierarchy
helps guide funding decisions, and also provides a framework for the evaluation. The three Priority Areas
(dark red) represent key areas in which the Commission wishes to see change in the county; the Goals
(orange) are First 5’s aspirations for all children and families in the county; the Service Results (yellow)
and Systems Results (green) are the direct changes or system changes First 5 seeks in order to make
progress toward the goal; and Service and Systems Results (yellow/green gradient) are the areas where
First 5 seeks both service and systems change to progress.
First 5 Sacramento Page 21 of 99 Evaluation Committee Meeting January 31, 2019

I N T R O D U C T I O N
FI RST 5 SA C RAME N T O: E VALUAT I ON RE PO R T FY 2 018 -2 01 9 — 11
First 5 Sacramento Strategic Hierarchy, FY2018-2021
First 5 Sacramento Page 22 of 99 Evaluation Committee Meeting January 31, 2019

I N T R O D U C T I O N
FI RST 5 SA C RAME N T O: E VALUAT I ON RE PO R T FY 2 018 -2 01 9 — 12
First 5 Sacramento’s Evaluation Framework In spring of 2018, an evaluation plan was developed to assess progress toward the results identified in
First 5 Sacramento’s strategic plan. The evaluation framework is anchored by key indicators for each
result (see Figure 4 below). Some of these indicators are specific to recipients of First 5-funded services,
while others pertain to the community level. This evaluation framework was developed at the beginning
of the funding period and has served as the foundation of the evaluation plan.
First 5 Sacramento Results Evaluation Framework
Goals Results Indicators
All children are healthy
R1: Decrease infant deaths
Percentage of pregnant women who began prenatal care in 1st trimester
Percentage of infants born with low birth weight
Percentage of infants born premature
Number / Rate of infant deaths by race/ethnicity by cause
R2. Increase prevalence & duration of breastfeeding
Percentage of infants breastfed at the hospital
Percentage of infants exclusively breastfed for at least 6 months after birth
R3. Decrease dental disease
Percentage of children connected to a regular dentist
Percentage of children 18 months and older who saw dentist in past 6 months
Percentage of children with untreated cavities
R4. Increase access to and utilization of medical/ homes (policy result)
Percentage of children with medical insurance
Percentage of children who have a regular medical provider
Percentage of children with well-child visit in last 12 months
All children are in an environment conducive to their development
R5. Increase availability of quality early care and education (policy result)
Percentage of children needing care for whom there are slots available
R6. Increase accessibility to affordable quality child care
Percentage of settings with increased Environment Rating Scale (ERS) and/or Classroom Assessment Scoring System (CLASS) scores
All children enter kindergarten ready to learn
R7. Increase children's, families', and schools' readiness for kindergarten
Percentage of children who have had a developmental screening in the past 12 months
Percentage of children who met developmental milestones
Percentage of children who are read to least 5 days/week
Percentage of kindergarteners who attended a short-term summer pre-K program
Percentage of kindergarteners ready for school
All families connect to communities
R8. Increase family connections to community resources
Percentage of parents who report utilization of community resources
Percentage of parents who report connectedness to their community
All families support children's development and safety
R9. Increase use of effective parenting
Percentage of parents with increased knowledge of parenting and child development
Percentage of parents with improved parenting attitudes
Percentage of parents with no recurrence of child maltreatment
R10. Decrease childhood injuries and death
Number of families receiving needed emergency child care
First 5 Sacramento Page 23 of 99 Evaluation Committee Meeting January 31, 2019
I N T R O D U C T I O N
FI RST 5 SA C RAME N T O: E VALUAT I ON RE PO R T FY 2 018 -2 01 9 — 13
Since 2016, the evaluation of First 5 Sacramento’s results follows a Results-Based Accountability (RBA)
framework, in that goals are measured with community indicators, and program performance is
measured by three types of indicators:
1) How much did we do? (Number of people served, number of services provided)
2) How well did we do it? (Was the model/program implemented as intended?)
3) Is anyone better off? (Participant outcomes, e.g. attitudes, behaviors, and wellbeing outcomes)
The primary data sources used in this evaluation include:
• Community indicator data: In keeping with RBA, data on community trends is presented for each
strategic result area. However, the time frames for such data often lag behind First 5 service data
by a year or two and thus cannot be directly linked to First 5’s efforts.
• First 5 service data: Most grantees provided client-level demographic and service data through a
data management system called Persimmony. Grantees who did not provide individual-level data
reported aggregate-level client and service data on a quarterly basis, in the form of performance
reports, and for some programs, other types of reporting documents. Figure 5 below shows
which grantees provided client-level data, and which ones provided only aggregate-level data.
• Family Information Form (FIF): The FIF is used to collect demographic information, as well as data
for specific indicators. Two pages ask questions about the parent or guardian, and another page
includes questions about the child. Clients of designated grantees complete the form at intake,
and, if the client is still engaged, at follow-up three to six months later.
• Program-specific outcome data: Some grantees provided outcome data specific to their program
to track changes in knowledge, attitudes, behaviors, and health measures, as well as the status of
referrals. These data come from sources such as surveys and follow-up calls.
• In-depth evaluations: In addition to the overall evaluation, in-depth evaluations were conducted
in four focus areas: Effective Parenting, Reducing African American Infant Deaths (RAACD), School
Readiness, and Systems Sustainability. While this comprehensive evaluation report highlights
some key findings from these evaluations, separate reports are available that provide greater
detail about the results for 2018-19 in these areas.
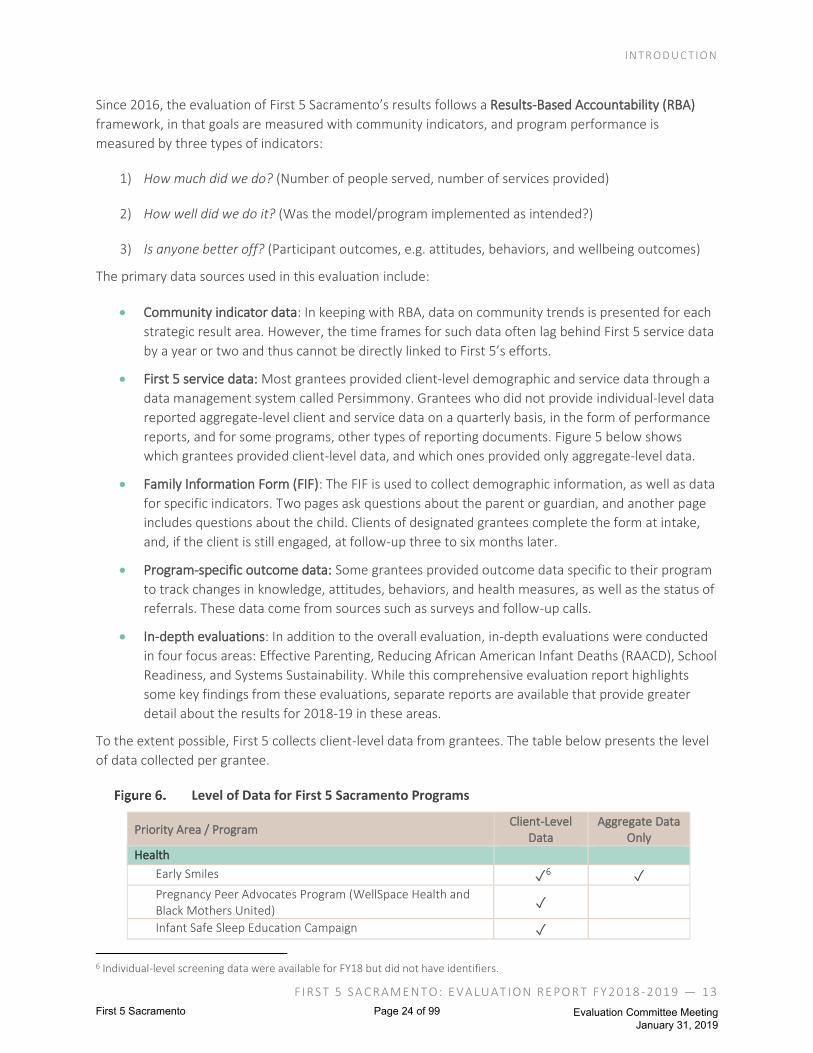
To the extent possible, First 5 collects client-level data from grantees. The table below presents the level
of data collected per grantee.
Level of Data for First 5 Sacramento Programs
Priority Area / Program Client-Level
Data Aggregate Data
Only
Health Early Smiles ✓6 ✓ Pregnancy Peer Advocates Program (WellSpace Health and Black Mothers United)
✓
Infant Safe Sleep Education Campaign ✓
6 Individual-level screening data were available for FY18 but did not have identifiers.
First 5 Sacramento Page 24 of 99 Evaluation Committee Meeting January 31, 2019

I N T R O D U C T I O N
FI RST 5 SA C RAME N T O: E VALUAT I ON RE PO R T FY 2 018 -2 01 9 — 14
Priority Area / Program Client-Level
Data Aggregate Data
Only
WIC (Breastfeeding) ✓
Early Care and Development Child Action, Inc. Quality Child Care Collaborative (QCCC) ✓7 ✓ Preschool Bridging Model Plus (PBM+) ✓8 ✓ Help Me Grow ✓
School Districts (9) ✓
Empowered Families 2-1-1 ✓ Sacramento Crisis Nursery ✓
Birth & Beyond ✓
Community Connections Grants ✓
7 Individual classroom-level data are available for assessment scores (such as ECERS). 8 Individual child data are provided by PBM+ in an Excel file.
First 5 Sacramento Page 25 of 99 Evaluation Committee Meeting January 31, 2019

P R O F I LE O F F I R S T 5 C L I E N T S
FI RST 5 SA C RAME N T O: E VALUAT I ON RE PO R T FY 2 018 -2 01 9 — 15
Profile of First 5 Clients
Profile of all Clients Served First 5 Sacramento funded services had substantial reach across the county, serving 44,874 duplicated
clients, including parents, children, and providers. Additionally, 19,976 unduplicated individuals received
a direct service, including 7,150 children, which represents 6% of the county’s children ages 0-5, down
from serving 13% of the county’s children in 2017-189. However, many more children and parents were
reached indirectly through systems change efforts and/ or programs that don’t collect individual level
data, such as Baby-Friendly hospitals, and public education campaigns on pregnancy stress, safe sleep,
and oral hygiene.
Reach of First 5 Sacramento, 2018-2019
Source: First 5 Sacramento Persimmony Database and First 5 Sacramento State Report, FY 2018-19.
The figure below shows the race/ethnicity of children served by First 5 for whom there is client-level data
available (aggregate data for children was often missing race and ethnicity detail), compared to the race
and ethnicity of children across the county. Amongst First 5 participants, children are most likely to be
Latino and African American (53%), a proportion greater than seen across the county’s population (44%).
Most (72%) children and parents’ primary language was English, and another 18% spoke Spanish. This
profile is consistent with that of families served in previous years.
9 6% = 7,150 served in 2018-19, as percent of county population for children 0-5 (117,791), based upon Kidsdata.org, 2018.
44,874
19,976
12,826
7,150
Duplicated clients Unduplicated clients Unduplicated families Unduplicated Children
First 5 Sacramento Page 26 of 99 Evaluation Committee Meeting January 31, 2019
P R O F I LE O F F I R S T 5 C L I E N T S
FI RST 5 SA C RAME N T O: E VALUAT I ON RE PO R T FY 2 018 -2 01 9 — 16
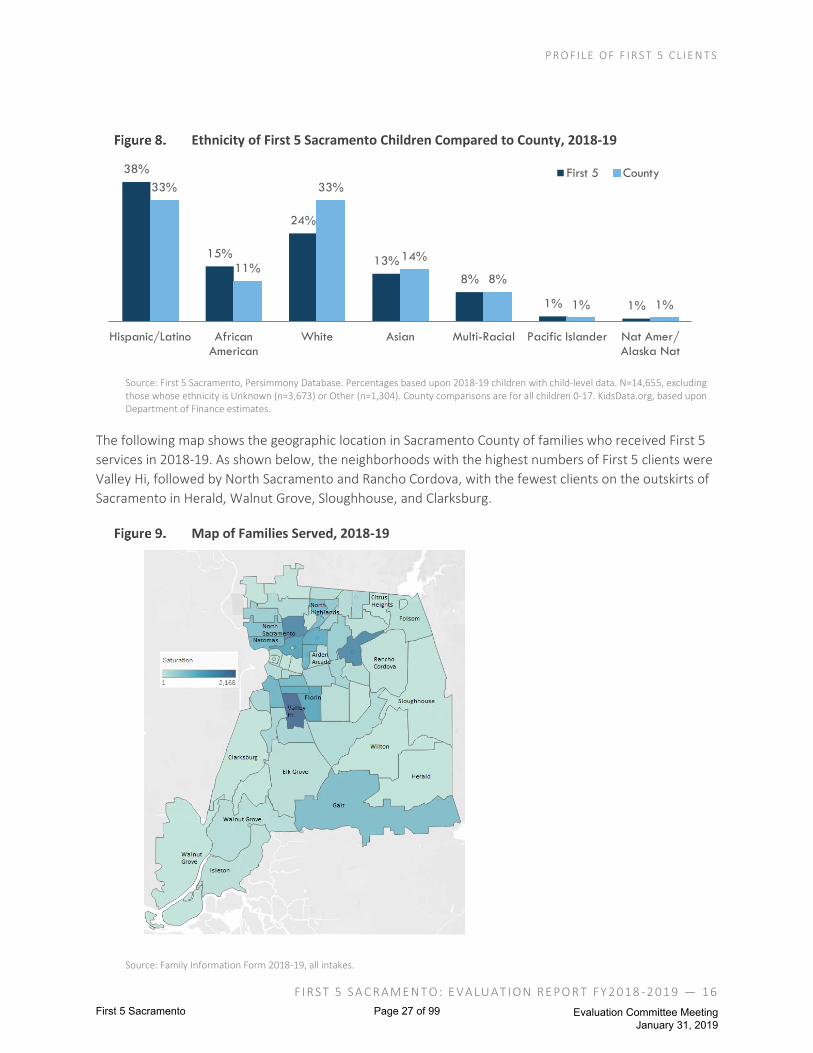
Ethnicity of First 5 Sacramento Children Compared to County, 2018-19
Source: First 5 Sacramento, Persimmony Database. Percentages based upon 2018-19 children with child-level data. N=14,655, excluding those whose ethnicity is Unknown (n=3,673) or Other (n=1,304). County comparisons are for all children 0-17. KidsData.org, based upon Department of Finance estimates.
The following map shows the geographic location in Sacramento County of families who received First 5
services in 2018-19. As shown below, the neighborhoods with the highest numbers of First 5 clients were
Valley Hi, followed by North Sacramento and Rancho Cordova, with the fewest clients on the outskirts of
Sacramento in Herald, Walnut Grove, Sloughhouse, and Clarksburg.
Map of Families Served, 2018-19
Source: Family Information Form 2018-19, all intakes.
38%
15%
24%
13%
8%
1% 1%
33%
11%
33%
14%
8%
1% 1%
Hispanic/Latino AfricanAmerican
White Asian Multi-Racial Pacific Islander Nat Amer/Alaska Nat
First 5 County
First 5 Sacramento Page 27 of 99 Evaluation Committee Meeting January 31, 2019
P R O F I LE O F F I R S T 5 C L I E N T S
FI RST 5 SA C RAME N T O: E VALUAT I ON RE PO R T FY 2 018 -2 01 9 — 17
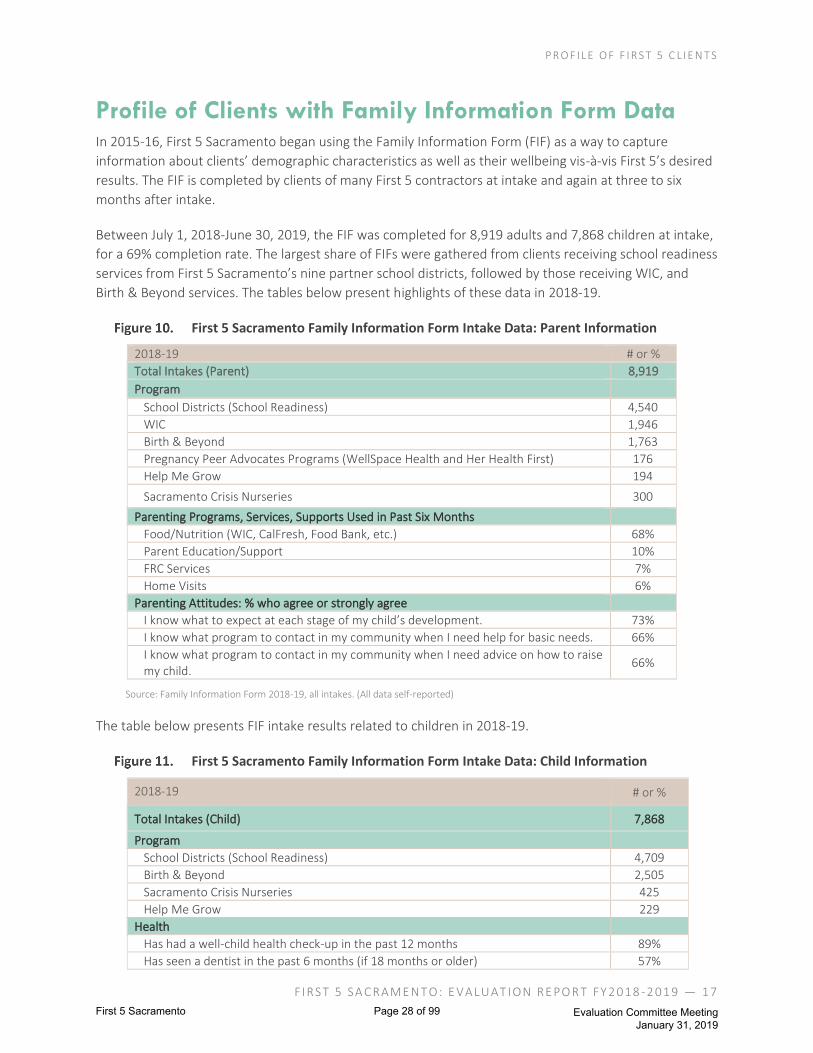
Profile of Clients with Family Information Form Data In 2015-16, First 5 Sacramento began using the Family Information Form (FIF) as a way to capture
information about clients’ demographic characteristics as well as their wellbeing vis-à-vis First 5’s desired
results. The FIF is completed by clients of many First 5 contractors at intake and again at three to six
months after intake.
Between July 1, 2018-June 30, 2019, the FIF was completed for 8,919 adults and 7,868 children at intake,
for a 69% completion rate. The largest share of FIFs were gathered from clients receiving school readiness
services from First 5 Sacramento’s nine partner school districts, followed by those receiving WIC, and
Birth & Beyond services. The tables below present highlights of these data in 2018-19.
First 5 Sacramento Family Information Form Intake Data: Parent Information
2018-19 # or %
Total Intakes (Parent) 8,919
Program School Districts (School Readiness) 4,540
WIC 1,946
Birth & Beyond 1,763
Pregnancy Peer Advocates Programs (WellSpace Health and Her Health First) 176
Help Me Grow 194
Sacramento Crisis Nurseries 300
Parenting Programs, Services, Supports Used in Past Six Months
Food/Nutrition (WIC, CalFresh, Food Bank, etc.) 68%
Parent Education/Support 10%
FRC Services 7%
Home Visits 6%
Parenting Attitudes: % who agree or strongly agree
I know what to expect at each stage of my child’s development. 73%
I know what program to contact in my community when I need help for basic needs. 66%
I know what program to contact in my community when I need advice on how to raise my child.
66%
Source: Family Information Form 2018-19, all intakes. (All data self-reported)
The table below presents FIF intake results related to children in 2018-19.
First 5 Sacramento Family Information Form Intake Data: Child Information
2018-19 # or %
Total Intakes (Child) 7,868
Program
School Districts (School Readiness) 4,709
Birth & Beyond 2,505
Sacramento Crisis Nurseries 425
Help Me Grow 229
Health
Has had a well-child health check-up in the past 12 months 89%
Has seen a dentist in the past 6 months (if 18 months or older) 57%
First 5 Sacramento Page 28 of 99 Evaluation Committee Meeting January 31, 2019
P R O F I LE O F F I R S T 5 C L I E N T S
FI RST 5 SA C RAME N T O: E VALUAT I ON RE PO R T FY 2 018 -2 01 9 — 18
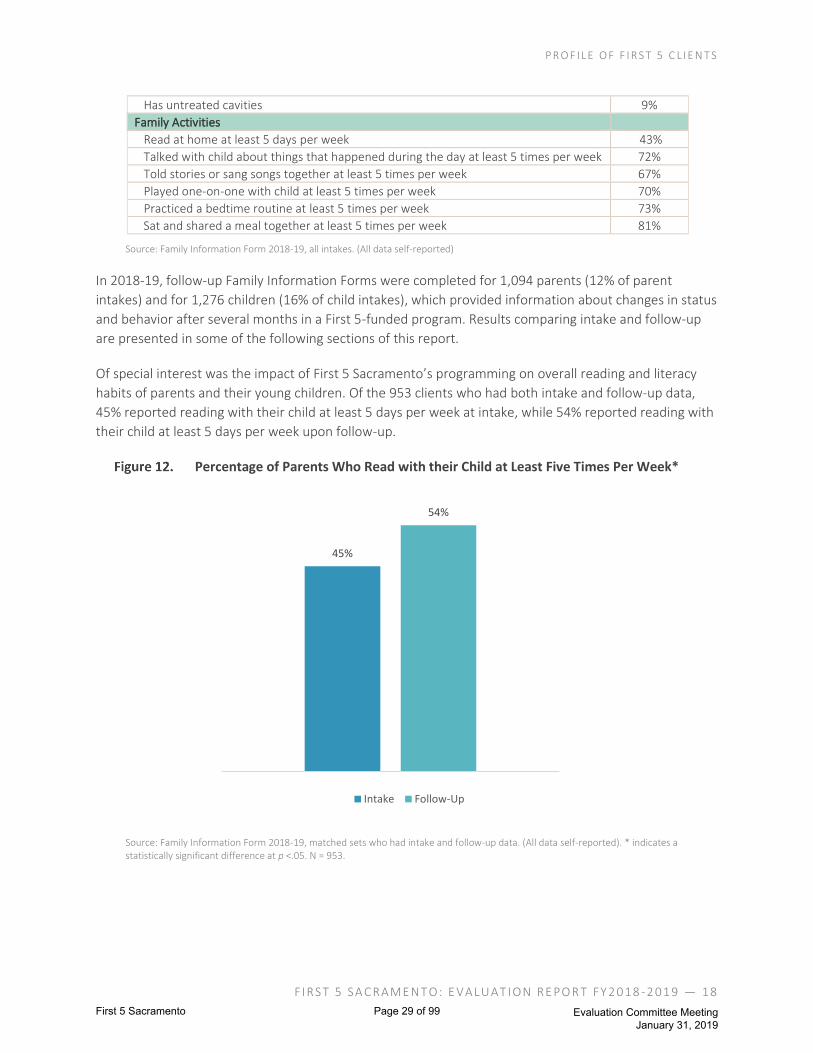
Has untreated cavities 9%
Family Activities
Read at home at least 5 days per week 43%
Talked with child about things that happened during the day at least 5 times per week 72%
Told stories or sang songs together at least 5 times per week 67%
Played one-on-one with child at least 5 times per week 70%
Practiced a bedtime routine at least 5 times per week 73%
Sat and shared a meal together at least 5 times per week 81%
Source: Family Information Form 2018-19, all intakes. (All data self-reported)
In 2018-19, follow-up Family Information Forms were completed for 1,094 parents (12% of parent
intakes) and for 1,276 children (16% of child intakes), which provided information about changes in status
and behavior after several months in a First 5-funded program. Results comparing intake and follow-up
are presented in some of the following sections of this report.
Of special interest was the impact of First 5 Sacramento’s programming on overall reading and literacy
habits of parents and their young children. Of the 953 clients who had both intake and follow-up data,
45% reported reading with their child at least 5 days per week at intake, while 54% reported reading with
their child at least 5 days per week upon follow-up.
Percentage of Parents Who Read with their Child at Least Five Times Per Week*
Source: Family Information Form 2018-19, matched sets who had intake and follow-up data. (All data self-reported). * indicates a statistically significant difference at p <.05. N = 953.
45%
54%
Intake Follow-Up
First 5 Sacramento Page 29 of 99 Evaluation Committee Meeting January 31, 2019

R E S U LT 1 : D E C R E A S E I N F A N T D E A T H
FI RST 5 SA C RAME N T O: E VALUAT I ON RE PO R T FY 2 018 -2 01 9 — 19
Result 1: DECREASE INFANT DEATH
This result area is related to the Commission’s efforts to reduce African American infant deaths. ASR
produced a full report for FY 2018-19, the highlights of which are presented here. Please visit First 5
Sacramento’s website for the full report (see Results/ Evaluation Reports).
Countywide Trends A primary predictor of infant death is premature birth, defined as birth that occurs before 37 weeks.
Because of the instability of relatively small numbers, the percentage of infants born premature was
calculated as rolling averages (RA) over multi-year periods. Countywide, the percentage of infants born
preterm was unchanged, from 8.7% in 2012-14 to 8.6% in 2015-1710 and the county. Overall, Sacramento
County fared worse than the state (8.8%). Similarly, the percentage of pre-term births amongst African
American infants decreased from 2012-14 (11.7%) to 2015-17 (11.5%). This rate was 1.5 times the rate
for non-African American infants (8.3%), exceeding the Healthy People 2020 benchmark of 11.4%.
Percentage of Babies Born Premature, by Race/Ethnicity
Source: Sacramento County, Department of Health Services, Public Health Division, Epidemiology Program, Birth Statistical Master Files. Note: State rates available in 1-year averages, not 3-year rolling averages. Source: Centers for Disease Control and Prevention, WONDER.
Because of the instability of relatively small numbers, infant mortality rates by race/ethnicity were
calculated as Rolling Average (RA) rates over multi-year periods. The rate of infant deaths remained stable
(1.7% change), from 4.6 deaths per 1,000 live births in 2012-14 to 4.7 in 2015-17, though worse (111%)
than the state average (4.2). While rates improved for African Americans (10.84 to 8.28, respectively),
African-American infants are still nearly twice as likely to die than non-African-American infants (4.28%),
exceeding the Healthy People 2020 target (6.0).
10 United States Department of Health and Human Services (US DHHS), Centers for Disease Control and Prevention (CDC), National Center for Health Statistics (NCHS), Division of Vital Statistics, Natality public-use data 2007-2017, on CDC WONDER Online Database, September 2019. Accessed at http://wonder.cdc.gov/natality-current.html on Sep 20, 2019 3:24:05 PM.
11.7% 11.7% 11.5%
8.7% 8.6%
RA 2012-2014 RA 2013-2015 RA 2014-2016 RA 2015-2017
Sac Black/African American
Sac Non-Black/AfricanAmericanSacramento
CA
HP 2020 Objective: 11.4%
START DATE Cultural Broker: 2014
First 5 Sacramento Page 30 of 99 Evaluation Committee Meeting January 31, 2019

R E S U LT 1 : D E C R E A S E I N F A N T D E A T H
FI RST 5 SA C RAME N T O: E VALUAT I ON RE PO R T FY 2 018 -2 01 9 — 20
Rate of Infant Mortality (Deaths per 1,000 live births)
Source: Number of Sacramento County infant deaths in 2012-2017: All (81), African American (14). Source: California Department of Public Health. Sacramento County, Department of Health Services, Public Health Division, Epidemiology Program, Birth Statistical Master Files. Rate is per 1,000 infants.
Impact of First 5 Sacramento in FY 2018-19 In 2013, the Sacramento County Blue Ribbon Commission on Disproportionate African American Child
Deaths called on service agencies and community leaders to take immediate action to reduce preventable
child mortality in the county, with an emphasis on addressing the disproportionality in African American
deaths. First 5 Sacramento funded three strategies to address perinatal and infant death in six
neighborhoods that are characterized by high African American infant death rates:
1. The Pregnancy Peer Support program provided by Black Mothers United and WellSpace Health
2. Safe Sleep Baby campaign provided by the Child Abuse Prevention Center (CAPC)
3. Perinatal Education Campaign provided by Runyon Saltzman, Inc. (RSE)
The efforts and outcomes of these strategies will be summarized here, based upon the recent evaluation
report prepared by Applied Survey Research.
Pregnancy Peer Support
The Pregnancy Peer Support Program started in Sacramento in 2014 and provided services to promote
education, support and access to critical services like prenatal care to support healthy pregnancies and
births. However, full implementation of the initiative to improve outcomes of African American mothers
and infants began in 2015. In FY2018-19, the Pregnancy Peer Support Program supported a total of 276
African American expectant mothers to promote better birth outcomes. Two organizations implemented
the Pregnancy Peer Support program: Her Health First (HHF) and WellSpace Health (WSH)11.
HER HEALTH FIRST
Her Health First’s Black Mothers United (BMU) program provided case management to address the social
determinants of health with the women they serve. Through direct outreach in communities
11 WellSpace Health ended its existing program in December 2018, serving its 60 women, who were existing clients from FY 2017-18, from July 1, 2018 thru December 31, 2018.
4.6 4.7
10.8
8.3
3
4
5
6
7
8
9
10
11
12
RA 2012-14 RA 2013-15 RA 2014-16 RA 2015-17
Sacramento
California
Sac African American
Sac Non-African American
HP 2020 Objective: 6.0
START DATES Cultural Broker: 2014 Safe Sleep Baby: 2014
First 5 Sacramento Page 31 of 99 Evaluation Committee Meeting January 31, 2019

R E S U LT 1 : D E C R E A S E I N F A N T D E A T H
FI RST 5 SA C RAME N T O: E VALUAT I ON RE PO R T FY 2 018 -2 01 9 — 21
characterized by high African American infant death rates and by partnering with community-based
organizations and social service agencies, BMU’s pregnancy coaches sought out pregnant African
American women who needed support. Participants’ needs and risks were assessed, individualized care
plans were developed, and a wide array of educational and referral services were provided.
As one BMU Pregnancy Coach, and former BMU client explained, “It makes me feel so good I can make a
difference in somebody else’s life, like I had a difference made in mine.” From a client perspective, the
attraction is social connectedness: “What keeps me coming to BMU is the support from other black
women who understand where you’re coming from and what you’re going through.”
HIGHLIGHTS OF BMU ACCOMPLISHMENTS DURING THE 2018-19 PERIOD INCLUDED:
Highlights of BMU accomplishments during the 2018-19 period included:
Black Mothers United
216 women participated in weekly check-ins and home visits (215 consented for evaluation)
38% of women served began prenatal care by their first trimester12
The most frequently cited psychosocial risk factors women reported were being single without a partner (35%), having unstable housing (27%), and not graduating high school (27%)
The most frequently cited health factors women reported were anxiety/depression (28%) and not taking prenatal vitamins (17%)
The most commonly reported infant safety risk factors reported at intake were not owning a crib (59%) and no plan for a car seat (28%)
Most psychosocial risk factors decreased (greatest decrease included those who reported housing insecurity)
76% of the babies born were of a healthy weight and gestational age
56% of clients had a well-baby visit by program exit
One set of twins stillbirth at 32 weeks
Source: Black Mothers United Health Assessment Intake, Pregnancy Outcomes Form 2018-2019.
From July 2018 to June 2019, 216 pregnant African American women were served through the BMU
program, and 215 consented to be included in the evaluation. Almost half of them (49%) resided in one of
the seven high-risk target neighborhoods of Sacramento County.
Based upon initial assessments, participants faced a variety of challenges, including unstable housing
situations (27%) and lack of transportation (20%). Almost half of clients (43%) were on CalWORKs, and
71% used WIC services for nutritional support. Almost one third of mothers were dealing with moderate
to high depression (28%) and 11% faced nutritional deficiencies. Most (59%) did not have a plan for a crib
to sleep their baby. As a result of referrals and intensive case management, mothers had fewer risk
factors by the end of the program. For instance, the percentage of mothers with maternal anxiety and
12 However, there were high amounts of unreported data in this category. Results are to be cautiously interpreted.
First 5 Sacramento Page 32 of 99 Evaluation Committee Meeting January 31, 2019

R E S U LT 1 : D E C R E A S E I N F A N T D E A T H
FI RST 5 SA C RAME N T O: E VALUAT I ON RE PO R T FY 2 018 -2 01 9 — 22
depression decreased from 28% at intake to 15% at follow up, and the percentage of mothers who did
not have a crib reduced from 59% at intake to 6% at follow up.
In FY 2018-19, there was a set of twins who were stillborn at 32 weeks. There were 102 live births in the
BMU program, including 92 singletons and 10 twins. Of these, 83% were born at a healthy birth weight,
80% were born full term, and combined, 76% had a healthy birth outcome (healthy weight and full term).
The percentage of singletons with a healthy birth was 82%. Sadly, there was one infant delivered at 32
weeks who died shortly afterward.
A linear regression was conducted on the continuous birth outcome variable (unhealthy birthweight and
gestational age, either unhealthy birthweight or gestational age, and neither unhealthy birthweight nor
gestational age). Not accessing regular prenatal care, two or more previous miscarriages, and number of
weekly check-ins all independently predicted having an adverse birth outcome. Importantly, number of
check-ins with their pregnancy coach was a significant predictor of having an adverse birth outcome (i.e.,
those with less check-ins were more likely to have an adverse birth outcome).
Client Success Stories
Two BMU coaches shared the success stories below about each of their clients who were positively
impacted by the program’s services and supports. These stories have been edited for clarity and brevity.
One client started the BMU program pregnant and homeless, living in her car with her 12-year-old son. Once
connected to Black Mothers United, her coach helped her reach out to County Social Services for the Homeless
Support Program. She moved into a home the week she had her baby. Although it was a small 1 bedroom, she was
happy to have a roof over her head. The client’s baby was born at a healthy weight and gestational age. Since then,
the client has moved to a bigger home with two bedrooms and she is doing very well. She recently told her coach that
she is learning to put her children first and she feels good about it.
Another client was a mother of five who enrolled in the BMU program early in her 2nd trimester. Although she was
young, she understood what she needed to do to beat the odds in spite of the obstacles she faced. When she was
first enrolled in BMU, she had an open CPS case. When the coach first met the client and learned of her story, it
became apparent that the client felt frustrated with how to deal with various aspects of the system. The first
challenge was a custody battle between the client and her older children’s father and grandmother, who had been
granted temporary custody. The client was experiencing challenges in communicating effectively with the social
worker assigned to her case. In addition to the custody battle, the lease on the client’s home was about to end,
threatening to leave her homeless. The coach could sense that the client, even though already four months pregnant,
was not going to give up and that she needed guidance and an advocate to help her navigate the situation. The
coach met with the client’s CPS worker and a Black Child Legacy Campaign cultural broker to inform them about the
client’s progress and needs, and make sure that all three were working together with the client’s best interest at
heart. Once this team was established, the client became more confident in herself and her abilities. She gained
employment, found a place to live, and met all the recommendations of the court, which soon led to her regaining
custody of her children. The client continued to work up until her delivery date and gave birth to a beautiful and
healthy baby girl weighing 7 pounds. The client has remained active in the BMU program through her postpartum
period and connects with her coach regularly. She and her family are happy, and she plans to return to work soon.
As one BMU Pregnancy Coach, and former BMU client explained, “It makes me feel so good I can make a
difference in somebody else’s life, like I had a difference made in mine.” From a client perspective, the
First 5 Sacramento Page 33 of 99 Evaluation Committee Meeting January 31, 2019

R E S U LT 1 : D E C R E A S E I N F A N T D E A T H
FI RST 5 SA C RAME N T O: E VALUAT I ON RE PO R T FY 2 018 -2 01 9 — 23
attraction is social connectedness: “What keeps me coming to BMU is the support from other black
women who understand where you’re coming from and what you’re going through.”
WellSpace Health (WSH) operated a perinatal program out of two South Sacramento Clinics from
July 1, 2015 to December 31, 2018. WSH served women who lived in the areas with the highest
levels of African American infant death.
WSH’s “Perinatal Support Advisors” used the Nurturing Parenting Program (NPP) for Prenatal
Families, which was made up of 18 prenatal visits with a Perinatal Support Advisor. The NPP Prenatal
Program provided pregnant women with education on the effects of alcohol, tobacco, nutrition, and
stress on the unborn baby, as well as providing information about how to have a healthy baby.
Additionally, Perinatal Support Advisors provided two risk factor education sessions and delivered at
least one postpartum check-in within a month of delivery. Social workers also provided customized
support for pregnant mothers and could assist them in connecting to resources within WellSpace or
in the community.
FY 2018-19 was a transitional year for WSH perinatal programming; it focused on closing out the
perinatal program. From July 1, 2018 through December 31, 2018, WSH’s perinatal program served a
total of 60 clients. All of these women (100%) identified as African American. By the end of
December 43 of them delivered, 9.3% (4/43) of infants were born preterm and 11.6% (5/43) of
infants were born with low birthweight. No infant deaths were reported from this cohort.
Starting January 1, 2019 WSH began phasing in a new approach to provide ultrasounds, psychosocial
support, and care coordination to BMU clients. Seven pregnant women were provided with
ultrasounds from January to June 2019.
First 5 Sacramento Page 34 of 99 Evaluation Committee Meeting January 31, 2019
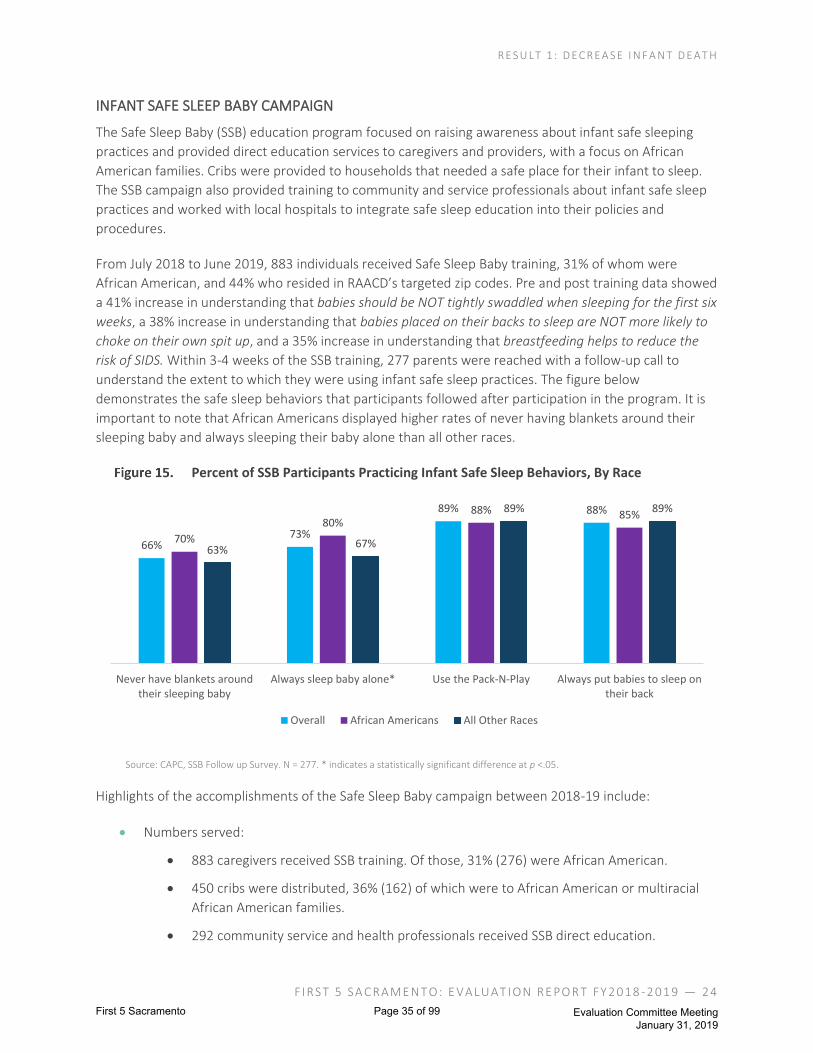
R E S U LT 1 : D E C R E A S E I N F A N T D E A T H
FI RST 5 SA C RAME N T O: E VALUAT I ON RE PO R T FY 2 018 -2 01 9 — 24
INFANT SAFE SLEEP BABY CAMPAIGN
The Safe Sleep Baby (SSB) education program focused on raising awareness about infant safe sleeping
practices and provided direct education services to caregivers and providers, with a focus on African
American families. Cribs were provided to households that needed a safe place for their infant to sleep.
The SSB campaign also provided training to community and service professionals about infant safe sleep
practices and worked with local hospitals to integrate safe sleep education into their policies and
procedures.
From July 2018 to June 2019, 883 individuals received Safe Sleep Baby training, 31% of whom were
African American, and 44% who resided in RAACD’s targeted zip codes. Pre and post training data showed
a 41% increase in understanding that babies should be NOT tightly swaddled when sleeping for the first six
weeks, a 38% increase in understanding that babies placed on their backs to sleep are NOT more likely to
choke on their own spit up, and a 35% increase in understanding that breastfeeding helps to reduce the
risk of SIDS. Within 3-4 weeks of the SSB training, 277 parents were reached with a follow-up call to
understand the extent to which they were using infant safe sleep practices. The figure below
demonstrates the safe sleep behaviors that participants followed after participation in the program. It is
important to note that African Americans displayed higher rates of never having blankets around their
sleeping baby and always sleeping their baby alone than all other races.
Percent of SSB Participants Practicing Infant Safe Sleep Behaviors, By Race
Source: CAPC, SSB Follow up Survey. N = 277. * indicates a statistically significant difference at p <.05.
Highlights of the accomplishments of the Safe Sleep Baby campaign between 2018-19 include:
• Numbers served:
• 883 caregivers received SSB training. Of those, 31% (276) were African American.
• 450 cribs were distributed, 36% (162) of which were to African American or multiracial
African American families.
• 292 community service and health professionals received SSB direct education.
66%73%
89% 88%
70%
80%88% 85%
63%67%
89% 89%
Never have blankets aroundtheir sleeping baby
Always sleep baby alone* Use the Pack-N-Play Always put babies to sleep ontheir back
Overall African Americans All Other Races
First 5 Sacramento Page 35 of 99 Evaluation Committee Meeting January 31, 2019

R E S U LT 1 : D E C R E A S E I N F A N T D E A T H
FI RST 5 SA C RAME N T O: E VALUAT I ON RE PO R T FY 2 018 -2 01 9 — 25
• All 8 Sacramento birthing hospitals routinely screened mothers for their plans to sleep
their babies at home; these hospitals distributed 126 cribs to families who received SSB
education.
• Outcomes: Follow-up interviews with 245 African American caregivers receiving training and a
crib showed that of those who had both intake and follow-up data:
• 85% always put their baby to sleep on their backs.
• 70% never have blankets around their sleeping baby.
• 80% never sleep their baby with another adult or child.
In addition to safe sleep education for parents, the Safe Sleep Baby Campaign accomplished the
following:
• 292 community-based service providers and one medical provider participated in “train-the-
trainer” workshops to help impart safe sleep knowledge to their clients and patients.
• 450 cribs were provided by the Cribs4Kids program to parents and caregivers. Approximately 36%
of all cribs distributed were to African American parents.
PERINATAL EDUCATION CAMPAIGN
The third strategy funded by First 5 was a
public education campaign aimed to raise
awareness about the disparity in rates of
infant deaths among African Americans and
all other races, and to connect African
American mothers to services that help
support pregnancies and infant well-being.
Runyon Saltzman, Inc. (RSE) managed this
comprehensive campaign that included
community events, and print/ digital media
campaign strategy development. These initiatives were targeted toward low-income African American
women in their childbearing years (ages 18-34) who live in the areas of Sacramento with the highest
reported levels of African American child deaths.
• In February 2019, the Pride & Joy Community Baby Shower was convened at the Fruitridge
Community Collaborative. This was the fourth annual baby shower event conducted, and it
provided parents with information and demonstrations related to a healthy pregnancy and safe
sleep practices, as well as connections to local resources (especially the Sac Healthy Baby
campaign).
• Approximately 113 people attended this event, 104 of which were pregnant or new
mothers. Many perinatal service providers, including First 5 funded partners, attended
these events and provided valuable information to the guests in attendance, as well as
providing referrals to their specific outreach programs. RSE connected with local
companies, churches, and community partners to secure donations for the event. This
First 5 Sacramento Page 36 of 99 Evaluation Committee Meeting January 31, 2019

R E S U LT 1 : D E C R E A S E I N F A N T D E A T H
FI RST 5 SA C RAME N T O: E VALUAT I ON RE PO R T FY 2 018 -2 01 9 — 26
resulted in significant giveaways at the baby shower such as baby clothing, diapers,
wipes, books, bibs, and gift baskets.
• There were 2,170 visits to the SacHealthyBaby website by 1,874 users.
• A large part of FY2018-2019 was devoted to campaign strategy development for a new joint
campaign with the Sacramento County Department of Public Health. In conjunction with Earth
Mama Healing, eight formative focus groups were attended by a total of 58 women who resided
in the high-risk neighborhoods identified by the Blue Ribbon Commission. The purpose of these
focus groups was to gather insights to inform future campaign development. Additionally, RSE
worked with Her Health First to conduct two listening sessions in April 2019 with 27 African
American community members in order to better understand what mothers, fathers, social
support program staff, and stakeholders believe are the causes of infant mortality and what can
be done to drive change.
SYSTEMS APPROACHES TO DECREASING INFANT DEATH
First 5 supported a systems approach to reinforce collaborative efforts to decrease infant death. First 5 served on the Reduction of African American Child Deaths (RAACD) Steering Committee to help bring about equitable investment and systemic impact across partners. As an example of this work, the National Association of Counties honored 2019 awardee Phil Serna and the Sacramento First 5 Commission for their efforts on a groundbreaking policy resolution written and adopted by Sacramento County. This resolution promoted efforts to reduce African American infant deaths and encouraged other counties to follow suit to do this vital work within their communities.
First 5 also promoted education and outreach through Sac Healthy Baby for prenatal care education and
referrals, as well as through the Perinatal Education Campaign to increase awareness of safe sleep
practices. Moreover, to support the Safe Sleep Baby education program from a systems perspective, First
5 encouraged hospitals to adopt policies that promote safe sleep and explored MAA reimbursement
potential for the Pregnancy Peer Mentors program (low potential), and the possibility of instead billing
Medi-Cal’s Comprehensive Perinatal Services Program (CPSP).
Summary • The Pregnancy Peer Support program helped African American mothers reduce socio-economic
and health risk factors and deliver healthy babies. Through Her Health First’s Black Mothers United program, 215 women received weekly contact including education, referrals and any other support needed to address risks to healthy birth. There were 102 live births in the program, including 92 singletons and 10 twins. Of these, 83% were born at a healthy birth weight, 80% were born full term, and combined, 76% had a healthy birth outcome (birth that is at healthy weight and full term).
• Safe Sleep Baby showed statistically significant impacts on parents’ knowledge and practices related to safe sleep strategies. There were 883 individuals who received the Safe Sleep Baby training, 31% of whom were African American, and 44% resided in RAACD’s targeted zip codes. Pre and post measures indicated significant increases in knowledge as well as use of practices that promote safe sleep. In addition, Safe Sleep Baby trained 292 community-based service providers and one medical provider, and 450 cribs were provided by the Cribs4Kids program to parents and caregivers, approximately 36% of which went to African American parents.
First 5 Sacramento Page 37 of 99 Evaluation Committee Meeting January 31, 2019

R E S U LT 1 : D E C R E A S E I N F A N T D E A T H
FI RST 5 SA C RAME N T O: E VALUAT I ON RE PO R T FY 2 018 -2 01 9 — 27
• Runyon-Saltzman, Inc (RSE), First 5, Sacramento County Public Health, the Sac Healthy Baby
Collaborative, and community partners developed strategies for the next Perinatal Education
Campaign. Additionally, the annual Pride & Joy Community Baby Shower reached 113 people,
104 of which were pregnant or new mothers. There were 2,170 visits to the SacHealthyBaby
website by 1,874 users.
• First 5 supported a systems approach to reinforce collaborative efforts to decrease infant death.
Efforts include serving on the Reduction of African American Child Deaths (RAACD) Steering
Committee to help bring about equitable investment and systemic impact across partners, as well
as exploring reimbursement potential for the Pregnancy Peer Support program.
• Taken together, efforts from these strategies to reduce African American child death have shown
signs of positive impact. Overall for African Americans in the County, between 2012-14 and 2015-
17 there was a:
• 23% decrease in the rate of African American infant deaths, and a 42% decrease in
disparity with all infant deaths among other races.
• 2% decrease in the percentage of African American babies born preterm, and a 6%
decrease in disparity between African American preterm births and all other preterm
births.
• 57% decrease in African American infant sleep related deaths, and a 68% decrease in
disparity between deaths amongst African American babies and babies of other races.
First 5 Sacramento Page 38 of 99 Evaluation Committee Meeting January 31, 2019
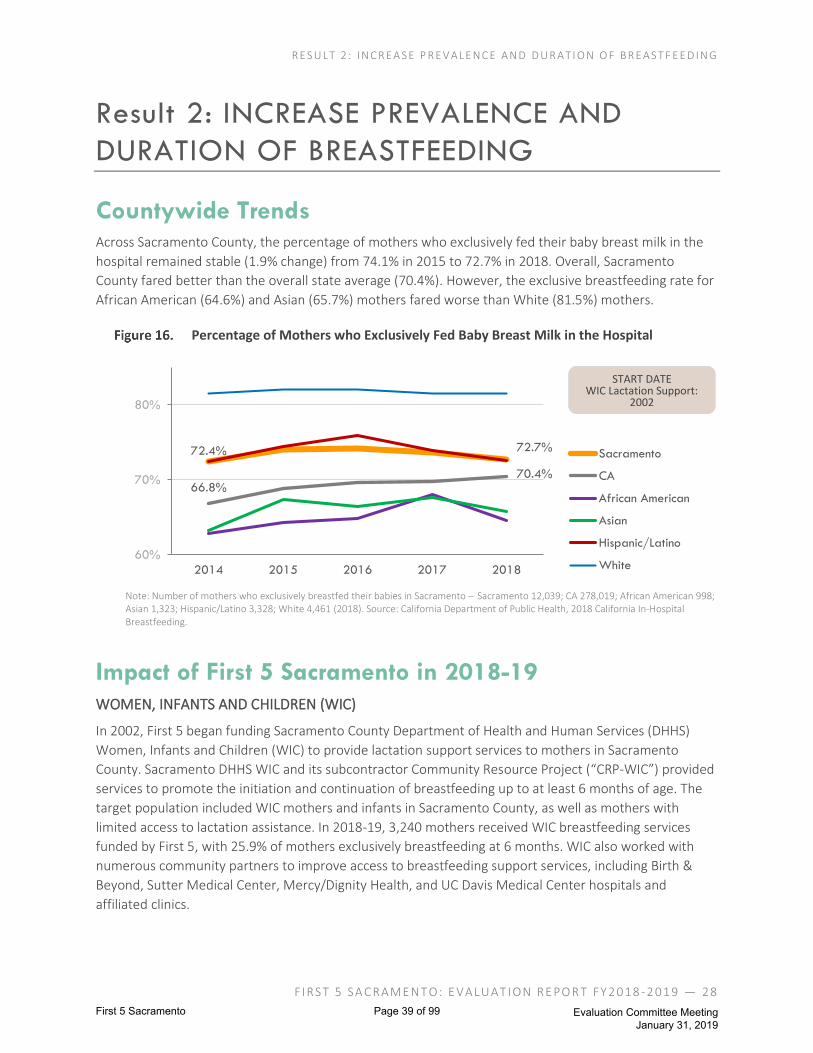
R E S U LT 2 : I N C R E A S E P R E V A LE N C E A N D D U R A T I O N O F B R E A S T F E E D I N G
FI RST 5 SA C RAME N T O: E VALUAT I ON RE PO R T FY 2 018 -2 01 9 — 28
Result 2: INCREASE PREVALENCE AND
DURATION OF BREASTFEEDING
Countywide Trends Across Sacramento County, the percentage of mothers who exclusively fed their baby breast milk in the
hospital remained stable (1.9% change) from 74.1% in 2015 to 72.7% in 2018. Overall, Sacramento
County fared better than the overall state average (70.4%). However, the exclusive breastfeeding rate for
African American (64.6%) and Asian (65.7%) mothers fared worse than White (81.5%) mothers.
Percentage of Mothers who Exclusively Fed Baby Breast Milk in the Hospital
Note: Number of mothers who exclusively breastfed their babies in Sacramento – Sacramento 12,039; CA 278,019; African American 998; Asian 1,323; Hispanic/Latino 3,328; White 4,461 (2018). Source: California Department of Public Health, 2018 California In-Hospital Breastfeeding.
Impact of First 5 Sacramento in 2018-19
WOMEN, INFANTS AND CHILDREN (WIC)
In 2002, First 5 began funding Sacramento County Department of Health and Human Services (DHHS)
Women, Infants and Children (WIC) to provide lactation support services to mothers in Sacramento
County. Sacramento DHHS WIC and its subcontractor Community Resource Project (“CRP-WIC”) provided
services to promote the initiation and continuation of breastfeeding up to at least 6 months of age. The
target population included WIC mothers and infants in Sacramento County, as well as mothers with
limited access to lactation assistance. In 2018-19, 3,240 mothers received WIC breastfeeding services
funded by First 5, with 25.9% of mothers exclusively breastfeeding at 6 months. WIC also worked with
numerous community partners to improve access to breastfeeding support services, including Birth &
Beyond, Sutter Medical Center, Mercy/Dignity Health, and UC Davis Medical Center hospitals and
affiliated clinics.
72.4% 72.7%
66.8%70.4%
60%
70%
80%
2014 2015 2016 2017 2018
Sacramento
CA
African American
Asian
Hispanic/Latino
White
START DATE WIC Lactation Support:
2002
First 5 Sacramento Page 39 of 99 Evaluation Committee Meeting January 31, 2019
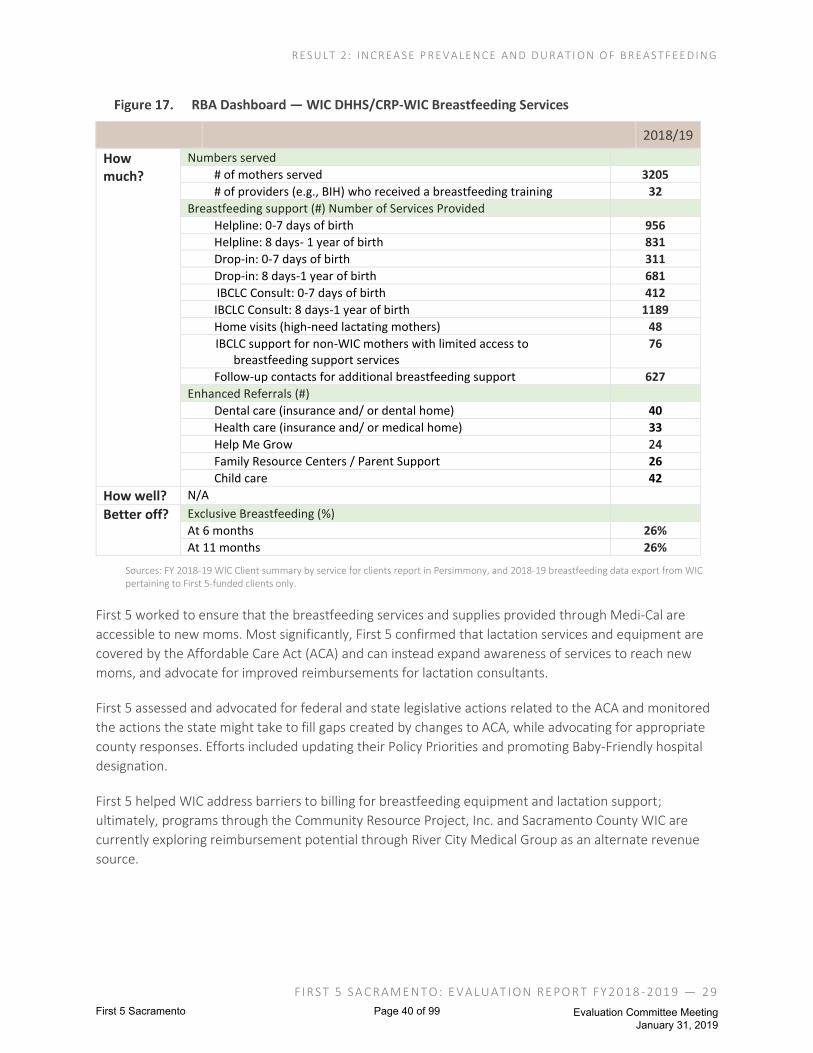
R E S U LT 2 : I N C R E A S E P R E V A LE N C E A N D D U R A T I O N O F B R E A S T F E E D I N G
FI RST 5 SA C RAME N T O: E VALUAT I ON RE PO R T FY 2 018 -2 01 9 — 29
RBA Dashboard — WIC DHHS/CRP-WIC Breastfeeding Services
2018/19
How much?
Numbers served
# of mothers served 3205
# of providers (e.g., BIH) who received a breastfeeding training 32
Breastfeeding support (#) Number of Services Provided
Helpline: 0-7 days of birth 956
Helpline: 8 days- 1 year of birth 831
Drop-in: 0-7 days of birth 311
Drop-in: 8 days-1 year of birth 681
IBCLC Consult: 0-7 days of birth 412
IBCLC Consult: 8 days-1 year of birth 1189
Home visits (high-need lactating mothers) 48
IBCLC support for non-WIC mothers with limited access to breastfeeding support services
76
Follow-up contacts for additional breastfeeding support 627
Enhanced Referrals (#)
Dental care (insurance and/ or dental home) 40
Health care (insurance and/ or medical home) 33
Help Me Grow 24
Family Resource Centers / Parent Support 26
Child care 42
How well? N/A
Better off? Exclusive Breastfeeding (%)
At 6 months 26%
At 11 months 26%
Sources: FY 2018-19 WIC Client summary by service for clients report in Persimmony, and 2018-19 breastfeeding data export from WIC pertaining to First 5-funded clients only.
First 5 worked to ensure that the breastfeeding services and supplies provided through Medi-Cal are
accessible to new moms. Most significantly, First 5 confirmed that lactation services and equipment are
covered by the Affordable Care Act (ACA) and can instead expand awareness of services to reach new
moms, and advocate for improved reimbursements for lactation consultants.
First 5 assessed and advocated for federal and state legislative actions related to the ACA and monitored
the actions the state might take to fill gaps created by changes to ACA, while advocating for appropriate
county responses. Efforts included updating their Policy Priorities and promoting Baby-Friendly hospital
designation.
First 5 helped WIC address barriers to billing for breastfeeding equipment and lactation support;
ultimately, programs through the Community Resource Project, Inc. and Sacramento County WIC are
currently exploring reimbursement potential through River City Medical Group as an alternate revenue
source.
First 5 Sacramento Page 40 of 99 Evaluation Committee Meeting January 31, 2019

R E S U LT 2 : I N C R E A S E P R E V A LE N C E A N D D U R A T I O N O F B R E A S T F E E D I N G
FI RST 5 SA C RAME N T O: E VALUAT I ON RE PO R T FY 2 018 -2 01 9 — 30
Client Success Story: WIC
A WIC-certified International Board-Certified Lactation Consultant (ICBLC) described one client’s
experience utilizing WIC DHHS services. The client is a 34-year-old single mother of one young child, who
separated from her husband a year ago. She discovered WIC for the very first time one sleep-deprived
night, when she put an emergency ‘SOS’ out on her Facebook page begging for help with her son's
feeding issues. Her newborn baby was having trouble breastfeeding, taking a bottle, even just swallowing
in general, and she was desperate to find a way to get him to eat. Another mom replied that WIC had
IBCLCs available for breastfeeding help, and she made the phone call to the breastfeeding support line
first thing the following morning. Mom described, "I had been worrying that I couldn't afford quality
breastfeeding advice… learning that I could be seen at WIC free of charge was a major game changer for
baby and me!"
Mom and her son received breastfeeding guidance, including weighted feeds, for several months, starting
with several times a week, and as things improved, slowly decreased to biweekly, then monthly, as the
baby's health stabilized. Mom and her son continue to be seen at the WIC office for breastfeeding help
for maintenance every few months, as she has elected to pursue extended breastfeeding. Additional
support received includes nutritional advice for her son from the WIC office, participation in the WIC
stamp program, developmental support for her son from Help Me Grow, and additional help from the
Sacramento Children's Home and Child Action.
The IBCLCs at WIC were able to positively impact mom and baby, with both benefiting tremendously from
the initial breastfeeding consultations. WIC was able to give crucial advice and moral support to help
improve the breastfeeding relationship, and help the baby start to gain weight and sleep better at night.
The ability to receive extended breastfeeding support, which lasted over one year, and continues to this
day, has been a key factor in supporting mom's ability to provide valuable breastmilk to her child into his
toddlerhood. Since the baby had some other medical issues, the breastmilk proved to be an invaluable
source of nutrients for him, allowing him to thrive, despite all of his other challenges. In addition, the
donated items such as baby blankets and breastfeeding supplies, like milk storage bags and extra pump
equipment, were greatly appreciated and useful for both mom and baby. "I am grateful every single day
to the wonderful IBCLCs at WIC who helped my son and myself while we were in crisis! ...I was beyond
shocked and amazed to have been welcomed in with such warmth and support. These women are
guardian angels for myself and my son.”
First 5 Sacramento Page 41 of 99 Evaluation Committee Meeting January 31, 2019
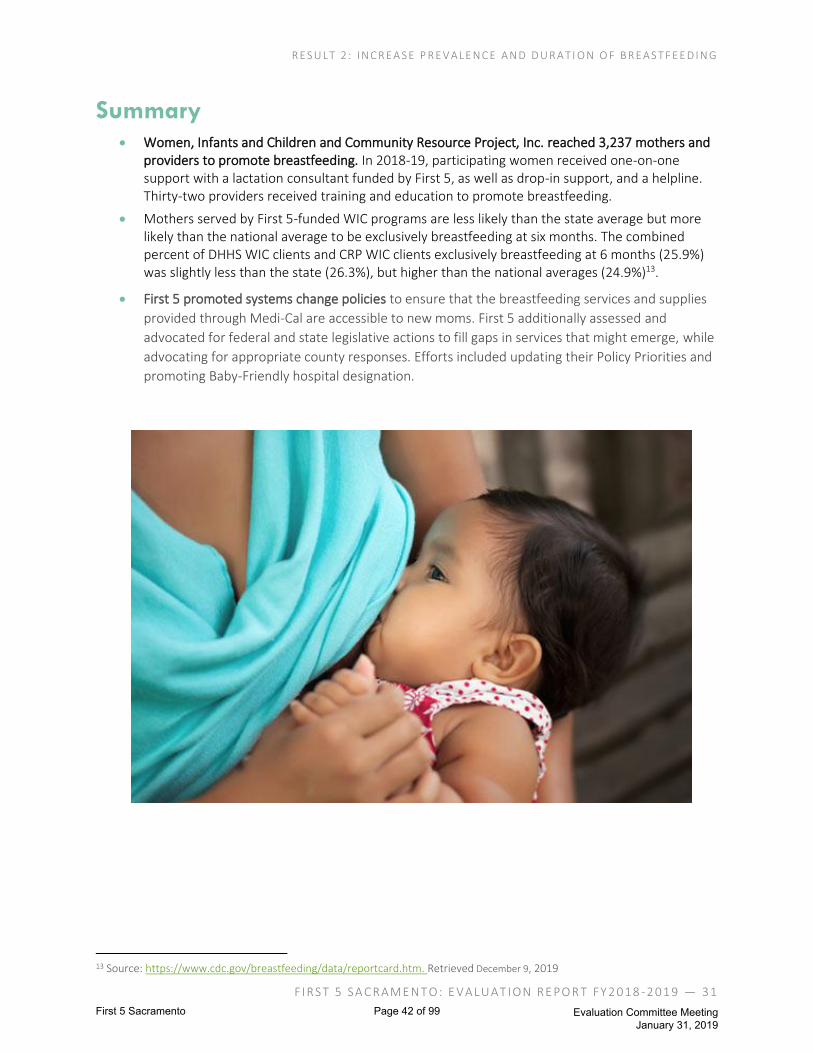
R E S U LT 2 : I N C R E A S E P R E V A LE N C E A N D D U R A T I O N O F B R E A S T F E E D I N G
FI RST 5 SA C RAME N T O: E VALUAT I ON RE PO R T FY 2 018 -2 01 9 — 31
Summary • Women, Infants and Children and Community Resource Project, Inc. reached 3,237 mothers and
providers to promote breastfeeding. In 2018-19, participating women received one-on-one support with a lactation consultant funded by First 5, as well as drop-in support, and a helpline. Thirty-two providers received training and education to promote breastfeeding.
• Mothers served by First 5-funded WIC programs are less likely than the state average but more likely than the national average to be exclusively breastfeeding at six months. The combined percent of DHHS WIC clients and CRP WIC clients exclusively breastfeeding at 6 months (25.9%) was slightly less than the state (26.3%), but higher than the national averages (24.9%)13.
• First 5 promoted systems change policies to ensure that the breastfeeding services and supplies
provided through Medi-Cal are accessible to new moms. First 5 additionally assessed and
advocated for federal and state legislative actions to fill gaps in services that might emerge, while
advocating for appropriate county responses. Efforts included updating their Policy Priorities and
promoting Baby-Friendly hospital designation.
13 Source: https://www.cdc.gov/breastfeeding/data/reportcard.htm. Retrieved December 9, 2019
First 5 Sacramento Page 42 of 99 Evaluation Committee Meeting January 31, 2019

R E S U LT 3 : D E C R E A S E D E N T A L D I S E A S E
FI RST 5 SA C RAME N T O: E VALUAT I ON RE PO R T FY 2 018 -2 01 9 — 32
Result 3: DECREASE DENTAL DISEASE
Countywide Trends The percentage of prekindergarten students aged 4 to 5 years old with untreated decay has improved
(23.6% change), significantly decreasing from 38.6% in 2015 to 29.5% in 2018. However, the county rate
for tooth decay still exceeds the state average (20.2%) and is 146% of the state’s rate and exceeds the
Healthy People 2020 target of 21.4%.
Percentage of Pre-Kindergarten Children (Sac) and Kindergarten Children (CA) with Untreated Decay
Source: Early Smiles Performance Report data, FY 2015-16, FY 2016-17, FY 2017-18; Early Smiles 2018-19 Sacramento County Data; California Dental Association AB 1433 Kindergarten Oral Health Requirement Reported Data Sample includes children aged 4-5 who were screened and were found to have “urgent” needs and “non-urgent needs” in their baseline fall screening.
The percentage of Sacramento children on Medi-Cal aged 0-5 who visited the dentist in the previous year
has improved between 2013 and 2017 for both age groups.
• 1-2 year olds: While the percentage of children ages 1-2 who visited the dentist in the previous
year improved (41.2% change), increasing from 14.0% in 2014 to 19.7% in 2017, the county’s rate
is only 85% of the state’s rate (23.3%).
• 3-5 year olds: While the percentage of children ages 3-5 who visited the dentist in the previous
year improved (10.2% change), increasing from 39.2% in 2014 to 43.1% in 2017, the county’s rate
is only 84% of the state’s rate (51.6%).
However, 57% of preschool-aged children in Sacramento County are still not visiting the dentist.
38.6%
40.4% 39.9%
29.5%
20.0% 21.0% 21.0%
10%
15%
20%
25%
30%
35%
40%
45%
2015-16 2016-17 2017-18 2018-19
Sacramento CA
START DATESEarly Smiles: 2018
Smile Keepers: 2009Water Fluoridation: 2005
HP 2020 Objective:
21.4%
First 5 Sacramento Page 43 of 99 Evaluation Committee Meeting January 31, 2019
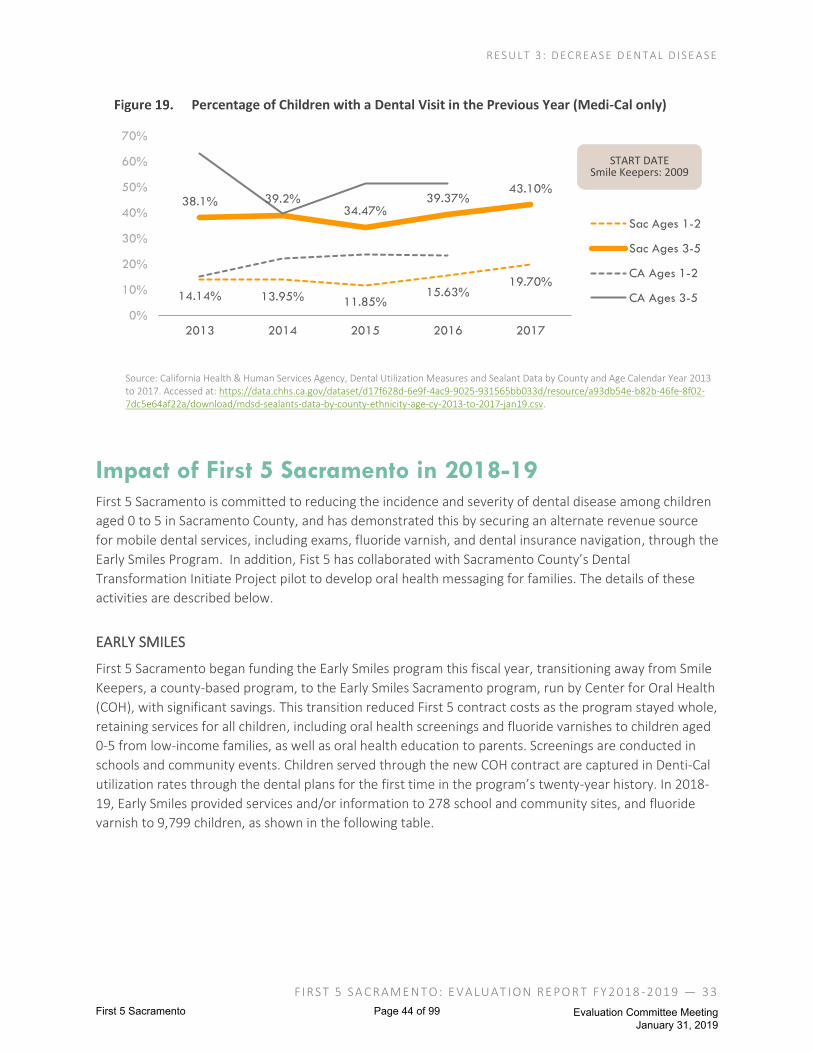
R E S U LT 3 : D E C R E A S E D E N T A L D I S E A S E
FI RST 5 SA C RAME N T O: E VALUAT I ON RE PO R T FY 2 018 -2 01 9 — 33
Percentage of Children with a Dental Visit in the Previous Year (Medi-Cal only)
Source: California Health & Human Services Agency, Dental Utilization Measures and Sealant Data by County and Age Calendar Year 2013 to 2017. Accessed at: https://data.chhs.ca.gov/dataset/d17f628d-6e9f-4ac9-9025-931565bb033d/resource/a93db54e-b82b-46fe-8f02-7dc5e64af22a/download/mdsd-sealants-data-by-county-ethnicity-age-cy-2013-to-2017-jan19.csv.
Impact of First 5 Sacramento in 2018-19 First 5 Sacramento is committed to reducing the incidence and severity of dental disease among children
aged 0 to 5 in Sacramento County, and has demonstrated this by securing an alternate revenue source
for mobile dental services, including exams, fluoride varnish, and dental insurance navigation, through the
Early Smiles Program. In addition, Fist 5 has collaborated with Sacramento County’s Dental
Transformation Initiate Project pilot to develop oral health messaging for families. The details of these
activities are described below.
EARLY SMILES
First 5 Sacramento began funding the Early Smiles program this fiscal year, transitioning away from Smile
Keepers, a county-based program, to the Early Smiles Sacramento program, run by Center for Oral Health
(COH), with significant savings. This transition reduced First 5 contract costs as the program stayed whole,
retaining services for all children, including oral health screenings and fluoride varnishes to children aged
0-5 from low-income families, as well as oral health education to parents. Screenings are conducted in
schools and community events. Children served through the new COH contract are captured in Denti-Cal
utilization rates through the dental plans for the first time in the program’s twenty-year history. In 2018-
19, Early Smiles provided services and/or information to 278 school and community sites, and fluoride
varnish to 9,799 children, as shown in the following table.
14.14% 13.95% 11.85%15.63%
19.70%
38.1% 39.2%34.47%
39.37%43.10%
0%
10%
20%
30%
40%
50%
60%
70%
2013 2014 2015 2016 2017
Sac Ages 1-2
Sac Ages 3-5
CA Ages 1-2
CA Ages 3-5
START DATE Smile Keepers: 2009
First 5 Sacramento Page 44 of 99 Evaluation Committee Meeting January 31, 2019

R E S U LT 3 : D E C R E A S E D E N T A L D I S E A S E
FI RST 5 SA C RAME N T O: E VALUAT I ON RE PO R T FY 2 018 -2 01 9 — 34
RBA Dashboard — Early Smiles Dental Screenings
2018/19
How much did we do?
# of sites, by setting 278
School sites 258
Community Events 20
# children who received fluoride varnish 9,799
How well did we do it?
# (%) of children who were given a referral to a dental home
7,831 (80%)
Is anyone better off?
Dental Homes
# (%) of children who attended a dental visit based upon a referral
3,224 (41%)
Source: FY 2018-19 Early Smiles Quarterly Performance Reports in Persimmony,
When conducting dental screenings, Early Smiles classified children as needing urgent care, needing non-
urgent dental services, or no obvious need for dental services. Slightly more than one-quarter (26%) of
children screened were identified as in need of dental services. The specific results of these screenings
are in the figures below.
Results of Early Smiles Dental Screenings, by Ethnicity, 2018-19 (Numbers)
All
Black Hispanic White
Native American
Asian Pacific
Islander Unknown
# of screenings
7,743
1,223 2,620 1,463 157 1,275 212 793
Needs urgent dental care
160
19 51 32 0 24 7 27
Needs non-urgent dental care
1,887
234 642 316 41 341 55 258
No obvious need for dental care
5,696
970 1,927 1,115 116 910 150 508
Source: FY 2018-19 Early Smiles data via RAPTER.
First 5 Sacramento Page 45 of 99 Evaluation Committee Meeting January 31, 2019

R E S U LT 3 : D E C R E A S E D E N T A L D I S E A S E
FI RST 5 SA C RAME N T O: E VALUAT I ON RE PO R T FY 2 018 -2 01 9 — 35
Results of Early Smiles Dental Screenings, by Ethnicity, 2018-19 (Percentages)
Source: FY 2018-19 Early Smiles data via RAPTER. N=7,743.
However, 80% of children were successfully assisted (through referral) in establishing a dental home, and
41% of children attended a dental visit based upon the referral.
Percentage of Dental Home Referrals Given and Utilized, 2018-19
Source: FY 2018-19 Early Smiles Quarterly Performance Reports in Persimmony.
73.6%79.3%
73.5% 76.2% 73.9% 71.4% 70.8%64.1%
24.4%19.1%
24.5% 21.6% 26.1% 26.7% 25.9%32.5%
2.1% 1.6% 1.9% 2.2% 0.0% 1.9% 3.3% 3.4%
All Black Hispanic White NativeAmerican
Asian PacificIslander
Unknown
Needs urgent dental care Needs non-urgent dental care No obvious need for dental care
of children given a
referral to a dental home
80%of children attended a dental visit
based upon a referral
41%
How well? Better off?
First 5 Sacramento Page 46 of 99 Evaluation Committee Meeting January 31, 2019

R E S U LT 3 : D E C R E A S E D E N T A L D I S E A S E
FI RST 5 SA C RAME N T O: E VALUAT I ON RE PO R T FY 2 018 -2 01 9 — 36
SYSTEMS APPROACHES TO REDUCE DENTAL DISEASE
First 5 increased the coordination of public education messaging about dental disease. Through
collaboration with the Sacramento County Oral Health Program and the Dental Transformation Initiative,
First 5 promoted preventive oral health messages and increased access to dental care for low income,
culturally diverse neighborhoods through a media campaign. First 5 Sacramento supported other
organizations, such as the Center for Oral Health, who are working to promote increased utilization of
Medi-Cal dental services in Sacramento County.
First 5 participated in the Medi-Cal Dental Advisory Committee (MCDAC) and Sacramento County’s Oral
Health Program (SCOHP) to implement the county-wide oral health needs assessment and to develop the
Oral Health Strategic Plan to improve the oral health status of Sacramento County children and families.
The Center for Oral Health (COH) Early Smiles program
reduced First 5 contract costs by 50% through key
partnerships with three Sacramento Geographic
Managed Care dental plans, leveraging $525,000 over
three years.
Early Smiles secured an alternate revenue source for
mobile dental services for Sacramento’s children aged
0-5, including exams, fluoride varnish, and dental
insurance navigation.
Summary • Early Smiles screened and served 9,799 children to prevent and address oral health needs. In 2018-
19, Early Smiles provided dental health screenings, fluoride varnishes, and dental health
information to 9,799 children at schools and community events. Slightly more than one-quarter
(26%) of the children screened through the Early Smiles mobile dental program had untreated
tooth decay and needed follow-up dental services. In 2018-19, 80% percent of children were
successfully assisted (through referral) in establishing a dental home, and 41% of those children
attended a dental visit based upon the referral.
• First 5 continued to invest in systemic approaches to oral health. During 2018-19, First 5 increased
the coordination of public education messaging about dental disease, participated in the Medi-Cal
Dental Advisory Committee (MCDAC) and Sacramento County’s Oral Health Strategic Plan (SCOHP),
and secured an alternate revenue source for mobile dental services.
First 5 Sacramento Page 47 of 99 Evaluation Committee Meeting January 31, 2019

R E S U LT 4 : I N C R E A S E U T I L I Z A T I O N O F M E D I C A L H O M E S
FI RST 5 SA C RAME N T O: E VALUAT I ON RE PO R T FY 2 018 -2 01 9 — 37
Result 4: INCREASE UTILIZATION OF
MEDICAL HOMES
Countywide Trends Overall, the percentage of children aged 0-5 who were covered by health insurance remained stable (1.8%
change), from 96.4% in 2014 to 98.2% in 2017, and coverage rates were even higher for African American
children (99.7%). Sacramento County rate is 101% of the state’s rate (97.5%) and fared better than the
national average (95.9%). The county is now within 2% of the Healthy People 2020 target of 100%. There
were no significant disparities among subpopulations, as all groups had rates between 97-99%.
Percentage of Children 0-5 with Health Insurance
Source: U.S. Census, American Community Survey. Data based upon one year estimates. Disparities reports B27001 A-I. Accessed at: https://factfinder.census.gov/faces/nav/jsf/pages/searchresults.xhtml?refresh=t#none on November 8, 2019. Note: Number of children under 6 with health insurance in Sacramento – 117,041 (2010); 114,028 (2011); 113,268 (2012); 114,000 (2013); 114,369 (2014); 115,586 (2015); 116,086 (2016); 116,943 (2017).
Among children 3-6 years old receiving Medi-Cal, the percentage of children in Sacramento County who
had one or more well-child visits with a primary care provider during the year remained stable (0.6%
change) from 2015 (72.1%) to 2018 (72.6%) yet Sacramento County fared worse than the state (75.4%).
There is no Healthy People 2020 objective available, but for comparison, the 2014 national Medicaid
average was 72%, and the national commercial average was 74%.
95.70%
98.20%
97.50%
95.90%
97.70%
99.70%
92%
94%
96%
98%
100%
2013 2014 2015 2016 2017
Sacramento CA US Black Asian Hispanic/Latino White
F5 SACRAMENTO FUNDING DATES
HEARTS for Kids: 2010-2018 Sacramento Covered: 2004-
2018
First 5 Sacramento Page 48 of 99 Evaluation Committee Meeting January 31, 2019
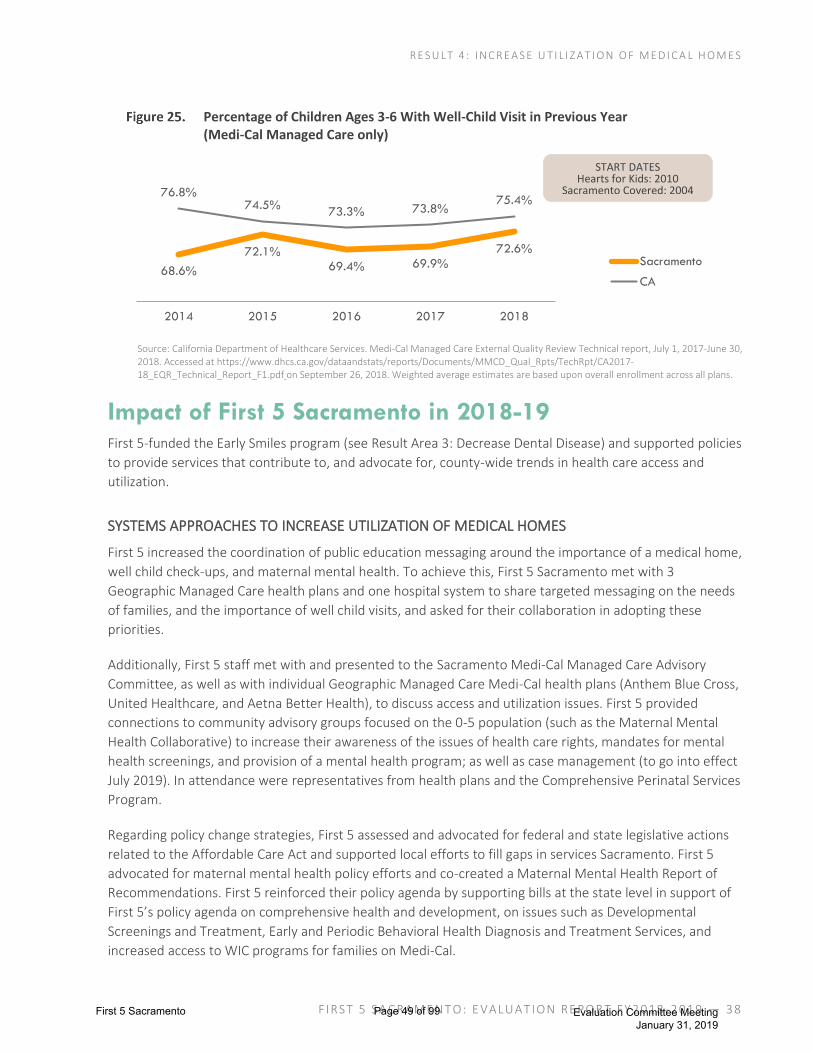
R E S U LT 4 : I N C R E A S E U T I L I Z A T I O N O F M E D I C A L H O M E S
FI RST 5 SA C RAME N T O: E VALUAT I ON RE PO R T FY 2 018 -2 01 9 — 38
Percentage of Children Ages 3-6 With Well-Child Visit in Previous Year (Medi-Cal Managed Care only)
Source: California Department of Healthcare Services. Medi-Cal Managed Care External Quality Review Technical report, July 1, 2017-June 30, 2018. Accessed at https://www.dhcs.ca.gov/dataandstats/reports/Documents/MMCD_Qual_Rpts/TechRpt/CA2017-18_EQR_Technical_Report_F1.pdf on September 26, 2018. Weighted average estimates are based upon overall enrollment across all plans.
Impact of First 5 Sacramento in 2018-19 First 5-funded the Early Smiles program (see Result Area 3: Decrease Dental Disease) and supported policies
to provide services that contribute to, and advocate for, county-wide trends in health care access and
utilization.
SYSTEMS APPROACHES TO INCREASE UTILIZATION OF MEDICAL HOMES
First 5 increased the coordination of public education messaging around the importance of a medical home,
well child check-ups, and maternal mental health. To achieve this, First 5 Sacramento met with 3
Geographic Managed Care health plans and one hospital system to share targeted messaging on the needs
of families, and the importance of well child visits, and asked for their collaboration in adopting these
priorities.
Additionally, First 5 staff met with and presented to the Sacramento Medi-Cal Managed Care Advisory
Committee, as well as with individual Geographic Managed Care Medi-Cal health plans (Anthem Blue Cross,
United Healthcare, and Aetna Better Health), to discuss access and utilization issues. First 5 provided
connections to community advisory groups focused on the 0-5 population (such as the Maternal Mental
Health Collaborative) to increase their awareness of the issues of health care rights, mandates for mental
health screenings, and provision of a mental health program; as well as case management (to go into effect
July 2019). In attendance were representatives from health plans and the Comprehensive Perinatal Services
Program.
Regarding policy change strategies, First 5 assessed and advocated for federal and state legislative actions
related to the Affordable Care Act and supported local efforts to fill gaps in services Sacramento. First 5
advocated for maternal mental health policy efforts and co-created a Maternal Mental Health Report of
Recommendations. First 5 reinforced their policy agenda by supporting bills at the state level in support of
First 5’s policy agenda on comprehensive health and development, on issues such as Developmental
Screenings and Treatment, Early and Periodic Behavioral Health Diagnosis and Treatment Services, and
increased access to WIC programs for families on Medi-Cal.
68.6%
72.1%
69.4% 69.9%
72.6%
76.8%74.5%
73.3% 73.8%75.4%
2014 2015 2016 2017 2018
Sacramento
CA
START DATES Hearts for Kids: 2010
Sacramento Covered: 2004
First 5 Sacramento Page 49 of 99 Evaluation Committee Meeting January 31, 2019
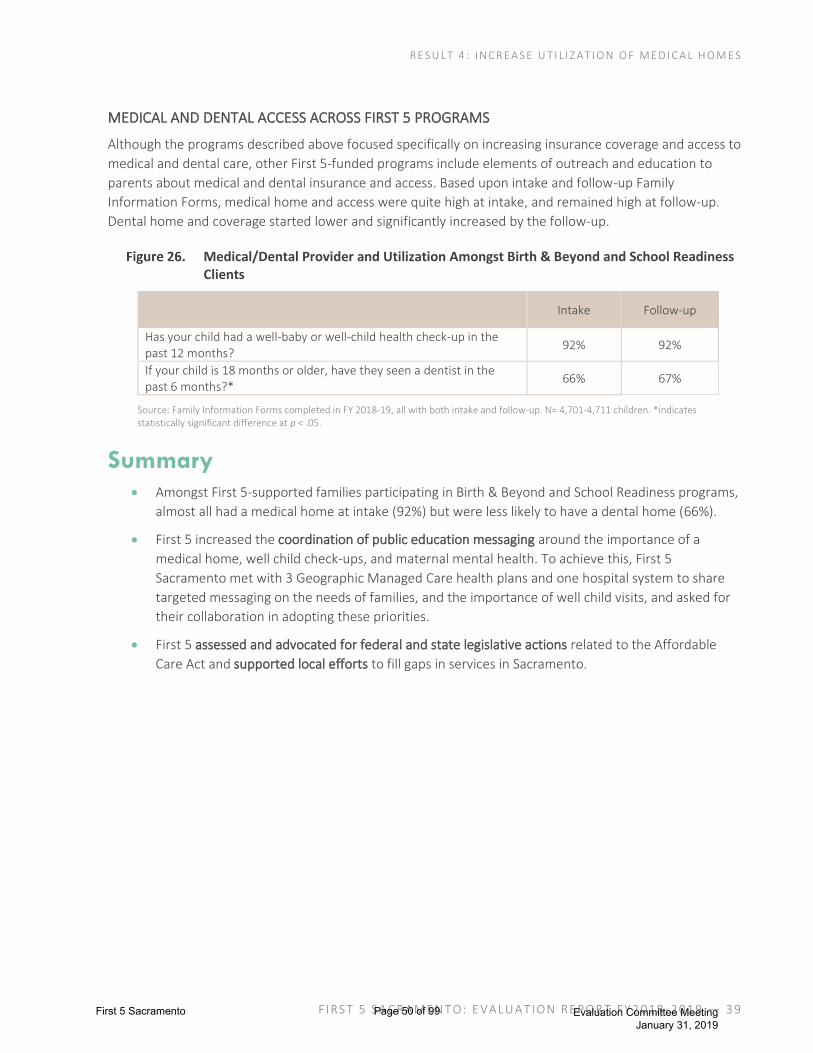
R E S U LT 4 : I N C R E A S E U T I L I Z A T I O N O F M E D I C A L H O M E S
FI RST 5 SA C RAME N T O: E VALUAT I ON RE PO R T FY 2 018 -2 01 9 — 39
MEDICAL AND DENTAL ACCESS ACROSS FIRST 5 PROGRAMS
Although the programs described above focused specifically on increasing insurance coverage and access to
medical and dental care, other First 5-funded programs include elements of outreach and education to
parents about medical and dental insurance and access. Based upon intake and follow-up Family
Information Forms, medical home and access were quite high at intake, and remained high at follow-up.
Dental home and coverage started lower and significantly increased by the follow-up.
Medical/Dental Provider and Utilization Amongst Birth & Beyond and School Readiness Clients
Intake Follow-up
Has your child had a well-baby or well-child health check-up in the past 12 months?
92% 92%
If your child is 18 months or older, have they seen a dentist in the past 6 months?*
66% 67%
Source: Family Information Forms completed in FY 2018-19, all with both intake and follow-up. N= 4,701-4,711 children. *indicates statistically significant difference at p < .05.
Summary • Amongst First 5-supported families participating in Birth & Beyond and School Readiness programs,
almost all had a medical home at intake (92%) but were less likely to have a dental home (66%).
• First 5 increased the coordination of public education messaging around the importance of a
medical home, well child check-ups, and maternal mental health. To achieve this, First 5
Sacramento met with 3 Geographic Managed Care health plans and one hospital system to share
targeted messaging on the needs of families, and the importance of well child visits, and asked for
their collaboration in adopting these priorities.
• First 5 assessed and advocated for federal and state legislative actions related to the Affordable
Care Act and supported local efforts to fill gaps in services in Sacramento.
First 5 Sacramento Page 50 of 99 Evaluation Committee Meeting January 31, 2019

R E S U LT 5 : I N C R E A S E A C C E S S I B I L I T Y T O A F F O R D A B LE Q U A L I T Y C H I LD C A R E
FI RST 5 SA C RAME N T O: E VALUAT I ON RE PO R T FY 2 018 -2 01 9 — 40
Result 5: INCREASE ACCESSIBILITY TO
AFFORDABLE QUALITY CHILD CARE
Countywide Trends The cost of child care takes an increasingly large portion of a family’s income in Sacramento County. For
instance, the annual cost of full-time center-based child care for infants increased from $10,844 in 2010 to
$13,760 in 2017. For a family earning $52,080 or less (the maximum amount to qualify for a subsidy),
without a subsidy, infant care required 17% of their income in 2010 and 2017, down from 19% in 2014.
The cost of full-time center-based child care for preschool children increased from $7,242 (2010) to $9,403
(2017). For a family earning $52,080, preschool required 18% of their income in 2010 and 2017, down from
21% in 2014.
Percentage of $52,080 Annual Income Needed for Cover Cost of Child Care
Source: California Resource and Referral Network Child Care Portfolios, 2017 Portfolio. Note: $52,080 is 70% of state median income in 2015 for a family of three. Accessed at: https://d3n8a8pro7vhmx.cloudfront.net/rrnetwork/pages/1415/attachments/original/ 1530916994/2017_CA_Child_Care_Portfolio_06-18.pdf?1530916994.
In Sacramento County, the number of slots at licensed child care centers and family child care homes for
children 0-5 decreased from 35,404 in 2014 to 35,149 in 2017, a loss of over 250 slots. In 2014, there was
enough capacity to provide care for 30% of the county’s 0-5 year-olds; that figure dropped slightly to 29%
by 2017. However, the county still has slightly better capacity (29%) compared to the state (26%).
17.0%
19.0%
17.0%18.0%
21.0%
18.0%
10%
15%
20%
25%
30%
2010 2014 2017 2010 2014 2017
Sacramento
CA
Infant care Preschool
First 5 Sacramento Page 51 of 99 Evaluation Committee Meeting January 31, 2019

R E S U LT 5 : I N C R E A S E A C C E S S I B I L I T Y T O A F F O R D A B LE Q U A L I T Y C H I LD C A R E
FI RST 5 SA C RAME N T O: E VALUAT I ON RE PO R T FY 2 018 -2 01 9 — 41
Capacity of Child Care System: Percent of 0-5 Year-Olds Who Can Be Accommodated in a Licensed Child Care Center or Family Child Care Home
Source: California Resource and Referral Network Child Care Portfolios, 2017 Portfolio. Accessed at: https://d3n8a8pro7vhmx.cloudfront.net/rrnetwork/pages/1415/attachments/original/1530916994/2017_CA_Child_Care_Portfolio_06-18.pdf?1530916994.
Impact of First 5 Sacramento in 2018-19 First 5 employed policy change strategies to support the increased use of quality child care practices.
• First 5 Identified and advocated for federal, state, and local legislation that increases access to child
care. In addition to tracking and supporting priority bills and Governor Newsom’s “Parent Agenda,”
First 5 participated in the City of Sacramento’s Child Care Hearing, which convened local
government and business leaders (including First 5 Sacramento’s Executive Director and
Commissioner Sneeringer) about the ongoing crisis for families and potential solutions to increase
affordable and quality child care throughout the city of Sacramento. Chair Serna gave opening
remarks and highlighted First 5 Sacramento’s ongoing investment in improving quality child care.
• First 5 attracted additional attention toward their advocacy work on child care when the Blue
Ribbon Commission Report highlighted First 5 as a key partner and advocate on child care.
• There was a net gain in the number of sites within the First 5 network, from 46 California State
Preschool Programs (CSPP) sites to 60 CSPP sites, resulting in hundreds more children having access
to quality, affordable child care.
30.2% 29.7%
27.6%26.5%
15.0%
20.0%
25.0%
30.0%
35.0%
40.0%
2014 2017
Sacramento
CA
First 5 Sacramento Page 52 of 99 Evaluation Committee Meeting January 31, 2019
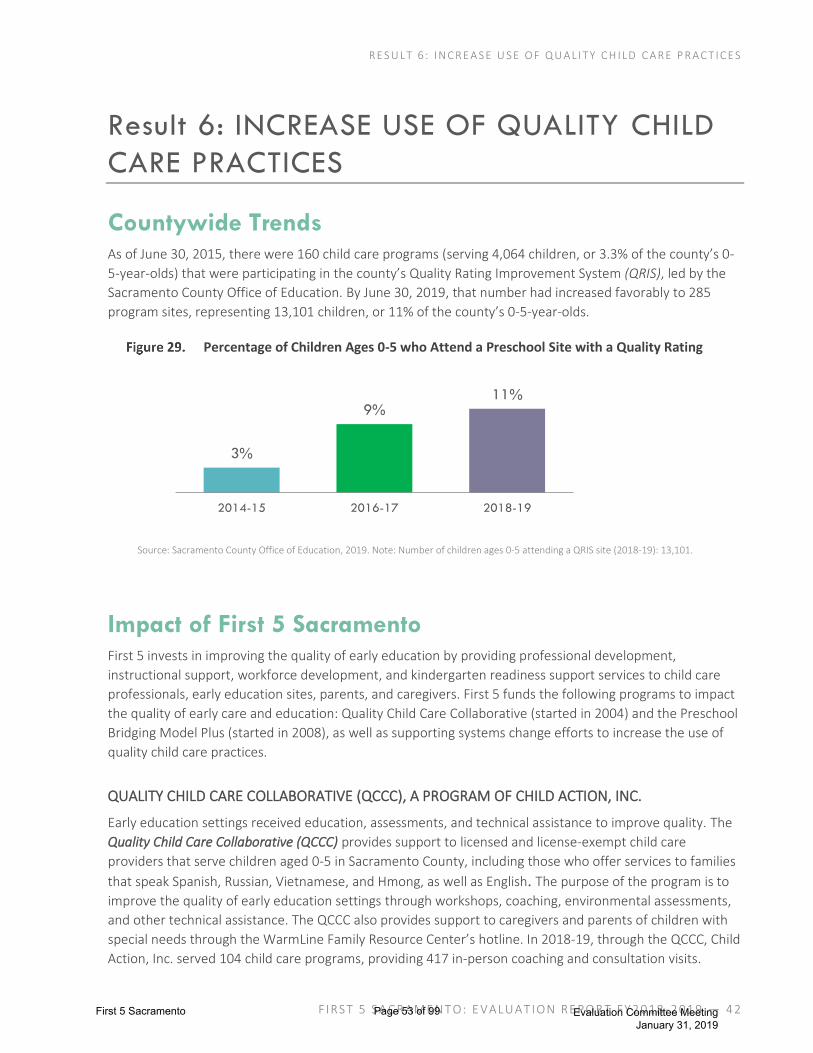
R E S U LT 6 : I N C R E A S E U S E O F Q U A L I T Y C H I LD C A R E P R A C T I C E S
FI RST 5 SA C RAME N T O: E VALUAT I ON RE PO R T FY 2 018 -2 01 9 — 42
Result 6: INCREASE USE OF QUALITY CHILD
CARE PRACTICES
Countywide Trends As of June 30, 2015, there were 160 child care programs (serving 4,064 children, or 3.3% of the county’s 0-
5-year-olds) that were participating in the county’s Quality Rating Improvement System (QRIS), led by the
Sacramento County Office of Education. By June 30, 2019, that number had increased favorably to 285
program sites, representing 13,101 children, or 11% of the county’s 0-5-year-olds.
Percentage of Children Ages 0-5 who Attend a Preschool Site with a Quality Rating
Source: Sacramento County Office of Education, 2019. Note: Number of children ages 0-5 attending a QRIS site (2018-19): 13,101.
Impact of First 5 Sacramento First 5 invests in improving the quality of early education by providing professional development,
instructional support, workforce development, and kindergarten readiness support services to child care
professionals, early education sites, parents, and caregivers. First 5 funds the following programs to impact
the quality of early care and education: Quality Child Care Collaborative (started in 2004) and the Preschool
Bridging Model Plus (started in 2008), as well as supporting systems change efforts to increase the use of
quality child care practices.
QUALITY CHILD CARE COLLABORATIVE (QCCC), A PROGRAM OF CHILD ACTION, INC.
Early education settings received education, assessments, and technical assistance to improve quality. The
Quality Child Care Collaborative (QCCC) provides support to licensed and license-exempt child care
providers that serve children aged 0-5 in Sacramento County, including those who offer services to families
that speak Spanish, Russian, Vietnamese, and Hmong, as well as English. The purpose of the program is to
improve the quality of early education settings through workshops, coaching, environmental assessments,
and other technical assistance. The QCCC also provides support to caregivers and parents of children with
special needs through the WarmLine Family Resource Center’s hotline. In 2018-19, through the QCCC, Child
Action, Inc. served 104 child care programs, providing 417 in-person coaching and consultation visits.
3%
9%11%
2014-15 2016-17 2018-19
First 5 Sacramento Page 53 of 99 Evaluation Committee Meeting January 31, 2019

R E S U LT 6 : I N C R E A S E U S E O F Q U A L I T Y C H I LD C A R E P R A C T I C E S
FI RST 5 SA C RAME N T O: E VALUAT I ON RE PO R T FY 2 018 -2 01 9 — 43
RBA Dashboard — Child Action, Inc.
2018/19
How much did we do?
# of programs served
Child care programs 104
# of ASQ-3 and ASQ-SE Developmental assessments given
ASQ-3 35
ASQ-SE 19
# of providers who completed various measures
Initial and Follow-Up Inventory of Practices 36
Initial and Follow-Up Environmental Rating Scale 11
Preparation of a Quality Improvement Plan 18
Is anyone better off?
% of classrooms with increased ERS scores (among 11 classrooms with pre and post assessments)
Activities 73%
Personal care routines 56%
Program structure 45%
Space and furnishings 91%
Interaction 45%
Parents and staff 73%
Listening and talking/language 73%
Source: FY 2018-19 QCCC Quarterly Performance Reports in Persimmony. ERS scores provided by Child Action.
Child Action, Inc. increased the quality of early care and education across all domains. During this fiscal
year, a total of 11 classrooms completed pre and post Early Childhood Environmental Rating Scale (ECERS-
R) assessments.14
As seen in the table above, the majority of classrooms had increased scores across the ECERS-R domains
from fall 2018 to spring 2019, though just under half of the classrooms experienced change in the domain
of Program Structure.
Pre and post scores were also analyzed as mean scores per domain, and as seen below. This analysis
revealed that significant improvements were observed in centers, based upon ECERS-R assessment data for
the Activities, Space and Furnishings, and Parents and Staff domains.
14 Due to very small sample sizes, pre/post changes must be interpreted conservatively.
First 5 Sacramento Page 54 of 99 Evaluation Committee Meeting January 31, 2019

R E S U LT 6 : I N C R E A S E U S E O F Q U A L I T Y C H I LD C A R E P R A C T I C E S
FI RST 5 SA C RAME N T O: E VALUAT I ON RE PO R T FY 2 018 -2 01 9 — 44
Results of Pre- and Post-ECERS-R Assessments, Child Action Participants
Source: Child Action, N=11. *denotes statistically significant difference at p < .05
Additionally, the Ages and Stages Questionnaire-3 (ASQ-3) developmental assessment was conducted with
35 children. Of these, 44% scored in the typical range for all domains, 32% were in the monitoring zone for
at least one domain, and 24% scored below the cutoff in at least one domain. Additionally, 19 children were
screened using the Social and Emotional scale of the ASQ15.
Client Success Story: Child Action, Inc.
Consultants through the Quality Child Care Collaborative (QCCC), Child Action, Inc. described how one
Family Child Care Home (FCCH) provider was able to successfully use their services to improve the quality of
care for her students.
Maria16 is a Spanish speaking Family Child Care Home (FCCH) provider. Her daughter, Juanita, who is her
assistant, and Juanita’s two children, also live with her. Maria originally came to Child Action, Inc. for
support with becoming a licensed care provider. She participated in the capacity building program and
successfully opened her business. She would occasionally contact Child Action, Inc. for guidance, and during
one call, Maria shared that her 3 year-old grandson (Manuel), who also attended the program, had recently
been diagnosed with autism. From a child care provider point of view, both Maria and Juanita were feeling
overwhelmed in addressing his challenging needs. The Quality Child care Collaborative (QCCC) was able to
15 Screening and referral outcome data was not available for the ASQ-SE. 16 All names have been changed to protect privacy.
4.8
3.77
3.78
5.84
4.43
4.42
4.91
3.4
2.52
3
4.52
3.43
3.99
3.57
Personal Care Routines
Listening and Talking
Interaction
Program Structure
Space and Furnishings*
Parents and Staff*
Activities*
Pre Post
First 5 Sacramento Page 55 of 99 Evaluation Committee Meeting January 31, 2019

R E S U LT 6 : I N C R E A S E U S E O F Q U A L I T Y C H I LD C A R E P R A C T I C E S
FI RST 5 SA C RAME N T O: E VALUAT I ON RE PO R T FY 2 018 -2 01 9 — 45
provide the additional support that was needed as they worked to create an inclusive and developmentally
supportive environment in their home language.
The consultant observed Manuel’s behavior in the child care setting, and through a series of visits, the
consultant and Spanish coordinator worked with Maria and Juanita to implement strategies to help with
structuring the day and creating a calming environment, such as: a picture schedule to add structure in the
day; timers to help with handwashing and cleanup; children’s books that discuss self-regulation strategies
like deep breathing and finding a quiet place; and giving Manuel a weighted vest to wear. They also decided
to have an ERS assessment of their program to work on creating an all-inclusive environment to meet the
needs of all children.
The QCCC implemented a strengths-based consultation approach with the FCCH provider, and the
partnership created between the provider, the parent, and the consultant created consistency of care and
practice across Manuel’s home and child care environment. Due to the program’s success, Manuel is now
sleeping through the night and is using self-soothing strategies during his time in child care. Furthermore,
Juanita described to Child Action, Inc. the positive impact that the weighted vest has had on Manuel,
explaining, “I was very pleased and so happy to see my son be so excited yet calm. It was the vest that
helped him regulate.”
Moreover, through the program improvement plans provided by the QCCC, Maria has raised her overall
program ERS score more than a full point and has made impressive improvements to the organization and
accessibility of her space, leading to the children in her care engaging in more developmentally appropriate
play.
PRESCHOOL BRIDGING MODEL PLUS
The Preschool Bridging Model Plus (PBM+) program provides quality enhancement support to privately-
funded early care and education providers through CLASS assessments, instructional support, and site
development. It also provides services such as developmental and health screenings to help children aged
0-5 and their families with the transition to preschool and kindergarten.
RBA Dashboard — Preschool Bridging Model Plus
2018/19
How much did we do?
# of individuals served
Children 2,064
Center-Based Teachers 100
Family Child Care Home Teachers 25
# of teachers who completed both Initial and Follow-Up for CLASS Assessment
Center-Based Teachers 74
Family Child Care Home Teachers 24
How well did we do it?
# of teachers who had at least 1 hour of in-person consultation
Center-Based Teachers 100
Family Child Care Home Teachers 25
Teachers who completed at least 75% of the goals in their Individual Professional Growth Plan
First 5 Sacramento Page 56 of 99 Evaluation Committee Meeting January 31, 2019

R E S U LT 6 : I N C R E A S E U S E O F Q U A L I T Y C H I LD C A R E P R A C T I C E S
FI RST 5 SA C RAME N T O: E VALUAT I ON RE PO R T FY 2 018 -2 01 9 — 46
2018/19
# Center-Based Teachers 100
# Family Child Care Home Teachers 25
Is anyone better off?
% of preschool classrooms with increased CLASS scores (n=48)
Emotional Support 73%
Classroom Organization 60%
Instructional Support 79%
% of toddler classrooms with increased CLASS scores (n=43)
Emotional and Behavioral Support 56%
Engaged Support for Learning 74%
Source: FY 2018-19 PBM+ Quarterly Performance Reports in Persimmony. FY 2018-19 Screening and CLASS data provided by PBM+.
Preschool classrooms’ CLASS assessment results displayed improvement in the quality of teacher-child
interactions across domains from pre- to post-. PBM+ administered pre and post Preschool Classroom
Assessment Scoring System (CLASS) assessments in 48 preschool classrooms to measure classroom
interactions. As shown in the figure below, there were statistically significant increases in average scores
from pre to post in the tool’s three domains: Emotional Support, Classroom Organization, and Instructional
Support. Meanwhile, pre and post Toddler CLASS assessments were conducted in 43 classrooms. There
were statistically significant differences in average scores from pre to post in Emotional and Behavioral
Support and Engaged Support for Learning. As seen above, 56% of Toddler classrooms improved in
Emotional and Behavioral Support, and 74% increased scores in classroom practices for Engaged Support
for Learning.
Results of Pre and Post CLASS Assessments, PBM+ Participants, 2018-19
Source: FY 2018-19 CLASS data provided by PBM+. N=48 preschool classrooms and N=43 toddler classrooms. *Statistically significant at p < .05.
3.58
5.81
3.12
5.01
6.10
3.22
5.55
2.22
4.51
5.69
Engaged Support for Learning*
Emotional and Behavioral Support*
Instructional Support*
Classroom Organization*
Emotional Support*
Pre
Post
Tod
dle
r P
resc
ho
ol
First 5 Sacramento Page 57 of 99 Evaluation Committee Meeting January 31, 2019
R E S U LT 6 : I N C R E A S E U S E O F Q U A L I T Y C H I LD C A R E P R A C T I C E S
FI RST 5 SA C RAME N T O: E VALUAT I ON RE PO R T FY 2 018 -2 01 9 — 47
Client Success Story: Preschool Bridging Model
Program mentors from the Preschool Bridging Model Plus program described how one Family Child Care
Home (FCCH) provider utilized ASQ screening tools to identify for assessment and connect to services a
student in need, who would have otherwise remained under the radar.
A divorced mother raising a three-year-old daughter, Jozie17 (with the help of the child’s father), enrolled
her child in a FCCH that was participating in PBM Plus. The mother’s parents had been caring for the child,
but the mother realized that the child needed more socialization with other children her age. The FCCH
provider received the ASQ from the PBM Plus Family Advocate and routinely distributed the ASQ
questionnaires to the enrolled families. After all parents completed the ASQ, the Family Advocate and FCCH
provider scored the ASQs. The ASQ results demonstrated a need to screen Jozie using the ASQ-SE tool as
well. The FCCH provider soon realized that this little girl needed more support. The ASQ and ASQ-SE results
gave the provider the tools to schedule a parent conference and to support the parents during this
adjustment. The provider explained, “Initially I thought [ASQs] were only a little helpful and a good way for
me to keep track of the children’s progress a couple times a year but didn’t clearly understand its true
purpose, [until Jozie].”
The FCCH provider supported the parents in making an appointment with Jozie’s doctor and sharing with
him the ASQ scores. Through this connection, Jozie received intensive testing, was diagnosed with high-
functioning autism, and an IEP was completed. Jozie is now receiving behavioral and speech support at
home, as well as in the Family Child Care Home. The teachers at the FCCH now have the tools to support
Jozie’s growth and development, and Jozie’s mother has expressed confidence in the FCCH’s ability to
support her daughter. As the FCCH provider explained, “If it wasn’t for the ASQs, I’m not sure if we would
have been able to get such an early start on helping little Jozie.”
SYSTEMS APPROACHES TO INCREASE USE OF QUALITY CHILD CARE PRACTICES
First 5 supported strong financial investments that increase the use of quality child care practices by
encouraging school districts to include early care and education in their Local Control and Accountability
Plans (LCAPs) and to direct funding to children aged 0-5 and their parents. Additionally, First 5 expanded
the number of participating early learning sites while reducing spending on preschool spaces. There was a
net gain in the number of sites within the First 5 network, from 46 California State Preschool Programs
(CSPP) sites to 60 CSPP sites. First 5 Sacramento developed a successful strategy to reduce preschool
spending by partnering with Head Start and School Districts; approximately $3 million in First 5 funding was
saved by transitioning preschool spaces to CSPP and Head Start spaces. First 5 funded 408 preschool spaces
in 2017-18, compared to funding 40 spaces in 2018-19. Despite this drastic shift, not a single child lost
space, and districts grew in their number of spaces.
17 Name has been changed to protect privacy.
First 5 Sacramento Page 58 of 99 Evaluation Committee Meeting January 31, 2019
R E S U LT 6 : I N C R E A S E U S E O F Q U A L I T Y C H I LD C A R E P R A C T I C E S
FI RST 5 SA C RAME N T O: E VALUAT I ON RE PO R T FY 2 018 -2 01 9 — 48
Summary • Child Action, Inc.’s Quality Child Care Collaborative (QCCC) helped 111 early educators increase the
quality of 104 classrooms. The Quality Child Care Collaborative (QCCC) provided support to licensed
and license-exempt child care providers through workshops, environmental assessments (ECERS-R,
FCCERS-R, and ITERS-R), coaching, and workshops. Child Action increased the quality of early care
and education in partner classrooms, as seen by statistically significant improvements in the ECERS-
R domains of Activities, Space and Furnishings, and Parents and Staff.
• The Preschool Bridging Model Plus (PBM+) supported 125 early educators in the private sector to
increase their quality of care. Through Classroom Assessment Scoring System (CLASS) assessments,
instructional support, site development, and developmental and health screenings, PBM+ helped
children aged 0-5 and their families gain a quality early education and be prepared for the
transition to kindergarten. Improvements in the fall to spring CLASS assessments were consistent
with previous years’ data, with statistically significant gains in all three dimensions of the preschool
classroom tool: Emotional Support, Classroom Organization, and Instructional Support, and
statistically significant gains in both dimensions of the toddler classroom tool: Emotional and
Behavioral Support and Engaged Support for Learning.
• First 5 supported the increased use of quality child care practices by advocating for strong financial
investments. These efforts included encouraging school districts to include early care and
education in their Local Control Action Plans (LCAPs) and to direct funding for children aged 0-5 and
their parents.
First 5 Sacramento Page 59 of 99 Evaluation Committee Meeting January 31, 2019
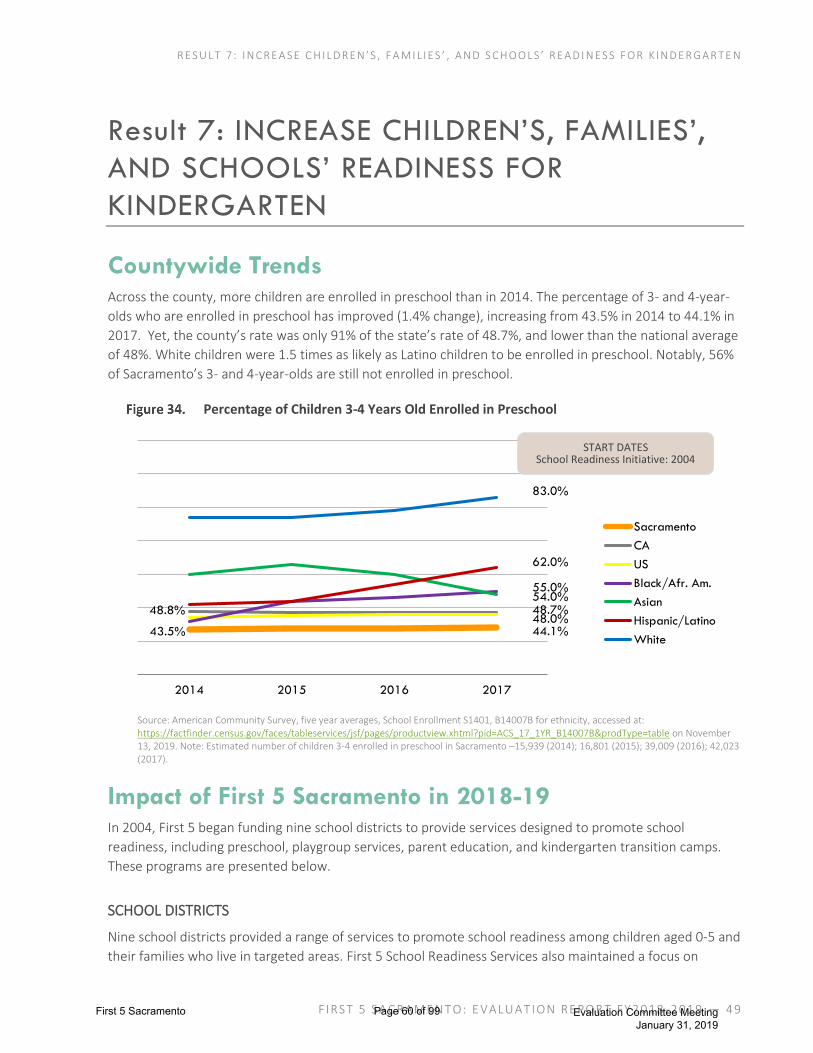
R E S U LT 7 : I N C R E A S E C H I L D R E N ’ S , F A M I L I E S ’ , A N D S C HO O LS ’ R E A D I N E S S F O R K I N D E R G A R T E N
FI RST 5 SA C RAME N T O: E VALUAT I ON RE PO R T FY 2 018 -2 01 9 — 49
Result 7: INCREASE CHILDREN’S, FAMILIES’,
AND SCHOOLS’ READINESS FOR
KINDERGARTEN
Countywide Trends Across the county, more children are enrolled in preschool than in 2014. The percentage of 3- and 4-year-
olds who are enrolled in preschool has improved (1.4% change), increasing from 43.5% in 2014 to 44.1% in
2017. Yet, the county’s rate was only 91% of the state’s rate of 48.7%, and lower than the national average
of 48%. White children were 1.5 times as likely as Latino children to be enrolled in preschool. Notably, 56%
of Sacramento’s 3- and 4-year-olds are still not enrolled in preschool.
Percentage of Children 3-4 Years Old Enrolled in Preschool
Source: American Community Survey, five year averages, School Enrollment S1401, B14007B for ethnicity, accessed at: https://factfinder.census.gov/faces/tableservices/jsf/pages/productview.xhtml?pid=ACS_17_1YR_B14007B&prodType=table on November 13, 2019. Note: Estimated number of children 3-4 enrolled in preschool in Sacramento –15,939 (2014); 16,801 (2015); 39,009 (2016); 42,023 (2017).
Impact of First 5 Sacramento in 2018-19 In 2004, First 5 began funding nine school districts to provide services designed to promote school
readiness, including preschool, playgroup services, parent education, and kindergarten transition camps.
These programs are presented below.
SCHOOL DISTRICTS
Nine school districts provided a range of services to promote school readiness among children aged 0-5 and
their families who live in targeted areas. First 5 School Readiness Services also maintained a focus on
43.5% 44.1%
48.8% 48.7%48.0%
55.0%54.0%
62.0%
83.0%
2014 2015 2016 2017
Sacramento
CA
US
Black/Afr. Am.
Asian
Hispanic/Latino
White
START DATES School Readiness Initiative: 2004
First 5 Sacramento Page 60 of 99 Evaluation Committee Meeting January 31, 2019

R E S U LT 7 : I N C R E A S E C H I L D R E N ’ S , F A M I L I E S ’ , A N D S C HO O LS ’ R E A D I N E S S F O R K I N D E R G A R T E N
FI RST 5 SA C RAME N T O: E VALUAT I ON RE PO R T FY 2 018 -2 01 9 — 50
serving children and families with Child Protective Services involvement, those who have disabilities/ special
needs, as well as dual language learners, migrant families, families in poverty, and/or other under-served
populations. School readiness services include subsidized preschool slots, playgroups, a summer camp to
help children transition to kindergarten, parent education and family literacy activities, and various
screenings and referrals. Some districts also provided more intensive support to families through services
such as case management and home visitation. In 2018-19, nine school districts received funding to provide
services at 46 school readiness sites. Of these sites, 96% received a 4 or 5 on the Quality Rating and
Improvement Scale.
Playgroups
First 5 Sacramento supports playgroups to provide opportunities for parents of children aged 0-3 to
connect with other parents while learning about age-appropriate expectations for their developing children
and learning skills around reading children’s cues. Children in playgroups are provided opportunities for
social-emotional development and social interaction with other children. Drop-in playgroup sessions are
available at least 1-2 days a week for 1-2 hours per day.
RBA Dashboard — School Readiness: Playgroups
2018/19
How much did we do?
# served
Children (ages 0-3) 1,043
Parent or other adult 979
How well did we do it?
Attendance:
Average # of sessions attended per child 8.65
% who attended more than one session 78%
% who attended more than ten sessions 23%
Resources:
Received either developmental screening (ASQ and ASQ-SE)
3,675
Playgroup Satisfaction: Pre Post
% satisfied or very satisfied with the overall quality of the playgroup program
99% 99%
% who feel child is safe coming to the program 100% 100%
% who feel child is happy coming to the program 100% 100%
% who feel child enjoys coming to the program 100% 100%
% very satisfied with:
Number of adults working with children 96% 98%
Background and experience of staff 99% 99%
Languages spoken by staff 100% 100%
Interaction between staff and children 99% 100%
Daily activities 98% 98%
Environment 99% 100%
Nutrition 94% 91%
How the program promotes your child's learning and development
98% 99%
First 5 Sacramento Page 61 of 99 Evaluation Committee Meeting January 31, 2019

R E S U LT 7 : I N C R E A S E C H I L D R E N ’ S , F A M I L I E S ’ , A N D S C HO O LS ’ R E A D I N E S S F O R K I N D E R G A R T E N
FI RST 5 SA C RAME N T O: E VALUAT I ON RE PO R T FY 2 018 -2 01 9 — 51
2018/19
Is anyone better off?
% of parents connected to their community (Percent who agree/strongly agree)
Pre Post
I know what program to contact in my community when I need help for basic needs (e.g., housing, food, employment).
61% 80%*
I know what program to contact in my community when I need advice on how to raise my child.
63% 82%*
Source: Persimmony Client Summary by Service Modality Report, FY 2018-19; Persimmony Export Client Service, FY2018-19; Playgroup Parent Survey, n = 186 pre; n = 88 post, FY 2018-19; Family Information Form, FY2018-19. *indicates statistically significant differences at p < 0.05.
Playgroup satisfaction was measured by a pre and post Playgroup Parent Survey. There was little difference
between pre and post scores, as all scores ranked highly satisfied at both intake and follow-up (96-100%),
with the exception of nutrition, which scored 94% at intake and 91% at follow-up. This is likely due to a
change in most sites’ snack routine mid-year, due to limited funds, and/or new decisions to not include
snack time18.
Playgroup parents’ level of
community connectedness was
measured by self-report through
the Family Information Form at
intake and follow-up. Increases in
community connectedness were
statistically significant for both
knowing what program to contact
in my community when I need help
for basic needs and knowing what
program to contact in my
community when I need advice on
how to raise my child.
18 Source: Data gathered from playgroup parent focus groups in winter 2019.
Playgroup at General Davie Primary Center, SJUSD, winter 2019.
First 5 Sacramento Page 62 of 99 Evaluation Committee Meeting January 31, 2019
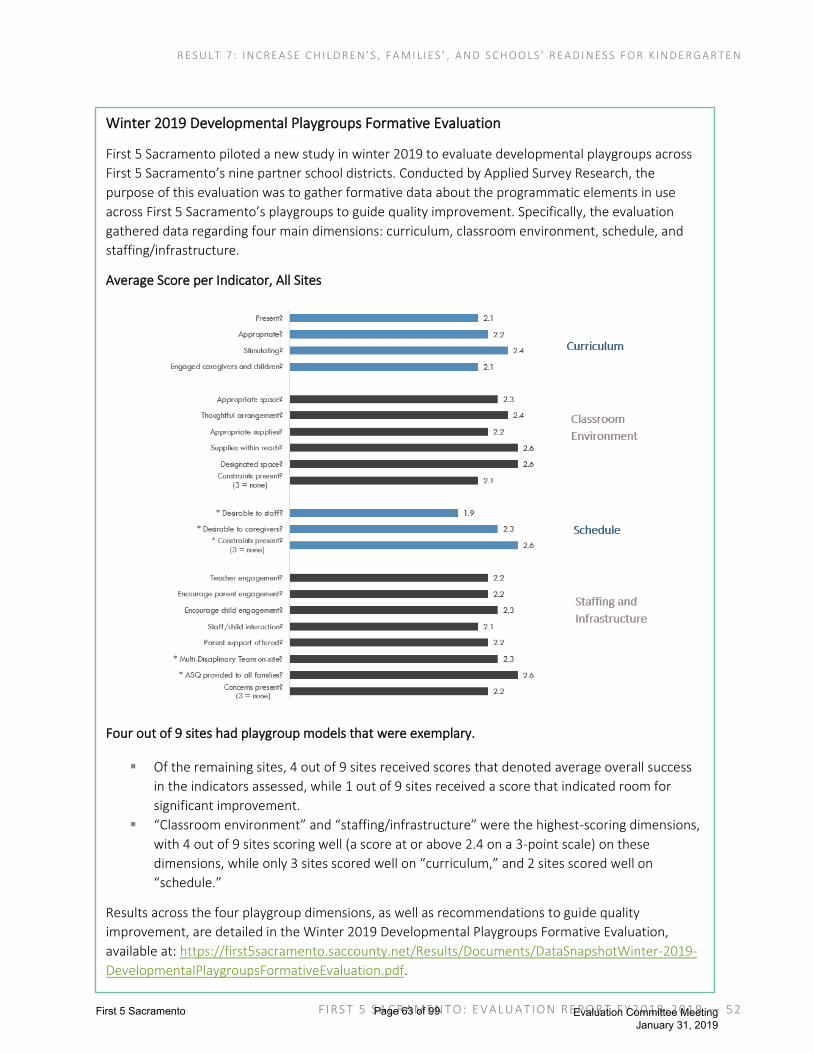
R E S U LT 7 : I N C R E A S E C H I L D R E N ’ S , F A M I L I E S ’ , A N D S C HO O LS ’ R E A D I N E S S F O R K I N D E R G A R T E N
FI RST 5 SA C RAME N T O: E VALUAT I ON RE PO R T FY 2 018 -2 01 9 — 52
Winter 2019 Developmental Playgroups Formative Evaluation
First 5 Sacramento piloted a new study in winter 2019 to evaluate developmental playgroups across
First 5 Sacramento’s nine partner school districts. Conducted by Applied Survey Research, the
purpose of this evaluation was to gather formative data about the programmatic elements in use
across First 5 Sacramento’s playgroups to guide quality improvement. Specifically, the evaluation
gathered data regarding four main dimensions: curriculum, classroom environment, schedule, and
staffing/infrastructure.
Average Score per Indicator, All Sites
Four out of 9 sites had playgroup models that were exemplary.
▪ Of the remaining sites, 4 out of 9 sites received scores that denoted average overall success
in the indicators assessed, while 1 out of 9 sites received a score that indicated room for
significant improvement.
▪ “Classroom environment” and “staffing/infrastructure” were the highest-scoring dimensions,
with 4 out of 9 sites scoring well (a score at or above 2.4 on a 3-point scale) on these
dimensions, while only 3 sites scored well on “curriculum,” and 2 sites scored well on
“schedule.”
Results across the four playgroup dimensions, as well as recommendations to guide quality
improvement, are detailed in the Winter 2019 Developmental Playgroups Formative Evaluation,
available at: https://first5sacramento.saccounty.net/Results/Documents/DataSnapshotWinter-2019-
DevelopmentalPlaygroupsFormativeEvaluation.pdf.
First 5 Sacramento Page 63 of 99 Evaluation Committee Meeting
January 31, 2019

R E S U LT 7 : I N C R E A S E C H I L D R E N ’ S , F A M I L I E S ’ , A N D S C HO O LS ’ R E A D I N E S S F O R K I N D E R G A R T E N
FI RST 5 SA C RAME N T O: E VALUAT I ON RE PO R T FY 2 018 -2 01 9 — 53
Client Success Story: Playgroups
A playgroup teacher in the San Juan Unified School District described one participating family’s experience
in playgroup for three years, and state preschool for one year. The family is comprised of a 68-year-old
father of a 6-year-old, 3-year-old, and an infant due in July 2019. Father takes the children to
playgroup/preschool, and mother works full time. The parents became involved in First 5 when they arrived
in Sacramento and met up with other parents at First 5 family-oriented events. This group of parents told
the father about the First 5 playgroup. The parents were glad to join because they needed a place to
acclimate their children to a school environment with the opportunity for socialization for both the children
and parents. The parents explained that “we value the resources, activities, and time we spend in playgroup
to assist in the development of our children.”
EARLY LEARNING EXPERIENCES
These programs are designed to introduce children to a fun learning environment that helps prepare them
for kindergarten. Preschool programs are available for children aged 3-5. Programs operate 3 or more
hours per day throughout the school year. Priority is given to children aged 4-5 without former preschool
experience.
RBA Dashboard — School Readiness: Preschool
2018/19
How much did we do?
# of preschool slots funded by First 5 40
# of children who attended preschool via a First 5-funded slot19 97
How well did we do it?
Quality Rating & Improvement System (QRIS):
% of sites with element score of 4 or 5 (on a scale of 1 to 5)20 96%
Attendance for preschool slots (n=653)
% of children who attended at least 30 weeks 38%
Is anyone better off?
Average School Readiness Scores (2017) 21 No
Preschool Preschool
Overall Readiness 2.98 3.21
Kindergarten Academics 2.69 3.05
Self-Regulation 3.14 3.29
Social Expression 3.07 3.24
Source: School districts’ FY 2018-19 individual-level service data in Persimmony; School Readiness Assessment Fall 2017 data. QRIS data submitted by each school district for each site. N=53 sites, 51 of which were rated a 4 or a 5. School readiness assessment data: No Preschool N=247; Preschool N=535.
Preschool prepares students for kindergarten entry. Consistent with prior years, students who entered
kindergarten in 2017 having had a First 5-funded preschool experience achieved higher scores on the First 5
school readiness assessment conducted across all school readiness districts.
19 Since some children attended for only part of the year, the total number of children served through these slots was higher than
the number of slots. Attendance data are based upon these 97 children. 20 Two-hundred and eighty-five First 5-funded sites are participating in QRIS. 21 Preschool refers to First 5-funded center-based preschools. The full school readiness report may be found on the First 5
Sacramento website.
First 5 Sacramento Page 64 of 99 Evaluation Committee Meeting January 31, 2019

R E S U LT 7 : I N C R E A S E C H I L D R E N ’ S , F A M I L I E S ’ , A N D S C HO O LS ’ R E A D I N E S S F O R K I N D E R G A R T E N
FI RST 5 SA C RAME N T O: E VALUAT I ON RE PO R T FY 2 018 -2 01 9 — 54
SCREENINGS AND REFERRALS
The goal of developmental screenings and developmentally appropriate practices is to be able to identify
and serve children who have developmental concerns. Not all special needs can be prevented or
ameliorated, but early detection can ensure that children receive services earlier, and in some cases,
prevent special needs from becoming more severe over time. There are currently no countywide data on
the prevalence of early developmental concerns, but county data on special needs services are available
from the Department of Education.
The chart below presents the percentage of the Sacramento County population receiving special education
services, by age group and ethnicity. The combined percentage of children aged 0-5 enrolled in special
education worsened (15.4% change), increasing from 2015-16 (2.6%) to 2018-19 (3.0%). However, trends
remained stable across the state (3.0% in 2015-16 and 3.1% in 2018-19). In terms of distribution amongst
those with special needs, Hispanic/Latino children aged 0-5 were overrepresented in special education, and
Whites were underrepresented22.
Percentage of Children Ages 0-2 and 3-5 Enrolled in Special Education
Source: California Department of Education, DataQuest. Note: Estimated number Sacramento students ages 0-2 enrolled in special education: 203 (2018-19 school year); ages 3 to 5 enrolled in special education: 3,321 (2018-19 school year).
22 The chart shows distribution amongst those with special needs, and not prevalence within each ethnic group.
0.4% 0.3% 0.4% 0.3%
4.9%
5.2%5.5%
5.6%
2015-16 2016-17 2017-18 2018-19
Sac 0-2
Sac 3-5
CA 0-2
CA 3-5
Black/AfAm, 11.1%
Asian, 13.5%
Hispanic/Latino, 36.8%
White, 29.1%
Multi-Race, 9.4%
Children Ages 0-5 Enrolled in Special
Education, by Ethnicity, 2018-19
First 5 Sacramento Page 65 of 99 Evaluation Committee Meeting January 31, 2019
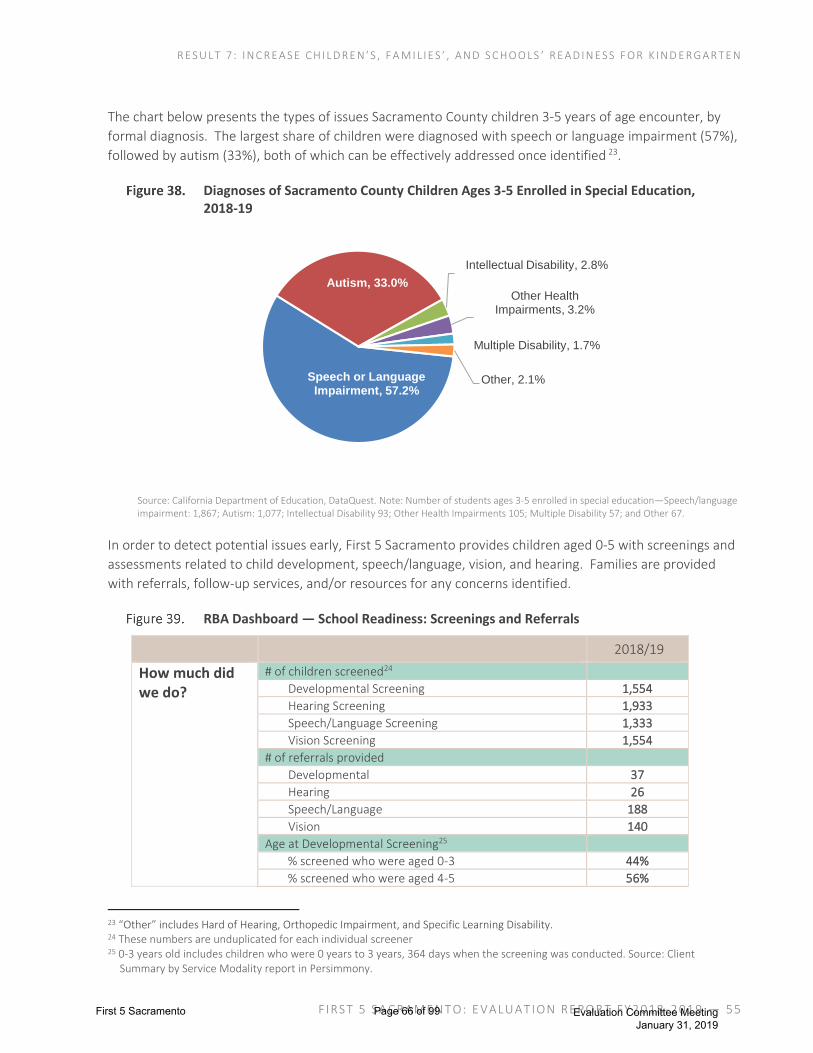
R E S U LT 7 : I N C R E A S E C H I L D R E N ’ S , F A M I L I E S ’ , A N D S C HO O LS ’ R E A D I N E S S F O R K I N D E R G A R T E N
FI RST 5 SA C RAME N T O: E VALUAT I ON RE PO R T FY 2 018 -2 01 9 — 55
The chart below presents the types of issues Sacramento County children 3-5 years of age encounter, by
formal diagnosis. The largest share of children were diagnosed with speech or language impairment (57%),
followed by autism (33%), both of which can be effectively addressed once identified 23.
Diagnoses of Sacramento County Children Ages 3-5 Enrolled in Special Education, 2018-19
Source: California Department of Education, DataQuest. Note: Number of students ages 3-5 enrolled in special education—Speech/language impairment: 1,867; Autism: 1,077; Intellectual Disability 93; Other Health Impairments 105; Multiple Disability 57; and Other 67.
In order to detect potential issues early, First 5 Sacramento provides children aged 0-5 with screenings and
assessments related to child development, speech/language, vision, and hearing. Families are provided
with referrals, follow-up services, and/or resources for any concerns identified.
RBA Dashboard — School Readiness: Screenings and Referrals
2018/19
How much did we do?
# of children screened24
Developmental Screening 1,554
Hearing Screening 1,933
Speech/Language Screening 1,333
Vision Screening 1,554
# of referrals provided
Developmental 37
Hearing 26
Speech/Language 188
Vision 140
Age at Developmental Screening25
% screened who were aged 0-3 44%
% screened who were aged 4-5 56%
23 “Other” includes Hard of Hearing, Orthopedic Impairment, and Specific Learning Disability. 24 These numbers are unduplicated for each individual screener 25 0-3 years old includes children who were 0 years to 3 years, 364 days when the screening was conducted. Source: Client
Summary by Service Modality report in Persimmony.
Speech or Language Impairment, 57.2%
Autism, 33.0%
Intellectual Disability, 2.8%
Other Health Impairments, 3.2%
Multiple Disability, 1.7%
Other, 2.1%
First 5 Sacramento Page 66 of 99 Evaluation Committee Meeting January 31, 2019
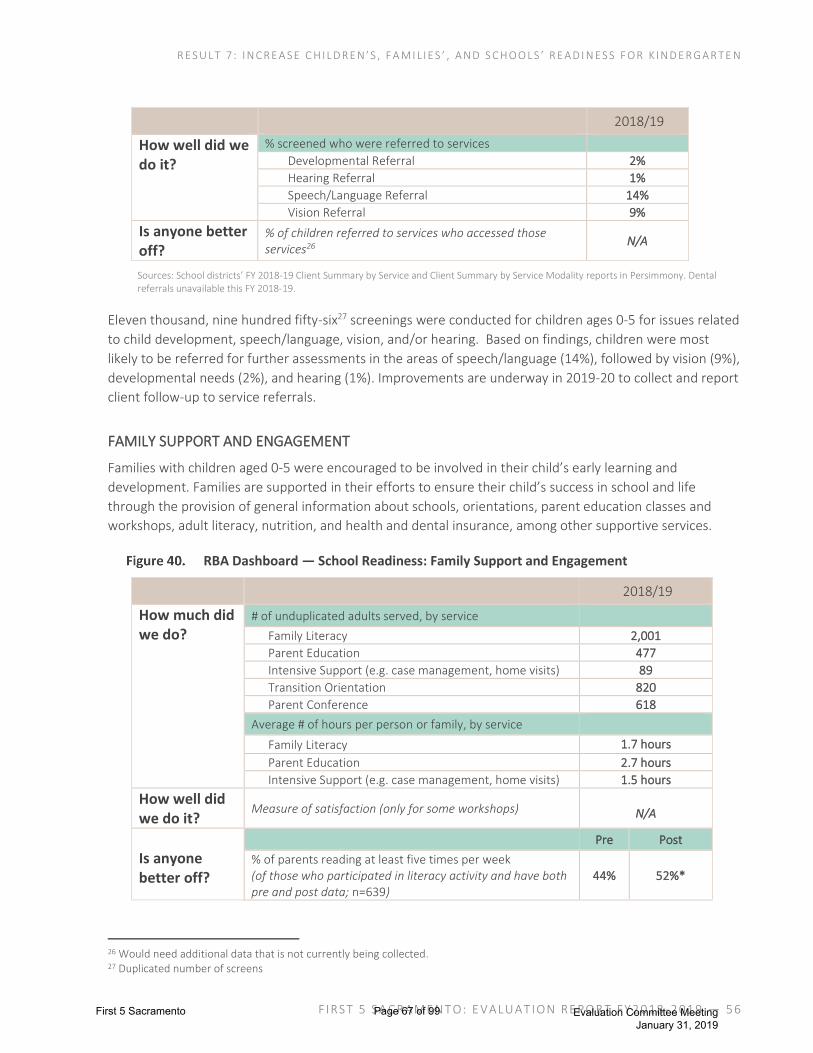
R E S U LT 7 : I N C R E A S E C H I L D R E N ’ S , F A M I L I E S ’ , A N D S C HO O LS ’ R E A D I N E S S F O R K I N D E R G A R T E N
FI RST 5 SA C RAME N T O: E VALUAT I ON RE PO R T FY 2 018 -2 01 9 — 56
2018/19
How well did we do it?
% screened who were referred to services
Developmental Referral 2%
Hearing Referral 1%
Speech/Language Referral 14%
Vision Referral 9%
Is anyone better off?
% of children referred to services who accessed those services26
N/A
Sources: School districts’ FY 2018-19 Client Summary by Service and Client Summary by Service Modality reports in Persimmony. Dental referrals unavailable this FY 2018-19.
Eleven thousand, nine hundred fifty-six27 screenings were conducted for children ages 0-5 for issues related
to child development, speech/language, vision, and/or hearing. Based on findings, children were most
likely to be referred for further assessments in the areas of speech/language (14%), followed by vision (9%),
developmental needs (2%), and hearing (1%). Improvements are underway in 2019-20 to collect and report
client follow-up to service referrals.
FAMILY SUPPORT AND ENGAGEMENT
Families with children aged 0-5 were encouraged to be involved in their child’s early learning and
development. Families are supported in their efforts to ensure their child’s success in school and life
through the provision of general information about schools, orientations, parent education classes and
workshops, adult literacy, nutrition, and health and dental insurance, among other supportive services.
RBA Dashboard — School Readiness: Family Support and Engagement
2018/19
How much did we do?
# of unduplicated adults served, by service
Family Literacy 2,001
Parent Education 477
Intensive Support (e.g. case management, home visits) 89
Transition Orientation 820
Parent Conference 618
Average # of hours per person or family, by service
Family Literacy 1.7 hours
Parent Education 2.7 hours
Intensive Support (e.g. case management, home visits) 1.5 hours
How well did we do it?
Measure of satisfaction (only for some workshops)
N/A
Is anyone better off?
Pre Post
% of parents reading at least five times per week (of those who participated in literacy activity and have both pre and post data; n=639)
44% 52%*
26 Would need additional data that is not currently being collected. 27 Duplicated number of screens
First 5 Sacramento Page 67 of 99 Evaluation Committee Meeting January 31, 2019
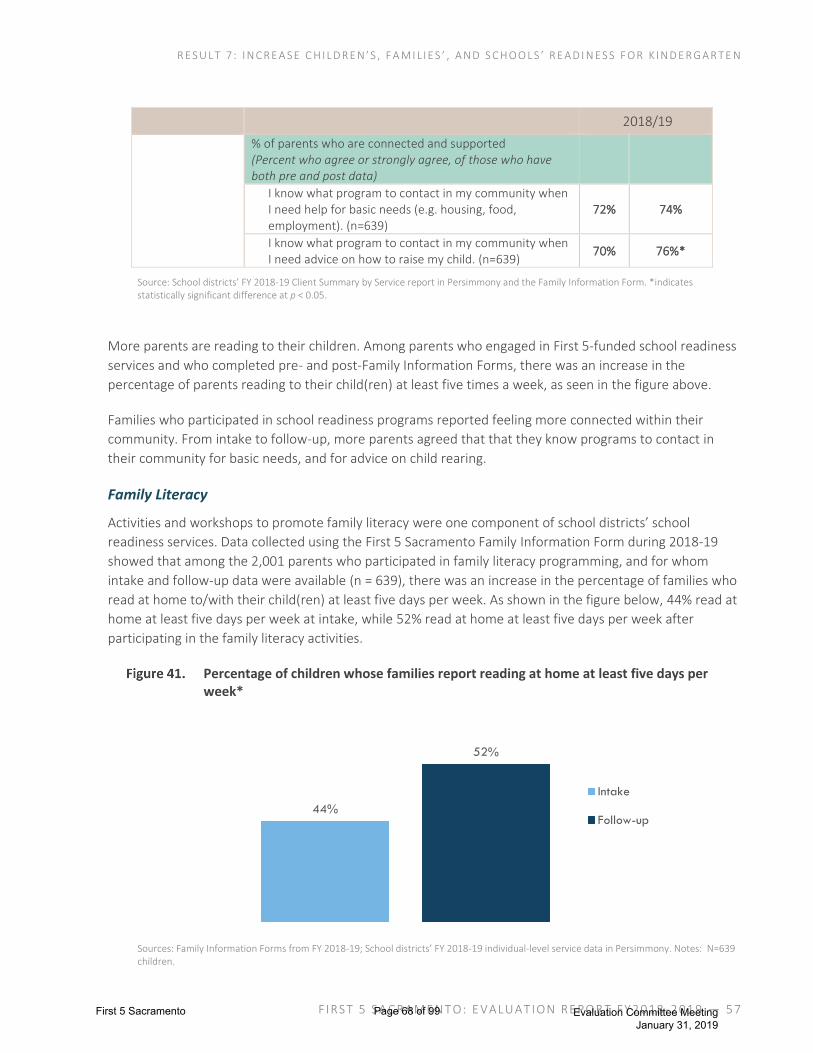
R E S U LT 7 : I N C R E A S E C H I L D R E N ’ S , F A M I L I E S ’ , A N D S C HO O LS ’ R E A D I N E S S F O R K I N D E R G A R T E N
FI RST 5 SA C RAME N T O: E VALUAT I ON RE PO R T FY 2 018 -2 01 9 — 57
2018/19
% of parents who are connected and supported (Percent who agree or strongly agree, of those who have both pre and post data)
I know what program to contact in my community when I need help for basic needs (e.g. housing, food, employment). (n=639)
72% 74%
I know what program to contact in my community when I need advice on how to raise my child. (n=639)
70% 76%*
Source: School districts’ FY 2018-19 Client Summary by Service report in Persimmony and the Family Information Form. *indicates statistically significant difference at p < 0.05.
More parents are reading to their children. Among parents who engaged in First 5-funded school readiness
services and who completed pre- and post-Family Information Forms, there was an increase in the
percentage of parents reading to their child(ren) at least five times a week, as seen in the figure above.
Families who participated in school readiness programs reported feeling more connected within their
community. From intake to follow-up, more parents agreed that that they know programs to contact in
their community for basic needs, and for advice on child rearing.
Family Literacy
Activities and workshops to promote family literacy were one component of school districts’ school
readiness services. Data collected using the First 5 Sacramento Family Information Form during 2018-19
showed that among the 2,001 parents who participated in family literacy programming, and for whom
intake and follow-up data were available (n = 639), there was an increase in the percentage of families who
read at home to/with their child(ren) at least five days per week. As shown in the figure below, 44% read at
home at least five days per week at intake, while 52% read at home at least five days per week after
participating in the family literacy activities.
Percentage of children whose families report reading at home at least five days per week*
Sources: Family Information Forms from FY 2018-19; School districts’ FY 2018-19 individual-level service data in Persimmony. Notes: N=639 children.
44%
52%
Intake
Follow-up
First 5 Sacramento Page 68 of 99 Evaluation Committee Meeting January 31, 2019

R E S U LT 7 : I N C R E A S E C H I L D R E N ’ S , F A M I L I E S ’ , A N D S C HO O LS ’ R E A D I N E S S F O R K I N D E R G A R T E N
FI RST 5 SA C RAME N T O: E VALUAT I ON RE PO R T FY 2 018 -2 01 9 — 58
TRANSITION SUMMER CAMP
Transition summer camp included learning and enrichment activities for children and workshops to orient
parents to prepare for kindergarten entry. Transition summer camps were typically 3-4 weeks in duration
with a targeted minimum of 3-4 hours a day, for a total targeted minimum of 60 hours of program
engagement. The camps were intended to serve under-resourced children who might otherwise not have
access to preschool or other school readiness programs, and focus on preparing children for starting
kindergarten, with an emphasis on numeracy, literacy, and social-emotional development.
In 2018-19, a school readiness assessment was conducted at summer camp sites in Folsom Cordova,
Natomas, Twin Rivers, River Delta, and San Juan, reflecting an expansion of the program by two additional
districts this fiscal year.
RBA Dashboard — School Readiness: Transition Summer Camp
2018/19
How much did we do?
# of children served 378
How well did we do it?
% of children who completed at least 56 hours 34%
% of children whose parents participated in transition orientation
59%
Is anyone better off?
% of children whose skills increased from the pre to post test (n=301)
Kindergarten academics 59%
Self-regulation 44%
Social expression 24%
Source: FY 2018-19 individual-level client service data in Persimmony; 2019 Summer Transition Camp Pre/Post Assessment.
First 5 Sacramento Page 69 of 99 Evaluation Committee Meeting January 31, 2019

R E S U LT 7 : I N C R E A S E C H I L D R E N ’ S , F A M I L I E S ’ , A N D S C HO O LS ’ R E A D I N E S S F O R K I N D E R G A R T E N
FI RST 5 SA C RAME N T O: E VALUAT I ON RE PO R T FY 2 018 -2 01 9 — 59
Students were assessed across three primary domains of readiness: Social Expression, Self-Regulation, and
Kindergarten Academics. Overall, students showed improvement across all three skill areas, as seen by the
change in average readiness skills from pre- to post-test over the summer.
Change in Average Kindergarten Readiness Score Amongst Transition Summer Camp Participants
Source: Transition Summer Camp Pre/Post Survey, 2019. N=301. *indicates a statistically significant difference at p < .05
Client Success Stories – Transition Summer Camp
Numerous districts participating in the Transition Summer Camp program offered stories of how their
program impacted students and families28.
A provider from the San Juan Unified School District described how a student, Clara, was referred by her
preschool teacher to the program, and benefited from their Summer Program. Clara was described as a
very quiet and introverted girl. Upon completion of the Summer Program, the provider was amazed to see
her growth; during the first few weeks of the program, Clara had refused to participate in group time and
would only sit in a chair next to a teacher and would not answer the daily question, yet by the fourth week,
she was sitting independently on the carpet and participating in the question of the day. Clara’s confidence
grew, and she even formed relationships with her peers and staff, as a result of participating in the
program.
Similarly, a provider from Natomas Unified School District described the successes of two of their students
in their Kinder Readiness Camp. Both Jaden and Lily had not had any preschool experience before entering
the Kinder Readiness Camp and were informed about the program through the school. Both children loved
attending the program, especially due to their new teachers and friends. Jaden’s father was so pleased with
the program and communicated its beneficial impact on teaching Jaden to be on time and prepared for
school, explaining that “Jaden loves his preschool. He woke up early this morning at 6:45am [to] get ready to
28 Names have been changed to protect privacy when consent forms were not signed.
3.1
3.4 3.4
3.3
3.6 3.6
Kindergarten Academics* Self-Regulation* Social Expression*
Pre Post
First 5 Sacramento Page 70 of 99 Evaluation Committee Meeting January 31, 2019

R E S U LT 7 : I N C R E A S E C H I L D R E N ’ S , F A M I L I E S ’ , A N D S C HO O LS ’ R E A D I N E S S F O R K I N D E R G A R T E N
FI RST 5 SA C RAME N T O: E VALUAT I ON RE PO R T FY 2 018 -2 01 9 — 60
go to school.” Lily’s mother was also pleased, sharing that “Lily is now so excited to start kindergarten…She
especially loved the field trip and bus ride. The backpack with school supplies is an added bonus!”
Another provider from the San Juan Unified School District
described their student and family successes with the Kinder
Camp Program through the example of Robbie, who has 4
children, and recently regained custody of his daughter Kayla, who
was previously in foster care. Robbie was referred to the program
for Kayla by the school, and Robbie participated in all of the
weekly parent activities/ meetings on Friday’s, along with Kayla.
The provider noticed positive results with Kayla’s participation in
the Kinder Camp Program, especially around helping her with
social anxiety and gaining confidence: “In the beginning she was
very withdrawn and shy to join play or participate in group time.
She also could only count to 3 or 4 consistently. Now she can
consistently count to 5 and is confident to count to 18 in front of
the whole group with teacher assistance. She has made friendships
and overall seems more happy.” Kayla’s father was also pleased
from the program: “I’m glad that my daughter is engaging in
activities, participating. Kayla has shown much interest in meeting
and enjoying friends, reading and projects Kayla enjoys. Frist 5
program is a great program. Thank you!”
Jaden, 2019 NUSD Kinder Readiness Camp Lily, 2019 NUSD Kinder Readiness Camp
Kayla, 2019 SJUSD Kinder Camp
First 5 Sacramento Page 71 of 99 Evaluation Committee Meeting January 31, 2019

R E S U LT 7 : I N C R E A S E C H I L D R E N ’ S , F A M I L I E S ’ , A N D S C HO O LS ’ R E A D I N E S S F O R K I N D E R G A R T E N
FI RST 5 SA C RAME N T O: E VALUAT I ON RE PO R T FY 2 018 -2 01 9 — 61
HELP ME GROW
The Sacramento County affiliate of Help Me Grow California was established through funding by First 5
Sacramento to increase access to services for children ages 0 to 5 who are at-risk for developmental delays
and/or disabilities. Help Me Grow operates through a multi-method approach, with Centralized Access
Points including a call center that receives and provides referrals, as well as through targeted on-site
support provided by Family Advocates. Program services are targeted at-risk children and families in
underserved areas, and included education, outreach and training, screening and referral services, and
family support. Family Advocates conduct home visits to provide developmental and health screenings for
children, along with resources and referrals. The following table describes the range of services conducted.
RBA Dashboard: School Readiness: Help Me Grow
2018/19
How much did we do?
Health Care Provider Outreach
# of health care providers provided with outreach and materials 403
# of health care providers provided with training and technical assistance 51
Community Outreach
# of community events attended to provide outreach and materials 7
# of community members provided with training and technical assistance 344
Call Center
# of incoming calls to HMG, by referral source 862
Health Care Providers 28
Private Child Care Providers 19
School District 18
FRCs 15
PBM+ Providers 4
Advertisement 3
Website 2
Unknown or no referral 773
HMG Child Intakes
# of child intakes processed by HMG 235 29
# (%) of children whose families received outgoing referrals during the initial call to HMG (have a Referral Log)
120 (51%)
Family Advocate Services
# of Families with a Family Advocate (at least one home visit) 192
# of Families who worked with Family Advocate to create an Action Plan 148 (77%)
# (%) of children receiving Family Advocate services who received referrals 62 (97%)
# of home visits conducted 414
Screenings
# of children who received ASQ-3 developmental screenings 408
# (%) of children with developmental concern (flagged) in at least one area 213 (52%)
# (%) of children in monitoring zone (near cut-off) in at least one area 76 (19%)
29 Note: Help Me Grow reported there were 425 intakes, but only 235 were entered into Persimmony.
First 5 Sacramento Page 72 of 99 Evaluation Committee Meeting January 31, 2019
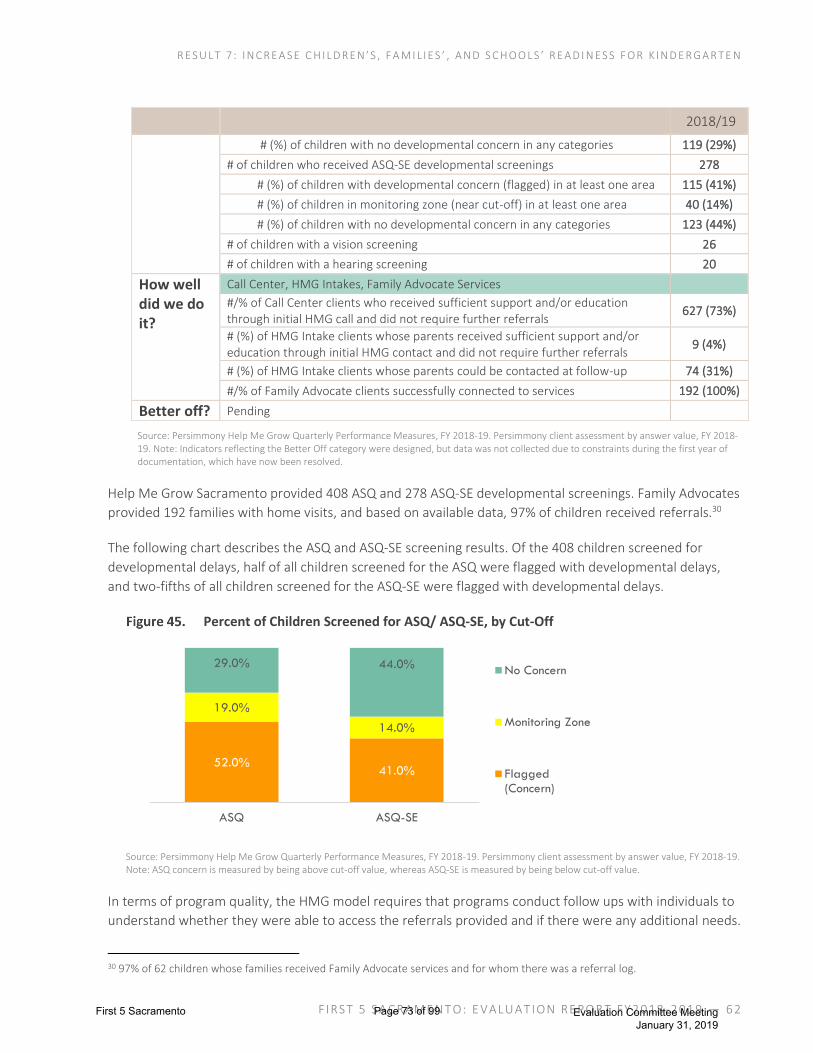
R E S U LT 7 : I N C R E A S E C H I L D R E N ’ S , F A M I L I E S ’ , A N D S C HO O LS ’ R E A D I N E S S F O R K I N D E R G A R T E N
FI RST 5 SA C RAME N T O: E VALUAT I ON RE PO R T FY 2 018 -2 01 9 — 62
2018/19
# (%) of children with no developmental concern in any categories 119 (29%)
# of children who received ASQ-SE developmental screenings 278
# (%) of children with developmental concern (flagged) in at least one area 115 (41%)
# (%) of children in monitoring zone (near cut-off) in at least one area 40 (14%)
# (%) of children with no developmental concern in any categories 123 (44%)
# of children with a vision screening 26
# of children with a hearing screening 20
How well did we do it?
Call Center, HMG Intakes, Family Advocate Services
#/% of Call Center clients who received sufficient support and/or education through initial HMG call and did not require further referrals
627 (73%)
# (%) of HMG Intake clients whose parents received sufficient support and/or education through initial HMG contact and did not require further referrals
9 (4%)
# (%) of HMG Intake clients whose parents could be contacted at follow-up 74 (31%)
#/% of Family Advocate clients successfully connected to services 192 (100%)
Better off? Pending
Source: Persimmony Help Me Grow Quarterly Performance Measures, FY 2018-19. Persimmony client assessment by answer value, FY 2018-19. Note: Indicators reflecting the Better Off category were designed, but data was not collected due to constraints during the first year of documentation, which have now been resolved.
Help Me Grow Sacramento provided 408 ASQ and 278 ASQ-SE developmental screenings. Family Advocates
provided 192 families with home visits, and based on available data, 97% of children received referrals.30
The following chart describes the ASQ and ASQ-SE screening results. Of the 408 children screened for
developmental delays, half of all children screened for the ASQ were flagged with developmental delays,
and two-fifths of all children screened for the ASQ-SE were flagged with developmental delays.
Percent of Children Screened for ASQ/ ASQ-SE, by Cut-Off
Source: Persimmony Help Me Grow Quarterly Performance Measures, FY 2018-19. Persimmony client assessment by answer value, FY 2018-19. Note: ASQ concern is measured by being above cut-off value, whereas ASQ-SE is measured by being below cut-off value.
In terms of program quality, the HMG model requires that programs conduct follow ups with individuals to
understand whether they were able to access the referrals provided and if there were any additional needs.
30 97% of 62 children whose families received Family Advocate services and for whom there was a referral log.
52.0%41.0%
19.0%
14.0%
29.0% 44.0%
ASQ ASQ-SE
No Concern
Monitoring Zone
Flagged(Concern)
First 5 Sacramento Page 73 of 99 Evaluation Committee Meeting January 31, 2019

R E S U LT 7 : I N C R E A S E C H I L D R E N ’ S , F A M I L I E S ’ , A N D S C HO O LS ’ R E A D I N E S S F O R K I N D E R G A R T E N
FI RST 5 SA C RAME N T O: E VALUAT I ON RE PO R T FY 2 018 -2 01 9 — 63
For First 5 Sacramento’s Help Me Grow, nearly two-thirds (62%) of all children screened had parents
contacted at follow-up.
Summary • Nine school districts prepared 4,796 of Sacramento’s most vulnerable children and 4,083 of their
parents/caregivers for school readiness. The nine districts provided a range of services at 46 sites to
promote school readiness among children ages 0-5 and their families, with programs such as
preschool, playgroups, summer kindergarten transition camps and transition activities, screenings
and referrals, family literacy, parent education, engagement and support. In 2018-19, the nine
school districts served 97 children in 40 preschool slots, and 378 children attended a kindergarten
transition summer camp.
• Transition Summer Camp students showed improvement across all three kindergarten skill
areas, with 59% of students improving in kindergarten academics, 44% improving in self-
regulation, and 24% improving in social expression.
• School districts conducted 11,95631 screenings for 3,96932 children to identify potential
delays or concerns related to child development, speech/language, vision, and/or hearing.
As a result, 14% of children screened were provided referrals for speech/language,
followed by vision (9%), developmental needs (2%), and hearing (1%).
• Help Me Grow (HMG) had a robust inaugural year of child assessments and linkages. HMG
received 862 calls to the call line and conducted intakes on 235 children and their families.
Additionally, 408 children aged 0-5 were screened through Help Me Grow for assessments related
to child development, speech/language, vision, and/or hearing.
• Of the children screened for developmental delays, half of all children screened on the ASQ
were flagged with developmental delays, and two-fifths of all children screened on the
ASQ-SE were flagged with developmental delays.
31 Duplicated numbers of overall screens 32 Unduplicated number of children, across all screens
First 5 Sacramento Page 74 of 99 Evaluation Committee Meeting January 31, 2019
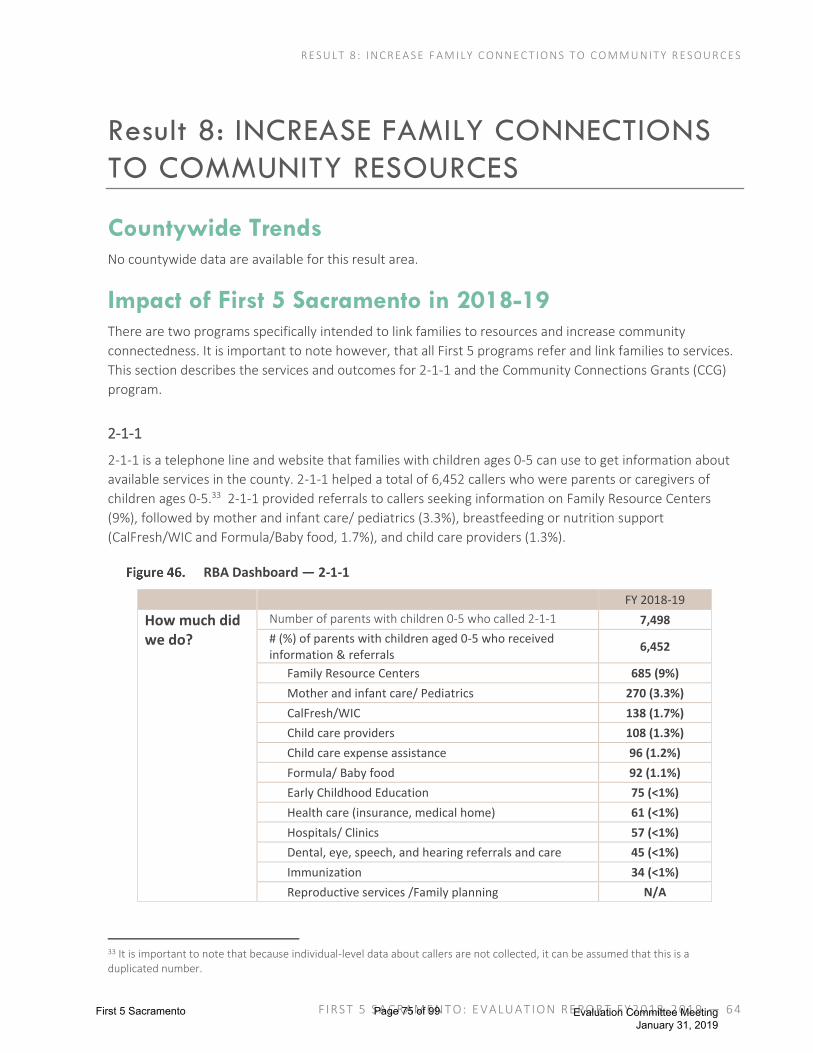
R E S U LT 8 : I N C R E A S E F A M I LY C O N N E C T I O N S T O C O M M U N I T Y R E S O U R C E S
FI RST 5 SA C RAME N T O: E VALUAT I ON RE PO R T FY 2 018 -2 01 9 — 64
Result 8: INCREASE FAMILY CONNECTIONS
TO COMMUNITY RESOURCES
Countywide Trends No countywide data are available for this result area.
Impact of First 5 Sacramento in 2018-19 There are two programs specifically intended to link families to resources and increase community
connectedness. It is important to note however, that all First 5 programs refer and link families to services.
This section describes the services and outcomes for 2-1-1 and the Community Connections Grants (CCG)
program.
2-1-1
2-1-1 is a telephone line and website that families with children ages 0-5 can use to get information about
available services in the county. 2-1-1 helped a total of 6,452 callers who were parents or caregivers of
children ages 0-5.33 2-1-1 provided referrals to callers seeking information on Family Resource Centers
(9%), followed by mother and infant care/ pediatrics (3.3%), breastfeeding or nutrition support
(CalFresh/WIC and Formula/Baby food, 1.7%), and child care providers (1.3%).
RBA Dashboard — 2-1-1
33 It is important to note that because individual-level data about callers are not collected, it can be assumed that this is a duplicated number.
FY 2018-19
How much did we do?
Number of parents with children 0-5 who called 2-1-1 7,498
# (%) of parents with children aged 0-5 who received information & referrals
6,452
Family Resource Centers 685 (9%)
Mother and infant care/ Pediatrics 270 (3.3%)
CalFresh/WIC 138 (1.7%)
Child care providers 108 (1.3%)
Child care expense assistance 96 (1.2%)
Formula/ Baby food 92 (1.1%)
Early Childhood Education 75 (<1%)
Health care (insurance, medical home) 61 (<1%)
Hospitals/ Clinics 57 (<1%)
Dental, eye, speech, and hearing referrals and care 45 (<1%)
Immunization 34 (<1%)
Reproductive services /Family planning N/A
First 5 Sacramento Page 75 of 99 Evaluation Committee Meeting January 31, 2019

R E S U LT 8 : I N C R E A S E F A M I LY C O N N E C T I O N S T O C O M M U N I T Y R E S O U R C E S
FI RST 5 SA C RAME N T O: E VALUAT I ON RE PO R T FY 2 018 -2 01 9 — 65
Source: FY 2018-19 2-1-1 Aggregate Report in Persimmony; How well measures: FY 2018-19 Quarterly Reports submitted to First 5 from 2-1-1. N= 7,498 calls.
In order to evaluate the quality assurance program, 2-1-1 maintains a policy of making follow-up calls to at
least 2% of callers. However, in 2018-19, the program exceeded that target and made call-backs to 8% of
callers to determine if they were able to access the referred services. Amongst those reached, 58%
reported they were able to access the needed services, but 42% had not yet accessed the referred service.
The primary reasons were that they had not tried to contact the agency, and/or the programs had waiting
lists.
COMMUNITY CONNECTIONS GRANTS
The Community Connections Grants were small grants of up to $5,000 given to community members who
facilitate a group with other parents/families in their community. The first set of groups for this program
began in January 2016 (2015-16). The last set of groups in this fiscal year began meeting in July 2018 and
continued to meet through September 2019. Target population, location, and themes were unique to each
group. For example, this year, there were groups focused on reading, and groups for Black mothers, Afghan
mothers, and Muslim mothers, among others. A total of 872 families attended 14 groups.
Attendance
The number of families with at least one child aged 0-5 who attended at least one session of a group ranged
from 1 to 46 sessions, with a mean of 14% of sessions completed out of those offered. Groups met an
average of 24 times, although it is important to note that each group varied in frequency of meetings; while
some groups were held monthly, other groups were held weekly or biweekly.
How well did we do it?
% of calls that were successfully reached with a follow up call (Target: 2%)
8%
% of callers reached who felt that information provided was accurate
100%
% of callers reached who would recommend 2-1-1- to family/ friends
100%
Is anybody better off?
% of callers reached who reported they were able to access referred services
58%
First 5 Sacramento Page 76 of 99 Evaluation Committee Meeting January 31, 2019

R E S U LT 8 : I N C R E A S E F A M I LY C O N N E C T I O N S T O C O M M U N I T Y R E S O U R C E S
FI RST 5 SA C RAME N T O: E VALUAT I ON RE PO R T FY 2 018 -2 01 9 — 66
Community Connections Group Attendance, 2018-19
Group Name # of 0-5 FAMILIES that attended this group *
# of times the group met in 2018-2019
Round 4 Term: January-December 2018
Afghan Mom’s Support Group** 78 28
Black Mother’s Club 32 11
Del Paso Playdates** 16 4
Leer Cantar Jugar - -
Muslimas Sister Circle 53 4
My Child’s Keeper 28 47
Project Twinkle - -
R Babies R Us*** - -
Rhythm & Grooves** 49 14
Sac Pouch Project** 175 19
Tigers on the Move 54 47
Round 5 Term: July 2018-June2019
Dancing Duo* 47 49
Desarolloando la Imaginacion* 51 35
Hora de Cuentos* 71 40
Learn Hmong with Me 69 23
One In Heart* 32 10
Pocket Moms 117 11
TOTALS: 872 FAMILIES 342 Meetings
*Extended through September 2019. **Extended through March 2019. ***Terminated contract in July 2018. Groups were conducted but attendance was not reported; unreported attendance notated with a dash (-). Extension Round 6, which began in January 2019 and extends through March 2020, will be included in the next community report.
Leaders Closure Survey
According to leaders of the Community Connections Groups, the primary benefits for participants were
social connections and resource/ referrals to community activities. When asked to indicate the extent to
which parents in their groups made friends with each other, nearly two-thirds of participants (61%)
indicated “a lot,” while 33% indicated “somewhat.” When asked to indicate the extent to which parents
were connected with community resources, nearly two-thirds of participants (61%) indicated “a lot,” while
33% indicated “somewhat.”
When asked about difficulties, 43% of respondents identified getting members to come back as “extremely
difficult,” “very difficult,” or “somewhat difficult.” Nearly one-third (30%) of participants identified
purchasing and financial reporting as “very difficult” or “somewhat difficult,” followed by recruiting group
members, with approximately one-quarter (26%) of respondents identifying this as “very difficult” or
“somewhat difficult.”
Despite the challenges, 91% of the respondents expressed that it is “not too difficult” or “not difficult at all”
to come up with activity ideas.
Parent Questionnaire
Consistent with group leader responses, the 114 parents who completed the Parent Questionnaire
indicated that the most common benefits to participation were learning about different resources in the
First 5 Sacramento Page 77 of 99 Evaluation Committee Meeting January 31, 2019
R E S U LT 8 : I N C R E A S E F A M I LY C O N N E C T I O N S T O C O M M U N I T Y R E S O U R C E S
FI RST 5 SA C RAME N T O: E VALUAT I ON RE PO R T FY 2 018 -2 01 9 — 67
community for their family (81%) and making new friends (77%). As a result of participation in their group,
almost all (96%) of parents indicated feeling they are more likely to take their child to another program that
benefits their development (such as a playgroup, library, FRC activity, pre-school, etc.).
Similarly, parents reported feeling more confident about the following, as a result of participating in the
group: I feel more connected/bonded with my child (93%), my child is more social (88%), I have used the
resources (71%), I have participated in free activities (67%), and my child has learned new skills to prepare
him/her/them for kindergarten (65%). Additionally, 96% of parents reported that they planned to stay in
touch with other members after the group ended. Of those parents, more than two-thirds (68%) said they
planned to continue meeting as a group, nearly two-thirds (63%) indicated they would stay in touch by
phone and/or social media, and half of participants (50%) said they would have play dates.
Client Success Stories: Community Connections Grant
Groups who received Community Connections Grants reported many successes. The following are two
success stories submitted by Group Leaders, which describe highlights from two groups: Dancing Duo, and
Learn Hmong With Me.
The goal of Dancing Duo was to provide dance classes that would encourage bonding between parents and
children, while fostering a love of music and dance. Through outreach efforts to the Sacramento Public
Library, Birth & Beyond FRCs, Valley Hi FRC, local daycares, SETA, and Facebook, they were able to establish
a steady attendance of their classes throughout the entire term. Dancing Duo’s success in recruiting
families was demonstrated through their ability to take a group field trip to watch a dance recital, as well as
to hold their own dance recital showcase, in which all of the families were able to participate. Moreover,
Dancing Duo received feedback from their families that parents and children were more connected because
they were practicing dance together at home. Furthermore, parents were more connected to their
community as a result of group participation; while 100% of the parent surveys reported that community
resources had been provided to the families, both group leaders also reported that they “strongly agreed”
that parents were connected to resources in the community. Dancing Duo was approved for an extension
through 2019, and they plan to continue meeting in the free studio space they receive from Elite Studio of
Dance.
The goal of the second group, Learn Hmong With Me (LHWM), was for parents and children to gain greater
confidence and appreciation for the Hmong language and culture, while increasing socialization, speech,
and bilingual/ bicultural skills in Hmong and English, to create connections of support systems through new
friends and community resources.
Learn Hmong With Me received tremendous community support in response to their outreach efforts.
Through online and flyer distribution to the Elk Grove Unified School District (EGUSD), Sacramento Public
Library, Valley Hi FRC, SETA, and Facebook, LHWM developed a thriving Facebook group, which is still active
and receives a great amount of engagement from LHWM group members. The Sacramento Public Library
provided meeting spaces for LHWM at the Elk Grove, Southgate, Martin Luther King, Jr., and Colonial
Heights branches. Most impactfully, LHWM developed partnerships with restaurants so that they could
hold fundraisers to network with public school teachers in order to gain access to current standards and
curricula for Hmong instruction. The group also formed additional partnerships to create LHWM t-shirts.
First 5 Sacramento Page 78 of 99 Evaluation Committee Meeting January 31, 2019

R E S U LT 8 : I N C R E A S E F A M I LY C O N N E C T I O N S T O C O M M U N I T Y R E S O U R C E S
FI RST 5 SA C RAME N T O: E VALUAT I ON RE PO R T FY 2 018 -2 01 9 — 68
In terms of program opportunities, LHWM was involved in hosting many community events, such as regular
story times and language lessons, along with other activities, including sensory play. LHWM introduced and
reviewed new sets of vocabulary twice a month, which was separated into engaging subjects, such as
emotions, numbers, and nature. In addition, LHWM hosted several special events, including a Hmong New
Year’s field trip, a Holiday Party, and End of Year Celebration. Group leaders felt that they succeeded in
“bringing families together to build a community around learning Hmong” and felt they were able to “fill a
much needed service for [their] community.”
LHWM is currently sustained by a renewed contract with First Sacramento, although due to their successes,
LHWM group leaders are exploring the potential of establishing nonprofit status once their term is up in
June 2020. The community partnerships that they have gained over the 2018-19 year will greatly help them
in sustaining community resources until the group leaders are able to establish nonprofit status.
FINDINGS ACROSS MULTIPLE FIRST 5 PROGRAMS
Across First 5 programs, partner agencies are encouraged to provide enhanced referrals for families to
meet basic needs and support child-rearing. In 2018-19, amongst the 953 parents with both intake and
follow up data, there was a statistically significant increase in the percentage of parents who knew which
resources to contact for help with basic needs, and for advice on child-rearing. Most respondents
participated in School Readiness programs through the nine school districts, and some participated in WIC,
or Birth & Beyond. The figure below shows the percentage of respondents who agreed or strongly agreed
with each statement.
Changes in Parent Attitudes Related to Support and Connectedness
Source: Family Information Forms completed in FY 2018-19. N=953 individuals with both intake and follow-up data.
71% 70%76% 75%
I know what program to contact in my community when I needhelp for basic needs.*
I know what program to contact in my community when I needadvice on how to raise my child.*
Intake
Follow-up
First 5 Sacramento Page 79 of 99 Evaluation Committee Meeting January 31, 2019

R E S U LT 8 : I N C R E A S E F A M I LY C O N N E C T I O N S T O C O M M U N I T Y R E S O U R C E S
FI RST 5 SA C RAME N T O: E VALUAT I ON RE PO R T FY 2 018 -2 01 9 — 69
Summary • Sacramento County’s 2-1-1 helped connect 7,498 parents with a child ages 0 to 5 to critical
community resources. 2-1-1 provided referrals to callers seeking information on Family Resource
Centers (9%), followed by mother and infant care/ pediatrics (3.3%), breastfeeding or nutrition
support (CalFresh/WIC and Formula/Baby food, 1.7%), and child care providers (1.3%). In follow-up
calls made to clients, a high level of customer satisfaction was found, in that nearly all respondents
reported that the information provided was accurate and that they would recommend 2-1-1 to
family and friends.
• Community Connections Groups (CCG) created enduring social bonds and service connections to
over 872 families in 14 groups throughout Sacramento communities. Participating families
attended a total of 342 meetings. The central benefits of group participation identified by group
leaders and participants were creating connections to other families and local community resources,
sentiments shared in previous years. In 2018-19, 96% of parents reported that they planned to stay
in touch with other members after the group ended. Most notably, as a result of participation in
their group, 96% of parents indicated feeling they are more likely to take their child to another
program that benefits their development (such as a playgroup, library, FRC activity, pre-school, etc.).
• Across multiple First 5 programs, parents’ knowledge of social support and community resources is
strong. In 2018-19, amongst the 953 parents with both intake and follow up data, there was a
statistically significant increase in the percentage of parents who knew which resources to contact
for help with basic needs, and for advice on child-rearing.
First 5 Sacramento Page 80 of 99 Evaluation Committee Meeting January 31, 2019
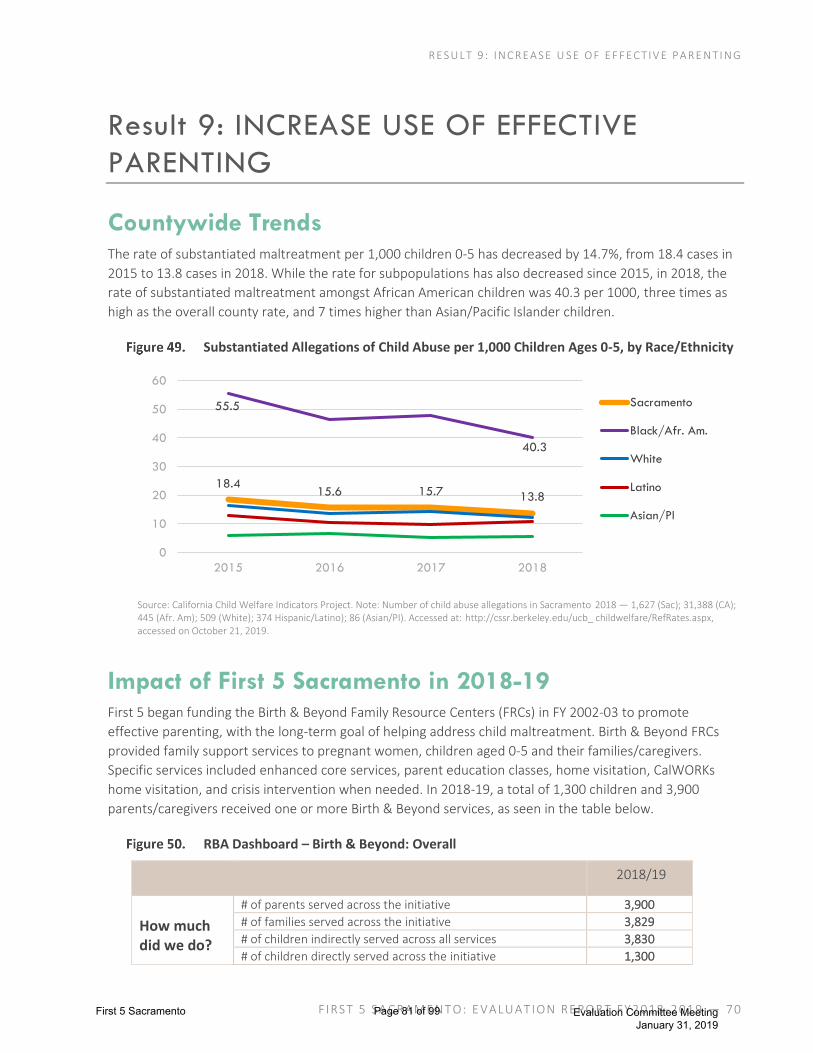
R E S U LT 9 : I N C R E A S E U S E O F E F F E C T I V E P A R E N T I N G
FI RST 5 SA C RAME N T O: E VALUAT I ON RE PO R T FY 2 018 -2 01 9 — 70
Result 9: INCREASE USE OF EFFECTIVE
PARENTING
Countywide Trends The rate of substantiated maltreatment per 1,000 children 0-5 has decreased by 14.7%, from 18.4 cases in
2015 to 13.8 cases in 2018. While the rate for subpopulations has also decreased since 2015, in 2018, the
rate of substantiated maltreatment amongst African American children was 40.3 per 1000, three times as
high as the overall county rate, and 7 times higher than Asian/Pacific Islander children.
Substantiated Allegations of Child Abuse per 1,000 Children Ages 0-5, by Race/Ethnicity
Source: California Child Welfare Indicators Project. Note: Number of child abuse allegations in Sacramento 2018 — 1,627 (Sac); 31,388 (CA); 445 (Afr. Am); 509 (White); 374 Hispanic/Latino); 86 (Asian/PI). Accessed at: http://cssr.berkeley.edu/ucb_ childwelfare/RefRates.aspx, accessed on October 21, 2019.
Impact of First 5 Sacramento in 2018-19 First 5 began funding the Birth & Beyond Family Resource Centers (FRCs) in FY 2002-03 to promote
effective parenting, with the long-term goal of helping address child maltreatment. Birth & Beyond FRCs
provided family support services to pregnant women, children aged 0-5 and their families/caregivers.
Specific services included enhanced core services, parent education classes, home visitation, CalWORKs
home visitation, and crisis intervention when needed. In 2018-19, a total of 1,300 children and 3,900
parents/caregivers received one or more Birth & Beyond services, as seen in the table below.
RBA Dashboard – Birth & Beyond: Overall
2018/19
How much did we do?
# of parents served across the initiative 3,900
# of families served across the initiative 3,829
# of children indirectly served across all services 3,830
# of children directly served across the initiative 1,300
18.415.6 15.7 13.8
55.5
40.3
0
10
20
30
40
50
60
2015 2016 2017 2018
Sacramento
Black/Afr. Am.
White
Latino
Asian/PI
First 5 Sacramento Page 81 of 99 Evaluation Committee Meeting January 31, 2019

R E S U LT 9 : I N C R E A S E U S E O F E F F E C T I V E P A R E N T I N G
FI RST 5 SA C RAME N T O: E VALUAT I ON RE PO R T FY 2 018 -2 01 9 — 71
2018/19
Average number of hours served 1.16
Enhanced Referrals
Health (insurance, medical home, well-child visits) 4,269
Help Me Grow 184
Crisis Nursery 1,508
Source: Persimmony report By Client Demographic for Birth & Beyond, FY 2018-19.
ENHANCED CORE SERVICES Activities in the Enhanced Core service categories included workshops/classes, referrals, peer support groups, Medi-Cal application assistance, infant safe sleep classes34, and community events (e.g., movie nights, health fairs, and/or festivals). Enhanced Core Services provided 6,641 services to 928 families and 476 children. In terms of service impact, approximately one-third of clients (35%) engaged in other FRC services, with 20% receiving Home Visitation, 11% receiving Parent Education classes, and 4% receiving Crisis Intervention Services. The table below presents the RBA dashboard for B&B’s Enhanced Core component in 2018-19.
RBA Dashboard — Birth & Beyond: FRC Enhanced Core
2018/19
How much did we do?
Total # of unduplicated families served by Enhanced Core
928
Total # of duplicated Enhanced Core Services 6,641
# of duplicated Play Care Services provided35 2,707
# of times non-EPI Enhanced Core Services provided36
Car Seat Safety (workshop) 931
How well did we do it? Level of Service
Average # of hours of participation 7.66
Is anyone better off? Engagement in other FRC Services
% receiving Home Visitation 20%
% receiving Parent Education classes 11%
% receiving Crisis Intervention 4%
Source: FY 2018-19 Quarterly Performance Measures Report and Persimmony Client Services and Assessments Export.
PARENT EDUCATION
Parent education classes were group-based classes conducted at Family Resource Centers. To support parent attendance, transportation services are provided, as well as Play Care (i.e., child care) services during class time. Seven hundred sixteen parents attended 29 parenting workshops, while 626 children attended Play Care. Program hours per workshop ranged from 18-32 hours per workshop series. The two workshops with the highest completion rate (at least 80% of classes) were the Nurturing Parenting Program Fathers
34 Separate dashboard for Infant Safe Sleep. 35 Includes children whose parents were attending Parent Education workshops and/or participating in enhanced core services. 36 EPI: Effective Parenting Intervention. Non-EPI classes/workshops are classes/workshops are often one-time or only a few sessions
and do not follow a prescribed evidence-based curricula. (This is in contrast to EPI interventions such as Nurturing Parenting Program and Make Parenting a Pleasure.)
First 5 Sacramento Page 82 of 99 Evaluation Committee Meeting January 31, 2019
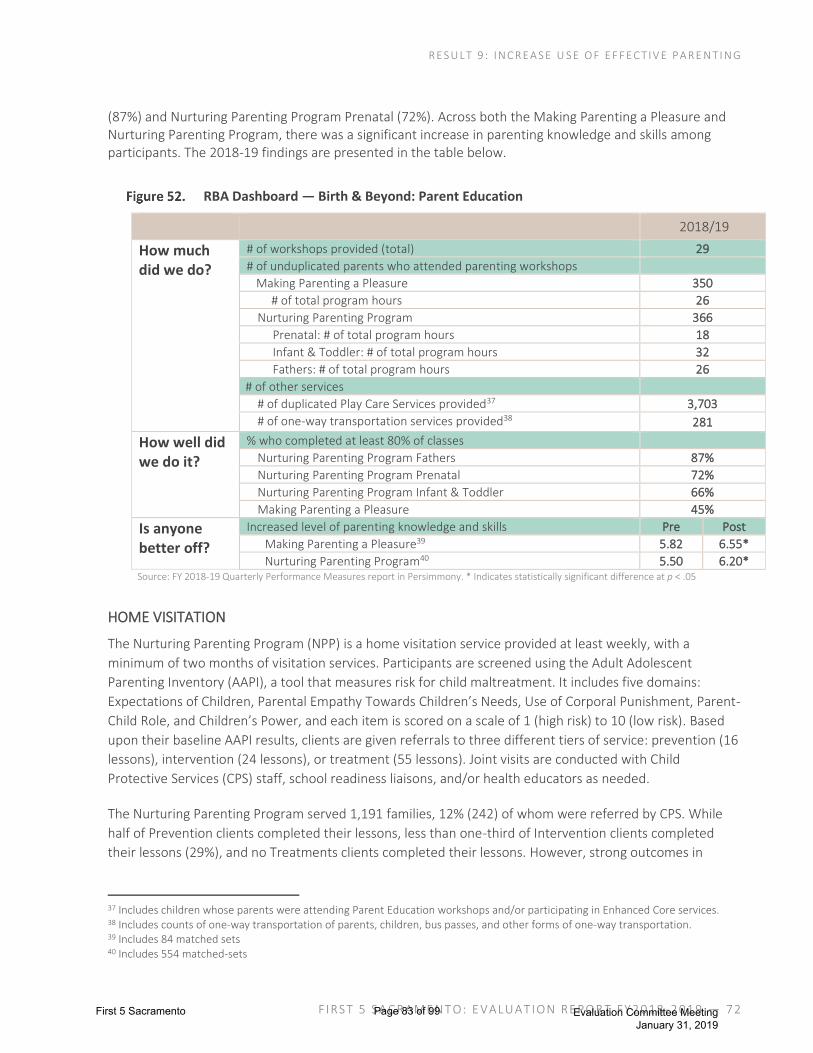
R E S U LT 9 : I N C R E A S E U S E O F E F F E C T I V E P A R E N T I N G
FI RST 5 SA C RAME N T O: E VALUAT I ON RE PO R T FY 2 018 -2 01 9 — 72
(87%) and Nurturing Parenting Program Prenatal (72%). Across both the Making Parenting a Pleasure and Nurturing Parenting Program, there was a significant increase in parenting knowledge and skills among participants. The 2018-19 findings are presented in the table below.
RBA Dashboard — Birth & Beyond: Parent Education
2018/19
How much did we do?
# of workshops provided (total) 29
# of unduplicated parents who attended parenting workshops
Making Parenting a Pleasure 350
# of total program hours 26
Nurturing Parenting Program 366
Prenatal: # of total program hours 18
Infant & Toddler: # of total program hours 32
Fathers: # of total program hours 26
# of other services
# of duplicated Play Care Services provided37 3,703
# of one-way transportation services provided38 281
How well did we do it?
% who completed at least 80% of classes
Nurturing Parenting Program Fathers 87%
Nurturing Parenting Program Prenatal 72%
Nurturing Parenting Program Infant & Toddler 66%
Making Parenting a Pleasure 45%
Is anyone better off?
Increased level of parenting knowledge and skills Pre Post
Making Parenting a Pleasure39 5.82 6.55*
Nurturing Parenting Program40 5.50 6.20* Source: FY 2018-19 Quarterly Performance Measures report in Persimmony. * Indicates statistically significant difference at p < .05
HOME VISITATION
The Nurturing Parenting Program (NPP) is a home visitation service provided at least weekly, with a
minimum of two months of visitation services. Participants are screened using the Adult Adolescent
Parenting Inventory (AAPI), a tool that measures risk for child maltreatment. It includes five domains:
Expectations of Children, Parental Empathy Towards Children’s Needs, Use of Corporal Punishment, Parent-
Child Role, and Children’s Power, and each item is scored on a scale of 1 (high risk) to 10 (low risk). Based
upon their baseline AAPI results, clients are given referrals to three different tiers of service: prevention (16
lessons), intervention (24 lessons), or treatment (55 lessons). Joint visits are conducted with Child
Protective Services (CPS) staff, school readiness liaisons, and/or health educators as needed.
The Nurturing Parenting Program served 1,191 families, 12% (242) of whom were referred by CPS. While
half of Prevention clients completed their lessons, less than one-third of Intervention clients completed
their lessons (29%), and no Treatments clients completed their lessons. However, strong outcomes in
37 Includes children whose parents were attending Parent Education workshops and/or participating in Enhanced Core services. 38 Includes counts of one-way transportation of parents, children, bus passes, and other forms of one-way transportation. 39 Includes 84 matched sets 40 Includes 554 matched-sets
First 5 Sacramento Page 83 of 99 Evaluation Committee Meeting January 31, 2019

R E S U LT 9 : I N C R E A S E U S E O F E F F E C T I V E P A R E N T I N G
FI RST 5 SA C RAME N T O: E VALUAT I ON RE PO R T FY 2 018 -2 01 9 — 73
increased social connections and knowledge of community resources were observed, as were positive
changes in parenting attitudes and contacts with CPS.
RBA Dashboard — Birth & Beyond: Home Visitation Services
2018/19
How much did we do?
# of unduplicated families who received home visits through NPP 1,191
# of unduplicated families who developed a Family Nurturing Plan (in FY)41 415
# (%) referred by CPS 242 (12%)
Program Assignment
% who are assigned to ITP Prevention (low risk) 44%
% who are assigned to ITP Intervention (moderate risk) 44%
% who are assigned to ITP Treatment (high risk) 12%
# of unduplicated families who received joint visits with:
CPS 23
Health Liaison 223
How well did we do it?
# of lessons completed at case closure42
% of Prevention clients who completed at least 16 lessons 50%
% of Intervention clients who completed at least 24 lessons 29%
% of Treatment clients who completed at least 55 lessons 0%
Is anyone better off?
% of parents who are connected and supported (Percent who agree or strongly agree at pre/post;
Pre Post
I am confident in my ability to help my child grow and develop. 83% 83%
I know what to expect at each stage of my child’s development. 60% 70%*
I know what program to contact in my community when I need help for basic needs (e.g. housing, food, employment).
58% 76%*
I know what program to contact in my community when I need advice on how to raise my child.
60% 83%*
Improved parenting (Adult Adolescent Parenting Inventory)43 Pre Post
Prevention Group (Low risk; n= 41) 6.0 6.9*
Intervention Group (Moderate risk; n= 97) 5.4 6.5*
Treatment Group (High risk; n= 20) 3.7 5.3*
Substantiated maltreatment 12 months after first home visit, ages 0-5, by subpopulation44
Children with no prior CPS contact (n = 635) <1%
Children with any prior CPS contact (n = 426) 11%
Children with a substantiated baseline referral (n = 41) 24%
All groups (n = 1,061) 5%
Source: FY 2018-19 Quarterly Performance Measures report in Persimmony, and Family Information Form. * indicates statistically significant change.
41 It is important to note that since families could have begun NPP lessons in the previous fiscal year, this number does not represent all families who had a Family Nurturing Plan. 42 Data for hours of service at case closure, AAPI. 43 Among those who had both pre- and post-data 44 These data were provided by CAPC and include families who were served between Sept 2018 and Aug 2019.
First 5 Sacramento Page 84 of 99 Evaluation Committee Meeting January 31, 2019
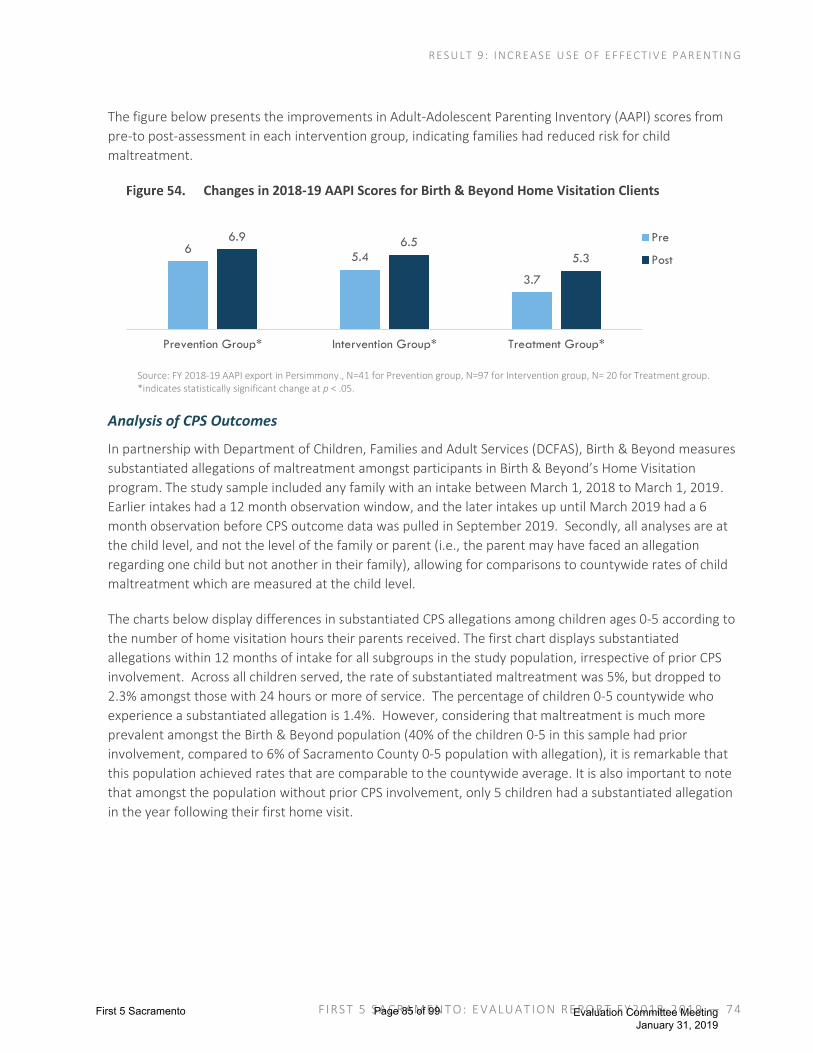
R E S U LT 9 : I N C R E A S E U S E O F E F F E C T I V E P A R E N T I N G
FI RST 5 SA C RAME N T O: E VALUAT I ON RE PO R T FY 2 018 -2 01 9 — 74
The figure below presents the improvements in Adult-Adolescent Parenting Inventory (AAPI) scores from
pre-to post-assessment in each intervention group, indicating families had reduced risk for child
maltreatment.
Changes in 2018-19 AAPI Scores for Birth & Beyond Home Visitation Clients
Source: FY 2018-19 AAPI export in Persimmony., N=41 for Prevention group, N=97 for Intervention group, N= 20 for Treatment group. *indicates statistically significant change at p < .05.
Analysis of CPS Outcomes
In partnership with Department of Children, Families and Adult Services (DCFAS), Birth & Beyond measures
substantiated allegations of maltreatment amongst participants in Birth & Beyond’s Home Visitation
program. The study sample included any family with an intake between March 1, 2018 to March 1, 2019.
Earlier intakes had a 12 month observation window, and the later intakes up until March 2019 had a 6
month observation before CPS outcome data was pulled in September 2019. Secondly, all analyses are at
the child level, and not the level of the family or parent (i.e., the parent may have faced an allegation
regarding one child but not another in their family), allowing for comparisons to countywide rates of child
maltreatment which are measured at the child level.
The charts below display differences in substantiated CPS allegations among children ages 0-5 according to
the number of home visitation hours their parents received. The first chart displays substantiated
allegations within 12 months of intake for all subgroups in the study population, irrespective of prior CPS
involvement. Across all children served, the rate of substantiated maltreatment was 5%, but dropped to
2.3% amongst those with 24 hours or more of service. The percentage of children 0-5 countywide who
experience a substantiated allegation is 1.4%. However, considering that maltreatment is much more
prevalent amongst the Birth & Beyond population (40% of the children 0-5 in this sample had prior
involvement, compared to 6% of Sacramento County 0-5 population with allegation), it is remarkable that
this population achieved rates that are comparable to the countywide average. It is also important to note
that amongst the population without prior CPS involvement, only 5 children had a substantiated allegation
in the year following their first home visit.
65.4
3.7
6.9 6.5
5.3
Prevention Group* Intervention Group* Treatment Group*
Pre
Post
First 5 Sacramento Page 85 of 99 Evaluation Committee Meeting January 31, 2019
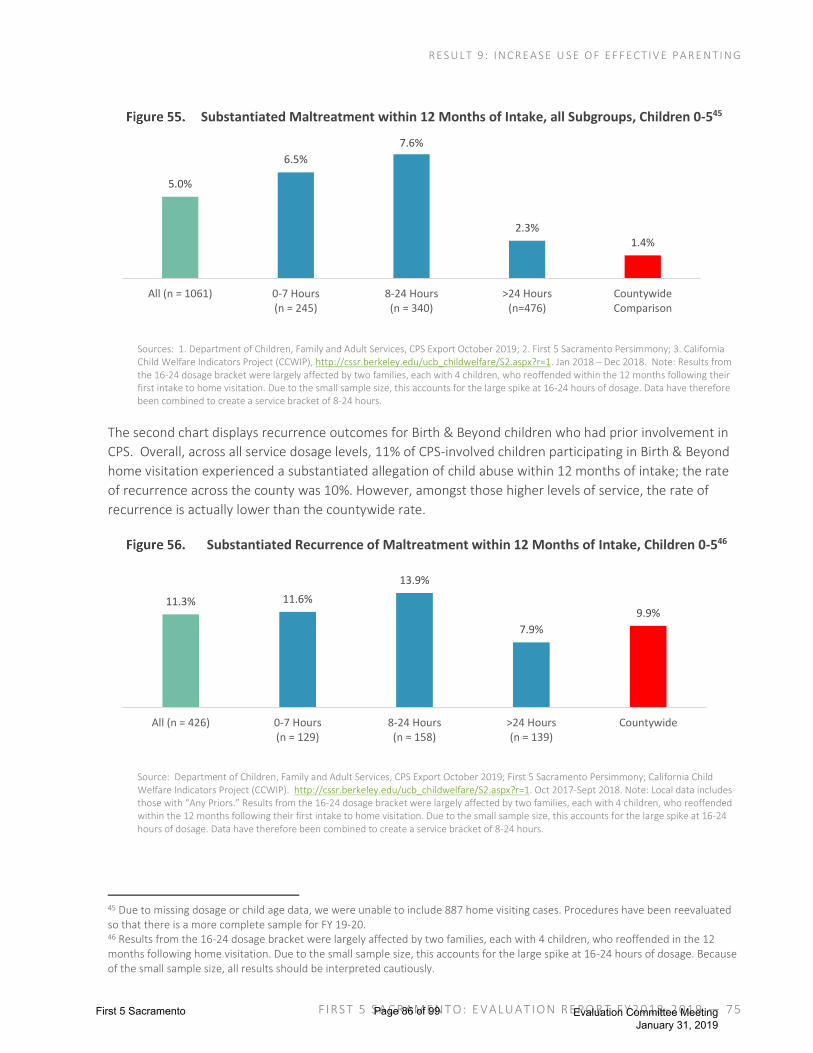
R E S U LT 9 : I N C R E A S E U S E O F E F F E C T I V E P A R E N T I N G
FI RST 5 SA C RAME N T O: E VALUAT I ON RE PO R T FY 2 018 -2 01 9 — 75
Substantiated Maltreatment within 12 Months of Intake, all Subgroups, Children 0-545
Sources: 1. Department of Children, Family and Adult Services, CPS Export October 2019; 2. First 5 Sacramento Persimmony; 3. California Child Welfare Indicators Project (CCWIP), http://cssr.berkeley.edu/ucb_childwelfare/S2.aspx?r=1. Jan 2018 – Dec 2018. Note: Results from the 16-24 dosage bracket were largely affected by two families, each with 4 children, who reoffended within the 12 months following their first intake to home visitation. Due to the small sample size, this accounts for the large spike at 16-24 hours of dosage. Data have therefore been combined to create a service bracket of 8-24 hours.
The second chart displays recurrence outcomes for Birth & Beyond children who had prior involvement in
CPS. Overall, across all service dosage levels, 11% of CPS-involved children participating in Birth & Beyond
home visitation experienced a substantiated allegation of child abuse within 12 months of intake; the rate
of recurrence across the county was 10%. However, amongst those higher levels of service, the rate of
recurrence is actually lower than the countywide rate.
Substantiated Recurrence of Maltreatment within 12 Months of Intake, Children 0-546
Source: Department of Children, Family and Adult Services, CPS Export October 2019; First 5 Sacramento Persimmony; California Child Welfare Indicators Project (CCWIP). http://cssr.berkeley.edu/ucb_childwelfare/S2.aspx?r=1. Oct 2017-Sept 2018. Note: Local data includes those with “Any Priors.” Results from the 16-24 dosage bracket were largely affected by two families, each with 4 children, who reoffended within the 12 months following their first intake to home visitation. Due to the small sample size, this accounts for the large spike at 16-24 hours of dosage. Data have therefore been combined to create a service bracket of 8-24 hours.
45 Due to missing dosage or child age data, we were unable to include 887 home visiting cases. Procedures have been reevaluated so that there is a more complete sample for FY 19-20. 46 Results from the 16-24 dosage bracket were largely affected by two families, each with 4 children, who reoffended in the 12 months following home visitation. Due to the small sample size, this accounts for the large spike at 16-24 hours of dosage. Because of the small sample size, all results should be interpreted cautiously.
5.0%
6.5%
7.6%
2.3%1.4%
All (n = 1061) 0-7 Hours(n = 245)
8-24 Hours(n = 340)
>24 Hours(n=476)
CountywideComparison
11.3% 11.6%
13.9%
7.9%
9.9%
All (n = 426) 0-7 Hours(n = 129)
8-24 Hours(n = 158)
>24 Hours(n = 139)
Countywide
First 5 Sacramento Page 86 of 99 Evaluation Committee Meeting January 31, 2019

R E S U LT 9 : I N C R E A S E U S E O F E F F E C T I V E P A R E N T I N G
FI RST 5 SA C RAME N T O: E VALUAT I ON RE PO R T FY 2 018 -2 01 9 — 76
CALWORKS-FUNDED HOME VISITATION
As part of continuing efforts to assure program sustainability, in Spring 2019, Birth & Beyond was awarded a
multi-year grant from the California Department of Social Services to provide home visitation services to
families receiving CalWORKs. First 5 Sacramento provides administrative and evaluation support for the
grant. Birth & Beyond receives referrals from the Sacramento County Department of Children, Families and
Adults and uses the evidence-based home visitation model known as Healthy Families America (HFA).
Enrollment in HFA is restricted to mothers who are pregnant or have an infant up to three months of age.
By using the HFA model, Birth & Beyond hopes to identity and address family and child hardships to reduce
stress in the home, nurture positive parent-child interactions and improve family stability. This program
began in April 2019 and the following data represents three months of service (April – June 2019).
The Healthy Families America home visitation program helped 24 adults and 32 children through 174 home
visitations and 9 developmental screenings conducted. The most common service referrals made were for
mental health (10), housing support (5), and work readiness (5), aside from “other services,” which ranked
highest (13). Although the most common referred services that were followed up after a referral were for
early learning settings or parent/ child interaction activity (3), housing support (3), and immigration legal
services (2), aside from “other services,” which ranked highest (13).
RBA Dashboard — Birth & Beyond: CalWORKs Home Visitation Services47
2018/19
How much did we do?
Numbers served by Healthy Families America
Adults 24
Children 32
Referrals to Program
From Department of Human Assistance 6
From B&B 25
Other 57
No Answer 9
Recruitment by B&B
Offered by HVP services 97
Declined HVP services 32
Received HVP services 56
Pending 9
Core Services
Home visits completed 174
Number of developmental screenings and assessments conducted 9
Referrals given
Developmental screening 1
Prenatal care 2
Infant and toddler health care 1
Infant and child nutrition services 3
Early learning settings or parent/child interaction activity 3
Work readiness services 5
Academic or instructional services 3
Intimate partner violence services 4
47 The CalWORKs program operated from April-June 2019, so these data do not represent an entire year of service
First 5 Sacramento Page 87 of 99 Evaluation Committee Meeting January 31, 2019

R E S U LT 9 : I N C R E A S E U S E O F E F F E C T I V E P A R E N T I N G
FI RST 5 SA C RAME N T O: E VALUAT I ON RE PO R T FY 2 018 -2 01 9 — 77
2018/19
Substance abuse services 1
Mental health services 10
Housing support 5
Immigration legal services 2
English as second language services 0
Other services 13
How well did we do it?
Services received after referral
Developmental screening 1
Prenatal care 1
Infant and toddler health care 0
Infant and child nutrition services 1
Early learning settings or parent/child interaction activity 3
Work readiness services 1
Academic or instructional services 0
Intimate partner violence services 0
Substance abuse services 1
Mental health services 1
Housing support 3
Immigration legal services 2
English as second language services 0
Other services 13
Is anyone better off?
Outcomes TBA
Source: FY 2018-19 Assessment by Answer Value report in Persimmony
CRISIS INTERVENTION SERVICES
Crisis Intervention Services (CIS) are brief, targeted services for Birth & Beyond clients who are experiencing
a pressing concerns or issue. The CIS team conducts an intake with a brief assessment tool based upon the
Family Development Matrix (FDM) outcomes model and provides case management and referrals to Family
Resource Centers and the Crisis Nursery, as appropriate. Crisis Intervention Services served 1,671 families
and provided 1,357 families with at least one referral or linkage. Pre- and post-tests of Crisis Intervention
Services clients indicated a decrease in stress, and an increase in parents’ knowledge about where to get
help and information, as well as an increase in parents’ perception of the level of support they have among
their family, friends, or in their community.
First 5 Sacramento Page 88 of 99 Evaluation Committee Meeting January 31, 2019
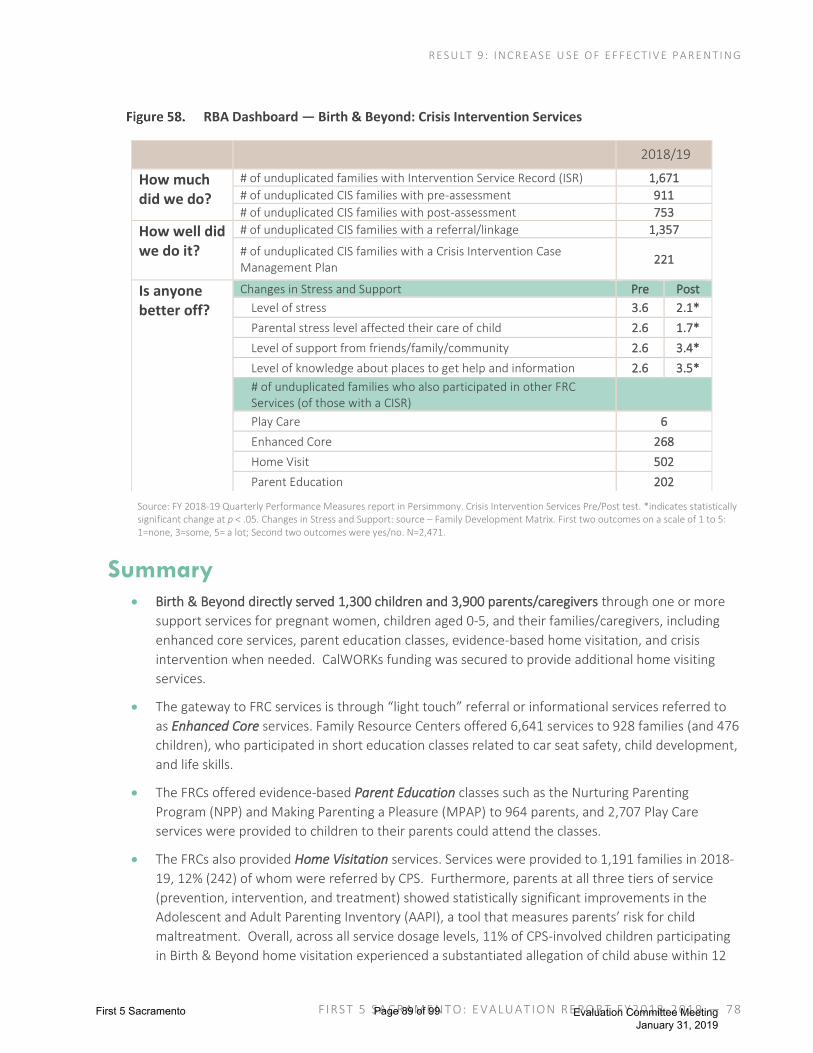
R E S U LT 9 : I N C R E A S E U S E O F E F F E C T I V E P A R E N T I N G
FI RST 5 SA C RAME N T O: E VALUAT I ON RE PO R T FY 2 018 -2 01 9 — 78
RBA Dashboard — Birth & Beyond: Crisis Intervention Services
Source: FY 2018-19 Quarterly Performance Measures report in Persimmony. Crisis Intervention Services Pre/Post test. *indicates statistically significant change at p < .05. Changes in Stress and Support: source – Family Development Matrix. First two outcomes on a scale of 1 to 5: 1=none, 3=some, 5= a lot; Second two outcomes were yes/no. N=2,471.
Summary • Birth & Beyond directly served 1,300 children and 3,900 parents/caregivers through one or more
support services for pregnant women, children aged 0-5, and their families/caregivers, including
enhanced core services, parent education classes, evidence-based home visitation, and crisis
intervention when needed. CalWORKs funding was secured to provide additional home visiting
services.
• The gateway to FRC services is through “light touch” referral or informational services referred to
as Enhanced Core services. Family Resource Centers offered 6,641 services to 928 families (and 476
children), who participated in short education classes related to car seat safety, child development,
and life skills.
• The FRCs offered evidence-based Parent Education classes such as the Nurturing Parenting
Program (NPP) and Making Parenting a Pleasure (MPAP) to 964 parents, and 2,707 Play Care
services were provided to children to their parents could attend the classes.
• The FRCs also provided Home Visitation services. Services were provided to 1,191 families in 2018-
19, 12% (242) of whom were referred by CPS. Furthermore, parents at all three tiers of service
(prevention, intervention, and treatment) showed statistically significant improvements in the
Adolescent and Adult Parenting Inventory (AAPI), a tool that measures parents’ risk for child
maltreatment. Overall, across all service dosage levels, 11% of CPS-involved children participating
in Birth & Beyond home visitation experienced a substantiated allegation of child abuse within 12
2018/19
How much did we do?
# of unduplicated families with Intervention Service Record (ISR) 1,671
# of unduplicated CIS families with pre-assessment 911
# of unduplicated CIS families with post-assessment 753
How well did we do it?
# of unduplicated CIS families with a referral/linkage 1,357
# of unduplicated CIS families with a Crisis Intervention Case Management Plan
221
Is anyone better off?
Changes in Stress and Support Pre Post
Level of stress 3.6 2.1*
Parental stress level affected their care of child 2.6 1.7*
Level of support from friends/family/community 2.6 3.4*
Level of knowledge about places to get help and information 2.6 3.5*
# of unduplicated families who also participated in other FRC Services (of those with a CISR)
Play Care 6
Enhanced Core 268
Home Visit 502
Parent Education 202
First 5 Sacramento Page 89 of 99 Evaluation Committee Meeting January 31, 2019

R E S U LT 9 : I N C R E A S E U S E O F E F F E C T I V E P A R E N T I N G
FI RST 5 SA C RAME N T O: E VALUAT I ON RE PO R T FY 2 018 -2 01 9 — 79
months of intake; the rate of recurrence across the county was 10%. However, amongst those
higher levels of service, the rate of recurrence is actually lower than the countywide rate.
• The CalWORKs Home Visitation program, Healthy Families America, supports families on CalWORKs
through home visitation services, with the hope of addressing additional family and child hardships
to ensure that each family can meet their family stability goals. This program began in April 2019
and the following data represents three months of service (April – June 2019). Healthy Families
America helped 24 adults and 32 children through 174 home visitations and 9 developmental
screenings conducted. The most common service referrals made were for mental health (10),
housing support (5), and work readiness (5). The referrals most likely to be followed up were early
learning settings or parent/ child interaction activity (3), housing support (3), and immigration legal
services (2).
• Crisis Intervention Services served 1,671
families with significant resource needs,
helping to increase their knowledge of
community resources, increase their
perception of social support, and reduce
their stress. Pre- and post-tests of Crisis
Intervention Services clients indicated
increased parental knowledge about
where to get help and information,
perception of the level of support they
have among their family, friends, or in
their community, and decreased stress.
First 5 Sacramento Page 90 of 99 Evaluation Committee Meeting January 31, 2019
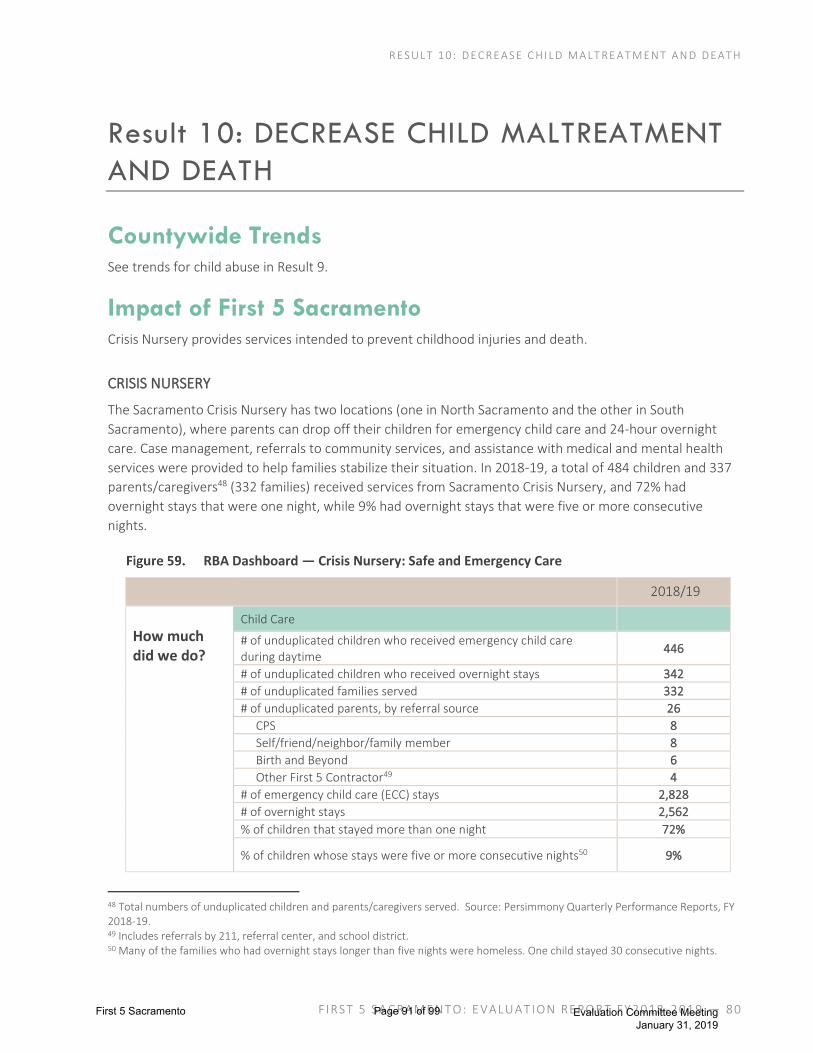
R E S U LT 1 0 : D E C R E A S E C HI LD M A LT R E A T M E N T A N D D E A T H
FI RST 5 SA C RAME N T O: E VALUAT I ON RE PO R T FY 2 018 -2 01 9 — 80
Result 10: DECREASE CHILD MALTREATMENT
AND DEATH Countywide Trends See trends for child abuse in Result 9.
Impact of First 5 Sacramento Crisis Nursery provides services intended to prevent childhood injuries and death.
CRISIS NURSERY
The Sacramento Crisis Nursery has two locations (one in North Sacramento and the other in South
Sacramento), where parents can drop off their children for emergency child care and 24-hour overnight
care. Case management, referrals to community services, and assistance with medical and mental health
services were provided to help families stabilize their situation. In 2018-19, a total of 484 children and 337
parents/caregivers48 (332 families) received services from Sacramento Crisis Nursery, and 72% had
overnight stays that were one night, while 9% had overnight stays that were five or more consecutive
nights.
RBA Dashboard — Crisis Nursery: Safe and Emergency Care
2018/19
How much did we do?
Child Care
# of unduplicated children who received emergency child care during daytime
446
# of unduplicated children who received overnight stays 342
# of unduplicated families served 332
# of unduplicated parents, by referral source 26
CPS 8
Self/friend/neighbor/family member 8
Birth and Beyond 6
Other First 5 Contractor49 4
# of emergency child care (ECC) stays 2,828
# of overnight stays 2,562
% of children that stayed more than one night 72%
% of children whose stays were five or more consecutive nights50 9%
48 Total numbers of unduplicated children and parents/caregivers served. Source: Persimmony Quarterly Performance Reports, FY 2018-19. 49 Includes referrals by 211, referral center, and school district. 50 Many of the families who had overnight stays longer than five nights were homeless. One child stayed 30 consecutive nights.
First 5 Sacramento Page 91 of 99 Evaluation Committee Meeting January 31, 2019
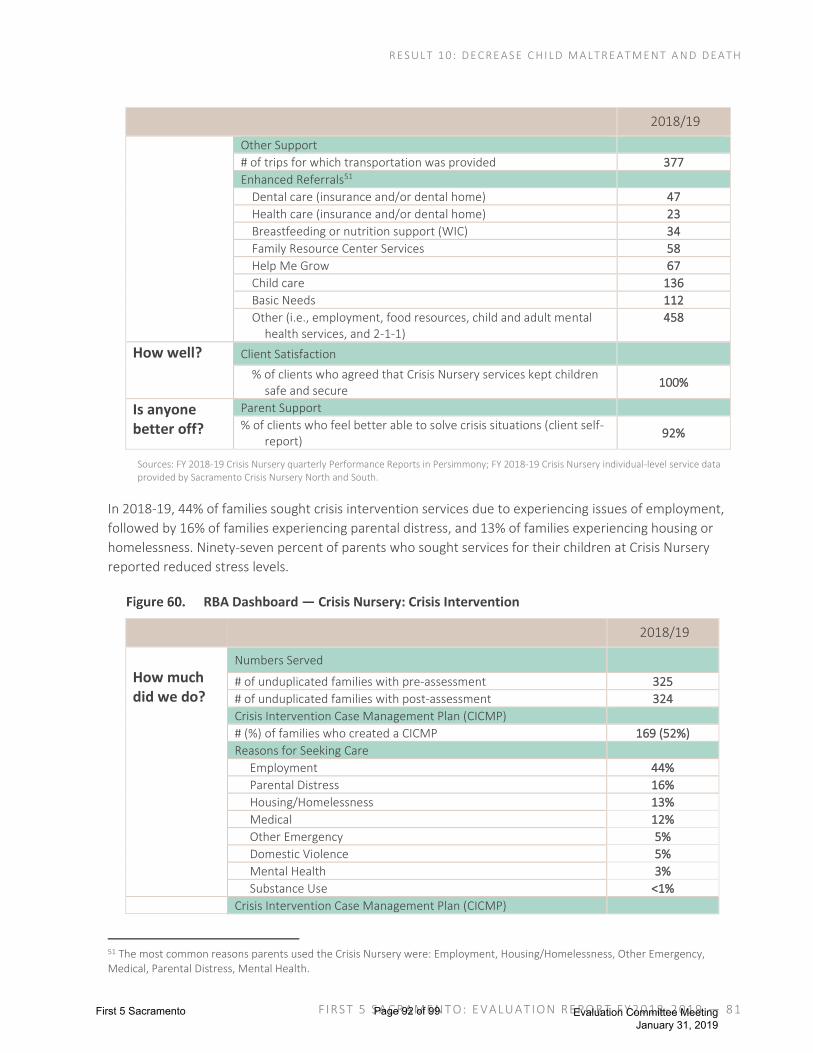
R E S U LT 1 0 : D E C R E A S E C HI LD M A LT R E A T M E N T A N D D E A T H
FI RST 5 SA C RAME N T O: E VALUAT I ON RE PO R T FY 2 018 -2 01 9 — 81
2018/19
Other Support
# of trips for which transportation was provided 377
Enhanced Referrals51
Dental care (insurance and/or dental home) 47
Health care (insurance and/or dental home) 23
Breastfeeding or nutrition support (WIC) 34
Family Resource Center Services 58
Help Me Grow 67
Child care 136
Basic Needs 112
Other (i.e., employment, food resources, child and adult mental health services, and 2-1-1)
458
How well? Client Satisfaction
% of clients who agreed that Crisis Nursery services kept children safe and secure
100%
Is anyone better off?
Parent Support
% of clients who feel better able to solve crisis situations (client self-report)
92%
Sources: FY 2018-19 Crisis Nursery quarterly Performance Reports in Persimmony; FY 2018-19 Crisis Nursery individual-level service data provided by Sacramento Crisis Nursery North and South.
In 2018-19, 44% of families sought crisis intervention services due to experiencing issues of employment,
followed by 16% of families experiencing parental distress, and 13% of families experiencing housing or
homelessness. Ninety-seven percent of parents who sought services for their children at Crisis Nursery
reported reduced stress levels.
RBA Dashboard — Crisis Nursery: Crisis Intervention
2018/19
How much did we do?
Numbers Served
# of unduplicated families with pre-assessment 325
# of unduplicated families with post-assessment 324
Crisis Intervention Case Management Plan (CICMP)
# (%) of families who created a CICMP 169 (52%)
Reasons for Seeking Care
Employment 44%
Parental Distress 16%
Housing/Homelessness 13%
Medical 12%
Other Emergency 5%
Domestic Violence 5%
Mental Health 3%
Substance Use <1%
Crisis Intervention Case Management Plan (CICMP)
51 The most common reasons parents used the Crisis Nursery were: Employment, Housing/Homelessness, Other Emergency, Medical, Parental Distress, Mental Health.
First 5 Sacramento Page 92 of 99 Evaluation Committee Meeting January 31, 2019

R E S U LT 1 0 : D E C R E A S E C HI LD M A LT R E A T M E N T A N D D E A T H
FI RST 5 SA C RAME N T O: E VALUAT I ON RE PO R T FY 2 018 -2 01 9 — 82
2018/19
How well? % of unduplicated families receiving at least one CICMP referral/linkage
55%
Is anyone better off?
Connection to Ongoing Support
Clients who also participated in Family Resource Center services 92
Reduced Stress Pre Post
Level of stress 4.6 3.0*
Parental stress level affected their care of child 2.2 1.9*
% parents who agreed that Crisis Nursery reduced stress level NA 97%
% parents who agreed they were better able to work on solving crisis situations as a result of Crisis Nursery
NA 99%
Sources: FY 2018-19 Crisis Nursery quarterly Performance Reports in Persimmony; FY 2018-19 Crisis Nursery individual-level service data provided by Sacramento Crisis Nursery North and South. *indicates a statistically significant difference at p < .05
Client Success Story: Crisis Nursery
Staff at Crisis Nursery described how one 44-year-old single mother of one child with special needs
benefited from their services. This particular mother had left Nevada to start a better life with her child in
Sacramento and planned to stay with a family member; however, it was not a safe environment for her or
her child, so she made the decision to leave the residence. Mother then lived in her vehicle with her child
while looking for shelter and housing. She was referred to the Sacramento Crisis Nursery by Warmline, as
well as to referrals to enroll her child in early intervention services.
Mother’s presenting needs included an immediate need for a safe place for the family to reside, as well as
securing the supports needed for her child, including child development screening, speech, occupational
therapy, child care, and school enrollment. Her child currently has tubes in her ears for hearing, is
nonverbal, and has limited peer interaction. Additionally, the vehicle the family resided in was currently
being contracted for employment, but Mother was unable to maintain employment because she did not
have child care for the child during the day. Soon, the family lost the vehicle and were without a place to
stay and were living on the street.
Mother and child were supported by Crisis Nursery through services, referrals, and connection to systems
of care. During the child’s stay at the Sacramento Crisis Nursery, the child was able to have a safe space to
sleep at night. While the child was at the nursery, Mother was able to self-register for family shelter
services, get into transitional housing for the family, sign her child up for medical services, and secure a
medical appointment and screening for her child’s hearing. Mother was referred to Help Me Grow for her
child’s developmental ASQ screening, and it was identified that her child was not reaching developmental
milestones. Mother connected with Alta Regional for the child’s developmental screening and received
referrals for the child’s development, including speech services, occupational therapy services, and school
meetings to meet the child’s needs. Mother was also able to make appointments with the Social Security
office, child support, and DHA to maintain the financial supports for the family. Mother was also able to
attend parent support classes for the language and development of her child, when other child care
services were not available.
Through Crisis Nursery’s support, Mother and child were able to establish safety, security, and
developmental and educational resources. As her child transitioned into the school district, Mother was
First 5 Sacramento Page 93 of 99 Evaluation Committee Meeting January 31, 2019

R E S U LT 1 0 : D E C R E A S E C HI LD M A LT R E A T M E N T A N D D E A T H
FI RST 5 SA C RAME N T O: E VALUAT I ON RE PO R T FY 2 018 -2 01 9 — 83
able to attend Individualized Educational Plan meetings with providers and was set up with a Case Manager
from the Crisis Nursery for school support. Her child is now registered for Preschool Services and will be
getting speech, occupational therapy, and ABA therapy while in the school setting. Additionally, mother was
able to self-register for family shelter and get into housing, so the family was no longer on the street.
Mother was also able to get medical, financial, and developmental needs met while the child was cared for
at the nursery. Moreover, she was also able to advocate for the child’s needs with Warmline, Alta Regional,
and the School District, while knowing her child had a safe place at the Crisis Nursery.
Mother learned that advocating for a special needs child can be overwhelming. She has also utilized
services for parental distress reasons and has been connected with Single Mom Strong and TLCS for when
life challenges become overwhelming. As Mother explained, “The Crisis Nursery has provided me so much.
They gave me peace of mind. A temporary child friendly atmosphere that my child could flourish in. They
also provided additional resources to help me. They provided sanity and time to rejuvenate.”
Summary • The Sacramento Crisis Nursery supported Sacramento’s most vulnerable families by providing
emergency child care to 484 children in 332 families. The Sacramento Crisis Nursery serves the
highest-risk children and families who, at the time of stay, are experiencing one or more of the
following: lack of employment, housing/ homelessness, medical needs, other emergency, domestic
violence, mental health, or alcohol or other drugs. In 2018-19 alone, there were 2,828 emergency
child care stays and 2,562 overnight stays.
• Fifty-two percent of parents completed a case management plan. The most frequent
referrals were for Family Resource Centers, child care, housing, employment, food
resources, child/ adult mental health, and 2-1-1.
• Pre-post tests indicated that there was a significant reduction in parents’ stress level, as
well as the perception that parental stress was having adverse impacts on their children.
Additionally, in post surveys, 99% of parents said they were better able to solve crisis
situations as a result of Crisis Nursery’s support.
First 5 Sacramento Page 94 of 99 Evaluation Committee Meeting January 31, 2019
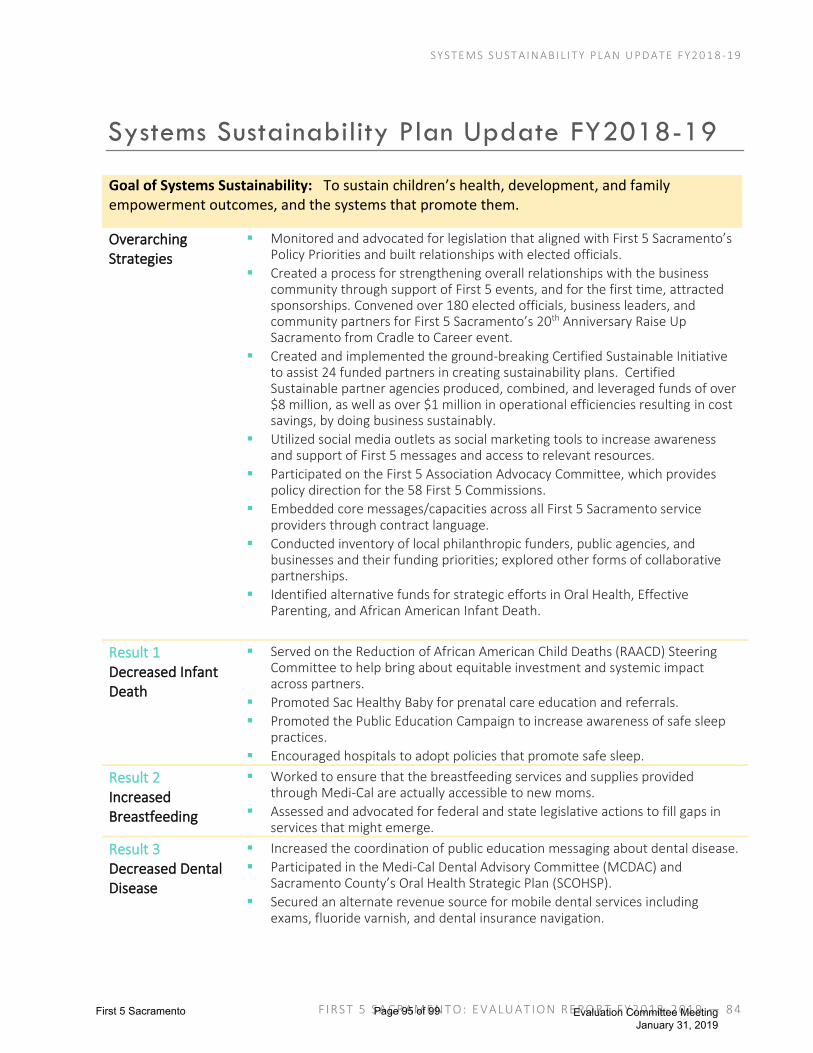
S Y S T E M S S U S T A I N A B I L I T Y P LA N U P D A T E F Y 2 0 1 8 - 1 9
FI RST 5 SA C RAME N T O: E VALUAT I ON RE PO R T FY 2 018 -2 01 9 — 84
Systems Sustainability Plan Update FY2018-19
Goal of Systems Sustainability: To sustain children’s health, development, and family empowerment outcomes, and the systems that promote them.
Overarching Strategies
▪ Monitored and advocated for legislation that aligned with First 5 Sacramento’s Policy Priorities and built relationships with elected officials.
▪ Created a process for strengthening overall relationships with the business community through support of First 5 events, and for the first time, attracted sponsorships. Convened over 180 elected officials, business leaders, and community partners for First 5 Sacramento’s 20th Anniversary Raise Up Sacramento from Cradle to Career event.
▪ Created and implemented the ground-breaking Certified Sustainable Initiative to assist 24 funded partners in creating sustainability plans. Certified Sustainable partner agencies produced, combined, and leveraged funds of over $8 million, as well as over $1 million in operational efficiencies resulting in cost savings, by doing business sustainably.
▪ Utilized social media outlets as social marketing tools to increase awareness and support of First 5 messages and access to relevant resources.
▪ Participated on the First 5 Association Advocacy Committee, which provides policy direction for the 58 First 5 Commissions.
▪ Embedded core messages/capacities across all First 5 Sacramento service providers through contract language.
▪ Conducted inventory of local philanthropic funders, public agencies, and businesses and their funding priorities; explored other forms of collaborative partnerships.
▪ Identified alternative funds for strategic efforts in Oral Health, Effective Parenting, and African American Infant Death.
Result 1 Decreased Infant Death
▪ Served on the Reduction of African American Child Deaths (RAACD) Steering Committee to help bring about equitable investment and systemic impact across partners.
▪ Promoted Sac Healthy Baby for prenatal care education and referrals.
▪ Promoted the Public Education Campaign to increase awareness of safe sleep practices.
▪ Encouraged hospitals to adopt policies that promote safe sleep.
Result 2 Increased Breastfeeding
▪ Worked to ensure that the breastfeeding services and supplies provided through Medi-Cal are actually accessible to new moms.
▪ Assessed and advocated for federal and state legislative actions to fill gaps in services that might emerge.
Result 3 Decreased Dental Disease
▪ Increased the coordination of public education messaging about dental disease.
▪ Participated in the Medi-Cal Dental Advisory Committee (MCDAC) and Sacramento County’s Oral Health Strategic Plan (SCOHSP).
▪ Secured an alternate revenue source for mobile dental services including exams, fluoride varnish, and dental insurance navigation.
First 5 Sacramento Page 95 of 99 Evaluation Committee Meeting January 31, 2019

S Y S T E M S S U S T A I N A B I L I T Y P LA N U P D A T E F Y 2 0 1 8 - 1 9
FI RST 5 SA C RAME N T O: E VALUAT I ON RE PO R T FY 2 018 -2 01 9 — 85
Result 4 Increased Utilization of Medical Homes
▪ Increased the coordination of public education messaging around the importance of a medical home, well child check-ups, and maternal mental health.
▪ Assessed and advocated for federal and state legislative actions related to the Affordable Care Act; supported local efforts to fill gaps in services.
Result 5 Increased Accessibility to Affordable Quality Child Care
▪ Identified and advocated for federal, state, and local legislation that increases access to child care.
▪ The Blue Ribbon Commission Report highlighted First 5 as a key partner and advocate on child care.
▪ Supported school districts to include early care and education in their Local Control Action Plans (LCAPs) and to direct funding for children ages 0-5 and their parents.
Please refer to the Systems Sustainability Plan Two-Year Report (FY2017-18 and FY2018-19), which details
these achievements by targeted result area and corresponding strategies.
First 5 Sacramento Page 96 of 99 Evaluation Committee Meeting January 31, 2019
C O M M U N I C A T I O N S S T R A T E G I E S A N D R E S U L T S
FI RST 5 SA C RAME N T O: E VALUAT I ON RE PO R T FY 2 018 -2 01 9 — 86
Communications Strategies and Results
FY 2018-19 Communication efforts continue to enhance and expand the brand of First 5 Sacramento in the
community by highlighting programs through sustainability, policy, advocacy, partnerships, social
media, and multi-media campaigns. Efforts in 2018-19 included:
• Sustainability – First 5 Sacramento’s 20th Anniversary Raise Up Sacramento from Cradle to
Career event brought together more than 180 people, including elected officials, business
leaders, and community partners. Highlights included acknowledgments from business and
policy leaders, High 5 Awards to champions who prioritize families in the workplace, and First
5 Sacramento receiving a joint Senate and Assembly Resolution commemorating 20 years of
investing in critical programs for children and families. First 5 additionally celebrated the
culmination of its 18-month Certified Sustainable Initiative with a graduation ceremony to
highlight funded agencies and the creation of 24 sustainability plans. More than 125
attendees learned about First 5’s partners’ innovative approaches to preserve funding and
sustain critical services. Graduates also received certificates from the Assembly and Senate.
• Policy - First 5 Sacramento worked with the First 5 Association and First 5 California on
supporting local, state, and federal bills that aligned with First 5 Sacramento priorities on
health, early care and development, empowered families, and systems change and
sustainability. Locally, First 5 Sacramento continues to build upon the Network Strategy and
engaging with early childhood systems focused on sustainability.
• Advocacy - First 5’s from across the state gathered for the annual Advocacy Day to meet with
local and regional legislators. The day was highlighted by the Día del Niño/ Día de los Libros
celebration with First Partner Jennifer Newsom. More than 150 preschoolers gathered on the
capitol lawn for the lunch time activities joined by advocates, legislators, and their staff.
• Partnerships – First 5 Sacramento developed a partnership with the Sacramento Business
Journal to engage with local business leaders. The multi-media campaign components
included print, online, and digital messaging that highlighted First 5 Sacramento’s Certified
Sustainable efforts and generated awareness about family-friendly practices. Additionally,
First 5 Sacramento collaborated with the Sacramento Kings and First 5 CA to host four pop-up
events at preschools and community centers with the First 5 Express family engagement van.
• Social Media – First 5 Sacramento continued to increase its social media presence, reaching
multiple audiences on various platforms. LinkedIn served as a powerful tool to engage with
business and policy leaders, and to highlight funded partners’ sustainability efforts. Paid and
boosted ads, along with participating in Twitter Chats, helped to broaden First 5
Sacramento’s audience and increase engagement. On average, across all platforms, followers
increased by 30%, and impressions increased by a staggering 500%.
First 5 Sacramento Page 97 of 99 Evaluation Committee Meeting January 31, 2019

C O M M U N I C A T I O N S S T R A T E G I E S A N D R E S U L T S
FI RST 5 SA C RAME N T O: E VALUAT I ON RE PO R T FY 2 018 -2 01 9 — 87
• Multi-media Campaign – First 5 helped launched its newest program, Help Me Grow, though
a six-month digital campaign. Elements included web ads and streaming pre-roll that rotated
on hundreds of web domains targeting specific neighborhoods. During the months that the
campaign ran, there was a 27% increase in calls and an impressive 789% increase to the
website, with an average of 1,769 more web hits.
First 5 Sacramento Page 98 of 99 Evaluation Committee Meeting January 31, 2019

E V A LU A T I O N S U C C E S S A N D N E X T S T E P S
FI RST 5 SA C RAME N T O: E VALUAT I ON RE PO R T FY 2 018 -2 01 9 — 88
Evaluation Success and Next Steps
Important progress was made in 2018-19 related to data collection and evaluation, including:
development of Results-Based Accountability (RBA) dashboards for key new strategies, and continued
improvements in the quality of service data in Persimmony. Additional data collection efforts are in
progress, or planned, that will make the data even more informative in future fiscal years:
• Overarching Strategy:
First 5 is actively collaborating with its funded programs to improve upon data
collection and reporting procedures.
• School Readiness initiative:
A deeper analysis will be done to better understand how parent education is being
delivered.
• Crisis Nursery:
A qualitative study will be implemented to more deeply assess the overall impact and
value of Crisis Nursery.
First 5 Sacramento Page 99 of 99 Evaluation Committee Meeting January 31, 2019
Top Related