


Languages
Pages
Legal


AFWAL-TR-88-4146
LITT FILE COPyADVANCED CUMULATIVE DAMAGE
MODELING
R.H. VanStone, O.C. Gooden, and D.D. Krueger
GE Aircraft EnginesAdvanced Technology OperationCincinnati, Ohio 45215
LflLOSeptember 1988
00T-
Final Report for Period December 1984 - September 1986
S Approved for Public Release; Distribution Is Unlimited
DTICS ELECTE
FEB 231990
MATERIALS LABORATORYAIR FORCE WRIGHT AERONAUTICAL LABORATORIESAIR FORCE SYSTEMS COMMANDWRIGHT-PATTERSON AIR FORCE BASE, OHIO 45433-6533
90 02 26 140

NOTICE
WHE GOVERNMENT DRAWINGS, SPECIFICATIONS, OR OTHER DATA ARE USED FOR ANYPURPOSE OTHER THAN IN CONNECTION WITH A DEFINITELY GOVERNMENT-RELATEDPROCUREMENT. THE UNITED STATES GOVERNMENT INCURS NO RESPONSIBILITY OR ANYOBLIGATION WHATSOEVER. THE FACT THAT THE GOVERNMENT MAY HAVE FORMULATED OR INANY WAY SUPPLIED THE SAID DRAWINGS, SPECIFICA, ONS. OR OTHER DATA, IS NOT TOBE REGARDED BY IMPLICATION, OR OTHERWISE IN ANY MANNER CONSTRUED, AS LICENSINGTHE HOLDER, OR ANY OTHER PERSON OR CORPORATION: OR AS CONVEYING ANY RIGHTS ORPERMISSION TO MANUFACTURE, USE. OR SELL ANY PATNT INVENTION THAT MAY IN ANYWAY BE RELATED THERETO.
THIS REPORT HAS BEEN REVIEWED BY THE OFFICE OF PUBLIC AFFAIRS (ASOIPA)AND IS RELEASABLE TO THE NATIONAL TECHNICAL INFORMATION SERVICE (NTIS). ATNTIS IT WILL BE AVAILABLE TO THE GENERAL PUBLIC INCLUDING FOREIGN NATIONS.
THIS TECHNICAL REPORT HAS BEEN REVIEWED AND IS APPROVED FOR PUBLICATION.
LARRYV. ZAWAr. Project Engr ALLAN W. GUNDERSONMateri s Research Engineer Tech Area ManagerMaterials Behavior Branch Materials Behavior Branch
FOR THE COMMAND
WALTER H. REIMANN, branch ChiefMaterials Behavior BranchMetals and Ceramics Division
IF YOUR ADODR.SS HAS CHANGED, IF YOU WiSH TO BE REMOVED FROM OUR MAIUNGlIST, OR IF THE ADDRESSEE IS NO LONGER EDPI .ED BY YOUR ORGANIZATION PLEASENOTIFY WRDC/MLLN I WRIGHT-PATTERSON P.-, 1H 3.45M33.3_TO HELP MAINTAINA CURRENT MAILING LIST.
COPIES OF THIS REPORT SHOULD NOT Fi- UWd.SS RETURN IS RE-4I". BYkECURITY CONSIDERATIONS, CONTRACTUAL OB,.'L',AT1O S. U. NOTICE ON I SPFCIFILDOCUMENT.

UNCLASSIFIEDSECURITY CLASSIFICATION OF THIS PAGE
REPORT DOCUMENTATION PAGE1. REPORT SECURITY CLASSIFICATION lb. RESTRICTIVE M.ARPONGS
Unclassified Norle2&_ SECURITY CLASSIFICIN AIJTNOA~Y 3. DISTRIBUTION/AVAILABIUTY OF REPORT
__________________________________________Approved for public release; distribution unlimited.2b. OECLASSIFICATIONDOWNGRAOING SCHEDULE
.1 PERIVORMiNG ORGANIZATION REPORT NUMBER(S) 5. MONIIORNG ORGANIZATION RtEPORT NUMBER(S)
___________________ _________AFWAL-TR-88-4146
6a. NAME OP PERFORMING ORGANIZATIO)N [6b. OFFICE SYMBOL. 7a. NAME OF MONITORING ORGANLZATION
GE Aircraft Engines (falai0) Air Force Wright Aeronautical LaboratoriesAdvanced Technology Operation _________Materials Laboratory (AFWAL/MLLN)Sc. ADDRESS ICcy, State, and Zip Code) 7b ADDRESS (City. State, anid ZIP Code)
1 Neumann Way, Cincinnati, Ohio 45215 Wright-Pattcrson Air Force Base____________________________ ____________Ohio 45433-6533
Sa- NkME OF FLUND:NG/SPONSCRI1NG ORGANIZATION 8b. OFFICE SYMBOL 9. PROCUREMENT INSTRUMENT IDENJTIF;CATION NUMBER1(if app'-cable)Wright Aeronautical Laboratories jAFINA[AILLN F33 61 5-84-C-503 2Sc ADDRESS (City. State, and Zip rode) 10. SOURCE OF FUNDING NUMBERS
Ai oc ytesCmadPROGRAM ELEMENT NO. PROJECT N. TASK NO. WORK UNI"T 1,O0
Wright- Patterson AFB, OH 45433-6523 62102F 2420 01 5
i I. T,!e (Iniclude Security Classficationi
Advanced Cumulative Damage Modeling
12. PERSONAL AUTHOR(S)
R.H. VanStone, O.C. Goodcn, and D.D. Krueger
i3a TYPE OF REPORT [1Wb TIME COVERED 14. DATE OF REPORT (Yr.. Mo., Day) 15. PAGE ODUNT
Final jFROM 12-13-84 To 9/31/186 I September 1988 I 34518. SUPPLEMENTARY NOTATION
This is the Final Report for Contract F33615-84-C-5032 and summarizes work performed between 13 December 1984and 31 September 1986
17. COSATI CODES -~8. SUSJE T TERMS (Coniinue on teveise it ntecessary anid idenldy b f .kunr"
FIELD________if predictionl, time-diependent3 fatigue'ciack growin, cycle-uepenuent~fatigue,11 ~~ interpolative modci~tac ure mechanics, superposition model
1 8. ABSTRLACT (Continue on feverseit of ecessary by block rumb(4)
Crack growth in the ncar-thrcshold and Paris regimes (Regions I and 11) wcre-measured in single edge notch specimens of Rene'95 and Alloy 718 as a function of test temperature, R-ratio, hold time, frequency, and jx.erpcak ratio. The results obtained at649'C were modeled using an interpolation and interpolation + superposition model. Both mdels accurately predicted thetimiedependcnt crack growth of these materials. The interpolation + supe rposit ion modelI appeared to be a better model becausethe interpolation model made unrealistic predictions outoidc the range of data Idltaincd in this investigation. Thc overpcakretiardation was predicted using a modified Willenborg model. A residual life computer code (ACDCYCLU), which can be runon an IBM personal computer, was written to make predictions of crack gro wth rates and residuial lives. , Fractography andseveral other types of crack growth tests, inclu, 'ng tests in at high vacuum environment, were performed and showed that time
20 CiS1RI8LJIION'AVAiLAL iiTY 'F ABSTFIACT 21 ABStRACT SECUii tY CAc~S::A-.iOtJ
LICAT~~iCUN..:1E 0SAME AS RP7 Q DI-0 UEPsr 0 Unclassified22a tIAV.L U- rELSP(,.:LLE I:4D';IUAL 22b TELEPHONF NUML3FR n-I-..A ea Code) 22c OcFICE SYMBOL
Larry P. Zawada (.513) 255-1352 WRDC/MLIN
DD Form 1473, JUN 86 UNCLASSIFIEDSECURITY CLASSIFICATION OF THIS PAGE
UNCLASSIFIEDSECURITY CLASSIFICATION OF THIS PAGE
19. Abstract (Gontinue4)
Sdependent crack growth in nickel-base superalloys is highly dependent on a complex interaction between creep,
fatigue, and environment.
UNCLASSIFIEDSECu~iTY CLASSIrICATION OF THIS PAGE

ACKNOWLEDGLENTS
The author. of this report would like to acknowledge the assistance of
K.C. Cooper, E.D. Deaton, T.E. Wallrauch, and R.C. Volmer. for instrumenting
and performing the crack growth tests in this investigation. We also deeply
apprecelated the support and helpful suggestions of our management, J.H.
Laflen and A.M. Johnson. R.B. Ashbrook, M.J. Cannon, L. Piazza, and B. Shivar
were instrumental in performing the microscopy during the mechanisms studies.
We are also indepted to M.F. Henry of GE Corporate Research and Development,
who developed the modification of the potential drop system used in this
investigation and provided us with a protype version. We also appreciated the
many helpful comments provided by T. Nicholas of the Air Force Materials
Laboratory.
Acoession For
NTIS GRA&IDTIC TAB 0Unnnnoun-ed 0JustifIcation
By
Distritut-Iof/Availability CodeE
4I Avai an/or
Dist Special.

TABLE OF CONTENTS
1.0 INTRODUCTION 1
2.0 LITERATITRE REVIEW 5
2.1 Creep-Fatigue-Environment Interactions 5
2.1.1 Crack Growth 6
2.2 Crack Growth Curves 7
2.2.1 Paris Law 8
2.2.2 Sinh Curve 10
2.2.3 Sigmoidal Curve 12
2.3 Time-dependent Crack Growth Models 15
2.3.1 Interpolative Models 15
2.3.2 Superposition Models 17
2.3.3 Retardation Models 21
3.0 MISSION ANALYSIS 25
4.0 MATERIALS AND EXPERIMENTAL TECHNIQUES 47
4.1 Materials 47
4.1.1 Rene'95 47
4.1.2 Alloy 718 50
4.1 Single Edge Notch Specimen 56
4.2 Test Specimen Machining And Orientation 58
4.3 Potential Drop Test Method 59
4.4 Test Description And Data Analysis 59
4.4.1 Threshold Tests 61
4.4.2 Constant AK Tests 65
4.5 Vacuum Test Method 67
V
Secion
5.0 EXPERIMENTAL RESULTS 71
5.1 Rene'95 Crack Growth Results 71
5.1.1 Rene'95 Constant AK Tests 71
5.1.2 Rene'95 Threshold Tests 90
5.1.3 Rene'95 Static Crack Growth 110
5.1.4 Rene'95 Retardation Tests 113
5.2 Alloy 718 Crack Growth Results 127
5.2.1 Alloy 718 Constant AK Tests 127
5.2.2 Alloy 718 Threshold Tests 131
5.2.3 Alloy 718 Static Crack Growth 143
5.2.4 Alloy 718 Retardation Tests 143
6.0 MECHANISM STUDIES 153
6.1 Approach of Mechanism Studies 153
6.1.1 Fractographic Examination 153
6.1.2 Vacuum Tests 153
6.1.3 Metallographic Sectioning Experiments 154
6.1.4 Characterization of Crack Tip Damage Zones 154
6.2 Fractography of Specimens Testee in Air 154
6.2.1 Rene'95: Region II Observations 155
6.2.2 Rene'95: Region I Observations 167
6.2.3 Rene'95: Retardatinn Test Observations 167
6.2.4 Alloy 718: Region II Hold Time Observations 170
6.3 Vacuum Results 170
6.3.1 Rene'95 Vacuum crack Growth Results 175
6.3.2 Alloy 718 Vacuum crack Growth Results 180
6.3.3 Rene'95 Vacuum Test Fractographic Observations 180
6.3.4 Alloy 718 Vacuum Test Fractographic Observations 184
6.3.5 Discussion of Vacuum Results 188
6.4 Metallographic Sectioning Studies 192
6.5 Mechanism testing program 195
6.6 Discussion 203
vi

7.0 CRACK GROWTH MODELING 20'
7.1 Cr.ack Growth Models 10?
7.1.1 Interpolation Model Of Threshold Values 21A
7.1.2 Interpolation Model
7.1.3 Superposition Model 2 '
7.1.4 Retardation Model 21.
7.2 Advanced Cumulative Damage Cycle (ACDCYCLE) Computer Code 221
7.2.1 ACDCYCTE Options 224
7.2.2 ACDCYCLE Input and Output 225
7.3.3 Residual Life Calculations 227
7.3 Modeling of Rene'95 at 649C 230
7.3.1 Rene'95 Threshold model 232
7.3.2 .ene*95 Interpolation Model 232
7.3.3 Aene,95 Interpolation + Superposition Model 236
7.3.4 Comparison of Predicted and Measured Crack Growth 239
7.3.5 Retardation model 254
7.4 Modeling of Alloy 718 At 649'C 264
7.4.1 Alloy 718 Threshold Model 266
7.4.2 Alloy 718 Interpolation + Superposition Model 266
7.4.3 Comparison of Predicted and Measured Crack Growth 274
7.4.4 Retardation Model 276
8.0 SL'mMARY AND CONCIA1STONS 285
9.0 REFERENCES 289
APPENDIX A: STATISTICAL ANALYSIS OF RENE'95 CONSTANT AK DATA 297
APPENDIX B: STATISTICAL ANALYSIS OF RENE'95 OVERPEAK HOLD TIME DATA 303
APPENDIX C: STATISTICAL ANALYSIS OF ALLOY 718 CONSTANT AK DATA 313
APPENDIX D: STATISTICAL ANALYSIS OF ALLOY 718 OVERP.-- HOLD TIME DATA 317
vii

LIST OF FIGURES
2.1 Schematic drawing of fatigue crack growth curve showing 9
Regions I, II, and III.
2.2 Schematic drawing of sinh crack growth curve. 11
2.3 Schematic drawing of sigmoidal or Knaus crack growth curve. 13
2.4 Variation in teff / t with R-ratio and Paris exponent (n) 20
for loading ramps as predicted by the linear superposition
model.
3.1 Example of a mission with frequent changes in rotor speed. 26
3.2 Example of a mission with changes in rotor speed and crulne 27
conditions.
3.3 Example of a mission consisting primarily of cruise 28
conditions.
3.4 Variation of normalized stress with time for (a) actual 30
mission and (b) simplified mission.
3.5 Variation of temperature with time for (a) actual mission 31
and (b) simplified mission.
3.6 Variation of stress ratio with temperature for eighteen 34
missions.
3.7 Variation of stress ratio of ramp segments with temperature. 35
viii
3.8 Variation of (a) ramp time with tempeLdture and (b) stress 36
ratio with ramp time for individual segments of eighteen
missions.
3.9 Variation of (a) ramp time with temperature and (b) stress 38
ratio with ramp time for increasing load segments of
eighteen missions.
3.10 Variation of hold time with temperature for eighteen
missions. 39
3.11 Variation of hold times in excess of 10 seconds and 510C 40
with temperature.
3.12 Variation of underpeak ratio (stress ratio) of hold times 41
with temperature greater than 510"C with temperature.
3.13 Variation of overpeak ratios of hold times with temperatures 43
in excess of 510*C with temperature
3.14 Variation in overpeak ratio with (a) temperature and 44
(b) stress ratio for loading and unloading segments (R<0.9).
4.1 Micrstructure of Rene'95 forging as shown with (a) low 51
magnification optical micrograph, (b) high magnification
optical micrograph, and (c) TEM replica micrograph.
4.2 Optical micrographs of Alloy 718 plate at (a) low and 54
(b) high magnifications. The rolling direction is displayed
horizontally and the plate thickness direction is shown
vertically.
ix

Figur Ca U"
4.j Optical micrographs of Alloy 718 plate at (a) low and 55
(b) high magnifications. The plate width direction is
displayed horizontally and the plate thickness direction
is shown vertically.
4.4 Buttonhead single edge notch (SEN) specimen 57
4.5 Schematic diagram of SEN specimen DC potential drop test 60
apparatus.
4.6 Typical K-history for a threshold crack growth test. 62
4.7 Influence of K-shed rate on near-threshold crack growth rates 64
measured in Rene'95 specimens cycled at 649'C and R-0 with a
300 second hold time.
4.8 Typical variation of Kmax and frequency in a AK-Controlled 66
frequency test
4.9 Influence of test control mode on Region II crack growth 68
rates measured in Rene'95 specimens cycled at R-O with a
300 second hold time.
5.1 Variation of (a) Kmax with crack length end (b) crack 74
length with cycles during constant AK hold time test on
Rene'95 at 649'C and R-0.
5.2 Results of the statistical analysis of constant AK hold time 75
test on Rene'95 at 649"C with R-0.
5.3 Results of the constant AK hold time test on Rene'95 at 649"C 77
with R-0.
x
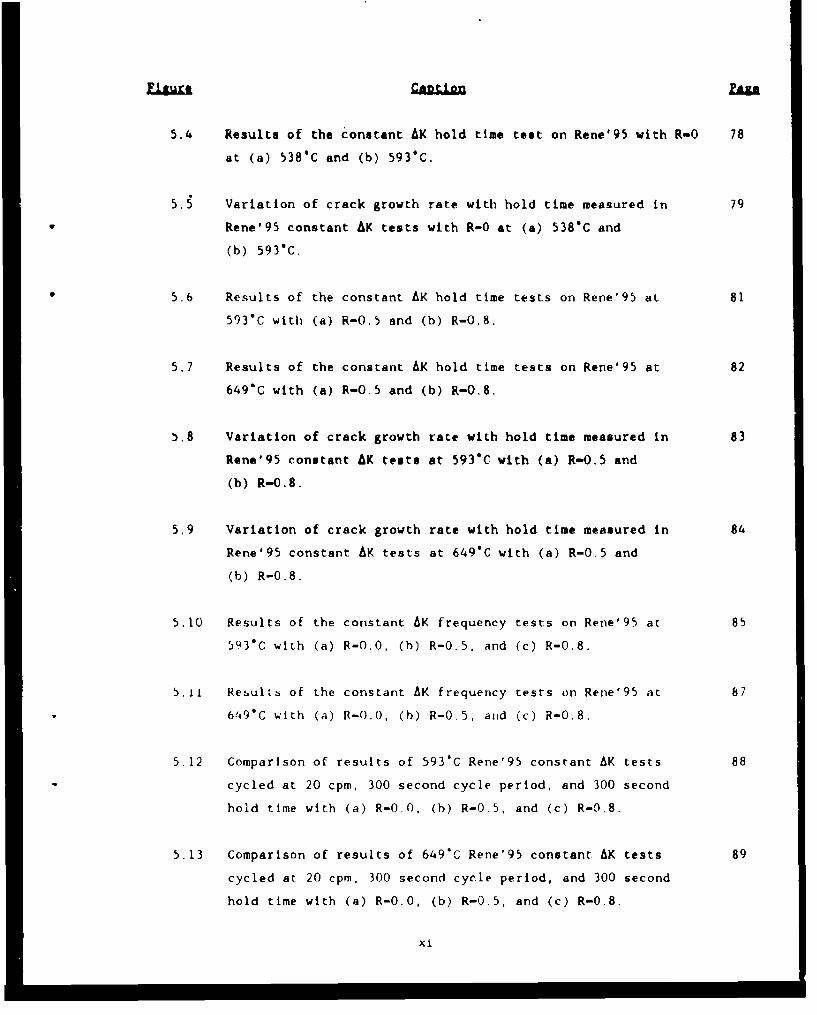
Fiture Cation
5.4 Results of the constant AK hold time test on Rene'95 with R-O 78
at (a) 538*C and (b) 5930C.
5.5 Variation of crack growth rate with hold time measured in 79
Rene'95 constant AK tests with R-O at (a) 538*C and
(b) 593"C.
5.6 Results of the constant AK hold time tests on Rene'95 at 81
593"C with (a) R-0.5 and (b) R-O.8.
5.7 Results of the constant AK hold time tests on Rene'95 at 82
649"C with (a) R-0.5 and (b) R-O.8.
5.8 Variation of crack growth rate with hold time measured in 83
Rene'95 constant AK tests at 593% with (a) R-O.5 and
(b) R-0.8.
5.9 Variation of crack growth rate with hold time measured in 84
Rene'95 constant AK tests at 649"C with (a) R-0,5 and
(b) R-0.8.
5.10 Results of the constant AK frequency tests on Rene'95 at 85
593"C with (a) R-0.0, (h) R-0.5, and (c) R-0.8.
5.11 Resultb of the constant AK frequency tests on Rene'95 at 87
649"C with (a) R-0.0, (h) R-0.5, and (c) R-0.8.
5.12 Comparison of results of 593'C Rene'95 constant AK tests 88
cycled at 20 cpm, 300 second cycle period, and 300 second
hold time with (a) R-0.O, (b) R-0.5, and (c) R-0.8.
5.13 Comparison of results of 649C Rene'95 constant AK tests 89
cycled at 20 cpm. 300 second cycle period, and 300 second
hold time with (a) R-0.O, (b) R-0.5, and (c) R-0.8.
xi

5.14 Results of 649"C Rene'95 threshold tests with 3 second cycle 91
period and different R-ratios as a function of (a) AK and
(b) Kmax.
5.15 Results of 593"C Rene'95 threshold tests with 3 second cycle 92
period and different R-ratios as a function of (a) AK and
(b) Kmax.
5.16 Comparison of 593 and 649"C Rene'95 threshold tests with 94
3 second cycle period for R-ratios of (a) R-0.0 and
(b) R-O.8.
5.17 Results of Rene'95 threshold tests with R-O and different 95
hold times at (a) 593"C and (b) 6490C.
5.18 Results of 649'C Rene'95 threshold tests with R-0 and 96
different test frequencics.
5.19 Variation of (Kth)max in Rene'95 at 649"C with R-ratio 98
and (a) hold time and (b) test frequency.
5.20 Comparison of crack growth rates measured in threshold and 101
constant AK tests of Rene'95 at 649"C and R-0 for cycle
periods of (a) 3 seconds, (b) 30 seconds, and (c) 300 seconds.
5.21 Comparison of crack growth rates measured in threshold and 103
constant AK tests of Rene'95 at 649"C and R-0 for hold times
of (a) 30 seconds and (b) 300 seconds.
5.22 Comparison of crack growth rates measured in threshold and 104
constant AK tests of Rene'95 at 649% and R-0.5 for cycle
periods of (a) 3 seconds and (b) "00 veconds.
xii

Figur mm a"
5.23 Comparison of crack growth rates measured in threshold and 105
constant AK tests of Rene'95 at 649C and R-0.5 for a hold
time of 300 seconds.
5.24 Comparison of crack growth rates measured in threshold and 106
constant AK tests of Rene'95 at 649"C and R-0.8 for cycle
periods of (a) 3 seconds and (b) 300 seconds.
5.25 Comparison of crack growth rates measured in threshold and 107
constant AK tests of Rene'95 at 649C and R-0.8 for hold
times of (a) 4 seconds. (b) 30 seconds, and (c) 300 seconds.
5.26 Comparison of crack growth rates measured in threshold and 108
constant AK tests of Rene'95 at 593"C and R-O.O for hold
times of (a) 0 seconds and (b) 300 seconds.
5.27 Comparison of crack growth rates measured in threshold and 109
constant AK tests of Rene'95 at 593"C and R-0.8 for hold
times of (a) 0 seconds and (b) 300 seconds.
5.28 Results of Rene'95 static crack growth tests at 649*C. ill
5.29 Results of Rene'95 static crack growth tests at 593"C. 112
5.3C Schematic showing multiple retardation cycles with hold 115
times of 0, 4, and 30 seconds.
5.31 Variation of crack growth rate with distance in Rene'95 at 117
649"C with a 300 second hold rime at R-0 preceded by a 50% overpeak.
5.32 Results of 649"C multiple overpeak hold time tests on 118
Rene'95 R-0 for overpeaks of (a) 10%, (b) 20%, and (c) 50%.
xlii

fagRre na---
5.33 Results of 649"C multiple overpeak hold time tests on 119
Rene'95 R-0.5 for overpeaks of (a) 10% and (b) 20%.
5.34 Reaults of 593"C multiple overpeak hold time tests on 121
Rene'95 R-0 for overpeaks of (a) 10% and (b) 202.
5.35 Results of 593"C multiple overpeak hold time tests on 122
Rene'95 R-0.5 for overpeaks of (a) 10% and (b) 20%.
5.36 Variation of crack growth rate with hold time measured in 123
649*C multiple overpeak hold time tests on Rene'95 with
R-0 for overpeaks of (a) 10%, (b) 20%, and (c) 50%.
5.37 Variation of crack growth rate with hold time measured in 124
649"C multiple overpeak hold time tests on Rene'95 with
R-0.5 for overpeaks of (a) 10% and (b) 20%.
5.38 Variation of crack growth rate with hold time measured in 125
593"C multiple overpeak hold time tests on Rene'95 with
R-0 for overpeaks of (a) 10% and (b) 20%.
5.39 Variation of crack growth rate with hold time measured in 126
593C multiple overpeak hold time tests on Rene'95 with
R-0.5 for overpeaks of (a) 10% and (b) 20%.
5.40 Variation of crack length with cycles during constant AK 129
hold time test on Alloy 718 at 649"C with R-0.
5.41 Variation of crack length with cycles during transitions 130
from 300 second hold time to 0 second hold time during
constant AK hold time test on Alloy 718 at 649"C with R-0
for 300 second hold time Kmax values of (a) 18 MPaim and
(b) 31 MPa/m.
xiv

5.42 Results of the Constant AK hold time tests on Alloy 718 at 132
593"C with (a) R-O.O, (b) R-0.5, and (c) R-0.8.
5.43 Results of the Constant AK hold time tests on Alloy 718 at 133
649°C with (a) R-0.0, (b) R-0.5, and (c) R-0.8.
5.44 Variation of crack growth rate with hold time measured in 134
Alloy 718 constant AK tests at 593"C with (a) R-0.0,
(b) R-0.5, and (c) R-0.8.
5.45 Variation of crack growth rate with hold :ime measured in 135
constant Alloy 718 AK tests at 649"C with (a) R-0,
(b) R-0.5, and (c) R-O.8.
5.46 Results of 6490C Alloy 718 threshold tests with 3 second 136
cycle period and different R-ratios as a function of
(a) AK and (b) KFax.
5.47 Comparison of 593 and 649"C Alloy 718 threshold tests with 137
3 second cycle period for R-O.0.
5.48 Results of Alloy 718 threshold tests with R-0 and different 139
hold times at 649C.
:.49 Variation of (Kth)max in Alloy 718 at 649"C with R-ratio 140
and hold time.
5.50 Comparison of 'rack growth rates measured in threshold and 141
constant AK tests of Alloy 718 at 649"C and R-0 for a 300
second hold time cycle.
5.51 Comparison of crack growth rates measured in threshold and 142
constant AK tests of Alloy 718 at 649"% and R-0.8 for hold
times of (a) 4 seconds, (b) 30 seconds, and (c) 300 seconds.
xv

Iixure i i I MLAU
5.52 Results of Alloy 718 static crack growth tests at 649"C. 144
5.53 Results of Alloy 718 staLic crack growth tests at 593"C. 145
5.54 Results of 649"C multiple overpeak hold time tests on 148
Alloy 718 with R-0 for overpeaks of (a) 10% and (b) 20%.
5.55 Results of 649"C multiple overpeak hold rime tests on 149
Alloy 718 with R-0.5 for overpeaks of (a) 10% and (b) 20%.
5.56 Variation of crack growth rate with hold time measured in 150
649"C multiple overpeak hold time tests on Alloy 718 with
R-O for overpeaks of (a) 10% and (b) 20%.
5.57 Variation of crack growth rate with hold time measured in 151
649"C multiple overpeak hold time tests on Alloy 718 with
R-0.5 for overpeaks of (a) 10% and (b) 20%.
6.1 SEM micrographs showing Region II fracture morphology of 158
constant AK, R-0 Rene'95 specimens tested in air and
conditions of (a) 538"C, low Kmax, 4 second hold time
cycle, (b) 538*C, low Kmax, 300 second hold time cycle,
(c) 593"C, high Kmax, 4 second hold time cycle, and
(d) 593"C, high Kmax , 300 second hold time cycle.
6.2 SE micrographs showing Region II fracture morphology of 159
constant AK, R-0 Rene'95 specimen tested in air at 649"C
and conditions of (a) high Kmax , 4 second hold time cycle,
(b) high Kmax, 30 second hold time cycle, and (c) high
K ay, 300 second hold time cycle.
xvi

6.3 SEM micrographs showing Region II fracture morphology of 161
constant AK, R-O Rene'95 specimen tested in air at 538*C
and conditiotis of ka) intermediate Kma x , 4 second hold
time cycle, (b) intermediate Kmax, 300 second hold time
* cycle, (c) high Kmax, 4 second hold time cycle, and
(d) high Kmax, 300 second hold time cycle.
* 6.4 SEM micrographs showing Region II fracture morphology of 163
constant AK, R-0 Rene'95 specimens tested in air at 593*C
and conditions of (a) low Kmax, 30 second cycle period
and (b) low Kmax , 30 second hold time cycle.
6.5 SEM micrographs showing Region II fracture morphology of 166
constant AK Rene'95 specimens tested in air at 593*C and
conditions of (a) R-O, intermediate Kmax , 3 second cycle
period and (b) R-0.8, intermediate Kmax, 3 second cycle
period.
6.6 SEM micrographs showing threshold arrest morphology of 168
K-shed, R-0 Rene'95 specimens tested in air at 649C end
conditions of (a) 3 second cycle period and (b) 30 second
hold time cycle.
6.7 SEM micrographs showing the fracture surface of constant AK, 169
R-,O RL; e'9 hold time specimens tested in air at 6490C and
conditions of (a) 20% overpeak and (b) no overpeak.
6.8 SEM micrographs showing Region II fracture morphology of 171
constant AK, R-0 Alloy 718 specimen tested in air at 593"C
and conditions of (a) low Kmax, 4 second hold time cycle,
(b) low Kmax, 30 second hold time cycle, and (d) low Kmax,
300 second hold time cycle.
xvii

6.9 SEM micrographs showing Region II fracture morphology of 172
constant AK. R-0 Alloy 718 specimen tested in air at 593"
and-conditions of (a) intermediate Kmax, 4 second hold
time cycle, (b) intermediate Kmax, 300 second hold time
cycle, (c) high Kmax, 4 second hold time cycle, and
(d) high Kmax, 300 second hold time cycle.
6.10 SEM micrographs showing Region II fracture morphology of 173
constant AK, R-0 Alloy 718 specimen tested in air at 649C
and conditions of (a) intermediate Kmax. 4 second hold time
cycle, (b) intermediate Kmax, 300 second hold time cycle,
(c) high Kmax, 4 second hold time cycle, and (d) high Kmax,
300 second hold time cycle.
6.11 Crack growth data from 3 second period Rene'95 vacuum tests 176
with different R-ratios as a function of (a) AK and (b) Kmax.
6.12 Comparison of Rene'95 crack growth rates measur; Jn air and 177
vacuum for tests cycled at 593'C with R-O anc '. -,t.nd hold
time.
6.13 Comparison of Rene'95 crack growth rates measured in air and 178
vacuum for tests cycled at 649"C with (a) R-0 and 0 second
hold time, (b) R-0.8 and 0 second hold time, and (c) R-0 and
300 sec ,td hold time.
6.14 Influence of hold time on Rene'95 crack growth rates at 179
649"C with R-0 in (a) air and (b) vacuum.
9
6.15 Influence of test temperature on Rene'95 crack growth rates 181
at R-O and 0 second hold time in (a) air and (b) vacuum.
xviii

Fiure Ca
6.16 Comparison of Alloy 718 crack growth rates measured in air 182
and vacuum for tests cycled at 649"C with R-0 and
(a) 0 second hold time and (b) 300 second hold time.
6.17 Influence of hold time on Alloy 718 crack growth rates at 183
649C with R-0 in (a) air and (b) vacuum.
6.18 SEM micrographs showing Region II fracture morphology of 185
K-increase, R-0 Rene'95 specimens tested in vacuum at 649"C
and conditions of (a) low Kmax, 3 second cycle period,
(b) intermediate Kmax, 3 second cycle period, (c) low
Kmax, 300 second hold time cycle, and (d) intermediate
Kmax, 300 second hold time cycle.
6.19 SEM micrographs showing Region II fracture morphology of 186
K-increase, R-0 Alloy 718 specimen tested in vacuum at
649"C with a 3 second cycle period; (a) low Kmax ,
(b) intermediate Kmax , and (c) high Kmax.
6.20 SEM micrograph showig Region II fracture morphology for l.7
constant AK, R-0 Al:.v ".8 specimen tpsted in air at 649"C
with a 3 second cycle period (low Kmax le %1).
6.21 SEM micrograph showing Region II fracture morphology of 189
K-increase, R-0 Alloy 718 specimen tested in vacuum at
649"C with a 300 second 'old time cycle (intermediate
K level).
6.22 Comparison of Rene'95 crack growth rates measured at 649"C 190
for R-0 cycling with 0 second hold time in air and vacuum
and 300 second hold time in vacuum.
xix

6.23 Comparison of Alloy 718 crack growth rates measured at 649"C 191
for R-O cycling with 0 second hold time in air and vacuum
and 300 second hold time in vacuum.
6.24 Optical micrographs showing crack in K-shed, R-0 Rene'95 193
specimen tested in air at 649°C with a 300 second hold
time cycle; (a) low magnification view of entire crack,
(b) high magnification view of crack in arrest region
(unetched microstructure), and (c) high magnification view
of crack in arrest region (etched microstructure).
6.25 Optical micrographs showing crack in K-shed, R-0 Alloy 718 194
specimen tested in air at 649'C with a 30C second hold time
cycle; (a) low magnification view of entire crack, (b) high
magnification view of crack in arrest region (unetched
microstructure), and (c) and (d) high magnification views
of crack in arrest region (etched microstructure).
6.26 Variation of damage zone size with R-ratio and Kmax for 196
Alloy 718 cycled at 593"C with a 300 secord hold time.
6.27 Variation of crack length with cycles for damage zone 198
experiment in air.
b.28 Variation of damage zone Lize with bcid time, material, 199
and test temperature as measured in damage zone
experiment in air.
6.29 Variation of crack length with cycles for the transition 200
from 300 second hold time to 20 cpm cycling for (a) air/air
cycling, (b) vacuum/vacuum cycling, (c) vacuum/air cycling,
and (d) air/vacuum cycling.
xx

7.1 Sigmoidal crack growth rate curve adjusted to permit static 211
crack growth below the static crack growth threshold.
7.2 Schematic diagram of superposition model including a static 214
crack growth threshold.
7.3 Schematic diagram of modified Willenborg retardation model 218
7.4 Application of static retardation to constant amplitude, 220
constant frequency tests.
7.5 Application of static retardation to overpeak hold time 222
test cycle.
7.6 Schematic example of a mission analyzed by ACDCYCLE. 228
7.7 Comparison of 649"C Rene')5 (a) hold time and (b) frequency 234
threshold data with predictions from the interpolation
threshold model.
7.8 Cyclic crack growth curve used in the 649'C Rene'95 238
superposition model.
7.9 Static crack growth curve usee in the 649C Rene'95 240
superpos . tion model.
7.10 Comparison of experimental data with predictions from 242
interpolation model (I) and interpolation + superposition
model (I+S) for Rene'95 tested at 649'C with R-0.0 and hold
times of (a) 4 seconds, (b) 30 seconds, and (c) 300 seconds.
xxi

Fiur AL± FAgs
7.11 Comparison of experimental data with predictions from 243
interpolation model (I) and iuterpolation + superposition
model k'I+S) for Rene'95 tested at 649"C with R-0.5 and hold
times of (a) 4 seconds, (b) 30 seconds, and (c) 300 seconds.
7.12 Comparison of experimental data with predictions from 245
interpolation model (I) and interpolation + superposition
model (I+S) for Rene'95 tested at 649"C with R-0.8 and hold
times of (a) 4 seconds, (b) 30 seconds, and (c) 300 seconds.
7.13 Comparison of experimental data with predictions from 246
interpolation model (I) and interpolation + superposition
model (I+S) for Rene'95 tested at 649*C with R-O.0 and cycle
periods of (a) 3 seconds, (b) 30 seconds, and
(c) 300 seconds.
7.14 Comparison of experimental data with predictions from 247
interpolation model (I) and interpolation + superposition
model (I+S) for Rene'95 tested at 6490C with R-0.5 and cycle
periods of (a) 3 seconds, (b) 30 seconds, and
(c) 300 seconds.
7.15 Comparison of experimental data with predictions from 248
interpolation mode). (I) and interpolation + superposition
model (I+S) for Rene'9 tested at 649"C with R-0.8 and cycle
periods of (a) 3 seconds, (b) 30 seconds, and (c) 300 seconds.
7.16 Predictions of crack growth rates in Rene'95 at 649% with 250
(a) hold time and (b) cycle period (frequency) using the
superposition model.
7.17 Predictions of crack growth rates in Rene'95 at 649C with 252
(a) hold time and (b) cycle period (frequency) using the
interpolation model.
xxii
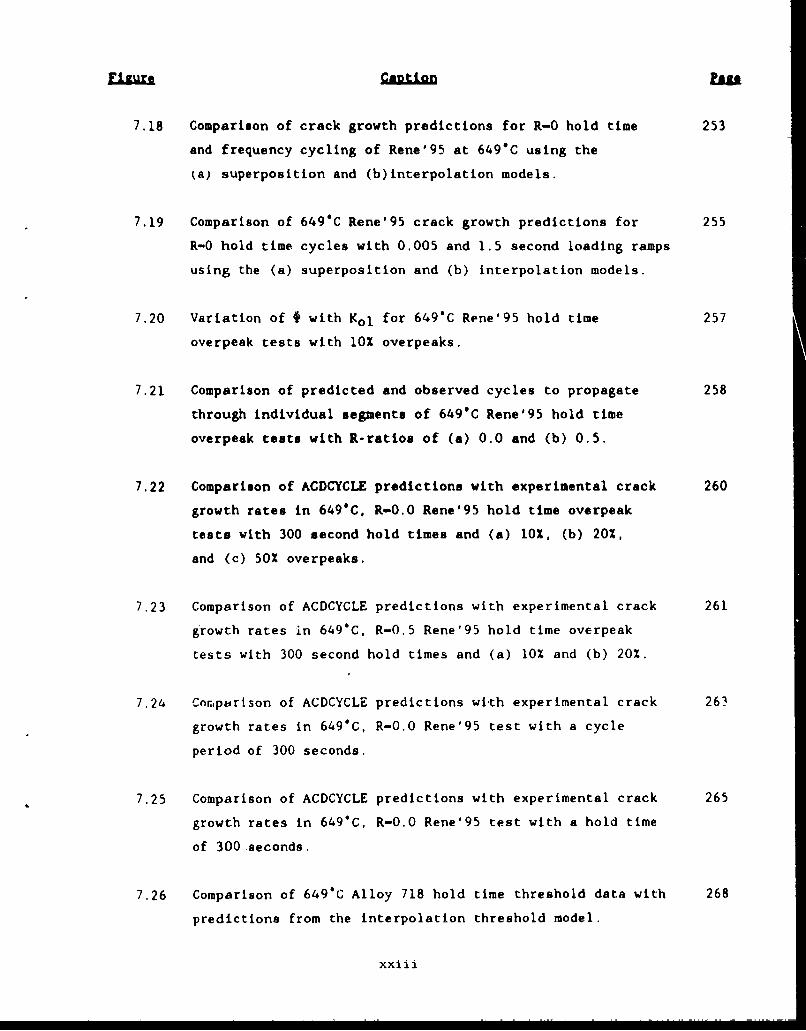
7.18 Comparison of crack growth predictions for R-0 hold time 253
and frequency cycling of Rene'95 at 649"C using the
ks) superposition and (b)interpolation models.
7.19 Comparison of 649*C Rene'95 crack growth predictions for 255
R-0 hold time cycles with 0.005 and 1.5 second loading ramps
using the (a) superposition and (b) interpolation models.
7.20 Variation of # with Kol for 649"C Rene'95 hold time 257
overpeak tests with 10% overpeaks.
7.21 Comparison of predicted and observed cycles to propagate 258
through individual segments of 649C Rene'95 hold time
overpeak tests with R-ratios of (a) 0.0 and (b) 0.5.
7.22 Comparison of ACDCYCLE predictions with experimental crack 260
growth rates in 649'C, R-0.O Rene'95 hold time overpeak
tests with 300 second hold times and (a) 10%, (b) 20%,
and (c) 50% overpeaks.
7.23 Comparison of ACDCYCLE predictions with experimental crack 261
growth rates in 649°C, R-0.5 Rene'95 hold time overpeak
tests with 300 second hold times and (a) 10% and (b) 20%.
7.24 Comparison of ACDCYCLE predictions wi-th experimental crack 263
growth rates in 649*C, R-0.0 Rene'95 test with a cycle
period of 300 seconds.
7.25 Comparison of ACDCYCLE predictions with experimental crack 265
growth rates in 649*C, R-0.0 Rene'95 test with a hold time
of 300 seconds.
7.26 Comparison of 649"C Alloy 718 hold time threshold data with 268
predictions from the interpolation threshold model.
xxiii
Ft e CRU
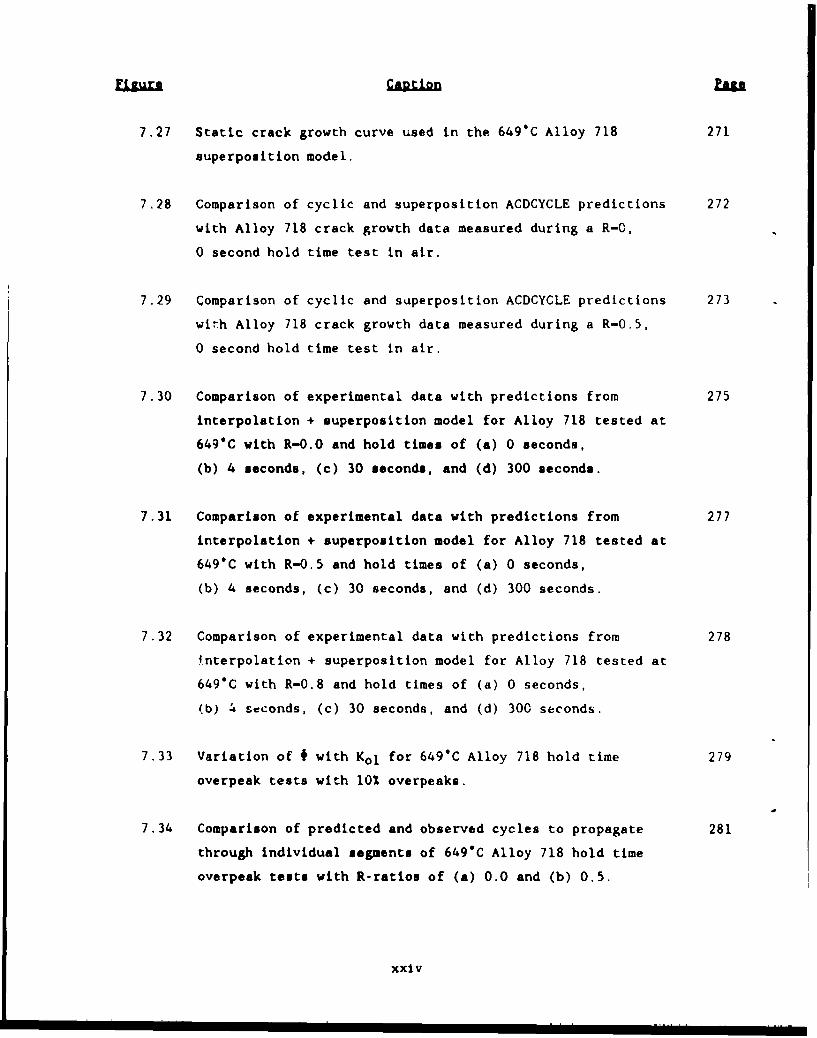
7.27 Static crack growth curve used in the 649"C Alloy 718 271
superposition model.
7.28 Comparison of cyclic and superposition ACDCYCLE predictions 272
with Alloy 718 crack growth data measured during a R-0,
0 second hold time test in air.
7.29 Comparison of cyclic and superposition ACDCYCLE predictions 273
with Alloy 718 crack growth data measured during a R-0.5,
0 second hold time test in air.
7.30 Comparison of experimental data with predictions from 275
interpolation + superposition model for Alloy 718 tested at
649*C with R-0.0 and hold times of (a) 0 seconds,
(b) 4 seconds, (c) 30 seconds, and (d) 300 seconds.
7.31 Comparison of experimental data with predictions from 277
interpolation + superposition model for Alloy 718 tested at
649"C with R-0.5 and hold times of (a) 0 seconds,
(b) 4 seconds, (c) 30 seconds, and (d) 300 seconds.
7.32 Comparison of experimental data with predictions from 278
Interpolation + superposition model for Alloy 718 tested at
649"C with R-0.8 and hold times of (a) 0 seconds,
(b) 4 seconds, (c) 30 seconds, and (d) 300 seconds.
7.33 Variation of * with Kol for 649"C Alloy 718 hold time 279
overpeak tests with 10 overpeaks.
7.34 Comparison of predicted and observed cycles to propagate 281
through individual segments of 649"C Alloy 718 hold time
overpeak tests with R-ratios of (a) 0.0 and (b) 0.5.
xxiv
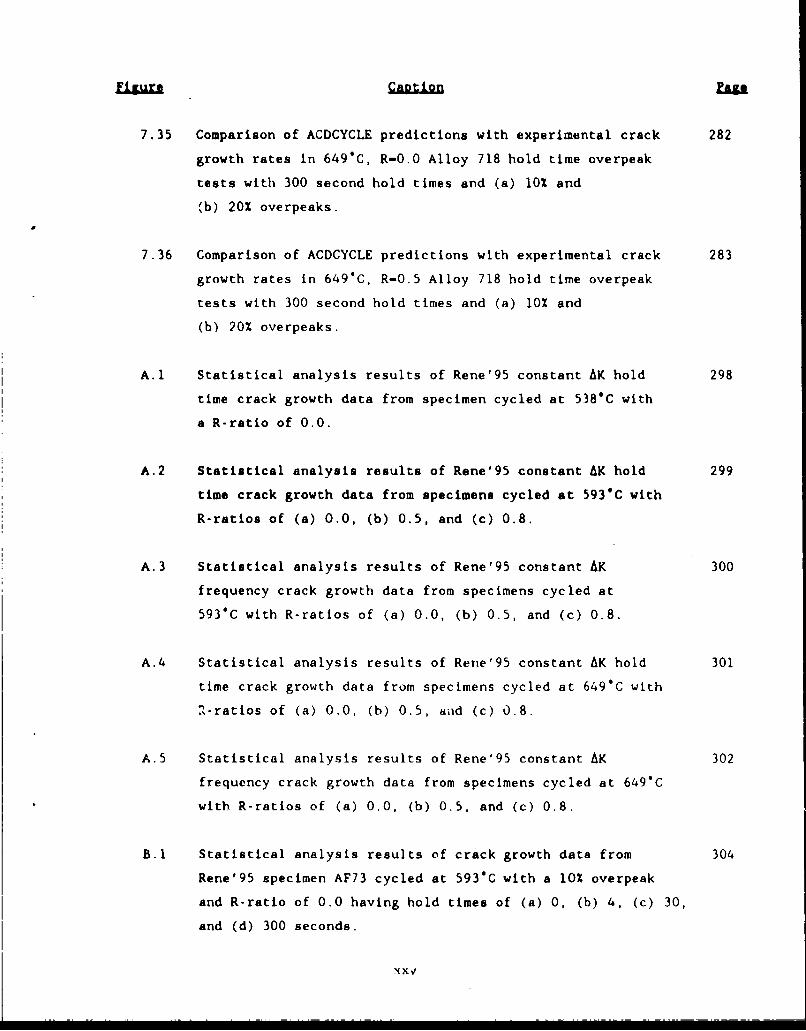
Figure Cajpio £U
7.35 Comparison of ACDCYCLE predictions with experimental crack 282
growth rates in 649"C, R-0.0 Alloy 718 hold time overpeak
tests with 300 second hold times and (a) 10% and
(b) 20% overpeaks.
7.36 Comparison of ACDCYCLE predictions with experimental crack 283
growth rates in 649C, R-0.5 Alloy 718 hold time overpeak
tests with 300 second hold times and (a) 10% and
(b) 20% overpeaks.
A.1 Statistical analysis results of Rene'95 constant AK hold 298
time crack growth data from specimen cycled at 538*C with
a R-ratio of 0.0.
A.2 Statistical analysis results of Rene'95 constant AK hold 299
time crack growth data from specimens cycled at 593"C with
R-ratios of (a) 0.0, (b) 0.5, and (c) 0.8.
A.3 Statistical analysis results of Rene'95 constant AK 300
frequency crack growth data from specimens cycled at
593"C with R-ratios of (a) 0.0, (b) 0.5, and (c) 0.8.
A.4 Statistical analysis results of Rene'95 constant AK hold 301
time crack growth data from specimens cycled at 649"C with
2-ratios of (a) 0.0, (b) 0.5, aad (c) 0.8.
A.5 Statistical analysis results of Rene'95 constant AK 302
frequency crack growth data from specimens cycled at 649C
with R-ratios of (a) 0.0, (b) 0.5, and (c) 0.8.
B.1 Statistical analysis results of crack growth data from 304
Rene'95 specimen AF73 cycled at 593"C with a 10% overpeak
and R-ratio of 0.0 having hold times of (a) 0, (b) 4, (c) 30,
and (d) 300 seconds.
x x

B.2 Statistical analysis results of crack growth data from 305
Rene'95 specimen AF28 cycled at 593"C with a 20% overpeak
and R-ratio of 0.1 having hold times of (a) u, (b) 4, (c) 30,
and (d) 300 seconds.
B.3 Statistical analysis results of crack growth data from 306
Rene'95 specimen AF73 cycled at 593GC with a 10% overpeak and
R-ratio of 0.5 having hold times of (a) 0, (b) 4, (c) 30,
and (d) 300 seconds.
B.4 Statistical analysis results of crack growth data from 307
Rene'95 specimen AF43 cycled at 593C with a 20% overpeak
and R-ratio of 0.5 having hold times of (a) 0, (b) 4, (c) 30,
and (d) 300 seconds.
B.5 Statistical analysis results of crack growth data from 308
Rene'95 specimen AF68 cycled at 649"C with a 10% overpeak
and R-ratio of 0.0 having hold times of (a) 0, (b) 4, (c) 30,
and (d) 300 s6conds.
B.6 S.atistical analysis results of crack growth data from 309
Rene'95 specimen AF29 cycled at 649'C with a 20% overpeak
and R-ratio of 0.0 having hold times of (a) 0, (b) 4, (c) 30,
and (d) 300 seconds.
B.7 Statistical analysis results of crack growth data from 310
Rene'95 specimen AF34 cycled at 649"C with a 50% overpeak
and R-ratio of 0.0 having hold times of (a) 0, (b) 4, (c) 30,
and (d) 300 seconds.
B.8 Statistical analysis results of crack growth data from 311
Rene'95 specimen AF75 cycled at 649*C with a 10% overpeak
and P-ratio of 0.5 having hold time3 of (a) 0, (b) 4, (c) 30,
and ;d) 300 seconds.
xxvi

B.9 Statistical analysis results of crack growth data from 312
Rene'95 specimen AF35 cycled at 649"C with a 20% overpeak
and R-ratio of 0.5 having hold times of (a) 0, (b) 4, (c) 30,
and (d) 300 seconds.
C.A Statistical analysis results of Alloy 718 constant AK hold 314
time crack growth data from specimens cycled at 593"C with
R-ratios of (a) 0.0, (b) 0.5, and (c) 0.8.
C.2 Statistical analysis results of Alloy 718 constant AK hold 315
time crack growth data from specimens cycled at 649"C with
R-ratios of (a) 0.0, (b) 0.5. and (c) 0.8.
D.1 Statistical analysis results of crack growth cata from 319
Alloy 718 specimen A13-02 cycled at 649"C with a 10% overpeak
and R-ratio of 0.0 having hold times of (a) 4, (b) 30,
and (c) 300 seconds.
D.2 Statistical analysis results of crack growth data from 320
Alloy 718 specimen A13-14 cycled at 649"C with a 20% overpeak
and R-ratio of 0.0 having hold times of (a) 4, (b) 30,
and (c) 300 seconds.
D.3 Statistical analysis results of crack growth data from 321
Alloy 718 specimen A13-32 cycled at 649"C (1200"F) with a 10%
overpeak and R-ratio of 0.5 having hold times of (a) 4,
(b) 30, and (c) 300 seconds.
D.4 Statistical analysis results of crack growth data from 322
Alloy 718 specimen A13-05 cycled at 649"C (1200'F) with a 20%
overpeak and R-ratio of 0.5 having hold times of (a) 4,
(b) 30, and (c) 300 seconds.
xxvii

LIST OF TABLES
TbeTitle Pare
3.1 Conditions for Task II Testing 45
4.1 Composition of Rene'95 Disk 48
4.2 Test Ring Properties of Rene'95 Disk 49
4.3 Composition of Alloy 718 Plate 52
5.1 Rene'95 Simple Cycle Test Matrix 72
5.2 Rene'95 593"C Threshold Data 100
5.3 Rene'95 Overpeak Test Matrix 114
5.4 Alloy 718 Simple Cycle Test Matrix 128
5.5 Alloy 718 Overpeak Cycle Test Matrix 146
6.1 Rene'95 Simple Cycle Specimens Evaluated in Fractographic 156
Studies
6.2 Summary Of Rene'95 R-0 Fractography Results For Hold Time 157
Test Specimens
6.3 Summary Of Rene'95 593*C, R-0 Hold Time and Frequency 164
Fractographi c Observations
6.4 Vacuum Crack Growth Specimens 174
6.5 Crack Curvature Data 202
xxviii
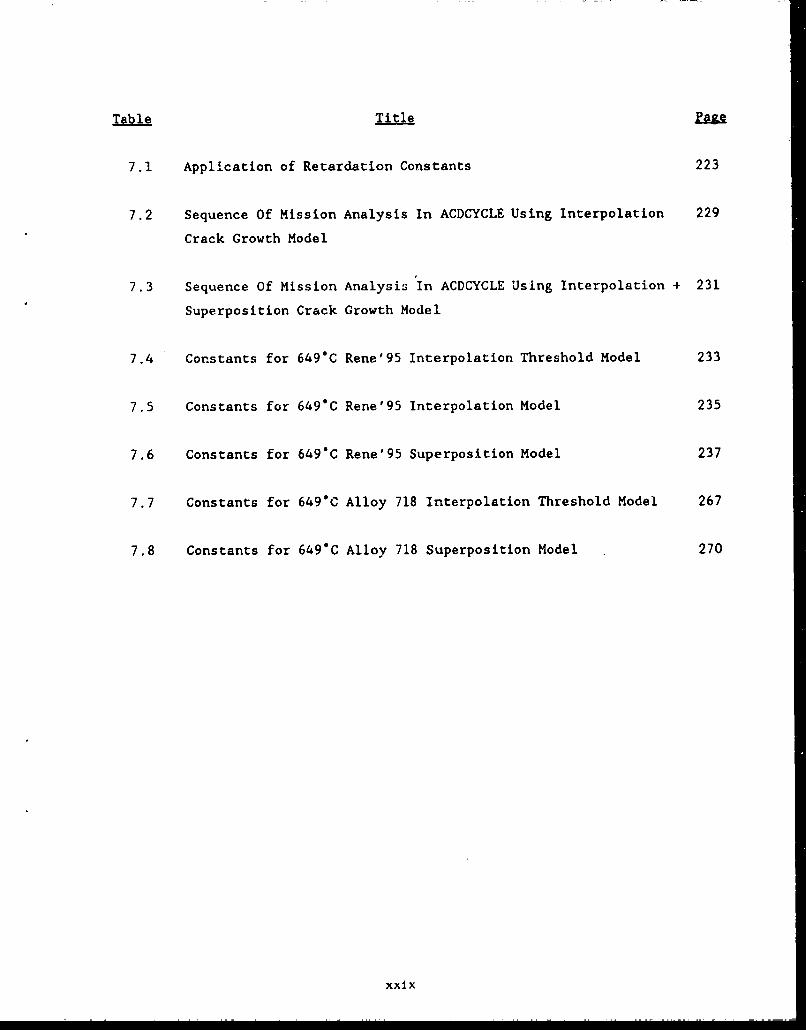
Table Title
7.1 Application of Retardation Constants 223
7.2 Sequence Of Mission Analysis In ACDCYCLE Using Interpolation 229
Crack Growth Model
7.3 Sequence Of Mission Analysis In ACDCYCLE Using Interpolation + 231
Superposition Crack Growth Model
7.4 Constants for 649"C Rene'95 Interpolation Threshold Model 233
7.5 Constants for 649C Rene'95 Interpolation Model 235
7.6 Constants for 649"C Rene'95 Superposition Model 237
7.7 Constants for 649"C Alloy 718 Interpolation Threshold Model 267
7.8 Constants for 649*C Alloy 718 Superposition Model 270
xxix
Improving combat maneuverability and engine efficiency are of critical
importance in the design of current and future military aircraft. Improving
combat maneuverability will require an engine with rapid acceleration and
deceleration capabilities coupled with higher thrust-to-weight ratios and
correspondingly higher operating combustor exit temperatures. Higher engine
efficiency will also require hotter engine operating temperatures. Resulting
service-loading spectra will include a large variety of load applications.
These load applications may include fatigue cyclic loadings, sustained loads
for various times, or a combination of the two.
Analytical and experimental studies have been performed under fatigue
loading and sustained loading alone, but the behavior of materials due to the
interactions between fatigue and sustained loads is complex and not yet well
understood. As temperatures and design stresses increase, time-dependent
material behavior becomes increasingly important. It is well recognized that
time-dependent behavior in typical nickel-base superalloys is an
environmentally enhanced phenomenon; nonetheless, this time-dependence and
sustained-load interactions must be considered for some materials being
utilized or developed for adv.anced Air Force engines. Present crack growth
predictive capability has been demonstrated or applied for primarily
time-independent situations. It is the purpose of this program to improve
significantly the capability for predicting crack growth at elevated
temperatures, including time-dependent material behavior.
The objective of this program was to develop a mathematical model capable
of predicting crack growth in advanced turbine disk alloys under operating
conditions that produce time-dependent and cycle-dependent effects. Crack
growth models were developed to determine crack growth rates of nickel-base
superailoys in advanced Air Force engine turbine disks under spectrum loading
conditions representative of anticipated service in a wide variety of
mi.ssions. Model development was limited to isothermal conditions where
time-dependent crack growth can occur (that is, where hold time and frequency
effects play Important roles in crack-growth behavior). In support of this
-..1-. . : . . .
activity, an extensive experimental program was performed to determine
material properties and to better understand the mechanisms which control
time-dependent crack growth.
The program was accomplished with the following four tasks:
* Task I - Definition of typical wission spectra and range of loading
conditions.
* Task II - Generation and assembly of complete baseline crack growth
data on Rene'95 and limited baseline data on Alloy 718.
* Task III - Development of crack growth models and incorporation
into computer code for numerical calculations.
* Task IV - Evaluation of governing mechanisms and application of
this information to model development.
The work in Task I concentrated on surveying the missions or anticipated
missions in advanced military aircraft. This survey included various high
pressure turbine disk locations where loading and temperature profiles were
significantly different. These stress/temperature/time histories were
selected from analyses of the Joint Advanced Fighter Engine. In reviewing
these aLalyses, emphasis was placed on conditions which would lead to
time-dependent crack growth. Based on this Task I survey, the range of Task
II testing conditions was selected.
In Task II, the crack growth properties of extruded plus isothermally
forged powder metallurgy Rene' 95 and cast plus wrought Alloy 718 were
measured over a range of temperatures, stress ratios, test frequencies, hold
times, and overpeak loading pattorns. The Region II crack growth rates were
determined using buttonhead single edge notch specimens by applying segments
of constant stress intensity factor where the crack length was monitored using
a DC potential drop technique. This method was selected to provide a
cost-effective test method, with determination of good statistical data, along
-2-

with identification of transient behavior. The near-threshold crack growth
rates were determined using a K-shed technique. The data obtained in this
program were modeled in Task III and were used to select test conditions for
the Task IV mechanism tests.
In Task III, data obtained during the Task II on Rene' 95 and Alloy 718
uere modeled. Both totally interpolative and a combination of interpolative
and superposition models were developed. Based on these analyses and
understanding of the crack growth mechanisms obtained during Task IV, the best
crack growth model was identified and documented. At the end of this task, a
personal computer (PC) crack growth prediction computer program was written
and delivered to the Air Force Materials Laboratory.
The purpose of Task IV was to identify the elevated crack growth
mechanisms of nickel-base superalloys. Extensive fractographic examinations
were performed on the specimens tested in Task II. This information was used
to- evaluate the underlying mechanisms. In addition, high vacuum and other
types of tests were performed to better understand the role of environment and
other factors which result in time-dependent crack growth. These results were
used to assist in the selection of the crack growth models in Task III.
-3-

2.0 LITERATURE REVIEW
The uLjective of the investigation described in this report was to
develop an improved model for time-dependent crack growth in nickel-base
superalloys for the range of conditions experienced in the turbines of
advanced aircraft engines. There has been a significant amount of research
performed on these and similar alloys. This section of the report will
summarize that work and set the background for both the experimental and model
development portions of this investigation. The literature survey has been
divided into sections on creep - fatigue - environment interactions, crack
growth rate curve relationships, and the models used to predict time-dependent
crack growth.
2.1 CREEP - FATIGUE - ZNVIRONMENT INTERACTIONS
It has been known for several decades that there is a complex creep -
fatigue - environment damage mechanism which occurs during the high
temperature cyclic loading of engineering materials. This was ably
demonstrated by Coffin and his coworkers( 1 ,2) where the elevated temperature
fatigue life of smooth fatigue specimens tested in laboratory air diminished
significantly as test frequency was reduced. This effect, to a large extent,
disappeared when the tests were performed in a high vacuum environment. These
types of observations led to the development of frequency modified fatigue
laws( 1 ,3"5 ) and strain range partitioning fatigue models(6 "8 ).
The effects of environment on the rupture behavior of nickel-base alloys
was probably first demonstrated by Chang(9 ) who showed that rupture specimens
exposed in air under no applied stress had lower rupture ductility than
companion specimens tested without the pre-exposure. These types of
experiments were performed using several nickel-base cuperalloys. Cracks
nucleated at the specimen surface and exhibited an intergranular failure mode.
This behavior was the subject of more exhaustive research which has been
reviewed by Woodford and Bricknell(O0 ). It has been shown that the
embrittlement behavior is very complex and results, in part, from the
-5-
diffusion of oxygen along grain boundaries. Therefore the response of a given
material is highly dependent on the local chemistry and structure of grain
boundaries.
2.1.1 CrakMGot
The growth of cracks has been studied in numerous investigations at
universities( 1 - 1 5 ), government laboratories (1 6 "2 4 ) , and industrial
laboratories( 2 5 -3 2 ). The materials evaluated included several commercial
alloys, b-tt the most popular alloy investigated was Alloy 718, a y-y"
superailoy. Testing conditions included a variety of different wave forms as
well as constant or static load (no fatigue component). The investigations
studied the influence of test temperature, R-ratio, test frequency, hold time,
overpeak, microstructure (alloy, product form, and heat treatment), and/or
ftactuLt g . Starting with the initial work of Solomon(2 5 ), it %sas bcen
shown that the presence of laboratory air greatly accelerates the growth of
cracks, particularly for static loading and low frequency or hold time cyclic
tests(1 2 "14,1 8 ,2 9 ) The most thorough evaluation of environment was the study
by Floreen and Kane(2 9 ) where the crack growth of Alloy 718 was measured in
several different environments. The results of that study strongly suggested
that oxygen is the species which makes air such a damaging environment.
Many of the studies showed that for high frequency conditions, the
testing environment does not significantly influence the crack growth
rates (1 6 ,2 0 ,2 3 -2 5 ,26 ) . This has led to the terminology of cycle dependent and
t ,' L tegiPIcs, ccrresponding i.o conditionr wher propaga'li., is
dominated by static or cyclic crack growth, respectively. It was also shown
that as the material experienced more time-dependent crack growth rates, the
fracture path often changed from a transgranular to a intergranular mode.
Several investigations(14,19,27) have shown that there is a significant
difference in time-dependont crack growth between different alloys. Cowles,
Warren, and Haake(3 1 ) showed that seven aircraft engine disk alloys had
similar crack growth rates for 20 cpm (0.33 Hz) continuous cycling at 649*C.
The crack growth rates of these alloys accelerated significantly during 900
-6-

second hold time cycles and differed by a factor of 100 between the different
alloys. These data can be correlated with a variety of parameters including
grain size, ultimate tensile strength, and chromium content, but the true
source of the accelerated growth associated ith creep - fatigue - etiviLoutient
interactions is not known or understood. James(3 0 ) investigated several
different product forms of Alloy 718 and showed that uniform coarse grained
material had slower crack growth rates than uniformly fine grained Alloy 718.
Processing conditions with a duplex, necklace microstructure were superior to
either of the uniform grain sizes. A similar conclusion was reached by Bain
an'c Pelloux(14) for Rene'95.
There have also been several investigations supporting the occurrence of
a competition between environmentally-assisted crack advance and crack tip
blunting (and stress redistribution) caused by creep(1 5 ,1 6 A1 8). There is also
significant evidence of specimen thickness effects wheie .ore rapid z:ack
growth occurs in the center of through crack specimens than at the
surface(33,34).
It has been observed that there can be a significant amount of
time-dependent crack growth during elevated temperature service. The amount
of growth is highly dependent on the temperature, environment,
alloy/microstructure, and loading cycle. Although several suggestions have
been made, the mechanisms by which this accelerated crack growth can occur are
not well understood.
;.2 CMACK GROWTH CURVES
Numerous mathematical relationships have been proposed to describe the
relationship between cyclic crack growth rate (da/dN) and the value of the
range of the Irwin stress intensity factor (AK) or some value of effective
value of K (Keff). Three basic relationships have been used to describe the
resporse of nickel-base superalloys - the Paris, sinh, and sigmoldal
equations. This section will describe each of these and their implications
and limitations.
-7-

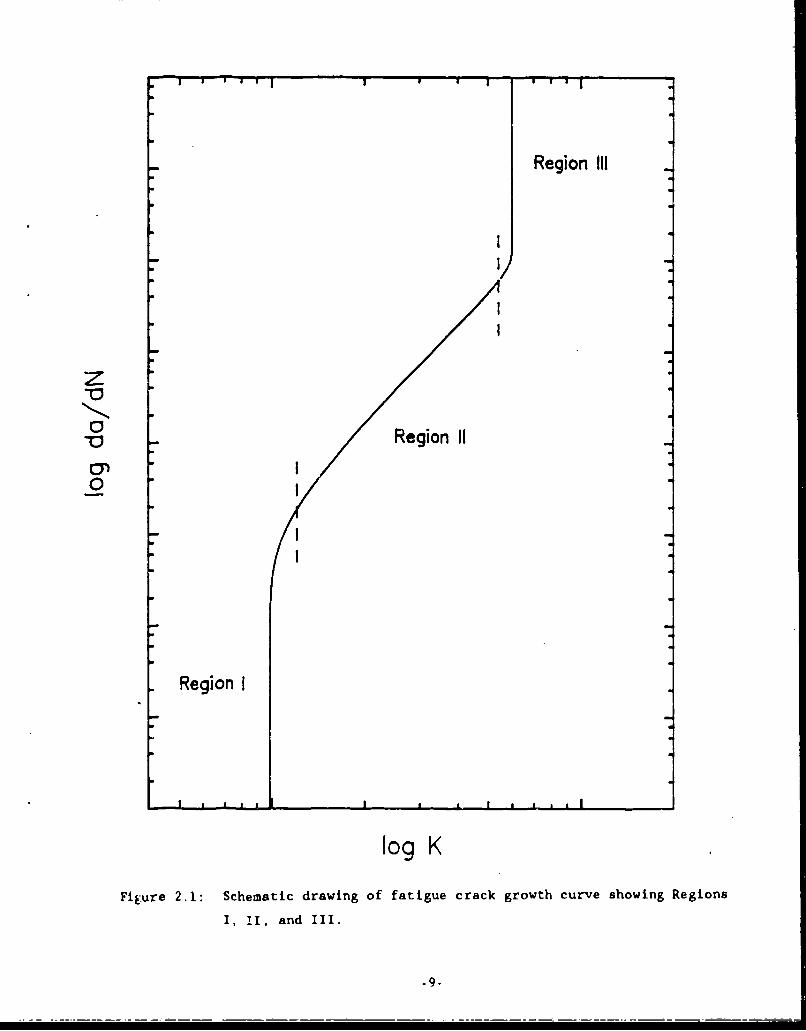
The crack growth response of engineering materials is usually
represented in a plot of the logarithm of crack growth rate (da/dN) as a
function of the logarithm of AK or Keff. For the remainder of this section no
aisuinction will be made between AK and Keff and they will be ieferred to as
just K. Figure 2.1 shows a schematic representation of a typical fatigue
crack growth curve. This curve has three main sections as labeled in this
figure. Region I is the near-threshold regime where decreasing K results in a
sharp decrease in crack growth rates as the threshold value, Kth, is
approached. Region III is the upper end of the curve with rapid crack growth
rates which approach the cyclic toughness, Kc. Region II exists between these
two regimes and typically has a linear response between crack growth rate and
K using the log-log representation shown in Figure 2.1.
All three models consider variation in the logarithmic properties as
shown in Figure 2.1. In order to avoid lengthy equatim , the crack growth
rates will sometimes be rewritten using the terms x and y where
y - log da/dN (2.1)
x - log K (2.2)
This representation presents the schematic curve in Figure 2.1 using linear
rather than logarithmic coordinates.
2.2.1 Earis La
Paris( 3 5 ) was the first to show that the growth of fatigue cracks could
be described using linear elastic fracture mechanics. In his original work,
he noted that there was a linear relationship between the logarithm of crack
growth rate and K. He proposed describing these Regior. II crack growth rates
using a relationship which has come to be known as the Paris Law. This can be
described as
da/dN - A Kb (2.3)
-8-
Region III
Region 11
Region I
log K
Figure 2.1: Schematic drawing of fatigue crack growth curve showing Regions
I, HI, and III.

where the values of A and b are constants determined from the experimental
data. This relationship can also be represented as
y - log A + b x (2.4)
using the definitions of x and y in Equations 2.1 and 2.2.
The Paris relationship adequately defines the Region II portion of the
crack growth rate curve. It can be combined with values of Kth and Kc to
provide endpoints to the curve representing the lower and upper limits of
crack growth, respectively; however, the transition regions between the
near-threshold and near-toughness are not represented by the Paris model.
2.2.2 S.iDIL.Curvef
The sinh model was developed at Pratt and Whitney(3 6 "3 8 ) and has been
used to describe the crack growth rate of several structural materials
including high strength nickel-base superalloys. The hyperbolic sine (sinh)
crack growth equation is
log (da/dN) - Cl sinh (C2 (log K + C3)) + C4 (2.5)
or using the definitions of x and y given in Equations 2.1 and 2.2
y - C1 sinh (C2 (x + C3)) + C4 (2.6)
An example of a sinh growth curve is shown schematically in Figure 2.2. An
inflection point occurs at an x value of (-C3 ) and a y value of C4. This
model has no mathematical definition of Kth or Kc and a value of da/dN can be
determined for any value of K. The curvature of the sinh curve is identical
in the near-threshold and near-toughness regime since the sinh function is
symmetric. The parameters Cl and C2 scale the x and y axes, respectively.
-10-
I= I == i i i i I I -I I =

Sinh curve
z~0
log K
Figure 2.2: Schematic drawing of stnh crack growth curve.
The slope of the sinh curve is
dyC C cosh (C (x + C (2.7)12 ( 2 C3 )
U,'
At the inflection point (xi - -C3) the slope equals ClC 2 .
Wallace, et.al.( 36 ) defined C1 to be a material constant. The values of
C2 , C3 , and ( were described as a function of the test parameters and were
determined from the position (x4 and yi) and slope of the crack growth curve
at the inflection point.
2.2.3 Sigmoidal Curve
The sigmoidal crack growth relationship was originally developed at GE
Aircraft Engines by Knaus( 3 9 ) and first reported in the open literature by
Coles, et.al.(2 8 ). The form of this relationship is
K p_ K Q K Dda/dN - exp (B) [ [log I [log - (2.8)
th th
where B, P, Q, and D are constants for a given set of experimental conditions;
and Kth and Kc are the threshold and cyclic toughness stress intensity
factors, respectively. Figure 2.3 shows a schematic drawing of the sigmoidal
crack growth curve.
Using the definitions of x and y given above and detining
xo - log Kth (2.9)
and xf - log Kc,
(2.10)
the sigmoidal relationship can be rewritten as
y - B + P(x-x,) + Q log (x-xo) + D log (xf - x) (2.11)
-12-

Sigmaidal curve
log K
Figure 2.3: Schematic drawing of aigmoidal or Knaus crack growth curve.
.13-

The first term, B, translates the curve up the y axis. The slope of the curve
is controlled by P and the curvature in the near-threshold and near-toughness
regime is controlled by Q and D, respectively. In most cases, the value of D
is negaLive. The sigmoidal curve hab a LuLW Jden.-ical to the Paris
relationship when Q and D are set to zero and Kth equals unity (xo - 0).
The slope of the sigmoidal curve is
dy/dx - P + Q/(x-xo) - D/(xf-x) (2.12)
The inflection point (xi) can be determined by setting d2y/dx2 to zero and by
rearranging
x i - (xfIQ + xo,/(-D)) / (JQ + /(-D)) (2.13)
The major advantage of the signoidal curve over the sinh model is that
values for both the crack growth threshold and cyclic toughness are defined.
The aigaoidal relationship also independently defines the curvature in the
transition between both Regions I and II and Regions II and III. These are
not adjustable in either of the other crack growth curve equations. This
comparison of the signoidal and sinh models is, to some extent, slightly
unfair. The sigmoidal equation has six adjustable parameters while the sinh
model only has four. Thus, one would expect an inherently better fit for the
sigmoidal than sinh model. The near-threshold and near-toughness transitions
in the sinh model are dependent on an unadjustable functional form, in this
onse the hyperbolic sine. Oti the 3ther .bard, the sig.sidal equations models
these regimes with the help of the constants Q and D. This leads to more
flexability in accurately modeling the crack growth response over the entire
range of crack growth rates. The principal deficiency of the sigmoidal
relationship is the inter-dependency of the six constants.
-14-

2.3 TIME-DEPENDENT CRACK GROWTH MODELS
There are two basic types of models which have been used to predict the
tine-dependent crack giuwiit repuase of nickel-base superalloys: interpolative
and superposition models. Interpolative models describe the constants in the
crack growth rate equations as a function of che cycling variables (R,
frequency, hold time, etc.) while superposition models separately account for
the cycle-dependent and time-dependent parts of the crack growth. Each type
of model will be considered separately.
2.3.1 Interpolative Models
Two interpolative models have been used to analyze elevated temperature
crack growth of nickel-base superalloys. An interpolative sinh model was
developed by Sim, et. i.(38) while a.i itterpolative sigmoidal model was
developed by Utah(32 ). These two interpolative models were developed to
represent the influence of temperature, hold time, frequency, and R-ratio on
the constants in the appropriate crack growth equation. In both cases, the
material constants were derived largely on the basis of Region II data.
Both models were calibrated using the movement of the inflection point
in the crack growth rate curve. For the case of the sinh equation, Sims,
et.al.(38) set the value of C1 to a constant. The movement of the inflection
point was controlled by the variations in C3 and C4 , the values of x nnd y at
the inflection point. The slope of the curve was controlled by the slope at
thc infleCLion point 'C2).
Utah( 32 ) developed a interpolative model of the sigmoidal equation by
establishing relationships for the variation of Kth (exp xo) and Kc (exp xf)
with test parameters and setting the value of Q to a constant. This was done
in the absence on near-threshold crack growth data. The remaining sigmoidal
constants (B, P, and D) were evaluated by the movement and slope of the
inflection point. The constant D was evaluated from the xi value of the
inflection point. P was then calculated from the slope of the crack growth
rate curve at the inflection point and the value of B was determined by the
-15-

absolute crack growth rate at the inflection point. Equations were
constructed using regression analysis to describe the variation of the six
sigmoidal terms with temperature, stress ratio, frequency, and hold time.
Both interpolative models accurately predict the response of cracks in
Region II under the combined influence of test temperature, stress ratios,
frequencies, and hold times, but may be inaccurate in the near-threshold
regime. This low crack growth rate regime can be very important for the high
R-ratio conditions which frequently occur in military aircraft. The
interpolative models are also difficult to interpret in terms of crack growth
mechanisms.
The models Just described can be thought of as total interpolative
models where all the constants in the crack growth equation are described as a
function uC Lhe cycle paineters. There is also another type of interpolative
model where the effect of R-ratio (mean stress) is modeled by transforming the
values of K and R into a single value of Keff. This changes the values on
the log K (x) scale rather than the values of the crack gro.th equation
constants. One successful example of this type of model is the relationship
first proposed by Walker(40)
Keff - Kmax (-R)m (2.14)
where m is known as the Walker exponent
Vhen m is zpro, Ketf zqual' KraA: but when m i ut,!Lty, KeZf cqualb AK
In reality, the Walker exponent is an empirical factor which accounts for mean
stress and closure effects without knowing their magnitude or the exact
contribution from each effect. The crack growth curve can then be defined in
terms of Keff rather than AK.
The Walker approach was modified by Van Stone(41 ) to include the use of
a separate Walker exponent for positive and negative R-ratios (m+ and m-,
respectively). This approach was used to model a large range of HIP-compacted
Rene'95 Region II data to a single crack growth curve for R-ratios ranging
-16-

from -1.22 to 0.75. Subsequently this approach has been used to successfully
account for the influence of R-ratio on the Region I and II crack growth rates
for a wider range of alloys including extruded and isothermally forged
Rene'9, Allay 718, and Direct Aged Alloy 718(42"&4). MLe.v i,,vastigations
showed that the crack growth rates of these materials under 0.33 Hz (20cpa)
cycling conditions could be collapsed to a single population of data which can
be converted to a set of crack growth equation constants(4 3).
2.3.2 Suerjosition gdels
The time-dependent crack growth response of materials can also be
described using a superposition model where the total crack growth rate is
described as the sum of the cyclic crack growth and the time-dependent crack
growth
da/dN - (da/dN)c + Aa (2.15)
where
da/dN - total crack growth rate
(da/dN)c - cyclic crack growth rate
and Aa - time dependent crack growth rate
This type of model was first proposed by Wei and Landes(4 5) for the
modeling of room temperature corrosion fatigue of high-strength steels above
the stress corrosion cracking threshold for the environments evaluated. This
yre cZ modLi wos O'sctssed more fully by Galla~he- and We'( 4 6 ) and wab
applied for the first time to elevated temperature time-dependent crack growth
of superalloys by Solomon(4 7).
Elevated temperature crack growth which occurs under constant load
conditions is frequently called creep crack growth. This appears to be an
accurate description for the growth of cracks in pipe line and pressure vessel
steels where extensive creep deformation occurs as the cracks grow. This
terminology presumes that the growth of the crack is controlled by the far
field creep deformation. As first noted by Larsen and Nicholas( 20 ), this may
-17-

not be an accurate description for the environmentally sensitive crack growth
in nickel-base superalloys at elevated temperature. This type of
environmentally assisted cracking appears to be phenomenonologically similar
to the stress corrosion cracking of steels, LLlan.u,-, a'nd aluminum alloys at
low temperatures, even though the crack tip deformation and fracture
mechanisms are quite different. For these reasons, this type of crack growth
will be called sustained-load or static crack growth through the remainder of
this report in order to avoid any misconception as to the mechanisms
associated with this behavior.
Speidel(4 8 ) and Sadananda and Shahinian(1 7) reported that the hold time
and low frequency crack growth response of Alloy 718 at elevated temperatures
could be modeled as a time-dependent crack growth. Examination of Equation
2.15 shows that this can be predicted using a superposition approach when
(da/dN)c is small relative to Aa.
Utah(3 2) noted that one of the most difficult conditions to predict
using an interpolation model was the combination of high mean stress, high
temperature, low frequency, and long hold times. Under these conditions, a
significant amount of the crack growth can occur from the constant high stress
portion of the cycle only, with only a limited contribution from the cyclic
component of stress. It appears t', t a superposition model would be able to
predict the crack growth in this type of cycle better than an interpolation
model.
,hristoff(2 1) extended the superpoitio, model by ab3uring that Ptatic
crack growth obeyed a Paris type relationship
da/dt - C Kn (2.16)
If K can be written as a function of time, f(t), this equation can be
rearranged and integrated over the time interval of a loading segment (t) to
determine the crack growth increment Aa:
-18-

Aa - Jda - C J f(t)n dt (2.17)
Christoff(21 ) performed closed form integration for the cases of either (1)
constant K or (2) linear variations of K with time. For constant K conditions
A - A Kn t (2.18)
The result for a linear variation of K with time is dependent on t, n, and the
R-ratio
Aa - C ((1 - R)(n+l)/(n+l)) Kmaxn r (2.19)
Comparison of Equations 2.18 and 2.19 show that they can both be expressed by
the following relationship:
As - A Kn teff (2.20)
where teff - t for hold times (2.21)
and teff -((1 - R)(n+l)/(n+l)) t for loading ramps (2.22)
The variation of the tatio between teff and t as defined in Equation 2.22 is
shown in Figure 2.4 as a function of R and n. As R increases, Kmin approaches
Kmax resulting in a larger value of K over the cycle and thus a higher teff
and larger amounts of static crack growth. In the limit as R approaches
unity, a loading ramp closely approximates a hold time so teff / t is unity as
described in Equation 2.21. The value of n describes the slope of the static
crack growth curve. Increasing n results in a larger difference in crack
growth rates between Kmin and Kmax for a constant R ratio. The influence of n
diminishes with increasing R because higher R ratio result in a smaller range
of K.
This model assumes that there is no threshold value of K below which
cracks will not grow. This approach has been used by Nicholas and
co-workers(20 ,2 2 ,23) to predict the growth of cracks in nickel-base
superalloys. They showed that this approach works well under some
circumstances, but not so well under others. The most notable exceptions were
-19-

0__' II I I
1/
n=2
1001/; ." ...- "/
n=4---
n" 6
6 /
C. "
0
04- /2
0.0 0.2 0.4 0.6 0.8 1.0R
Figure 2.4: Variation in tef f /t with R-ratio and Paris exponent (n) for
loading ramps as predicted by the linear superposition model.
-20-
I ::1... . / . .I. . .[ ... .. . ].. .] . . . .{ : . .. . I . . .I i . . .. : I. . . .i . . . .| i ..

low R-ratio loading ramps. It has been concluded that only the loading
portion of cycles result in crack growth; however, this observation tends to
break down for high R-ratio cycling. The superposition model does not tend to
accurately pLadict the growth of cracka when the load or K is L eld Lt values
below the maximum level. This will be discussed in the following section.
2.3.3 Retardation Models
It is well known that if a crack experiences a mission where a single
maximum load cycle is significantly greater than the other load maximas, the
crack growth rate is diminished or reta:ded relative to what would be
anticipated had the overpeak not occurred. This behavior is known as overpeak
retardation. This can be caused by a variety of mechanisms. The most
frequently mentioned is the development of a compressive zone ahead of the
crack. This is caused by the creation of a larger crack tip plastic zone
during the overpeak and the subsequent unloading. When the load is removed,
the material unloads in an elastic fashion to a more compressive local stress
than was present prior to the overpeak. The crack growth will be slower until
it grows through the more compressive stress zone. The amount of crack growth
retardation and the distance over which it occurs increases with the size of
the plastic zone, which is related to the magnitude of the overpeak K.
There are three basic types of retardation models: one which predicts
the number of delay cycles until a crack again grows at it non-retarded rate,
modelb which reduc. the rrick growth rate, and models which reduce- the
effective value of K and, in turn, reduce crack growth rates. An example of
the latter type will be reviewed here because this type of model has been
successfully applied to the crack growth of nickel-base superalloys under
cyclic(4 9) and time-dependent( 50 ) conditions.
One of the most frequently used retardation models is that developed by
Willenborg(51 ). The Willenborg model is very simple is concept. A value of
reduced K is calculated and is dependent on the value of the overpeak, the
current K (load), and various measures of the crack tip plastic zone.
-21-

Kred - Kol .[(rol - A)/ rol] Kmax ) 9 (2.23)
where Kred - reduced value of K
Kol - value zf K at Che overpeak
Kmax - maximum value of K being reduced
rol - overpeak plastic zone (calculated from Kol)
rp - current plastic zone (calculated from Kmax)
A - distance of crack propagation since overpeak (a- aol)
- retardation constant
with the restriction that Kred is positive.
The only adjustable variable in the expression is the retardation constant I.The maximum value of Kred occurs when A is zero and equals (Kol - Kmax)§. For
elabuc! unloading the value of Kred should never exceed Kol - Kmax ao the
value of the constant I should never exceed unity.
The plastic zone sizes are assumed to follow the usual relationship in
linear elastic fracture mechanics where they vary with the square of K. Using
this relationship and setting the value of the expression within the brackets
to zero (Kred - 0) results in
Amax - rol - rp (2.24)
where rp is the plastic zone size associated with the current maximum value of
Kmax. The meaning of this is that the values of K are reduced over the
dista,,c. Aa, fr,a the crack length where the overpezk occurred.
For cyclic loading, the value of Kred is applied to both the minimum and
maximum loads resulting in a change in Kmax and R but not in the range of K
(Kmax)red - Kmax - Kred
(Kmin)red - Kmin - Kred
(R)red - (Kmin)red / (Kmax)red
- (Kma x - Kred) / ((Knin - Kred) (2.25)
-22-

The &mount of relative retardation diminished as the R-ratio increased
because, fo, the most part, the cyclic crack growth rates for nickel base
superalloys are controlled by AK for high R-ratios (m+ - 1) while for negative
R-rariob Lite 6Cowth is controlled by Kmax. As ahcwn in Eqtlatior 2.25, this
model does not alter AK but may have a significant effect on Kmax. This, in
part, may be the reason that some of the missions analyzed by Larsen, et.
al.( 3 7 ) do not shov much benefit of retardation.
Weerasooriya and Nicholas(5 0 ) showed that a relatively small overpeak,
combined with a hoLA time in a single cycle, could dr-Rmatically reduce the
acceleration in crack growth rates associated with hold times in Alloy 718.
If the K of the overpeak was more than 25 percent higher than the K of the
hold, the crack growth rates were the same as those observed if the cycle had
not included the hold time. This is very significant because for a cyclic
case, a 25 percent overpeak would result in a relatively small reduction in
crack growth rates. These results were modeled using a Willenborg type
model(50).
-23-

3.0 MISSION ANALYSIS
The objective of this task was to review the missions of advanced
militaLy aircraft engines and identify the ranges of tLmperature, fzcquencies,
hold times, stress ratios, overpeaks, and underpeaks in these turbines. These
results were used to select the experimental conditions investigated in this
program.
The primary emphasis of this task was to analyze a range of missions
used in an advanced fighter engine. A total of 18 missions were analyzed.
These included 9 different types of missions for two different locations. The
locations selected were in the rim region of a high pressure turbine disk
(HPTD). These regions were selected due to the combination of elevated
temperature and high stress which would make them have a high susceptibility
to time-dependenc crack growth behavior.
A combined thermal-mechanical finite element analysis was performed on
the HPTD using COMALL-A, a computer code developed at GEAE. The thermal and
mechanical stresses were computed separately. These analyses resulted in
calculation of the stresses in one second increments throughout each mission.
The stresses shown in this report are the sum of the mechanical and thermal
stresses. For each mission, the stresses are normalized by the maximum stress
in that cycle.
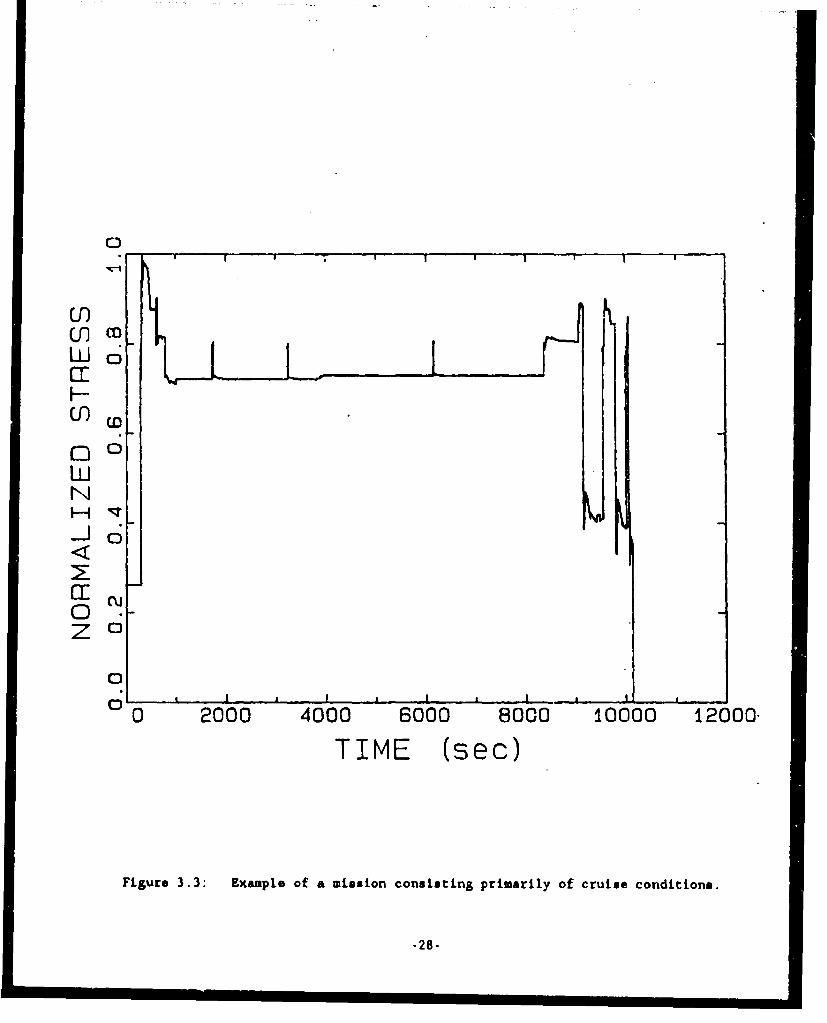
Examples of a typical mission stress spectrum are shown in Figures 3.1
through 3,. These partic-lar missions were selected r- 111tstrarf- condIton
with relatively frequent changes in rotor speed (Figure 3.1), combination of
cruise and rotor speed changes (Figure 3.2), and large segments of cruise
component (Figure 3.3). During cruise conditions, the stresses are relatively
constant resulting in what will be called a hold time cycle for the remainder
of this report. These figures illustrate that typical advanced fighter
missions operate with high mean stresses (high R) and frequently have
overpeaks associated with hold times. The variations in stress occur over
relatively short periods of time. On this basis, crack growth during hold
times is more important than low frequency tests.
-25-

0
Lo
CT 0
N
0.zo
, I i ii .
0 1000 2000 3000 4000 5000 6000 7000TINE (sec)
Figure 3.1: Example of a mission with frequent changes in rotor speed.
-26-

~)
Fr
0LUJN
-J6
IT C0z o
0
0i . I I , I i0 0 1000 2000 3000 4000 5000
TIME (sec)
Figure 3.2: Example of a mission with changes in rotor speed and cruise
conditions.
-27-
LL_ 0"U)
13F -
00
LIJN
0.
0- p I a I a I a __________________. _
0 2000 4000 6000 8000 10000 12000-
TINE (sec)
Figure 3.3: Example of a mission consisting primarily of cruise conditions.
-28-

It was rather difficult to identify the critical features of these
missions by visual inspection so two computer programs were written to analyze
these mis*ions. TIe first program revised the COHALL-A results with one
stresn-tc. Pt).tue data set for one second increments to a sequence cf longer,
linear segments. The second program was a sorting routine where any
particular typ 4 1 cycle can be extracted from the mission profiles. Each
of these programs and the analysis of the eighteen missions are discussed in
the following sections.
The approach used in the simplification program was to first elim.nate
data points where the variation in stress was small. This was accomplished by
starting at the first data point and searching for the next stress value
different by more than 5 percent. This process was repeated throughout the
entire mission. This revised mission was further simplified by eliminating
data points which were in a relatively constant stress-time ramp. Points
which had variations in slope by a factor in excess of 0.75 and less than 1.5
from the previous slope were eliminated. Figure 3.4a shows a plot of
normalized stress (stress/maximum stress in mission) for the mission used to
develop this software. This particular mission was 6543 seconds long (6543
data points). The resulting simplified mission is shown in Figure 3.4b and
contains 123 data points. This simplified mission portrays the main
characteristics of the actual mission. The major weakness of the simplified
misvion approach is that the plus or minus 5 percent deviation in stress can
result in treating 10 percent variations of stress as a hold time segment. A
good example of this is shown between 2000 and 3000 seconds in Figure 3.4.
Flgurer 3.5a and 3.b 4ihu. Lhe ;,nrictton !n temperatuce durtnr% the actual An(,
simplified mission respectively. As in the case of the stress, the mission
simplification technique also seems to model the temperature variation rather
well. Each of the eighteen missions was simplified in this fashion.
A second computer program was writtenI to analyze the individual
components of these simplified missions. This program first identified the
parts of the mission which were hold time segments. Any segment which had a
stress ratio (R - minimum stress / maximum stress) greater than 0.95 was
considered to be a hold time. This criterion is consistent with the 5 percent
-29-

0
qo -
U)
woLI
CE
LuLN
0J-
CC
0
1000 2000 3000 4000 5000 6000 7000
TIME (sec)
(a)
0
U)
L0 0
I--
LuJ
-
LE ru0.
zo *
Z 0
C!
0 I ., * I I * I * I
0 1000 2000 3000 4000 5000 6000 7000
TIME (sec)(b)
Figure 3.4: Variation of normalized stress with time for (a) actual mission
and (b) simplified mission.
-30-
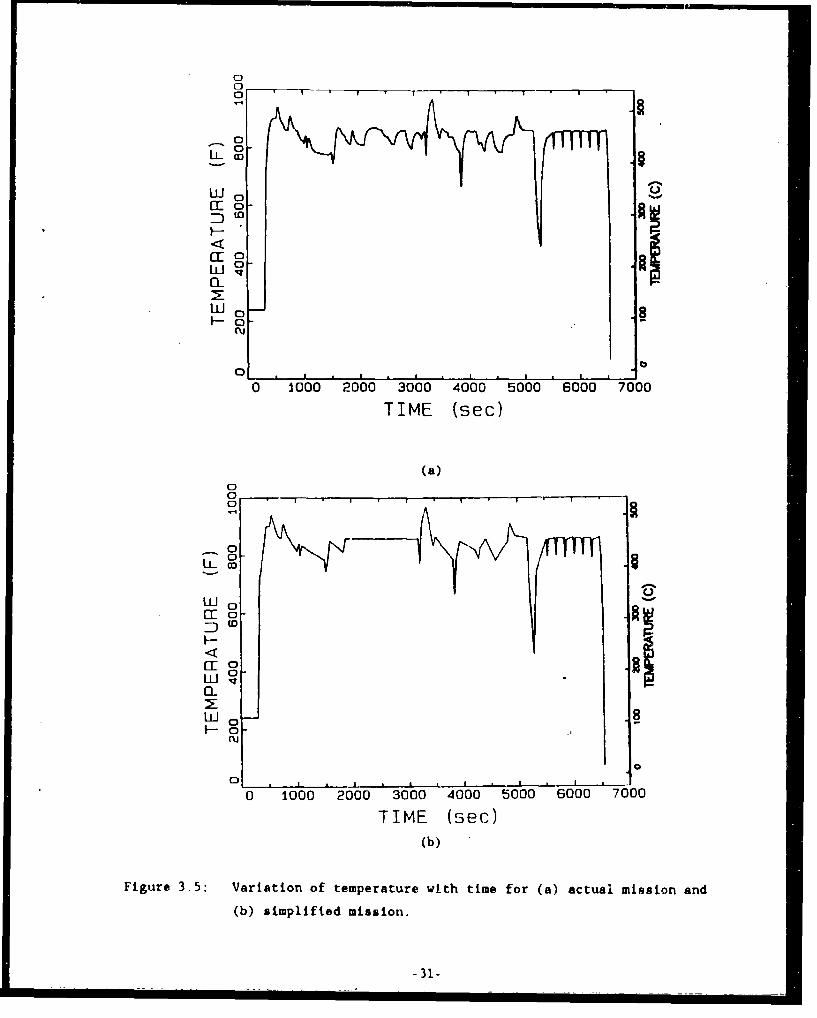
0
0
w40S-
g
o 1000 2000 3000 00 oo 5000'6000 7000TIME (sec)
(a)0
CE 0e
[:0
LLJ 00
00
0 1000 2000 3000 4000 5000 6000 7000
TIME (sec)
(b)
Figure 3.5: Variation of temperature with time for (a) actual mission and
(b) simplified mission.
-31--

variation in load technique used in the mission simplification program. The
mission points corresponding to local load maximums or minimums were also
identified. This program permits analysis of the simplified mission in three
ways:
1. Segment
2. Peak-Hold-Peak
3. Peak-to-Peak (excluding hold times)
The first technique analyzes each segLent in the simplified missions and
resulted in no additional simplification. The second technique simplifies the
mission by considering consecutive loading segments as a single loading ramp.
A similar assumption was made for unloading segments. The third technique
eliminated hold times. Each of these techniques was used to determine the
range of loading parameters associated witL, these =issiona.
The following parameters were identified or calculated for the
resimplified missions:
1. Loading mode (increasing load, decreasing load, or hold time)
2. Stress ratio (R)
3. Duration of segment
4. Average temperature of segment
5. Temperature change during segment
6. Overpeak ratio
7. Utiderpeak ratio
The overpeak ratio compares the maximum of an increasing load or hold time
segment with the preceeding local maximum stress (load reversal). The
underpeaks were calculated using the previous local minimum streba.
The experimental portion of this investigation measured the variation in
crack growth rates with cycle type (frequency, hold time, etc.). The primary
emphasis of this program was on modeling of time-dependent crack growth so it
is crucial to perform tests over the temperature range where variations in
-32-

crack growth rate can be detected. The experimental data reported in Section
5 showed that it was difficult to measure significant changes in crack growth
rates with cycle type at temperatures lower than 538"C (10000F).
Figure 3.6 shows the variation in stress ratio with temperature. In
this and subsequent figures in this section, the different symbols (x and
triangle) represent data from the two analyzed locations. As noted
previously, the R values in these missions are very high. Based on these
results and the lower bound temperature of 538"C (1000'F) the temperatures
selected for the crack growth tests were 538. 593, and 649'C (1000, 1100, and
1200*F). The selected values of R were 0, 0.5, 0.8, and 1.0. The R-value of
unity corresponds to static load testing conditions. The filled circles
connected by solid lines indicate the test conditions selected for
experimental evaluation. The same symbol notation is used in all subsequent
figures in this section. The stress ratiob shown in Figure 3.6 are based on
elastic finite element analyses. Notched configurations are the most highly
stressed conditions and frequently require elastic-plastic annlysis.
Localized plastic deformation results in lower values of maximum and minimum
scresses and hence lower values of R.
The results in Figure 3.6 include hold times and individual segments.
The data of the eighteen missions were also edited to eliminate hold time data
(R greater than 0.95) and simplified using the peak-to-peak simplification
technique. The variation of R with temperature for those editing modes are
shown in Figure 3.7. These data suggest that the selected experimental
cenditions bracket a signiftcta rati of duty !ycles.
In order to select the cycle frequencies to be evaluated, tht missions
were evaluated using both the peak-to-peak and segment editing mode. The
first evaluation used the peak-to-peak editing mode. Figure 3.8 shows the
variation of ramp time with temperature and R. The data in Figur. 3.8a shows
that the ramp times very from 1 to approximately 550 seconds. Besed on this
information the ramp times selected for experimental evaluation were 1.5, 15,
and 150 seconds which corresponds to cycle periods of 3, 30 and 300 seconds.
Figure 3.8b shows that the selected stress ratios are appropriate for the
-33-

TEMPERATURE (C)0 0 100 200 300 400 500 800 700
X
'-0'0x x £- AA#* xxx
0 Ia x h4"LAx X XXX x x
X x
X Xx
U-o i A A A -x
XXX
ED " x X =
IT x x 4
IT' xd xX xU) o, xo
0
0 00 400 600 600 10 w 120 1400
TEMPERATURE (F)
Figure 3.6: Variation of stress ratio with temperature for eighteen
missions.
-34-
TEMPERATURE (C)o 0 100 200 300 400 50 Bo 70
RAMPS
CD x x 4 O
X x x
x C XXxXXX x x x0 x x
ED vexx x
0 x ~ X hcx X&
X'%&AX &AAl
x ~ ~ ' )SCXwx Cx
o0 A A A A
cu xx 'C
o **
0
0 200 400 600 800 10-00 12 0O 1400
TEMPERATURE (F)
Figure 3.7: Variation of stress ratio of ramp segments with temperature.
-35-
0TEMPERATURE (C)0 100 200 300 400 SW Wo 700
C.) x I. AX A
U)1t0 xvF 79r-
., x x x WAxt x
<31 xx it x l x &A !- N A N xx
N A A A A NN M . .f
NUA~NI A A~ * *AA
0x
10 L' % .
0 200 400 600 .. . 1-000 1200 1400
TEMPERATURE (F)-
(a)
A A A x
G x Wl A Nft MCx0 W
N N A X j~i. .4m X N
o N
0 xx x a i x
x x X* xx X x
O * *i N :: N3 N
CU I NI iI
x N
0X
0
X 20> d- 2 3
10 10 to 10
RAMP TIME (sec)
(b)
Figure 3.8: Varatation of (a) ramp time with temperature and (b) stress
ratio with ramp time for individual segments of eighteen
missions.
-36-

slower frequencies especially when considering the potential decrease in R
with elastic-plastic analysis.
Figure 3.9 shows similar data to Figure 3.8 buL fv ,ily the increasing
segment mode. Figure 3.9b shows two distinct populations of data - (1)
variable R for ramp times less than 5 seconds and (2) ramp times of up to 400
seconds at high R ratios. The first case corresponds to true loading and
unloading while a large portion of the second case largely represents
conditions approaching hold times. The selected conditions at stress ratios
of zero and 0.5 for ramp times of 15 and 150 seconds are not important to the
mission but are important for the development of time dependent crack growth
models.
Figure 3.10 shows the variation of hold time length with temperature for
these 18 missions. The box shown in this figure en'Jses the region
investigated in this program. The testing conditions include hold times of 0
(continuously cycled), 4, 30, and 300 seconds. Figure 3.10 shows that there
are hold tiwes ini excess of 300 seconds but due to test time restrictions and
modeling development requirements this seems adequate. Figure 3.11 shows an
expanded version of Figure 3.10 for temperatures in excess of 510C (950*F)
and hold times longer than 10 seconds. This shows that these testing
conditions bracket a significant range of data. Figure 3.11 also shows that
only 5 hold times are at temperatures in excess of 593"C (1100"F). If engine
temperatures increase, which is typical for improved versions of a given
engine, the range of temperatures evaluated will still encompass a large
Amount Gf the hcld ttme population.
The underpeaks calculated for hold times is based on the previous local
minimui so that the underpeak ratio can be considered to be the stress ratio
associated with a hold time. Figure 3.12 shows a plot of underpeak ratio with
temperature for hold times in excess of 10 seconds at temperatures above 5106C
(9500F). Iii this plot underpeaks in excess of unity indicate that the hold
time was precscded by an overpeak. Overpeaks will be discussed later in this
section. The ('ata in Figure 3.12 shows a large population of underpeaks ratio
between 0.8 and 1.0 as well as in the vicinity of 0.5. Underpeak ratios near
-37

AEMPMThRE (C)30 0 100 W no 400 goo 600 70
INCREASING LOAD SEGMENT
N
x
In- 10 Ixa4& NA
x N
x x X.x~ Ux
x" x r
x ~ x X; x'-:l, - X - W 6I xb
-I:) Nk N . A. .N20 4 N0
:ax
fD x = .- A-
Nx N
N x,,N t A& a
10
0 200 400 60 800 1000 1200 1400
TEMPERATURE (F)
(a)00 1TEMPERATUlRE (C)
0 0 W 3W 400 a0m am0 700
INCREAJTNG NLOAD 1S UIWUI
0 x NX N
F 3 . #ti p L n eCisNiNnsN
NN*N
0 £
0
0 0 t00 400 600 360 0 100 1T2b 0 1400TEMPERATURE (F)
(b)Figure 3.9:- Variation of (a) ramp time with temperature and (b) stress ratio
with ramp time for increasing load segments of eighteen
missions.
-38-

0 TEMPERATURE (C)C0 100 200 300 400 500 am0 700
(D0
0,
0() x A
wo
Nx
0 x AC)-0X&
0 x x XA
x 4AAx XA A x A&
ANA
x xxX xx A -I
0I P A A*%O;ft&A0 200 400 600 800 1000 1200 1400
TEMPERATURE (F)
Figure 3.10: Variation of hold time with temperature for eighteen missions.
-39-
3 TEMPERATURE (C)600 8W0 70010TT
AA
CDAAT- AA Aa
A AL
LU 2 A A AA x
10 1 _ I,,_900 1000 1100 1200 1300
TEMPERATURE (F)
Figure 3.11: Variation of hold times in excess of 10 seconds and 510'C with
temperature.
-40-
E I

TEMPERATURE (C)
01
~A
A 0AAC.) A
r- IF
A
L 0, A kA Az.
1000 0 0 1100 1200 1300
TEMPERATURE (F)
Figure 3.12: Variation of uneerpeak ratio (stress ratio) of hold times with
temperature greater than 510C with temperature.
-41-
unity were assessed with the static load tests. The remaining test conditions
seem to bracket the mission points.
Figure 3.13 shows the overpeak ratios foL Lite dm hold time population
showr in Figure 3.12. There seem to be two populations of overpeaks - one
between 1.0 and 1.2 and another at approximately 2.0. Weerasooriya and
Nicholas( 50 ) have shown that overpeak ratios of 1.25 totally eliminate the
degrading influence of hold times in Alloy 718 at 649"C (1200'F). Overpeak
ratios of 1.1, 1.2, and 1.5 were investigated to cover the conditions shown in
Figitro 3 13.
The 18 simplified missions were edited using the peak-to-peak mode to
consider to range of overpeaks for loading and unloading segments. These
missions were further edited to eliminate ramps with stress ratios in excess
of 0.9 to avoid cycles which approximate hold LIes. Figure 3.14 shows the
overpeak ratios as a function of temperature and stress ratio. As for the
case of hold times, the strategy of evaluating overpeak ratios of 1.1 to 1.5
seems to be a reasonable approach.
The conditions selected for the experimental test program are listed in
Table 3.1. These conditions encompass a large variety of mission spectrum,
include a range of conditions were time-dependent crack growth occurs, and
provides the wide range of experimental variables necessary for the
development of an advanced time dependent crack growth model.
-42-
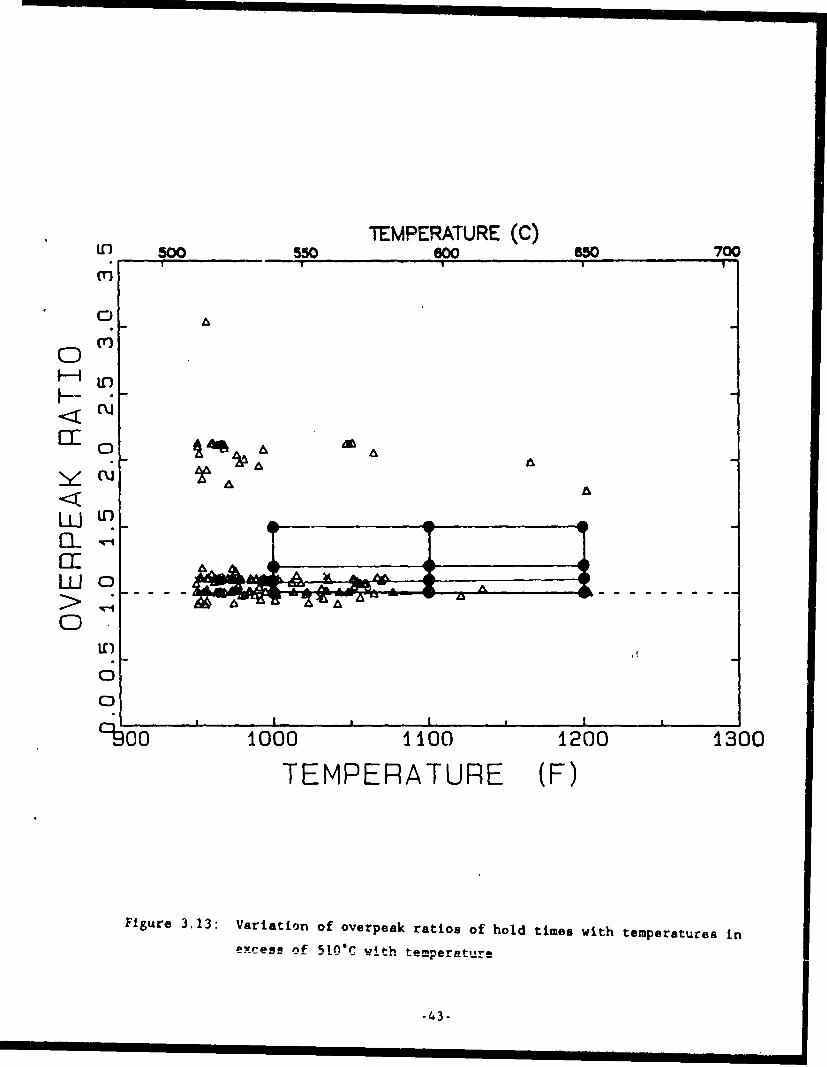
TEMPERATURE (C)If) 5W W WO 700
00 An
< C\J
CE 0
.<"
1A_ ---,- --- ---
Wo
o aI", ism ,
o00 1000 1100 1200 1300
TEMPERATURE (F)
Figure 3.13: Variation of overpeak ratios of hold times with temperatures in
excess of 510"C with temperature
-43-

TE.VTERATURE (C)
R < 0.9
0
LLIL
Li
Liri 0.9 .
0
0 - " - ..." ".- a -
0 200 400 600 800 1000 1200 1400
IEMPERATURE (F)
R <0.9
rto Ko odr adulaln ojans(<.)
cc
0
(b)
Figure 3.14: Variation in overpeak ratio with (a) temperature anid (b) stress
rAtio for loading and unloading segments (R<0.9).
-44-

Table 3.1: Conditions for Task II Testing
Temperature 538, 593, 649"C
(1000, 1100, 1200"F)
Stress Ratio (R) 0, 0.5, 0.8, and 1.0
Ramp Cycle Period 3, 30, and 300 seconds
Hold Times 0, 4, 30, and 300 seconds
Overpeak Ratio 1.1, 1.2, and 1.5
-45-

4.0 MATERIALS AND EXPERIMENTAL TECHNIOUES
This section of the report describes the materials evaluated and the
experimental techniques used to determine the crack growth properties in this
investigation. Sources and examples of error in the crack growth experiments
are also presented.
4.1 MATRILS
Two materials were selected for this investigation: powder metallurgy
Rene'95 processed by extrusion plus isothermal forging (E+IF), and cast plus
wrought (C+W) Alloy 718. The E+IF processing technique for Rene'95 was
developed to attain a fine grain size for high tensile strength and good LCF
life (5 2 ). E+IF Rene'95 was selected as the primary material for this study
because it is widely used in military high pressure turbine disk applications.
It has also been the subject of recent fracture mechanics modeling and
processing-microstructure-property investigations (43,53).
The second material, C+W Alloy 718, is currently used in a variety of
aircraft engine applications including compressor, low pressure turbine, and
high pressure turbine disks. The fatigue crack growth behavior of this alloy
has probably been more extensively studied than any other nickel-base
superalloy(18 ,2 4 ,2 8 ,2 9 ,5 0 ,54 -57 ).
4.1.1 Rene'95
All Rene'95 specimens for this investigation were removed from the rim
region of a single FlOl/FllO high pressure turbine disk forging. The E+IF
Rene'95 disk was processed using argon atomized powder from Special Metals
heat BN84056. As shown in Table 4.1, the composition of this heat meets all
specification requirements. Powder from the -150 mesh yield was consolidated
into extruded billet by Cameron Iron Works. Ladish Company prepared the
billet and performed the isothermal forging. The forged disk was heat treated
at 1107"C (20250F) for one hour, oil quenched, and aged at 760*C (1400"F) for
eight hours. Table 4.2 lists the tensile, creep and stress rupture properties
-47.

Table 4.1: Composition Of Rene'95 Disk
(Weight Percent)
Heat
Element Specification Analysis
C 0.04-0.09 0.06
Mn 0.15 Max 0.02
Si 0.20 Max 0.07
S 0.015 Max 0.004
P 0.015 Max >0.01
Cr 12.0-14.0 13.38
Fe 0.50 Max 0.16
Co 7.00-9.00 8.51
Mo 3.30-3.70 3.47
Nb 3.30-3.70 3.68
Ti 2.30-2.70 2.49
Al 3.30-3.70 3.52
B 0.006-0.015 0.007
W 3.30-3.70 3.45
Zr 0.03-0.07 0.04
0 0.010 Max >0.0082
N 0.005 Max >0.0041
H 0.001 Max >0.0004
V 0.10
Hf 0.01
Cu 0.024
Ta 0.05
Ni Balance
-48.

Table 4.2: Test Ring Properties Of Rene'95 Disk
Tensile Properties
Room 649"CTemperature (1200-F)
0.2% Offset Yield
Strength (MPa) 1261 1109
Ultimate Tensile
Strength (MPa) 1702 1426
Tensile Elongation (%) 20.0 9.0
Reduction in Area (%) 24.0 12.0
Rupture Properties
649"C (12000F)965 MPa (140 ksi)
Hours to Failure 173.6
Rupture Elongation (%) 6.0
-49-

obtained from the test ring location. These properties are typical for this
component.
Optical metallography and transmission electron microscopy (TEM) replica
techniques were used to study the microstructure of a typical test specimen
from the E+IF Rene'95 disk rim. The optical micrographs of Figure 4.1 show
that the grain structure is very uniform with a grain size of about 5 IA.
Although large, primary y' precipitates are present at grain boundaries as
shown in the high magnification optical micrograph, Figure 4.1b, the
precipitate distribution is more clearly evident in the TEH replica micrograph
of Figure 4.1c. Three size ranges of the y' precipitate are present. The
large grain boundary primary y' results from precipitation of this phase
during the extrusion, forging, and heat treatment procedures. These y'
particles are typically 2-3 Am in size. Particles of an intermediate size
(0.2 pm) are located within the grains and form during cooling after the
1107C exposure. The third size range of Y' consists of very small
precipitates, several hundred angstroms in size, which form on aging. These
fine precipitates are barely discernible in the TEN micrograph and are
distributed uniformily among the intermediate y'. This microstructure is
typical of E+IF Rene'95.
4.1.2 Alloy 718
The Alloy 718 used in this investigation was obtained from comercially
available hot-rolled plate. This material is the same as that used in a
NASA-sponsored investigation of elastic-plastic fatigue crack growth(5 8 ). The
plate had a nominal thickness of 22.2 mm (0.875 in.) and was procurred in 2
pieces, each measuring 381 mm (15 in.) by 406 mm (16 in.). Both plates were
produced by Cabot Corporation from heat 2180-1-9836. The ladle composition
and specification for Alloy 718 are compared in Table 4.3. The composition
falls within the specified limits.
The Alloy 718 plate material was procured in the mill annealed condition.
Heat treatment was subsequently performed by the GE Engineering Material
Technology Laboratory (EMTL) using a standard solution plus duplex age
-50-

M, ' I . ~ ' a
.. ~e -
A'
~ r If
A..
VAA
100 un e~tt ~ '( f.J!T 20 urn(a) (b)
2 urn(c)
Figure 4.1: Microstructure of Rene'95 forging as shown with (a) low
magnification optical mnicrograph, (b) high magnification optical
adicrog-ap&, aw*c (c,) TEll LepiCa micrograph.
-51.
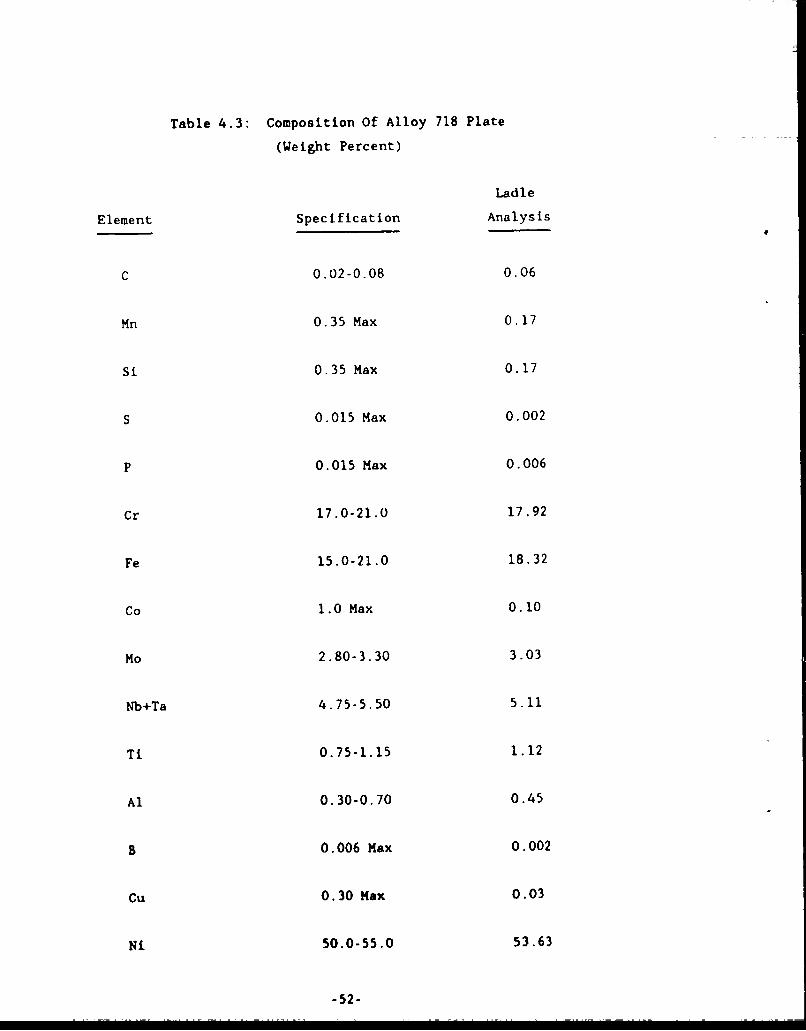
Table 4.3: Composition Of Alloy 718 Plate
(Weight Percent)
Ladle
Element Specification Analysis
C 0.02-0.08 0.06
Mn 0.35 Max 0.17
Si 0.35 Max 0.17
S 0.015 Max 0.002
P 0.015 Max 0.006
Cr 17.0-21.0 17.92
Fe 15.0-21.0 18.32
Co 1.0 Max 0.10
Mo 2.80-3.30 3.03
Nb+Ta 4.75-5.50 5.11
Ti 0.75-1.15 1.12
Al 0.30-0.70 0.45
B 0.006 Max 0.002
Cu 0.30 Max 0.03
Ni 50.0-55.0 53.63
-52-

treatment for Alloy 718. After solution treatment at 968"C (1775"F) for one
hour and cooling to room temperature, the plates were aged at 718"C (1325"F)
for eight hours, cooled at 56*C/hr. (100"F/hr.) to 621"C (1150F), and aged at
this temperature for an additional eight hours. Tensile, creep, and cyclic
properties for the Alloy 718 plate were determined over the temperature range
from room temperature to 649"C (1200"F). The results were typical of Alloy
718 and have been reported elsewhere(58 )
Optical metallography was used to characterize the grain structure of a
typical test specimen from the Alloy 718 plate after full heat treatment.
Figure 4.2 shows low and high magnification optical micrographs which
illustrate the microstructure of the Alloy 718 plate in the plane containing
the rolling and plate thickness directions. The rolling direction is
displayed horizontally in these micrographs. The microstructure observed in
the plane containing the plate width and thickness direction is shown in
Figure 4.3 where the plate width is shown horizontally. These micrographs
exhibit a duplex grain structure where large, elongated, unrecrystallized
grains are surrounded by fine recrystallized grains. These fine grains are
the predominant feature and measure about 20 Jim in size. The unrecrystallized
grains are elongated parallel to the rolling direction and measure as large as
50 by 200 Jim in size. Stringers of fine carbide and nitride particles are
also evident in Figure 4.3b. At high magnification, one of the precipitate
phases present in Alloy 718 can be seen at the grain boundaries in the form of
small, discontinuous, acicular particles. This is the orthorhombic Ni 3Cb
phase which precipitates during rolling and solution treatment procedures.
Thc ctrvngthening phase i.- Alloy 718, ordered D02 2 Ni 3(Cb,Ti,Al) y", is not
visible in the optical microgiaphs and can only be studied using TEM thin foil
techniques. For fully heat treated Alloy 718 materials, these precipitates
are disc-shaped with a diameter of several hundred Angstroms. Alloy 718 also
contains a small amount of spherical-shaped Y' precipitates, with a similar
diameter(5 5 ,5 9).
-53-

20 U
.. - . - -
200 um(a)
- /
-' I ", I
Figure 4.2: Optical micrographs of Alloy 718 plate at (a) low and (b) high
magnifications. The rolling direction is displayed horizontally
and the plate thickness direction is shown vertically.
-54-
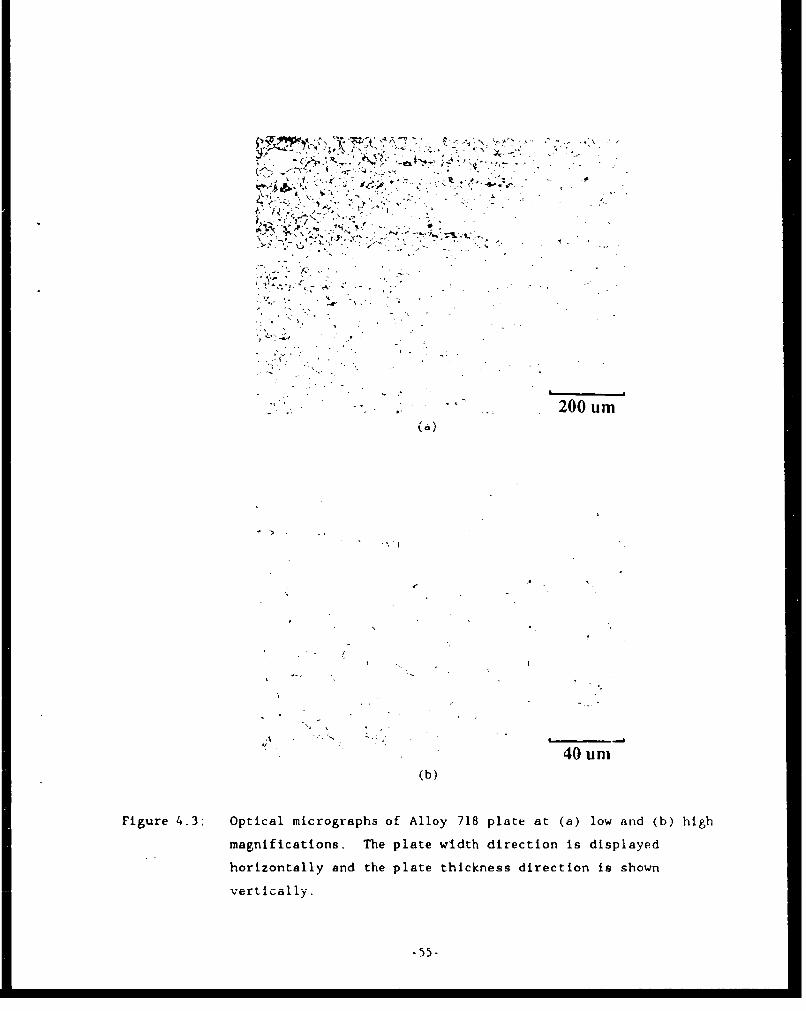
200 umn
40 urn(b)
Figure 4.3: Optical micrographs of Alloy 718 plate at (a) low and (b) high
magnifications. The plate width direction is displayed
horizontally and the plate thickness direction is shown
vertically.
-55-
From the preceeding description of microstructure, it is evident that
although both Rene'95 and Alloy 718 materials can be described as nickel-base
superalloys, they hbve different strengthening precipitates and
microstructu,es.
4.1 SINGLE EDGE NOTCH SPECIMEN
A buttonhead single edge notch (SEN) specimen was used in the crack
giowth experiments. Figure 4.4 shows the drawing of this specimen. The gage
section of this specimen has a thickness of 2.54 mm (0.1 inch) and a width of
10.2 mm (0.4 inch). Pin-loaded SEN specimens with this gage section geometry
have previously been used by GEAE to determine the crack growth properties of
a wide ".:_riety of superalloys over a range from room temperature to 980C
(]800"F)(4 2 ,4 3 .55 .6 0 ). The modification of the specimen from pin to
buttonhead loading was originally made to accommodate cycli- loading with
compressive loads( 56 ).
The buttonhead geometry was selected for this investigation because the
usable t tent of crack length for the buttonhead geometry is greater than that
for the pin-loaded specimen. Elevated temperature crack growth of a nickel
base superalloy measured in a pin-loaded SEN specimen for crack length to
specimen width ratio (a/W) greater than 0.5 did not agree with other data for
th3 same aterial (4 2 ). The K-solution for this specimen is valid to the
Jarger crack lengths, but assumes free rotation between the loading pin and
the tpecimen. The discrepancy in crack growth rates described above was
prohahly caused ty oyidatioi, uf Lite loading p4lis and specimen which prevented
the free rotation at this location. The analysis of the buttonhead geometry
assumes no such rotation so the usable extent of crack length is much larger.
The value o. K for the buttonhead SEN specimen was calculated using the
solution developed by Harris( 6 1) for restral.ned bending in a single edge notch
specimen.
K - 0 ./a 15 / J(20 - 13 (&/W) 7 (a/W)2]) (5.1)
-56-

-127-
2.5

The validity of this relationship was verified by Malik and Gilbert(62), who
calculated K-values using both influence functions and J-integrals from the
elastic finite element analysis of the buttonhoad SEN specimen(5 8 ). They
found that their results agreed within several percent to those calculated
using the equation developed by Harris.
4.2 TEST SPECIMEN MACHINING AND ORIENTATION
The Rene'95 test specimens were removed from the rim portion of the high
pressure turbine disk. This region of the disk was selected for the mission
onalysis (Section 3.0) because it experiences high operating temperatures
during service. Removal of specimens from this region assured that the
microstructure represented the appropriate area of interest in the disk. In
order to increase material availability from this location, the Rene'95 crack
gLuw.h &pccimetit were fabricated by inertia welding. The S cm (2 inch) l:,,g
gage blanks had a radial orientation and were removed with from the outer 10
cm (4 inch) of the disk. The gage sections were inertia welded to Alloy 718
buttonhead blanks. The inertia welded assembly was then machined into the
buttonhead SEN geometry. The inertia weld blanks were marked so that SEN gage
sections would be be machined to have crack growth in the the circumferential
direction of the disk.
The Alloy 718 specimens were not fabricated from inertia welded
assemblies. The specimens were oriented so that the loading axis was parallel
to the longitudinal direction in the plate and the cracks grew in the
tLftnsvers direction.
Prior to testing, a 0.25 mm (0.01 inch) deep electric discharge machined
(EDM) crack starter notch was placed in each specimen. Each notch was
centered in the gage length and traversed the 2.54 mm (0.1 inch) thickness of
the gage length.
-58-

4.3 POTENTIAL DROP TEST METHOD
Crack lengths were monitored using a direct current electric potential
dLop technique(6 3) adapted to the SEN geometry by Wilcox and i;wIy(64 ). The
test techniqu 's shown schematically in Figure 4.5. Direct current was
passed through the specimen. Potential leads located approximately 0.4 m
(0.016 inch) above and below the EDH notch/crack were used to obtain the
potential values using either an on-off(6 3) or reversing potential(6 5)
technique. The microcomputer monitored the potential and converted it to
potential using the SEN potential solution developed by Johnson(6 6). The
microcomputer also controlled the test permitting either load- or K control
testing. Potential data is taken on almost every cycle. After a
predetermined number a cycles known as the block size. the potential data was
averaged and stored on a floppy disk for post-test analysis. For K-controlled
Le"Lu, the loads required to obtain the desired X-valuc was .alculated at the
end of each block of cycles using the Harris solution(6 1) and the loads are
adjusted.
Henry and coworkers(6 7) have improved this test method so that the
microcomputer can also control the cycle period and hold time. This
modification permitted preprogramming of the several test segments so that the
operator does not have to manually adjust the test machine function generator
when the cycle frequency or hold time changed for a given test specimen.
4.4 TEST DESCRIPTION AND DATA ANALYSIS
The crack growth tests in this investigation fall into two
classifications -- threshold tests and constant AK tests. The latter type of
est was performed to evaluate the influence of R-ratio, hold time, cycle
frequency, and overpeak cycling on Region II (Paris law) crack growth rates.
Each classification of test will be described separately.
-59-

POWERSWTHN
SUPPLYREA
VOLTNETER
Figure 4.5: Schematic diagram of SENI specimen DC potential drop test
apparatus.
-60 -

4.4.1 Threshold Tests
The threshold tests were performed at constant values of temperature,
R-ratio, and cycle type (frequency oL hiuld Lime). In these tests, the
specimen was precracked and then cycled in a decreasing K mode until the crack
growth rates approaced 1 x 10⁻⁷ mm/cycle (4 x 10 9 inch/cycle). In some
tests, the specimen was then cracked in an increasing K mode (constant load or
AK/Aa) to determine Region II crack growth rates. Figure 4.6 shows an example
of the K-crack length history for this type of test. The K-shed routine was
performed by controlling a shed rate constant C.
C - 1/K (dK/da) (4.2)
The value of C used in this investigation was -1.18/mm (-30/inch). This value
was selected based on the work of Hprry(67) and shed rate experiments
described later in this section. The increasing K portion of the tests was
performed so that the value of K increased linearly with crack length (dK/da -
constant). In most tests, the crack was grown from a Kmax value of several
HPalm above the measured threshold value to a Kmax value of approximately 55
MPa/m over a distance of approximately 1.3 mm (0.05 inch).
After each test, the specimen was broken at room temperature and the
crack lengths were measured on the fracture surface. Many of the tests in
this investigation exhibited rather severe tunneling where the crack length at
the center of th,. specimen was significantly longer than at the surface. This
has been reportrd previuusly dvring elevated temperature hold time( 34 ) and
static(33) crack growth tests on nickel base superalloys. The crack length
was measured at both free surfaces and three equally spaced positions across
the specimen width. The average of the internal three positions was used as
the crack length in the potential and K calculations.(6 8 )
The data obtained during the K-shed and increasing K portions of the
threshold tests were analyzed separately. The load and potential drop data
was reaveraged so that 50 to 100 data points were obtained from each part of
the test. The measured crack lengths, potential data, and load data were then
-61-

0
0
If)
EL, /-0 /O"o
~/
a precrack /E
o X increasing K
K shed/0
0 2 I I I I
0.0 0.5 1.0 1.5 2.0 2.5crack length (mm)
Figure 4.6: Typical K-history for a threshold crack growth test.
-62-

analyzed using the appropriate potential and K solutions. The measured crack
lengths were used to correct the crack lengths as predicted using the
potential solution(6 8 ). The crack growth rates were calculated using the
seven poiriL sliding polynomial technique. An expanded description of thl.
data analysis procedure was reported by Krueger(6 9 ).
The ASTM standard test method(6 8) for determining near-threshold
crack growth rates recommends that the value of the shed rate constant C
should not be less than -0.078/mm (-2/inch). The use of higher shed rates
(more negative values of C) is permitted if it can be shown that the higher
shed rate does not adversely affect the ability to measure near-threshold
crack growth rates. The influence of shed rate on crack growth rates results
primarily from overpeak retardation. If K is shed too rapidly, some overpeak
retardation may occur resulting in artificially high values of threshold.
Henry(6 7) 4.eiunstrated for nickel-base superalloys that the value of C must be
less than -1.57/mm (-40/inch) to influence the threshold values measuied fo:
0.33 Hz cycling (20 cpm). Zawada and Nicholas(7 0 ) have also demonstrated that
the value of C can be reduced substantially from that recommended by ASTM for
nickel-base superalloys.
The influence of overpeak retardation is much greater for crack
growth during hold times than for continuous cycling. This was previously
demonstrated by Weerasooriya, et.al.(5 0 ) in Alloy 718 and was also documented
in this program as will be described in Section 5. This raises the issue of
whether the shed rate might have to be lower for tests where hold times or low
test frequencls are being evaluated. This factor was evaluated by compa-ing
near-threshold crack growth rates for specimens shed with C values of -0.39
and -1.18/mm (-10 and -30/inch). Two Rene'95 threshold tests were performed
at 649*C (1200"F) at an R-ratio of zero using a cycle with a 1.5 second
loadine ramp, a 300 second hold time, and a 1.5 second unloading ramp. This
conditioi wan selected because it is a condition which exhibits a significant
retardation effect in combination with hold times and because this loading
cycle results in a high value of threshold. The comparison of the tests with
the two values of C is shown in Figure 4.7. This range of shed rates does not
appear to influence the ability to measure near-threshold crack growth rates.
-63-
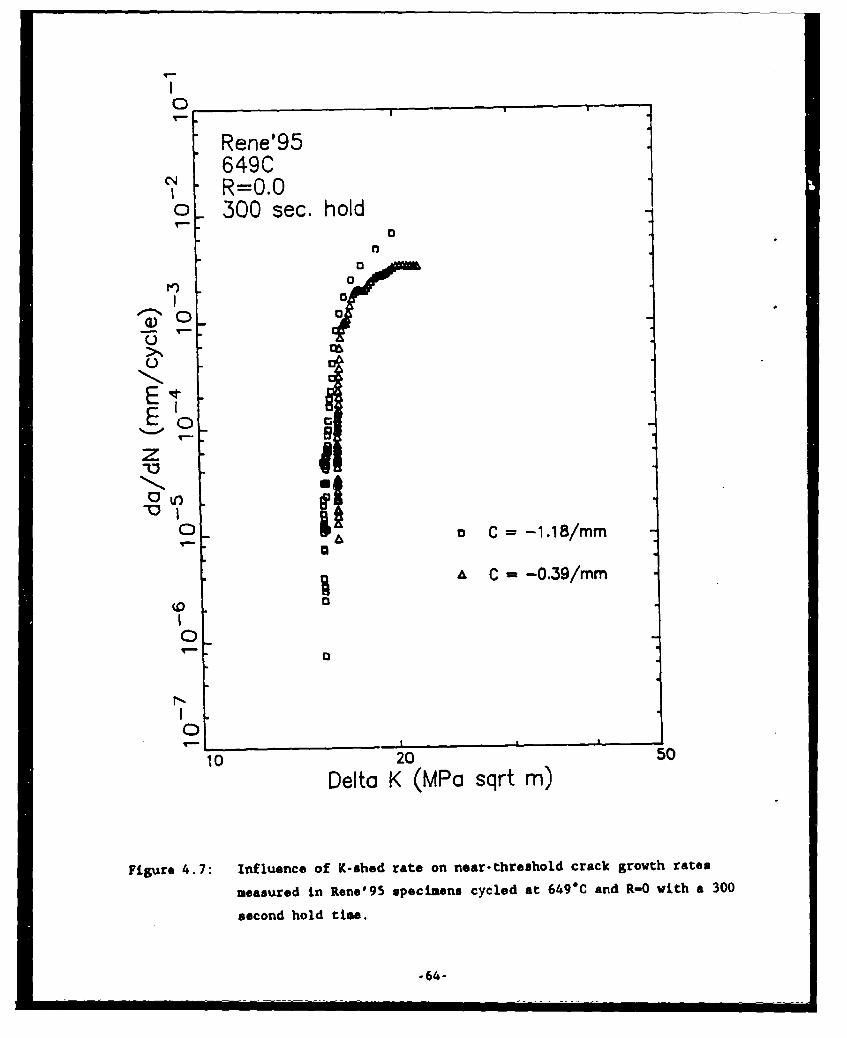
0
Rene'95
649Cc, R= .0- 300 sec. hold
z
S0"10
Q 0 : 10.
UD
0
0
10 20 50
Delta K (MPa sqrt m)
Figure 4.7: Influence of K-shed rate on near-threshold crack growth rates
measured in Rene'95 specimens cycled at 649"C and R-0 with a 300
second hold time.
-64-

As a result, all other threshold tests in this investigation were performed
with a shed rate (C) of -1.18/mm (-30/inch).
4.4.2 Constant AK Tests
The other type of test contained several segments of crack
growth under constant AK conditions. Within each of the constant AK segments,
several combinations of frequency or hold times were evaluated. Figure 4.8
shows a schematic history of a typical constant AK test performed during this
investigation. The R-ratio and test temperature were fixed for a given test.
The nine segments shown in Figure 4.8 comprise a three by three matrix of Kmax
and test frequency. One of the objectives of this type of test was to obtain
improved statistical crack growth data relative to that obtained in a more
conventional test where K changes as the crack grows. This type of test also
improves the efficiency of testing because the influence of aeveral variables
can be evaluated in a single test specimen.
The cyclic load and potential data obtained during each segment
(constant Kmax and frequency or hold time) were averaged to a total of
approximately 25 data points. The data from the individual segments were
combined, when necessary, into data files which corresponded to test segments
where the initial and final crack lengths were measured on the fractured
specimen. These data were then analyzed using the same software used to
analyze the near-threshold tests. If necessary, these files were then
separated so that individual files existed for each constant K and cycle
frequen.y or hold time.
Data from each constant Kmax and cycle frequency or hold time
segment were analyzed statistically. The crack length (a) and cycle (N) data
were analyzed using linear least squares regression analysis. The cyclic
crack growth rate (da/dN) was determined by calculating the slope of the fit
between a and N. The standard deviation of this slope was calculated using
standard statistical analysis. The error in K was calculated using the
standard deviation in K.
-65-

3 I30 I300
3 1 -30 I300
numbers indicatecycle periodin seconds
3 13053001 1
0 1 2 3 4 5crock length (mm)
Figure 4.8: Typical variation of K~x and frequency in a AK-Controlled
frequency test
-66-

A given segment in these constant AK tests was in reality a combination
of many load controlled test segments. Within a block size the cycles are
load controlled. When crack growth occurs during a hold time, the crack is
growing under load control and not constant AK control. The loads are
adjusted between each block of daca. This results in no difficulty for
relatively low crack growth rates, but for high crack growth rates there can
be a significant load drop becween cycle blocks, possibly resulting in
retardation. The possibility of this behavior was investigated in Rene'95 by
measuring the crack growth rates under constant AK control, increasing AK
control, and constant load control conditions. The condition selected for
this evaluation was 649"C (1200*F) cycling with an R-ratio of zero and a 300
second hold time. The ramps on either side of the hold time lasted 1.5
seconds each. The results of these tests are shown in Figure 4.9. The
increasing AK and constant load data agree, however they are almost an order
of magnitude faster than the CoLmatant AK test results. This suggests that a
significant amount of retardation occurred at these very rapid crack growth
rates. This behavior was not discovered until very late in the test program
after the constant AK tests had been completed. The impact of this behavior
for the constant AK tests will be discussed and modeled in Section 7.
4.4 VACUUM TEST METHOD
The vacuum crack growth tests were performed in a vacuum system at GEAE's
Mechanical Testing Laboratory. The vacuum system is a double walled stainless
steel vacuum chamber. The system was initially evacuated using a mechanical
roughing pmr. Tht high vacuum va arrsined using a combination of a cryopump
and an ion pump. The pressure within the vacuum chamber was monitored with an
ion gage. A mass spectrometer probe is also located within the system to
identify the species present in the chamber. The probes for both of these
devices are located within the main chamber, approximately 15 cm from the
specimen, and thus should accurately monitor the testing environment. When a
vacuum of approximately 4x10"8 mm was reached, the inner walls of the chamber
and the specimen were heated to approximately 200C (400"F). This hot
outgassing procedure was continued until the pressure in the chamber was
approximately 2xlO "8 mm. The specimen was then induction heated to the
-67-

00
Rene'95
649CR=0.O300 sec. hold
XIx 0
)0 XA
'J
N xE
z
0
X load control
0 increasing K control
A constant K control0
10 20 50Kmax (MPo sqrt m)
Figure 4.9: Influence of test control mode on Region II crack growth rates
measurad in Rene'95 specimens cycled at R-O with a 300 second
hold time.
-68
desired temperature. This initially increased the pressure, but the test was
not started until the pressure again reached 2x10"8 mm. During the test, the
quality of the vacuum improved, usually reaching approximately 5xl0"9mm. The
s-ra..k length was monitored using a DC potential drup byb.em. This system was
identical to the one used in air except for three differences: the specimen
instrumentation contained no materials which outgas, a ceramic insert was
placed in the load train between the specimen and the test machine to
eliminate dual current paths, and the software used to perform the test was
modified to account for the tare loads induced by the pressure difference.
Induction heating generally increases the noise in potential data by
close to an order of magnitude. The higher level of noise associated with
induction heating is on the same level as the differences in potential values
measured during near-threshold crack growth testing. All threshold test
specilwcLs are heated in resistance furnaces to avoid this diffi.ulty. The use
of induction heating in the vacuum system prevented the measurement of
near-threshold crack growth rates in vacuum.
-69-

5.0 EXPERIMENTAL RESULTS
This section of the report describes the experimental results of the
basciiie ciaek gtowth rate tests. All these tests were performed i.
laboratory air using the experimental techniques described in Section 4.3.
The results of the vacuum crack growth tests are reported in Section 6.
This section has two major parts - one for the Rene'95 results and a
second part for those on Alloy 718. Within each of those parts, there are
individual sections on constant AK (Region II), threshold (Regions I and II).
static, and overpeak retardation tests. The results will be displayed and
compared and inferences will be made as to the applicability of a
superposition model. The quantitative application of both interpolative and
superposition crack growth models to these data is presented in Section 7.0.
5.1 RENE'95 CRACK GROWTH RESULTS
Table 5.1 lists the Rene'95 baseline tests performed in this
investigation. There are a wide number of variables (temperature, R-ratio,
hold time, cycle frequency, and test control mode). The results will be
presented in separate sections on constant K, threshold, static, and overpeak
tests in order to facilitate the description of the infltence of eacn
variable.
5.1.1 Fene'95 Constant AK Test Results
The baseline tests can be described as either frequency or hold time
tests, The frequency tests were performed with cycle periods cf 3, 30, or 300
seconds. The loading and unloading ramp times were equal so that the load
increased during the first half of the cycle period and decreased during the
second half. Throughout the text, these tests will be described in terms of
their cycle period. The hold time tests were performed with a 1.5 second
loading ramp, a hold time at maximum load, and a 1.5 second unloading ramp.
The duration of hold times evaluated were 4, 30, and 300 seconds. The loading
and unloading ramps increased the cycle period by 3 seconds over the duration
-71-

Table 5.1: Rene'95 Simple Cycle Test Matrix
Test Temperature Test
Number (OC) R T'pe Variable
AF19 538 0.0 constant AK hold time
AF45 593 0.0 constant AK hold time
AF49 593 0.0 constant AK hold time
AF54 593 0.0 constant AK frequency
AF62 593 0.0 threshold 3 sec. cycle
AF77 593 0.0 threshold 300 sec. hold
AF44 593 0.5 .onstant AK hold time
AF66 593 0.5 constant AK frequency
AF59 593 0.8 constant AK hold time
AF12 593 0.8 constant AK frequency
AF13 593 0.8 threshold 3 sec. cycle
AF46 593 0.8 threshold 300 sec. hold
AF50 593 static threshold
AF70 593 static constant load
AF03 649 0.0 constant AK hold time
AF05 649 0.0 constant AK frequency
AF14 649 0.0 threshold 3 sec. cycle
AF63 649 0.0 threshold 30 sec. hold
AF06 649 0.0 threshold 300 sec. hold
AF53 649 0.0 threshold 300 sec. hold
AFI8 649 0.0 threshold 30 sec. cycle
AF10 649 0.0 threshold 300 sec. cycle
AF15 649 0.5 constant AK hold time
AF51 649 0.5 constant AK frequency
AF09 649 0.5 threshold 3 sec. cycle
4F16 649 0.5 threshold 300 sec. hold
AF23 649 0.5 threshold 300 sec. cycle
AF72 649 0.8 constant AK hold time
AF38 649 0.8 constant AK frequency
AF55 649 0.8 threshold 3 sec. cycle
AF08 649 0.8 threshold 4 sec. hold
AF21 649 0.8 threshold 30 sec. hold
AF30 649 0.8 threshold 300 sec. hold
AF40 649 0.8 threshold 300 sec. hold
AF69 649 0.8 threshold 300 sec. cycle
AF17 649 static threshold
AF60 649 static constant load
AF65 649 static constant lost
-72-

of the hold time. These tests will be referred by the length of the hold
time. The loading and unloading ramps in the 3 second period test were
identical to those in the hold time tests. Because of this flexibility the 3
speond period results will sometimes be LeCurred to as 0 second hold time
data.
Constant AK tests were performed to evaluate the influence of either test
frequency or hold time. The test temperature and R-ratio was held constant
for a given test. Most of the Rene'95 constant AK tests had 9 segments which
evaluated a three by three matrix of AK levels and either frequency or hold
time. The potential drop microcomputer attempted to perform tests at three
levels of maximum K (Kmax), however the exact level of Kmax varied from this
due to inaccuracies in the initial notch depth, and the crack tunneling
behavior discussed previously. The tests were analyzed using post-test crack
length measurements. The resulting values of Kmax were aot always constant
during a given segment. This is illustrated in Figure 5.1a for a 649C
Rene'95 hold time test with an R-ratio of zero. This figure show the
variation of Kmax with crack length. The numbers indicate the hold time in
seconds for that segment. The crack length increment in a given segment was
increased with higher Kmax values to avoid extremely small number of cycles in
a given constant AK segment. In general, the value of Kmax was close to
constant in a given segment, however, there were some cases such as that shown
for the 30 second hold time cycle with a Kmax of approximately 50 KPam where
the value of Kmax increased during the AK-controlled segment. Figure 5.1b
shows the resulting variation in crack length with cycles for this test.
The average and standard deviation of Kmax was determined from the values
of Kmax calculated for a given segment. The average and standard deviation of
the crack growth rate for a given segment was calculated from the slope and
standard deviation of variation of the crack length with cycles. The results
of this test are shown in Figure 5.2 using the typical log-log plot of the
variation of crack growth rate with Kmax. A rectangle was constructed for
each test segment which enclosed the range of plus or minus one standard
deviation in both crack growth rate and Kmax. The other lines on the graph
connect the average values for segments with the same value of hold time. For
-73-

141
U
L O
06
0').10 id
1~1-
og t
-74-
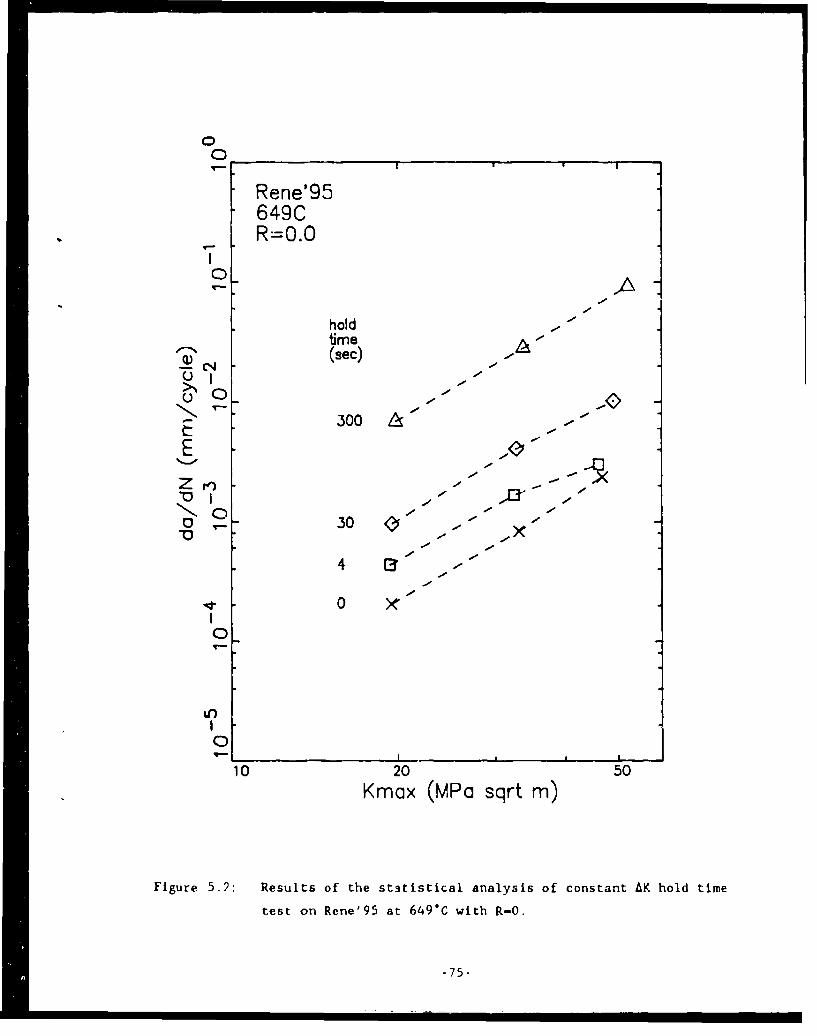
0
Rene'95649CR=O.O
I
holdtime(e) sec)
E -
-Zo 0 - - ..
.0 -
~~N~0 300--
.00-x
4 -
0
0If)
- I
0
10 20 50
Kmax (MPa sqrt m)
Figure 5.2: Results of the statistical analysis of constant AK hold time
test on Rene'95 at 649C with R-O.
-75-

most of the segments of this test, the standard deviations were very small and
the rectangle appears to be a small point. The most noticeable exceptions
were for the 300 second hold time segments at the higher two levels of Kmax.
In these cases, there was a much larger variatiu i& Kmax than in crack growth
rate. The standard deviations displayed in this figure were typical for those
determined in this investigation. The results for the other Rene'95
AK-contolled tests showing the standard deviations are given in Appendix A.
This analysis procedure was been used on all the constant AK tests performed
in this investigation. Due to the low standard deviations, the constant AV
teqr results will be reported in the text of the report using large symbols as
shown in Figure 5.3. The data in this figure includes that shown in Figure
5.2 along with the results from a 3 second cycle period in a constant AK
frequency test.
The results of constant AK hold time testb with a R-ratic vf zero at 538
and 593"C are shown in Figures 5.4a and 5.4b, respectively. Comparison of the
data in Figures 5.3 and 5.4 show the strong effect of temperature on
time-dependent crack growth. At 538"C, a range of hold times from 4 to 300
seconds results in, at worst, a factor of two difference in crack growth
rates. This factor is approximately 4 and 20 for 593 and 649"C, respectively.
There also appears to be a substantially different behavior at 5380C relative
to the higher two temperatures. The results at 593"C (Figure 5.4b) and 649"C
(Figure 5.3) show that increasing hold times accelerate fatigue crack growth
rates. The 538"C results (Figure 5.4a) show this acceleration at low values
of Kmax, but with increasing Kmax, increasing hold times decrease the crack
gruwth rates. The behavior at 53;*C may be relatel to the coinpetitior between
the environmentally-assisted crack growth and the localized blunting of the
crack tip by creep deformation. Evidence of this competition was observed in
other tests and will be discussed more fully in the Section 6.
The data shown in Figures 5.3 and 5.4 are replotted in Figure 5.5 where
the crack grre-th rates are shown as a function of the hold time duration. The
values of Kmax shown in this and subsequent figures are presented in units of
10alm. These figures show both da/dN and hold time on linear axes because
according to the superposition model, the crack growth rate at a given set of
-76-
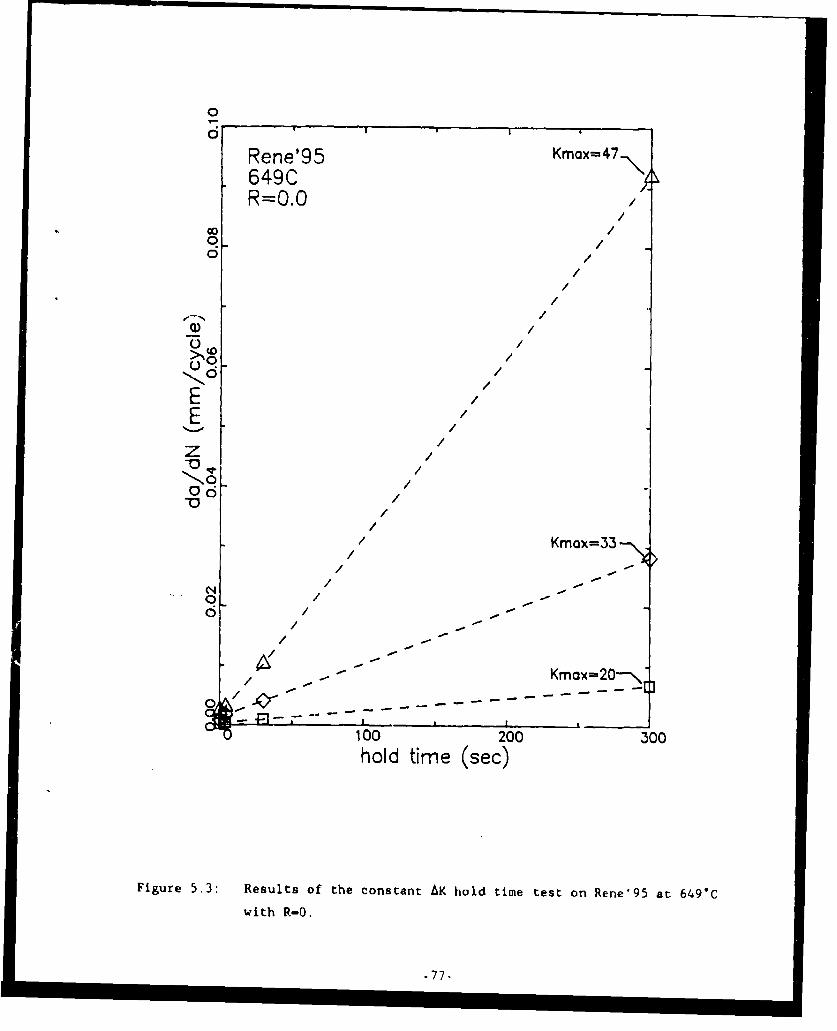
0
0 Rene'95 Kmax=47
6490Cmx=7R=O.O
0/
//
/
Q) /
/
E//
z /
0 /
0
/
// Kmox=33--
-77-
o /.-
/ ' Kmo 20-N
10,.0 200 300hold time (sec)
Figure 5.3: Results of the constant AK hold time test on Rene'95 at 649"C
with R-0.
- 77.

0
00
0\ \
* L0 ar"4~10
~44400
41
C))
rn 41
0* OL. OIAOt I'-T G O
2QO<3wu NP/1
-78 -4

0
.4A
NW
9000 0lo- coPZ0/ LP~
C14.
Q wI
W ticJ
8 -C
C). C:)
n 11 - ,<
I@OOIL) N F a 1
-79-

loading conditions (AK and R) is proportional to the hold time. The slope of
the variation of crack growth rate with hold time should equal the static
crack growth rate (da/dt) for the value of K during the hold time (Kimax).
Figures S.5b and 5.5c show this linear VaLidLion for t.he 593 and 64C*C tests.
Increasing Kmax increases the slope of the crack growtL rate - hold time
dependency much as one would expect for static crack growth. These data
qualitatively agree with the trends predicted by the superposition model.
This was not the case for the 538"C test as shown in Figure 5.5a suggesting
that the mechanism of time-dependent crack growth is different at this
temperature.
The influence of hold time on the crack growth rates was also evaluated
for R-ratios of 0.5 and 0.8 at temperatures of 593 and 649"C. Those results
are shown in Figures 5.6 and 5.7, respectively. These results are shown as a
function of Kmax because if the crack growth is dominaL.e' 'uy static crack
growth, the time-dependent part will be controlled by the K during the hold
time or Kmax. .Like the R-0 results, both _ncreasing temperature and
increasing hold times result in faster crack growth rates. These results are
replotted in Figures 5.8 and 5.9 where the variation of crack growth rate is
shown as a function of hold time on linear axes. These results, like those
for the R-0 tests at these temperatures, show an approximately linear
variation of crack growth rate with hold time as predicted by the linear
superposition model.
The influence of cycle period was evaluated at 593 and 649"C for R-ratios
of n, 0.5. and 0.8. The results of thc 593"¢ tests are zhc-.n in Figure 5.10.
When R-0 (Figure 5.10a), cycle period has little effect at low values of Kmax,
but accelerates the crack growth rates at higher Knax levels. This effect can
be seen to a lesser extent at R-0.5 (Figure 5.10b). It was not possible to
evaluate crack growth at low Kmax values for R-0.8 due to the high threshold
value for this cycling condition. Comparison of the data in these figures
shows that the influence of cycle period seems to increase with R-ratio and is
particularly large for R-0.8 testing conditions. The influence of R-ratio on
the crack growth data shown in Figure 5.10 agrees qualitatively with a
-80-

r'~-' I' *I.ad
E LA
0 0
-4)
00.4. 0A
C:) C) uL
U~) C4
450) i
, -- A - . I . . . I .. . I . . -
0 L ZO L0L t- 0 L 9O(91Ap/)LUW) N~p/Dp
-81-

Q--
ox
E
000
Z- IcI
00
4.
Ln)
w -q 1
Ny (I, w.
0 L 00L- - Z
IC)A)/ w NP c) "40~iFad
~ -82-

N 0
NK LO Q
x~ vN
NC
NL 8
U- N I 14
N )
00
C ) cl:
Mo ZOO ioN
(a~%/u)NP/DP a
83-4

4Jup
4
-, ' -I- - -N 0
N rN' 0%
N P1N I '0
NE E
N UN I
N UN
NN 0
N 1 U)N N N-
N V UN E
NN
N I 0N
N UIf'
NN -
N I 0N
N IU) N
NN I
N I~i,.q*II U
N 1
p , ~ _____~.~1~ Ugoo 900 too ~Qo 00(aioi(/ww) NP/DP
4j
'-40
_________ Qf---- ,
N 4JN
0 N ~fl I -N
NN I
N N I
I ~N I
0N I ~N ~73'
N I
N ~ I -~UN I I U
~ EN II 0 U
N N 2v40
N II8~ 4J3N
N q4j-.
N II U UN II
LI) Nq)O N
N0'tx:c.oc~
I * ____ U0~O gvo 010 ~0*O 00
(~ ~/ww) NP/OP
-84-

.ere'95
593C
01
I E /zE :OC
E EE30
C) rZ0 30 so1020 .- ',~
Kmx (MPO Sqrt m) Kmax (MPa sqrt m)
(a) (b)
Rene'95593CR=0.8
7 Figure 5 .10:
" Results of the constant AK frequency
- .4.
E Er1' 4 R-0.0 (b) R-0.5, and (c) R-0.8
--- o .,.-
oL --
V II
0 20 '0 0
Kmx (MPo sqrt m)
(c)
-- -85-
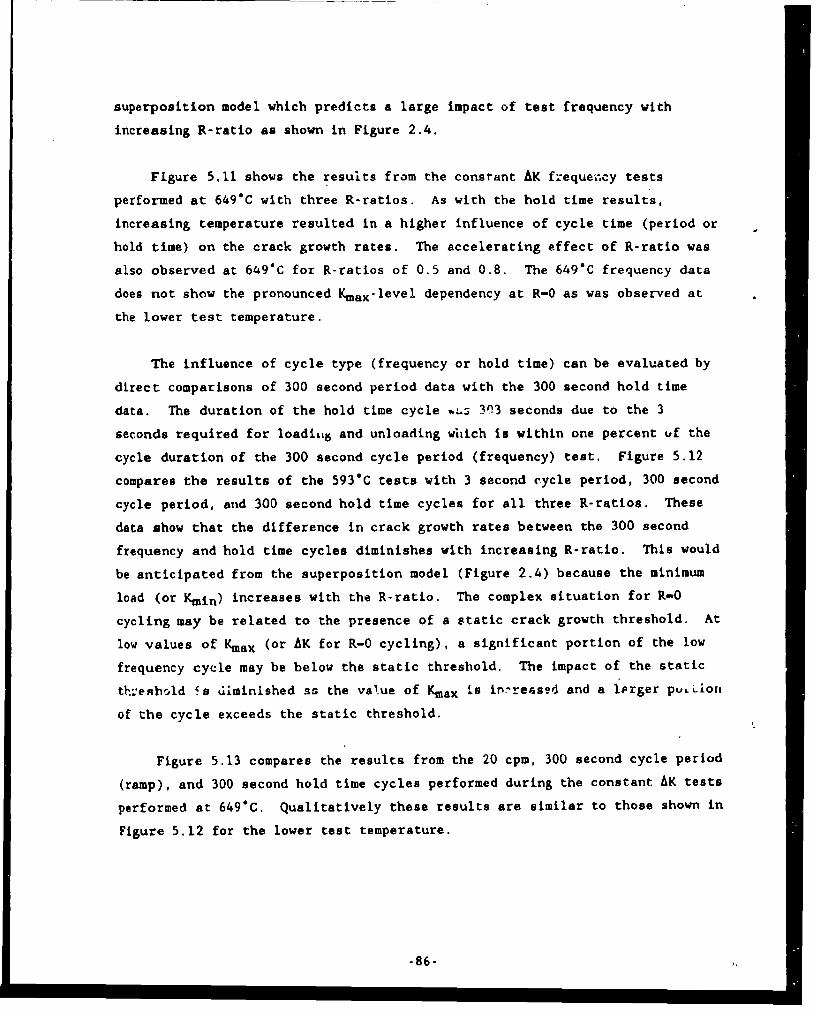
superposition model which predicts a large impact of test frequency with
increasing R-ratio as shown in Figure 2.4.
Figure 5.11 shows the results from the constant AK frequeccy tests
performed at 649"C with three R-ratios. As with the hold time results,
increasing temperature resulted in a higher influence of cycle time (period or
hold time) on the crack growth rates. The accelerating effect of R-ratio was
also observed at 649"C for R-ratios of 0.5 and 0.8. The 649*C frequency data
does not show the pronounced Kmax-level dependency at R-0 as was observed at
the lower test temperature.
The influence of cycle type (frequency or hold time) can be evaluated by
direct comparisons of 300 second period data with the 300 second hold time
data. The duration of the hold time cycle "s 3"3 seconds due to the 3
seconds required for loaditb and unloading which is within one percent of the
cycle duration of the 300 second cycle period (frequency) test. Figure 5.12
compares the results of the 593"C tests with 3 second cycle period, 300 second
cycle period, and 300 second hold time cycles for all three R-ratios. These
data show that the difference in crack growth rates between the 300 second
frequency and hold time cycles diminishes with increasing R-ratio. This would
be anticipated from the superposition model (Figure 2.4) because the minimum
load (or Kmin) increases with the R-ratio. The complex situation for R-0
cycling may be related to the presence of a static crack growth threshold. At
low values of Kmax (or AK for R-0 cycling), a significant portion of the low
frequency cycle may be below the static threshold. The impact of the static
th;esbold is diminished as the value of Kmax is i:preased and a lrger puLLior,
of the cycle exceeds the static threshold.
Figure 5.13 compares the results from the 20 cpm, 300 second cycle period
(ramp), and 300 second hold time cycles performed during the constant AK tests
performed at 649"C. Qualitatively these results are similar to those shown in
Figure 5.12 for the lower test temperature.
-86-

__ _ __C_
4Rene'95*649C "Rene'95
R-O.O 649C7 - R=0.5
CYCI a
Ot- Ccc 4L Xe
E- 300
EJO . - -
0V . . Ao'-
a 0
,o' - 7 . E -* - i044
10 2050-0Kmox (MPo sqrt m) 20 so
Kmax (MPo sqrt m)
(a) (b)
Rene'95649CR=0.8
Figure 5,11:
. Results of the constant AK frequency
- Atests on Rene'95 at 649C with (a)
"R-0.0, (b) R-0.5, and (c) R-0.8.
10 29.Kmox (MPa sqrt m)
(c)
-87-

Rene95 " e-e'95593C 593CR-0.0 R=-5
1 0.Ci
Vr
E E~
10 had; IZ.0 "\- 0ouc ha -- V -
-I -
oh o-
3oW C"W 2 0 0 -
C0CP
20 1010 50 4O 50 S
Kmax (M~a sqrt m) Kmox (MPo sqrt m)
(a) (b)
Rene'95r 593C
R-0.8Crl Figure 5.12:
Comparison of results of 593C
0 - Rene'95 constant AK tests cycled at
E '" 20 cpm, 3G0 second cycle period, and
, - - 200 seund ,u14 time with (a) R-O.0,
V hold , (b) R-0.5, and (c) R-0.8.
0300
rom
Ia i
10 ;0 0
Kmox (MPo sqrt m)
(c)
-88-

Rene'95649C Rere'95R--0.0 649C
.L " R=0.5
I * 300 Mc.
hod- - j 0
300 MC. E -0 '
E ." . E J,--
E 0 . I -' "
o-, -" - 3oL~ 3
0 .. .-0- - - Z. i
020
,,,
* 0 20OS50 , -,
I
Kmox (MPa sqrt m) 10 2050Kmax (MWo sqrt m)
(a) (b)
C7
Rere'95649CR=O.8
7 , IFigure 5.13:bind
_ ,Comparison of results of 649*C
uEo - Rene'95 constant K tests cycled at
E M. 20 cpm, 300 second cycle period, and
Z rar* 300 seconI hold tihe w..th (a) R-0.0,
(b) R-0.5, and (c) R-0.8.
20 cpen c
10 20 5C0Kmox (MPa sqrt m)
(c)
-89-

5.1.2 Rene'95. Threshold Test Results
The near threshold data were determined using a AK-shed approach as
previoL.sly described in Section 4.4.1. Sowe of these tests were also
conducted using an increasing AK mode to obtain Region II data. The results
from both the AK-shed and increasing AK data are presented in this section.
The last part of this section compares these data to those obtained under
constant AK control conditions. Threshold tests were performed on selected
cycling conditions as listed in Table 5.1. Most of these tests were performed
at 649"C with a fewer number at 593*C.
Near-threshold tests on Rene'95 at 649*C tests with a 3 second cycle
period were performed with R-ratios of 0, 0.5, and 0.8. The results of these
tests are shown as a function of AK and Kmax in Figures 5.14a and 5.14b,
respectively. Increasing the R-ratio results in moLt rapid crack growth. The
crack growth rate data for the various R-ratio condi'ions are almost parallel.
These data cannot be normalized using either AK or Kmax. This is the
situation often observed for nickel-base superalloys under relatively rapid
frequencies(4 2 ,4 3 ,44 ). The lateral translation in data with R-ratio can often
be modeled using the Walker model( 4 0 ). As described previously, this model
defines an effective K (Keff) which, for positive R-ratios, is betwec' the
values of AK and Kmax. The significance of this approach relative to the
linear superposition model is that the cycl'., component of crack growth is
controlled by Keff while the time-dependent p .ion is contr.zle( Uy Kmax . It
is important to note that, for primarily cyclic conditions, the value of
maxirnum K ct thresh-ild (Kth~max ircreas-s with R-razic as Oown in Figure
5.14b.
Near-threshold crack growth tests with 3 second-cycle periods were also
performed at 593"C with R-ratios of 0 and 0.8. The results from those tests
are shown as a function of AK and Kmax in Figure 5.15a and 5.15b,
respectively. The response at this temperature is similar to that shown in
Figure 5.14 for 649C.
-90-
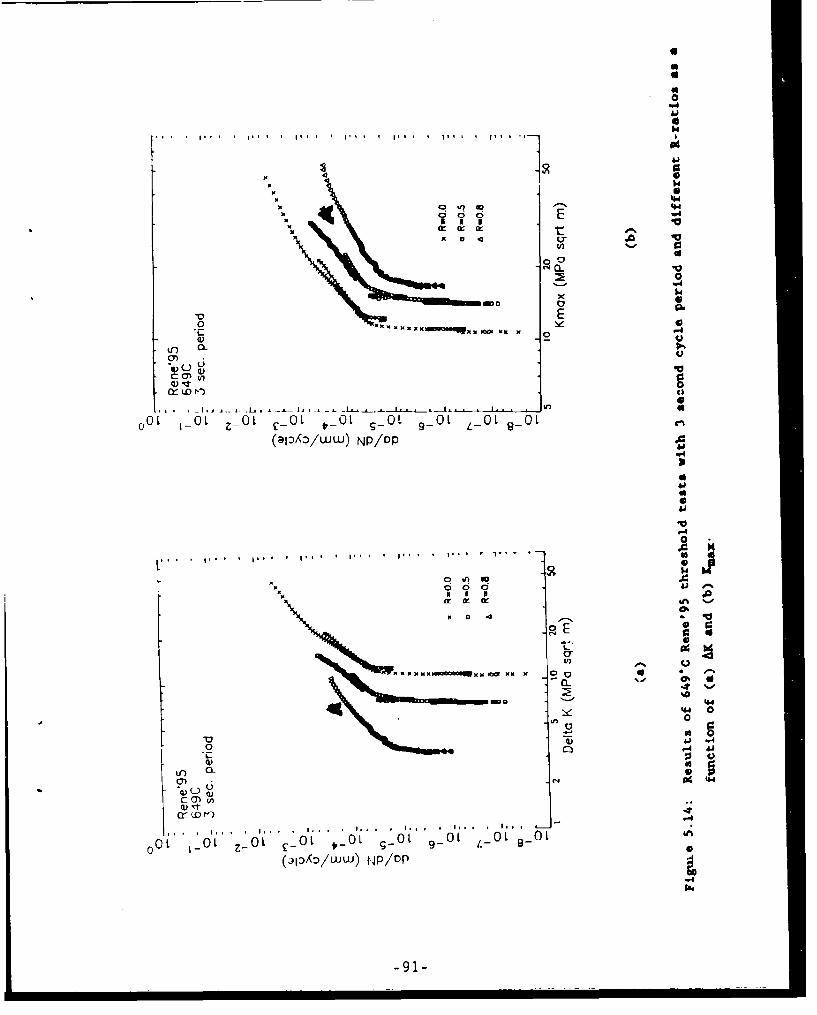
x a Q00U
a-a0
1.4
wo 0
0)0
C, 0)a
aaIaN 0
Ia~~a~aa~g1.W1 0O4 Ea lie
VV
In) ()
u )C,
tr (0 f-)
0 oiL Z' 0 CLt- i d -
(3DAOI/wW) Np/op

0
9 aqEU
Ln 0
a) "4
ic .. , 4.4I
K 4D
000
0X K
'4 K
.2 0
UC)
AA'3
wu.4
cnU
W-4
-920

The R-0 and R-0.5 data shown in Figures 5.14a are nearly parallel over
the entire range of AK, however there appears to be a larger shift between the
R-0.8 and R-O near-threshold data than is observed for the Region 11 data. A
similaL effect is observed for Lhe 393"C data shown in Figure 5.15a. There
are several explanations for this behavior including oxide- or
roughness-induced closure and time-dependent crack growth(44 ).
Over the temperature range from room temperature to 760"C, increasing
temperature results in both accelerated Region II crack growth rates and
decreasing threshold values for nickel-base stiperalloys( 4 2 ,44 ). This is
illustrated using the Rene'95 3 second cycle period tests at 593 and 649"C for
R-ratios of 0 and 0.8 in Figures 5.16a and 5.16b, respectively. There is a
relatively small change in Region II crack growth rates over this relatively
small temperature range, but a rather substantial difference in near-threshold
behavior. It has been suggested Lhat the cause for the increase in cyclic
threshold value with temperature is localized crack tip blunting amd stress
redistribution by creep deformation( 42 .44 ). The large temperature-induced
changes in threshold values at both high and low R ratios strongly suggests
that the threshold behavior in these materials is not dominated by
oxide-induced closure( 4 2 ,4 4). This further implies that the larger shift of
the R-0.8 near-threshold data relative to the lower R-ratio data is caused by
time-dependent crack growth.
Figure 5.17 shows the crack growth data from the hold time threshold
tests for R-0 at 593 and 649*C. At both temperatures, increasing hold time
durativp increases che crack growth threshold dnd the 9egion 11 crack growth
rates. The latter behavior was observed previously in the constant AK tests.
The influence of cycle period on the 649C near-threshold crack growth
behavior is shown in Figure 5.18. Increasing cycle period (decreasing
frequency) also results in increased threshold values and Region II crack
growth rates. This effect can be qualitatively rationalized by the crack tip
blunting and/or stress redistriburtion arguments made for the temperature
crossover effect(4 2 ,4 4 ). As the cycle time is increased, there is more time
available for creep deformation of the material near the crack tip. If creep
blunting or stress redistribution, in part, controls the near threshold
-93-

%b4000
q.4
14
044
000
'U E
a- 1
O1 4 0
00
000
at3 cr
q)n
440
0
0)0c) Lic0
it) at) ao .- 0
OL t0 t 0' 0' -OL9 -O L OL 9 0
(DI~k)Luu-J NP/D
"4
xA
-94-
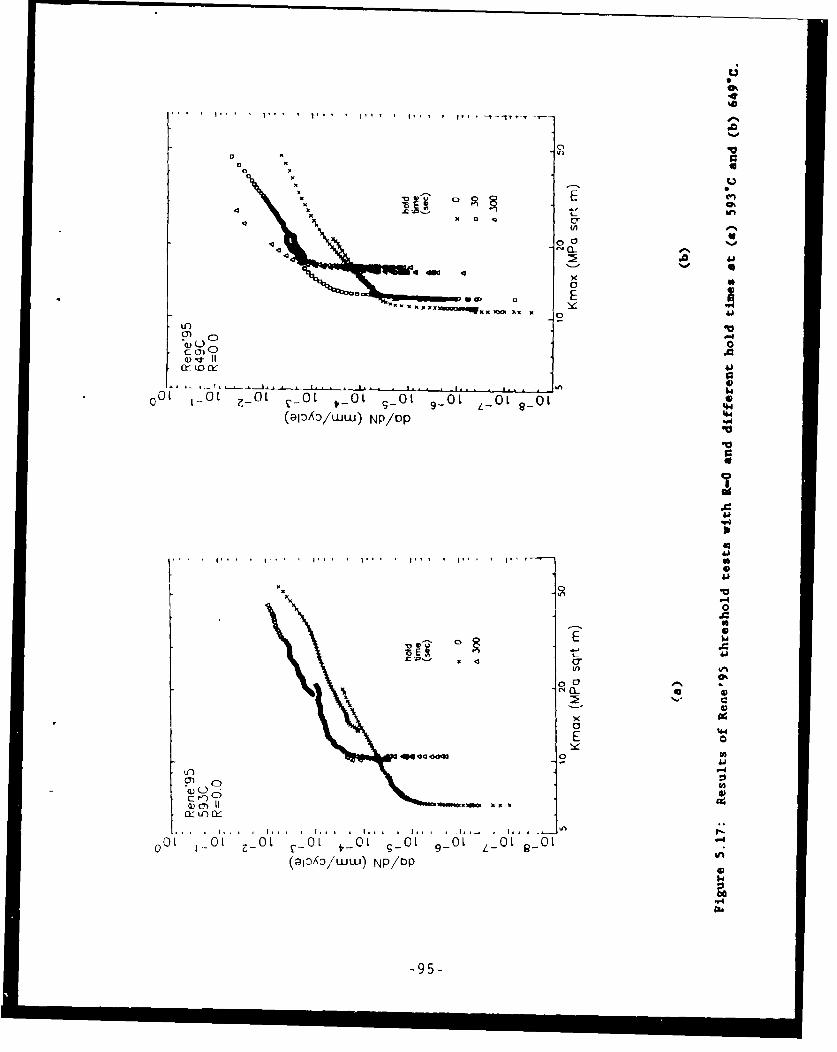
C) '0
0A
XUxU
x x pt &
c (31 Ca
01
0~) 1
0x V
0 0
44
E *0
U0U0 _
0 a nN P / O P
1
-95'

0
,- Rene'95 !
649C2 R=0.0
C'J A
0 A
AA, 0 a
xxx x
I0
z
0 cyclex I period
A (sec)x -
CO x
10 3
o Joa 30
K a 3000x
0
5 10 20 50Kmax (MPa sqrt m)
Figure 5.18: Results of 649"C Rene'95 threshold tests with R-O and different
test frequencies.
-96-

behavior, one would expect increasing values of threshold with increasing
cycle period and/or hold time.
The resuILS shown in Figures 5.17 and 5.18 were only for R-0 test
conditions. The effect of R-ratio on the threshold values are shown in Figure
5.19. In this figure, the maximum value of K at the threshold, (Kth)max, is
shown as a function of either hold time (Figure 5.19a) or cycle period (Figure
5.19b). The data from tests with different R-ratios are shown with different
symbols. Results from the same R-ratio are connected with lines to illustrate
the trends in the data. Also shown in this figure is the static crack growth
threshold value as indicated by an asterisk on the right side of each figure.
One would expect that as the cycle period or hold time increases, that the
values of (Kth)max should approach the static threshold value. For R-0,
increasing cycle time increases (Kth)max as shown in Figures 5.17 and 5.18 and
ti.- values aLe much larger than the static threshold. T1he R-0.8 hold time
tests show a very interesting trend. At short hold times, (Kth)max drops
quickly and seems to be approaching the static threshold. The value of
(Kth)max for 300 second hold times is greater than that for a 30 second hold
time illustrating that the (Kth)max passes through a minimum value with
increasing hold time. Based on the avatiable data, it can only be shown that
this minimum occurs somewhere between 4 and 300 second hold times. There were
insufficient near-threshold tests performed for R-0.5 hold time, R- .5
frequency, and R-0.8 frequency cycling conditions to determine if the minimum
also occurs for these situations. The observation of the minimum in (Kth)max
for the R-0.8 hold time tests strongly suggests that there are two competing
c:rack &ro.::h rdechanisms opecating in tihe near-threshold re6gme. One vnechan 4sm
results in the decrease in (Kth)max for small hold times and the other results
in (Kth)max values greater than the static threshold value for long hold
times. The potential mechanisms which may cause this behavior will be
discussed in Section 6.
It is very interesting to compare the R-0 data fo. 20 cpm cycling
conditions (3 second period or 0 hold time) with the results for 300 second
cycle periods or hold times. For nominally cyclic crack growth (20 cpm), the
value of (Kth)max incrf,-es with R-ratio as was illustrated in Figure 5.14.
-97-

.2)
2 44
I~n r
0%
800
4)4
00
91 0l9P
-98-

For the long hold times, the values of (Kth)max are ordered differently with
R-0 having the highest value followed by the R-0.8 then the R-0.5 values.
These changes in the ordering of the threshold values further illustrate the
complexity of the local crack growth mechanisms resulting in the variations in
(Kth)max shown in Figure 5.19.
Four near-threshold crack growth rate tests were performed at 593"C
comprising a two by two matrix of R-ratio (0 and 0.8) and hold time (0 and 300
seconds). The (Kth)max results for these four tests are listed in Table 5.2.
The influence of hold time for the R-0 tests is the same as that shown in
Figure 5.17a for the higher temperature. The magnitude, however, is not as
great as those observed at 649"C. There are insufficient data to determine if
(Kth)max passes through a maximum for R-0.8 cycling conditions. At an R-ratio
of 0.8, the value of (Kth)max increased with hold time. This result is
different from the 649"C results (Figure 5.19) 'it chat increasing hold time
increases the threshold value at both R-ratios and at both hold times the
R-0.8 test had the higher value of (Kth)max. It is not clear wheter different
mechanisms are occurring at the two temperatures or if there has been a
relative change in the kinetics of the two competing processes.
The previous section concentrated on crack growth threshold estimated
from the AK-shed test results. The Region II crack growth rate tests showed
the same trends observed in the constant AK tests which were reported the
previous section. For the remainder of this section, the results of the
Region I and II crack growth rates determined in thresi,,.Id tests (increasing
end decressng AK) will be compared 'o those deLerrineO in t)e constant AK
tests. The results of the threshold tests will be shown with small "x"
symbols while the constant AK test results will be indicated with large
triangles.
Figure 5.20 shows the results of the 649*C tests with a R-ratio of zero
and different values of cycle frequency. The results of the two types of
tests are similar; however, the constant AK results are slightly lower than
those measured during the increasing AK portion of the threshold tests.
-99-
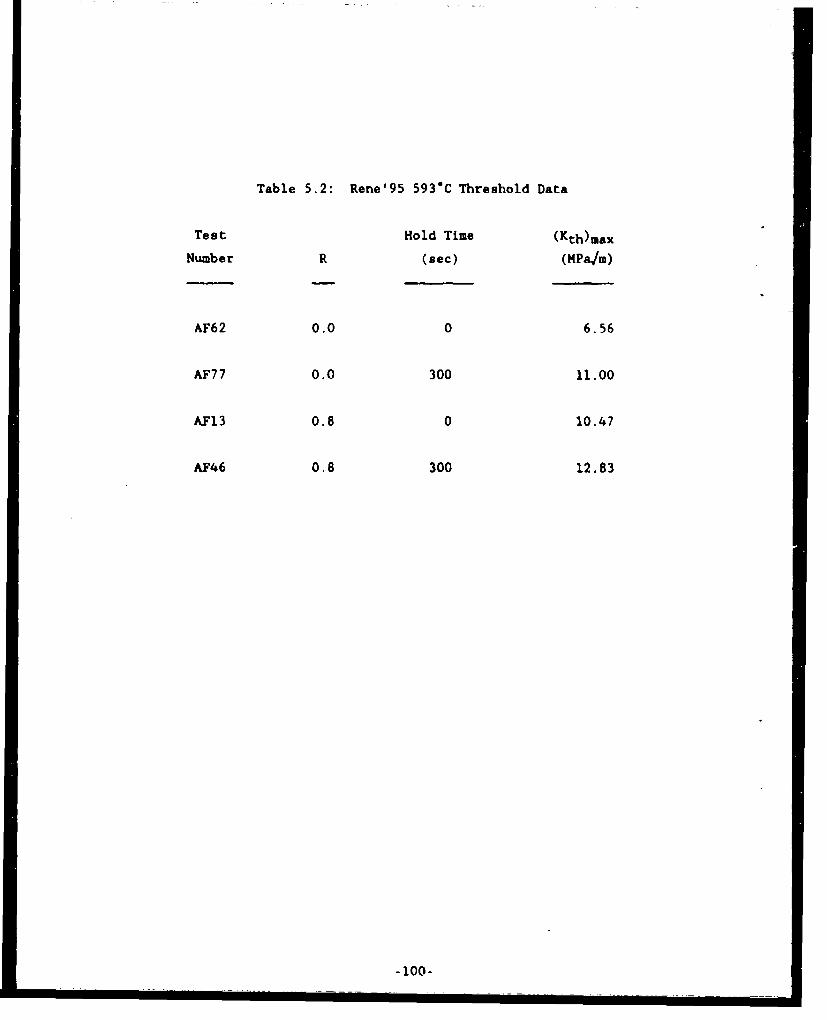
Table 5.2: Rene'95 593*C Threshold Data
Test Hold Time (Kth) uaxN~umber R. (sec) (HPa].)
AF62 0.0 0 6.56
AF77 0.0 300 11.00
AF13 0.8 0 10.47
AF46 0.8 300 12.83
-100-

-" 7 Re.e'95e --9C
-30 sec. oeriod
xxx
E E-E-
- 4 " U -"
* I- z
000
I -D
4 'I.0: o-
5 " " 20 50 5 10 20 50
Krnax (MPc sqrt m) Kmax (MPo sqrt m)
(a) (b)
Rene'957 649Co_ R=0.0
300 sec. period Figure 5.20:4
x x
C-;- x A
- Comparison of crack growth rates
-_ measured in threshold and constantNE7 0- AK tests of Rene'95 at 649*C and R-0
z 7 for cycle periods of (a) 3 seconds,
0 o. (b) 30 seconds, and (c) 300 seconds.
ID
C L
5 10 20 50
Kmox (MPo sqrt m)
(c)
-101-

Figure 5.21 shows the results of the 649"C hold time tests performed with
a R-ratio of zero. Also included in Figure 5.21b are the load shed results
with a shed rate constant C of -0.39mm (-10/inch) previously shown in Figure
4.7 and the Region II constant load and increasing AK results previously shown
in Figure 4.9. The data in Figure 5.21 show that the constant AK results are
significantly lower than the results from the constant load or increasing AK
results. The influence of test control mode is greater for the hold time test
specimens than the frequency test speciments.
The results determined for the 649"C tests performed with a R-ratio of
0.5 are shown in Figures 5.22 and 5.23. Both cycle frequency tests are
displayed in the first figure while the 300 second hold time data are shown in
the latter figure. Note that there is only increasing AK data for the 300
second period test (Figure 5.22b). When data were obtained for both control
modes, the constant AK data was lower than the increasing AK data. Comparison
of the data in Figures 5.22a and 5.23 does not show the effect of cycle period
or hold time observed in the R-0 tests. As noted previously, a large part of
the difference in the control modes is believed to be related to retardation.
The constant AK tests are in fact tests with blocks of cycles performed under
constant load conditions. If this is true, the retardation effect will be
related to the number of cycles performed between load adjustments (block
size). The implications of the block size will be examined in more detail in
Section 7.
The results from the R-0.8 test at 649*C with varying test frequency and
hold times are shown in Figures 5.24 and 5.25. AgaLii the re-4uLzs show that
lower crack growth rates were measured in the constant AK tests.-
The results of the four 593C threshold tests are listed in Table 5.2 and
are compared with the corresponding constant AK tests in Figures 5.26 and
5.27. The R-0 results are shown in Figure 5.26 and the R-0.8 data are given
in Figure 5.27. As in the lower temperature tests, the crack growth data
measured in the constant AK tests are lower than the rates measured under
increasing AK conditions.
-102-

xx 110 0o
1U)
0 0
C-4.
0 E C
* n u
:y CD3 0110
-~-P4
00
toso
*1 U
Q) Q 1 UU
"4
(ajOAO1 tLJwu) NP/DP
-103-

ein
Ea
4~44VV0L a
LO)
G)3f (0 or- 0
01 0010 -0L0 01 ... 0 C- 0 00 .. OL L- 0 L 01L(aloiA/ww) NP/DP
00
a 0
04J
u u
a0 "4
LOa Va).J
_ e
c ) 0y
cc 10ckr n C4
(91A//W~U-) NP/DP
-104-

0
0
Rene'95-649C A _
0o_ R=0.5300 sec. hold
OX
/U C' x
E '.E 0
Ln
-
i r
0
5 10 20 50Krnax (MPa sqrt m)
Figure 5.23: Comparison of crack growth rates measured in threshold and
constant AK tests of Rene'95 at 649C and R-0.5 for a hold time
of 300 seconds.
-105-

-T -Tr-r r r-T0
Oi
<U
EI
x 44
y) 0
_0
I- EQ) 00r
3U, 0 .
00 U)
0) 0 o
0 0L 0L 0UL 0L 0U L 0UL C
(9i1i(0/wui) NP/OP
14 *n
X< 4x UU -
'C $4
E) 00
00w$4.
X 0 0
ooU
r2
(@p,(D/wLuw) NP/DP
-106-

- -- " - - - e n e '9 5* ~e~e9 5649CR ere'95
' ' ~64S C0-
c R.8 30 sec. hold
4 sec. hold
0-7-
SI -
- E
*0 0
0
o-
9L -1O 20 50ti5 20 so Mox (MPa sqtm
Kmax (MPlo sqd m
(a) (b)
o - c ;
Rene'95649CR=0 8
*300 sec hold Figure 5.25:
0
/ Comparison of crack growth rates
_ measred in threshold and constant
E AK tests of Rene'95 at 649% andE
z R-0.8 for hold times of (a) 4
' -o[d
I seconds, (b) 30 seconds, and (c) 300
seconds.
.7
1. 0 20 50Kmax (MPO sqrt rn)
(c)
-107-

<1U
ad
CDI
0 04 m
I 4)
0'))
C4)~M OW 0
(H~~~ 01 00 1 1 1
C5C(L) ) 11 (/) )WAW X X
W~~~I U' a r)
(GOOI U))PD W4-
I 108-

0
r ii i i I iI
0
I-M
x~0
00
-U-E
Cu: n 0.
lit Ic 19 Ic 0'l l t.-
0 OL -OL -0 L - -0-0 - L a
01100LUU NPD
* u~
ax 0 0
10 04
Q)~~ 0)1L~~~ -r n - r
I. 0IE L 0L 0L 0
-109-

The comparisons shown in Figures 5.20 through 5.27 have clearly
illustrated that crack growth rates measured in an incraasing AK mode exceed
those determined under constant AK conditions. This descrepency is larger for
Lold ;ime tests than the frequency Lests and also tends to increase with
increasing R ratio. The lower crack growth measurements in the constant AK
tests may be due to retardation induced by load drops between load control
cycles in a given cycle block. For these reasons, the agreement of the crack
growth predictions from the models described later in this report will rely
more heavily on the increasing AK rather than the constant AK data.
5.1.3 Rene'95, static crack growth
Static crack growth tests were performed on Rene'95 test specimens at 593
and 649"C (1100 and 1200"F). Individual tests were conducted using a AK-shed
and load control modes. These tests were actually run as fatigue tests with a
R-ratio of 0.995 and a cycle period of 3 seconds. This approach was used so
that the load could be adjusted frequently during the AK-shed tests.
The results of one AK-shed and two constant load tests performed at 649"C
are shown in Figure 5.28. The constant load data show an apparent threshold
at the start of each test. These data may be indicative of transient behavior
between the R-0 precrack and the static (R-l) constant load portion of the
test. Sadinanda and Shahanian(16 ) have reported a similar type of behavior in
constant load tests performed on Alloy 718. The AK-shed tests had responses
typical of threshold tests. The static threshold data previously shown in
Figure 5.19 were determined from this test. There is a spread by a factor of
approximately three between these crack growth rates. This will become
significant when applying the superposition model because the data shown in
Figure 5.28 ware used to determine the constants for the static crack growth
curve.
Figure 5.29 shows the results from a single AK-shed and constant load
test performed at 593"C. Unfortunately, the AK-shed test was stopped before
near-threshold data were obtained. The constant load data in this figure show
the apparent threshold also observed in the constant load tests performed at
-iiO-

Rene'956490
4)A 1
E
0
to
0- K O shad
p A constant load
0
10 20 50K (MPa sqrt m)
Figure 5.28: Results of Rene'95 static crack growth tests at 649*C.

01Rene'95593C
0a K shed
A constant tood
0o Q
EE
0
(0
0
10 20 5oK (MPa sqrt m)
Figure 5.29: Results of Rene'95 static crack growth testo at 593"C.
-112-
the higher test temperature. Comparison of the data in Figures 5.28 and 5.29
shows that increasing the temperature by 55C (100"F) results in an increase
of static crack growth rates by an order of magnitude. The amount of scatter
Letween test specimens is 5ignificantly higher for it.ir 649"C tests than Lhe
593"C tests.
5.1.4 Rene'95 Retardation Tests
Retardation tests were performed to determine the influence of overpeaks
in stinprpssing crack growth during hold times at stresses below the maximum
value. The mission survey analysis (Section 3.0) showed that overpeaks
ranging from almost zero to 100 percent occur during engine operation.
The Rene'95 retardation test matrix is given in Table 5.3. Two different
typeu uZ constant AK-control tests were used to evaluate overpeaks. single
overpeak and multiple overpeak tests. Single overpeak tests were performed at
593 and 649*C (1100 and 1200"F) with a R-ratio of zero. After a single
overpeak, repetitive cycles with hold times of 0.30.and 300 seconds were
performed until the crack had advanced a minimum of 0.25 mm (0.01 inch). At
this point, another overpeak was applied and the process was repeated. In a
single test overpeak values of 10, 20, and 50 percent were evaluated.
The multiple overpeak tests were also performed using AK control.
Examples of some of the multiple overpeak cycles are shown in Figure 5.30
where, in some cases, a hold time occurrs at a K value intermediate to the
minima~ :nd maximum K duing the decreabing load ramp. All cycles performed in
this fashion had a loading ramp of 7.5 seconds and an unloading ramp of 7.5
seconds. The 15 second cycle was used because the equipment used to generate
the command signal for the test machine had to be programmed in even
increments of time. The relatively slow ramp was necessary in order to
accurately control the loading ramps in cycles with 300 second hold times.
The cycles were defined by the overpeak ratio, R-ratio, and hold time. The
R-ratio was defined as the ratio of minimum K to K during the hold time
(Khold). The overpeak value was represented as the percentage that the
overpeak Kmax is in excess of Khold. The hold time interrupted the decreasing
-113-

Table 5.3: Rene'95 Overpeak Test Matrix
Test Temperature OverpeakNumber COC) R Ratio
AF58 593 0.0 variable
AF73 593 0.0 1.1
AF28 593 0.0 1.2
AF36 593 0.5 1.1
AF43 593 0.5 1.2
AFi6 649 0.0 variable
AF68 649 0.0 1.1
AF29 649 0.0 1.2
AF34 649 0.0 1.5
AF75 649 0.5 1.1
AF35 649 0.5 1.2
-114-
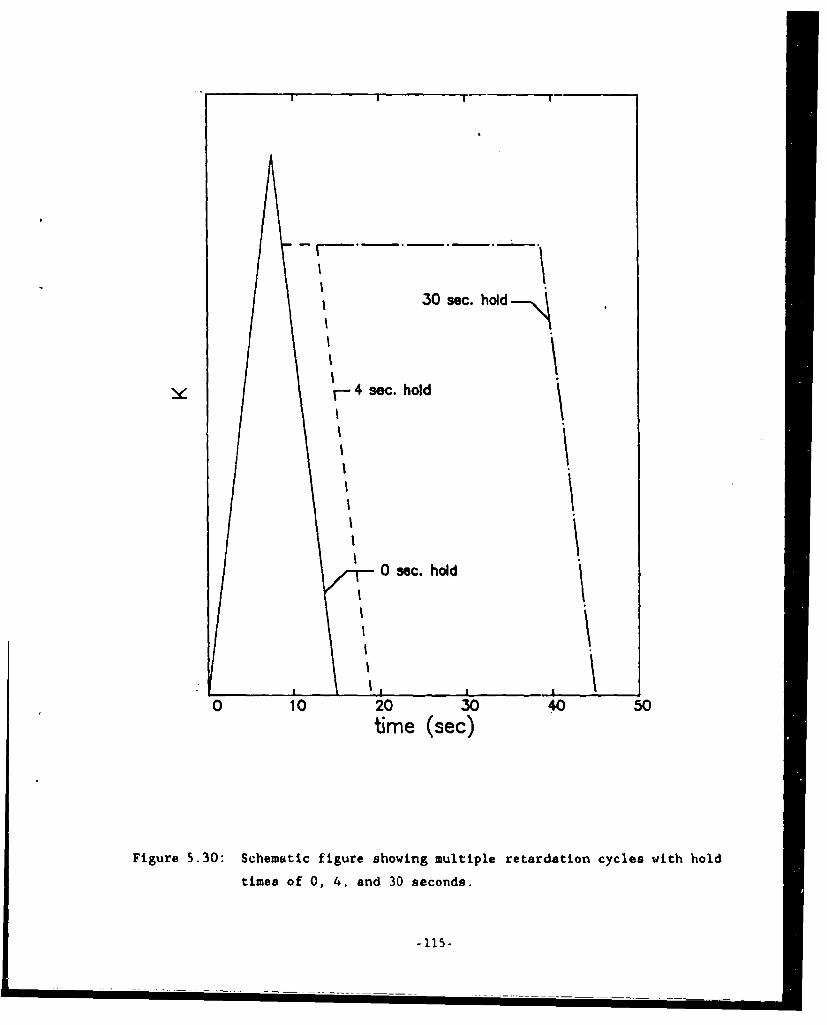
II
"l,~3 s~c.,hold_
I 4 sec. hold
I\
II'
0 sec. holdI\
/I0 10 20 30 40 50
time (sec)
Figure 5.30: Schematic figure showing multiple retardation cycles with hold
times of 0, 4, and 30 seconds.
-115-

load ramp so that the unloading rates before and after the hold time were
identical. The cycles shown in Figure 5.30 have an R-ratio of zero, a 20%
overpeak, and hold times of 0, 4, and 30 seconds. An individual test was
performed with constant R and overpeak ratios. At least two and, in mosL
cases, three values of Khold were evaluated in a given specimen. For each
value of Khold, hold times of 0, 4, 30, and 300 seconds were evaluated.
In the single overpeak tests, the crack growth rate was retarded after
the application of each overpeak. Figure 5.31 shows an example of this type
of data as observed in a Rene'95 specimen tested at 649*C. A minimum in crack
growth rate was observed at half the plastic zone size of the cyclic condition
prior to the overpeak, (rp)old. The extent of the retardation zone was twice
the plastic zone size of the overload cycle, (rp)ol. These values are
identical to those identified in single overpeak tests of nickel-base
supeialloyb under 3 second frequency (20 cpm) cycling conditions(4 9 ). The
magnitude and size of the crack growth retardation zone increased with the
overpeak K level. It was difficult to assess the impact of combinations of
overpeaks and hold times in single overpeak tests.
The results of the R-0, 649"C multiple overpeak tests on Rene'95 are
shown in Figure 5.32. These data are shown as a function of Khold, the K
during the hold time. The degree of retardation increases with overpeak ratio
and Khold. In tests with 50% overpeaks, there is no influence of hold
time(Figure 5.32c). A similar comment can be made for 20% overpeak tests
where the Khold is !n excess of 30 MPam. Even at lower Khold levels,
comparison of t'sts with 1G and 20% overpeaks (Figures 5.32a and 5.32b,
respectively) show much less influence of hold time on crack growth rates for
201 overpeaks. This very strong effect of overpeaks on time-dependent crack
growth is similar to that reported by Weerasooriya and Nicholas( 50 ) for Alloy
718. The remainder of the test conditions were restricted to overpeak ratios
of 10 and 20 percent due to the absence of time-dependency for 50% overpeaks.
Figure 5.33 shows the results of the R-0.5 overpeak tests performed on
Rene'95 specimens at 649"C. The trends shown with overpeak ratio, Khold, and
hold times are similar to those shown for the lower R-ratio in Figure 5.32.
-116-

1 ~ ~ I I I I I
Rene'95649CR=O50% overpeokK hold = 20.4300 sec. hold
CI Ii 0 2 rop
- A
I A%Ez A
0A
o
I
-&I ji*- (rp)old / 2
0I
1P ii I I I
4.3 4.4 4.5 4.6 4.7 4.8 4.9 5.0crack length (mm)
Figure 5.31: Variation of crack growth rate with distance in Rene'95 at 649*C
with a 300 second hold time at R-0 preceeded by a 50% overpeak.
-117-

o ____________ _ __________
Rene'95 Rene'95649C 649CR-0.0 ,R-O.010%. overpeak 20% overpeak
,4 4
E E
z z '
-,1 E1/0 hai hold
0 4 h0
10 2050 10o2 50Khold (MPa sqrt m) Khold (MPo sqrt m)
(a) (b)
70
Rene'95649CR-0.050% overpeok Figure 5.32:
NJ
1 ] Results of 649*C multiple overpeakU
* hold time tests on Rene'95 with R-O
E IE for overpeaks of (a) l0%, (b) 20%,
z h and (c) 50%.
0 4
0 30
0
Khold (MPo sqrt m)
(c)
-118-

4.40
CL
Q)N
-
LO Q) > Ch4
W4
_ CL~LC
(0)oww NP/DP
x 0 0
0~0 LoZ 0L0 1
(9N )WU \NN1)

The results for the 593"C multiple overpeak tests with R-0 and R-0.5 are
shown in Figures 5.34 and 5.35, respectively. The trends in these tests were
the same as observed in the 649"C tests. Significant benefits of retardation
also occur at 593C in Rene'95.
The results presented in Figures 5.31 through 5.35 show that a 20%
overpeak is far more potent in retarding time-dependent crack growth than a
10% overpeaks. There is no indication of the amount of retardation which may
occur with 10% overpeaks because the 15 second ramp time used in the overpeak
tests was not experimentally evaluated during the non-overpeak testing
program. To gain more insight into the effect of overpeak retardation on
crack growth during hold times, the overpeak crack growth rate data were
plotted against the hold time duration using linear axes. This procedure was
used in Figures 5.5, 5.8, and 5.9 for the non-overpeak constant AK hold time
tests, where the crack growth rate varied in an almost linear fashion with
hold time and the slope of the linear relationship increased with Kmax. The
results of the 649*C, R-0 overpeak test data are replotted on these linear
axes in Figure 5.36. This representation reinforces the observation that
increasing overpeak ratio suppresses time-dependent crack growth. The results
for the 10% overpeak ratio test (Figure 5.36a) show the linear behavior for
all three values of Khold. The slopes of the linear behavior for the two
higher value of Khold (32 and 46 MPa.m) appear to be nearly identical. This
illustrates that even though there is time dependency for these conditions,
increasing values of Khold result in less time-dependent crack growth even for
overpeak ratios of 10%. A similar trend is observed for the R-0.5 overpeak
tests performed at 649"C as illustrated in Figure 5.37.
The results from the 593"C multiple overpeak tests with R-ratios of 0.0
and 0.5 are shown in Figures 5.38 and 5.39, respectively using linear crack
growth and hold time axes. As was observed for the higher test temperature,
there is evidence that a 10% overpeak at 593"C decreases the amount of time
dependent crack growth observed in Rene'95.
-120-

.4CLC
-C-
0%
a)) C-)
N 10
0- 4.4
a) ~0
X LO X"
~LfQ~ ) 0 < cn~1, . U
(aIDI(0/wwL) NP/UP

U)-
00
__
NIS,
0)0>Lr) U0
c r- 00 EX O ) X 4
(91Ai0(3ww) Np/op
A
41
C0I
0
e--
LO >
xN 0 1
0LZ ot t 0 '
(33O/1))w o'-V
2-122
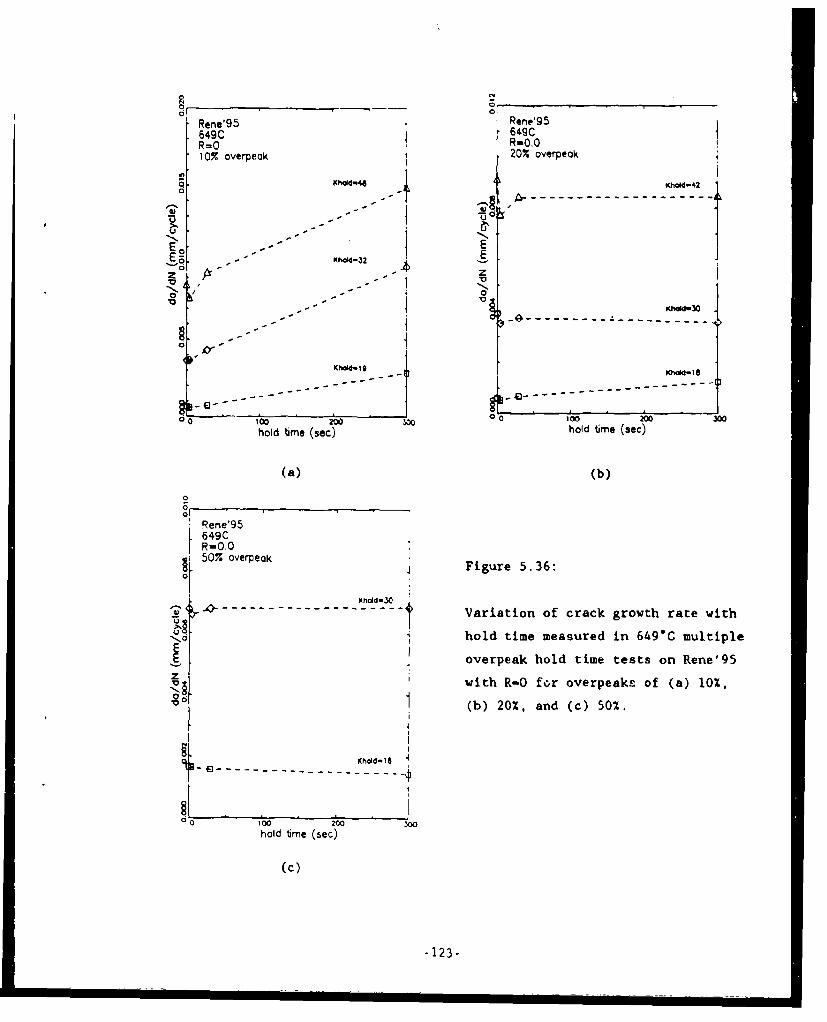
Rene'95 Rene'95649C 649CR=O R-0.010% overpeak 20% overpeak
Q Khdd-44 KhCW-42
- -tV , -.- ' z
- 0. 0
o -
Khod19 h l-1
----------------- - - -~ K d -
hold time (sec) hold me (sec)
(a) (b)
0
01
Rene'95649CR=0.050% overpeok Figure 5.36:
..[.... .. Variation of crack growth rate with
O " hold time measured in 649*C multipleE
EE. overpeak hold time tests on Rene'95
zV with R-O for overpeaks of (a) 10%,0 Ci0 (b) 20%, and (c) 50%.Vi
Khold-18 4
f I
0 0" 2 0ohold ime (sec)
(c)
-123-

o 0
rrL '
0) In0v
3 0
0)
-0 004
00 -0 I O
w -ti C
cflO Io 0 o
(91040/w) NP/J
-124-.

0
-I-
0 0
v N
Q) Iy 1j -
0~0LA AI
W c~~ 0 0
I ~ 0
UI-)~/W >pO 04
C)
Ir n Af 0PWa
goo iloOCO' o'jto 0,NPD
04-~ -~k*
*~Il -125-

U-) Q)
-f aL1 'a-c
o 'a
tI~ CC..'6 ' Y0
(910XD/LwQ NP/O
0
101
I -a 4
p-4 1
LOO0
OLO*O 9000 (a 00/w0 Np/opoocro
-4-------r IDP"4
I . U
C, 126-h
5.2 ALLOY 718 CRACK GROWTH RESULTS
The test matrix for Alloy 718 was approximately half as extensive as that
of Reae'95. Crack growth rateb in Alloy 718 were measured at 593 and 6496C,
but only the influe- )f hold time was evaluated. The Alloy 718 baseline
test matrix is listed in Table 5.4. The Alloy 718 results will be presented
in separate sections on c,'-!-ant AK, threshold, static, and retardation tests.
These data are shown usin . same variables used for presenting the Rene'95
data. The rationale for presernting the data in this fashion was described in
the previous section and will not be repeated here.
5.2.1 Alloy 718 Constant AK Test Results
The Alloy 718 constant AK tests were performed as a functiin of hold
time. Due to the absence of constant AK frequency tests, crack growth during
a zero second hold time segment was also evaluated in these tests. This
resulted in a total of 12 constant AK segments for each test specimen (3
levels of Kmax x 4 hold times). Figure 5.40 shows the variation of crack
length with cycles for the Alloy 718 specimen tested at 6490C with a R-ratio
of 0.0. At first glance, these results seem to be very similar to those
reported for Rene'95; however, in the 0 second hold time segments which follow
300 second hold time cycling at a lower Kmax, there is transient crack growth
behavior. These results are shown more clearly in Figure 5.41. In both
cases, the growth during the zero second hold time cycle was initially very
high and then decreased to a steady state condition. This was observed in the
Allcy 71.8 constant AK testz indeperdent of temperature and R-rptjo and
precluded the accurate determination of crack growth rates during the 0 second
hold time segments. Consequently, those results will not be reported. These
types of transient behavior have been observed in IN100 by Larsen and
Nicholas(2 0 ). The transient behavior was studied in more detail during the
mechanism experiments and are reported in Section 6.
The Alloy 718 constant AK test results were analyzed statistically using
the techniques described for the Rene'95 tests. The results of the
statistical analyses are reported in Appendix C. In all subsequent figures,
-127-

Table 5.4: Alloy 718 Simple Cycle Test Matrix
Test Temperature Test
Number (C) R Type Variable
A13-17 593 0.0 constant AK hold time
A13-09 593 0.0 threshold 3 sec. cy'le
A13-07 593 0.5 constant AK hold time
A13-11 593 0.8 constant AK hold time
A13--0 593 static threshold
A13-24 649 0.0 constant AK hold time
A13-28 649 0.0 threshold 300 sec. hold
A13-06 649 0.0 threshold 3 sec. cycle
A13-37 649 0.5 constant AK hold time
A13-20 649 0.5 threshold 3 sec. cycle
A13-12 6',9 0.8 constant AK hold time
A13.14 o49 0.8 threshold 4 bec. hold
A13-32 649 0.8 threshold 30 sec, hold
A13-05 649 0.8 threshold 300 sec. hold
A13-02 549 0.8 threshold 3 sec. cycle
A13-19 649 static threshold
A13-35 649 static constant load
-128-

Alloy 718649Ci
R=O.O 300 I
30Kmax=43
4
E 0
E-C 300
CQ_ 30_ Kmax=31
4 /4 /_(--0
Kmax=18 300 J
- numbers indicate0 /hold time
in seconds
oI * I II
3000 5000 7000 9000 11000
cycles
Figure 5.40: Variation of crack length with cycles during constant AK hold
time test on Alloy 718 at 649"C with R-0.
-329-

4
~ 0
000
o 0 0o4
0* 5-
MJ0
E U) A 0
* aO I
-0
0 044
(D ci r
z. 1 0
Ibi-130-

the large symbols correspond to the average values of Kmax and crack growth
rate from the constant AK tests.
The results of the Alloy 718 593"C constant &K tests are given in Figure
5.42. Increasing hold times accelerates the crack growth rates. There is a
larger difference in crack growth rates between 4 and 30 second hold times
with increasing R-ratio.
The results of the constant AK tests performed at 649"C are shown in
Figure 5.43. This shows the types of trends observed in the .5936C results
except that there is a smaller influence of R-ratio for the 4 second hold time
data. No data is shown for the 4 second hold time at the highest Kmax level
because the transient zone was so large that it also influenced this segment
of crack growth rate.
The crack growth rates from the 593 and 649C Alloy 718 constant AK tests
are replotted on linear axes as a function of hold time in Figures 5.44 and
5.45, respectively. The results for both temperatures show that the crack
growth rates are proportional to hold time. This effect is qualitatively
predicted from the superposition model.
5.2.2 Alloy 718. Threshold Test Results
The threshold tests performed on Alloy 718 are listed in Table 5.4. A
few tests were performed at 593"C, but the majority of the threshold tests
wpre conducted at 649"C. Ih- influence of R-rar.o on the 649C Alloy 71^0 0
second hold time (3 second cycle) hold time tests -re shown a function of AK
and Kmax in Figures 5.46a and 5.46b, respectively. At a constant value of AK,
crack growth rate increases with R-ratio while the opposite trend is observed
for constant values of Kmax. The data for the different R-ratios are roughly
parallel which suggests that they could be modeled using the Walker model.
These trends are very similar to those observed in Rene'95.
Figure 5.47 compares the results of the R-0, 0 second hold time tests
performed at 593 and 649*C. There appears to be a relatively small influence
-131-
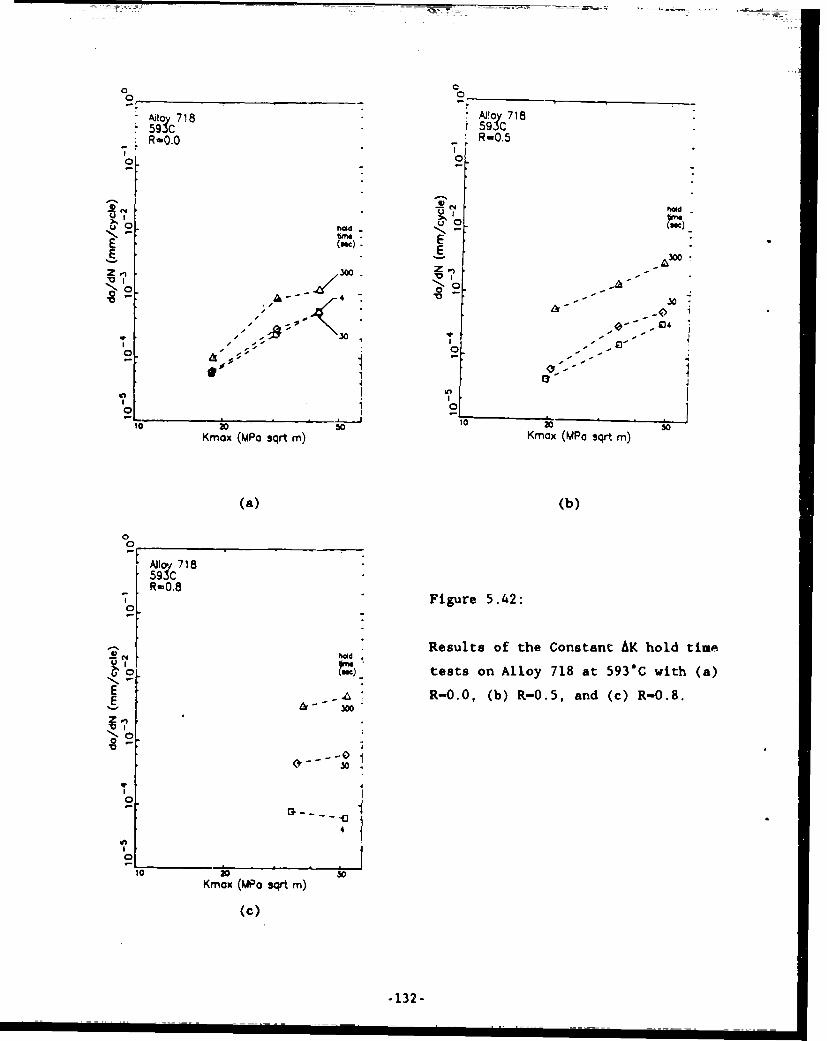
Ao 718 AP 718593'C r5R-0.0 R=0.5
holdd
No o. - - -Ttm ," - ,T
Z 10'
Kmox (MPo sqrt m)Kmx(o rtm
(a) (b)
5930
0 .8
-Results of the Constant AK hold time
Lo ') tests on Alloy 718 at 593"C with (a)
E ." R-O.O, (b) R-0.5, and (c) R.-0.8.
, -1'- 0. '- .. .
4
*' 1
10
0o 00
Kmox (MPo sqrt m)
(C)
-1.32 -
,~ R-I0::= . . : : i. . .. . . . .I : .. : .. F i r 5. . 4:i...i = 1 . .. I I :
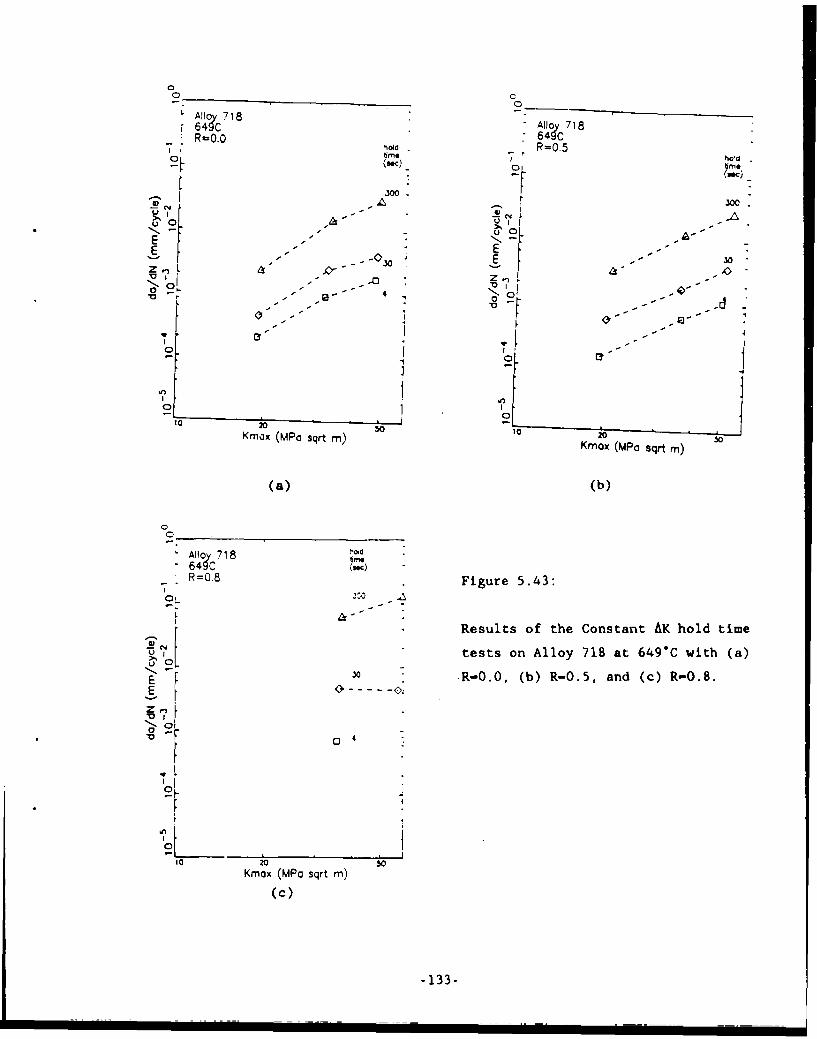
o cAlloy 718649C Alloy 718R-0.0 649C
I "-d R=0.5
C4 k 300.-. N m
EE E-
z~,z"o "- - 4<3 E 0 -" "
q. -,
6L 0 10!13
0 A
u5020L5Kmx (MPa sqrt m) ,50x ' s m)Kmox (MPo sqrt m)
(a) (b)
00
AllOy 718649C (w,)
7 R=0.8 Figure 5.43:
Results of the Constant AK hold time
tests on Alloy 718 at 649'C with (a)
E 30 -R-0.0, (b) R-0.5, and (c) R-O.8.
10 2so5Kmx (MPa sqrt m)
(c)
-133-

Aloy 718 Alloy 71859YC 649CR-O.O R=0.8
,/
U /N Kmax-43. -
E . E
zo N / KMOX-364.
i I - I - - - -
00 100 20 tO0O 300hold time (SOc). hold time (set).
(a) (b)/ -/
AI 718
"Variation of crack growth rate with
lhold time measured in Alloy 718
E.," constant AK tests at 593"C with (a)()R-O(b, (b) R-0.5, and (c) . .
00 00
hold Fime (g5.)
(c)
-134-
io i II'''1 | i ii| ii I

,Aio 718 .i
lY..649C71 o J° 718
R-0.571
KMmwr-4
E§-E
zINz
o m ,,i
/
Kmaw-IB j -3 -
d0 100 vS(sec) 0,0 0 200 300
hold time (sec)4
(a) (b)
0 1 A I C ~7 1 8
R-0.8 Ka- Figure 5.45:
oVariation of crack growth rate with
hold time measured in constant Alloy
E/ 718 AK tests at 649*C with (a) R-0,ER-
-' (b) R-0.5, an'd (c) R-0.8.d10 2 0
hold bine (3eC),ioto '--
(c)d m (e~
-1 5
z , a i t o f c a k g o t a e w t
,/
Z / * " '-
0 7--
O /0
hiold time (sec),
, (c)
-135-

X 0
W4
(00
4
0~ 04(fI4
Om I
V-0
0 t 0L 0-0 1 0.0 tQ q 0 O t 0L 0 .. L(OpOAD/uwW) Np/op
ING
-136-

0 I-I I * '
SAllo 7180- 0 sec. hold -
1~ .1
0~
E 11I 0
0 593C
i 649C
Io0A
10 20 50
Kmox (MPa sqrt m)
Figure 5.47: Comparison of 593 and 649C Alloy 718 threshold tests with 3
second cycle period for R-0.0.
-137-

of temperature for this cycling condition.
The crack growth rates measured during R-O threshold tests with hold
times of 0 and 300 seconds are shown in Figure 5.48. These were the only
threshold tests performed for the 649*C, R-0 cycling conditions. These data
show the increase in threshold with increasing hold time, similar to that
observed in Rene'95. The influence of R-ratio and hold times on the threshold
values measured in Alloy 718 at 649"C are shown in Figure 5.49. As was the
case for Rene'95, these data are presented as (Kth)max values. The asterisk
on the right side of this figure shows the value of the static crack growth
threshold. The only R-0.5 test was performed for a 0 second hold time. The
R-0.8 data shows the same general behavior as observed for Rene'95 at this
R-ratio where the threshold decreases rapidly with increasing hold time and
then either saturates or increases slightly to a value much higher than che
static crack growth threshold.
The remainder of this section will compare the results from the threshold
and constant AK tests. No comparisons are shown for 0 second hold time tests
because no accurate data were obtained from the constant AK tests. Figure
5.50 shows the results from the 649"C, R-0, 300 second hold time test. The
crack growth rates measured in the constant AK test are significantly lower
than those measured during the increasing AK portion of the threshold test.
The results from the R-0.8 threshold and constant AK tests are shown in
Figure 5.51. No Region II crack growth rates were measured under increasing
AU- onirol condition for any of tlhese hold times. After the c-sck arrestpd
and the increasing AK portion of the test was started, there was a very rapid
acceleration in crack growth rate making it almost impossible to measure the
Region II crack growth rates. This behavior is very similar to that shown in
Figure 5.41 for the transient behavior. This was observed to a lesser extent
in the 649"C Rene'95 threshold tests. This type of behavior has also been
observed after 20 cpm threshold tests of Alloy 718 at 427"C (800"F)(6 9 ). The
differences between the Region II data measured during the AK-shed and
constant AK tests vary significantly. This may result from retardation during
the AK-shed because the static retardation behavior increases with Kmax level.
-138-
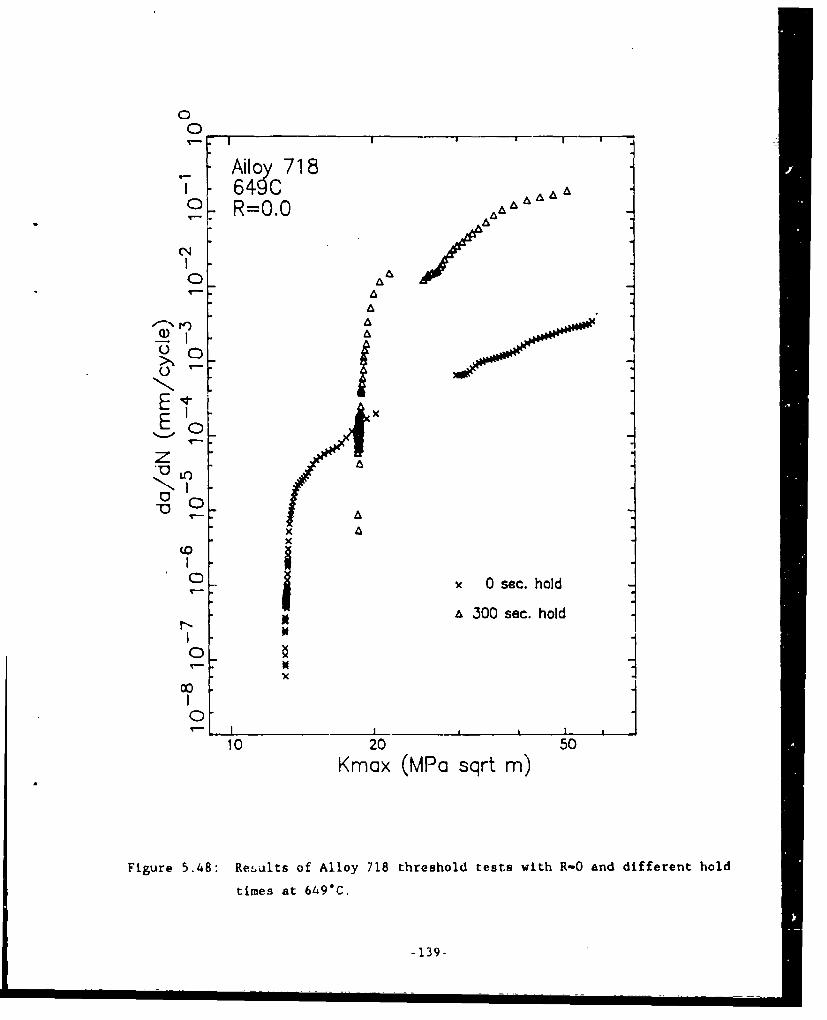
Alloy 71 8649C
0 A
0- R=0.002
-.- 4
° xII
0 0 sec. hold
II-- N
o*LO
0
10 20 50Kmxx (MP0 sqrt m)
Figure 5.48: Results of Alloy 718 threshold tests with R-O and different hold
times at 649sC.
-139-

0
P-)
0LAJloy 718" " 649C
x0 <
'Ej::: R=0.5-)--
R-0.0
•I I I .
0 100 200 300hold time (sec)
Figure 5.49: Variation of (Kth)max in Alloy 718 at 649"C with R-ratio and
hold time.
-140-

00
Alloy 71 8
1 649C
1xX x
o,_ R=0.0 x*S 300 sec. hold /A
x~X
Z xE
ojz 'C
xNI
o(0
Ir-
0
10 20 50
Kmax (MPa sqrt m)
Figure 5.50: Comparison of crack growth rates measured in threshold and
constant AK tests of Alloy 718 at 649"C and R-0 for a 300 second
hold time cycle.
-141-

A111 71 Amlo 718
6 64C C R=0.8
R=0.8 30 sec. hold4 sec. h.d NM
I O0-
0
U N. -
10 -7
KEo oM~ sqt_7mx(Mo.qt
zz
Cw )
z- * omprsn fcac rwtIae
00
0
°-DEE - 0 tet fAlo 1U 4" n
CD I
10 20
Kmoxx (MPo sqrt m)
(a) (b)
0.. R=0.8300 sec. hold -Fgr .1
- Comparison of crack growth rates
4(¢
S2 measured in threshold and constant
E
z R-0.8 for hold times of (aN 4.0
0 0-7 seconds, (b) 30 seconds, and (c) 300
seconds.
10 50
Kmax (MPo sqrt mn)
(c)
-142-

5.2.3 Alloy 718. Static Crack Growth
The static crack growth properties of Alloy 718 were determined at 593
and 649"C using AK-shed and constant load tests. The results of tho 649"C
tests are shown in Figure 5.52. The constant load test has an artificial
threshold and there is a significant difference between the two types of
tests. This is the same type of behavior observed in Rene'95. The
near-threshold results shown in this figure were used to establish the value
of the static threshold shown in Figure 5.49. Only one static crack growth
test was performed on Alloy 718 at 593"C. The results of that constant load
test are shown in Figure 5.53.
Comparison of the results shown in Figures 5.52 and 5.53 reveals that
decreasing the test temperature from 649 to 593C decreases static crack
growth rates by approximately an order of magnitude. It is interesting that
the static crack growth rates measured in Rene'95 (Figures 5.28 and 5.29) had
a very distinct linear Region II which extended to K levels approaching 60
MPam. The companion tests on Alloy 718 showed a decreasing slope with
increasing K. Alloy 718 has a lower creep capability and this may reflect the
presence of larger amounts of creep deformation at the tip of the crack.
5.2.4 Alloy 718. Retardation Tests
Four overpeak hold time tests were performed on Alloy 718 specimens at
649*C. The test matrix was comprised of two R-ratios (0.0 and 0.5) and two
overpe:k rptios (10 and 20) and is shown in Tabc 5.5 Thp overp:ak cycles
and test techniques for these tests were identical to those performed on
Rene'95. The transient crack growth behavior observed during the constant AK
tests was also observed in the Alloy 718 overpeak hold time tests. As in the
constant AK tests, this prevented the used of the 0 second hold time data from
the overpeak hold time tests. The results of these tests were analyzed
identically to the Rene'95 constant AK overpeak tests. Statistical analysis
results for the Alloy 718 retardation tests are shown in Appendix D. The
-143-

6C
00
) I
E0
E
00~0-
0 ~ constant load
10 20 50K (MPa sqrt m)
Figure 5.52: Results of Alloy 718 static crack growth tests at 649C.
-144-

0
Alloy 718593C
U
I0 constant load
0
10 20 50K (MPa sqrt M)
Figure 5.53: Results of Alloy 718 static crack growth tects at 593"6.
-145-
, , , , i i i i I I II II I I

Table 5.5: Alloy 718 Overpeak Cycle Teat Matrix
Test Temperature OverpeakNumber (*C) R Ratio
A13-18 649 0.0 1.1
A13-31 649 0.0 1.2
A13-36 649 0.5 1.1
A13-08 649 0.5 1.2
-146-

average values of Khold and crack growth rate determined in these analyses are
represented by large symbols in the following figures.
The results from the Alloy 718, R-0.0 overpeak hold time tests are shown
in Figure 5.54 where results for different hold times are indicated with
different symbols. The dotted lines connect the results from cycles with the
same hold time. Increasing the overpeak ratio results in suppression of
time-dependent crack growth. For 20% overpeaks (Figure 5.54b), increasing
Khold results in a larger amount of retardation. This trend occurs occurs for
the 10% overpeaks with a 30 second hold tiae, but the effect is not clear for
the 10% overpeak with 300 second hold times.
Figure 5.55 shows the data obtained from the 649"C R-0.5 rctardation
tests. These results also show that increasing the amount of the overpeak
suppresses the influence of hold time in these types of cycles.
The crack growth data shown in Figures 5.54 and 5.55 have been replotted
on linear axes as a function of hold time for fixed values of Khold. The
results for the R-0.0 and 0.5 tests are shown in Figures 5.56 and 5.57,
respectively. These data can be compared to the constant AK data which did
not include overpeaks on each cycle. In the non-overpeak constant AK tests,
the crack growth rates varied linearly with hold time with the slope to the
linear relationship increasing with Khold level. The results from the R-0,
10% overpeak Alloy 718 test (Figure 5.56a) shows that there is a significant
influence of hold time for Khold values of 35 and 52 MPam, but that the
slnpas of the zrack growth rate with hold time are similar for these two
situations. This indicates that a significant amount of retardation is
occurring at the higher Khold levels. The results of the R-0, 20% overpeak
(Figure 5.56h) show the slopes are similar independent of Khold level which
results from the larger amount of retardation associated with the higher
overpeal.
-147-

140
44
~~~~~~~ E
1 1- P I1 ?
0
CL 0
N-
00
>0 0
0 '~ L0 00
0
* 41
a 0 j
T- 0
0 0> L)
0160.
(9CADWU NN- N
-148-
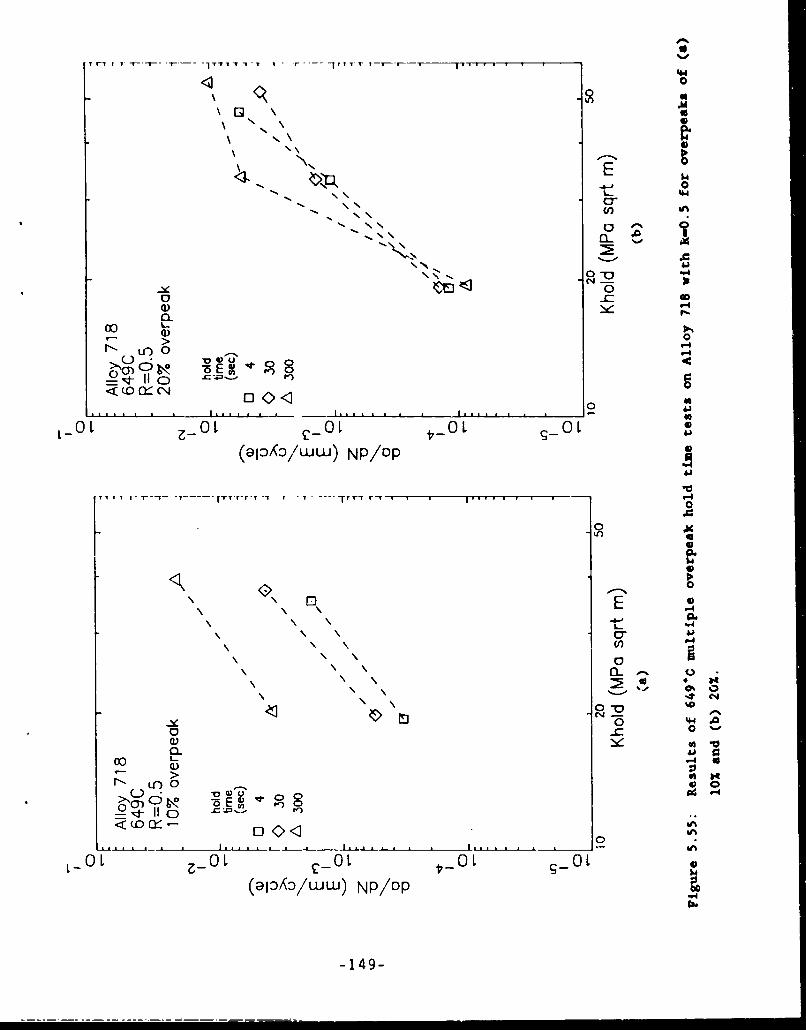
t1TV T1 T T T - T v ri r ir 7-r I T
'H00
00
'Kr
0-0AC1 0 30
0~
(L)00.
G) o 0
- C) A- *O
01 L 0 L-a 04.0L)
(@ICz40/'ww) Np/op
.00 A
00\ \ 00
\ \ ~-.,LP4
0 %a a %a0@ 0
\) 45 ('C'.)
o 44LO .C 0
0- a
L_ 0) L Z_0L0Lt-0L9 O
(9104/ww) NP/DPfa4
-149-

4
4
r r - - - I~-----~- .8 0
co'
>'*1
- -I '9. - 0.r
NP/()P
"4
C 2
0. - 0(fCl L. '
"4
-.00 0
9~00 WOzo *0 0 1;00 LO0 000,0(aIDA/WW) NP/Dp d L.0
-150-

AlA
-a -a
r Q
0.'
-Y 0f) 0
C)I
0L~r L00 2000 900,0 too~O WO'O 00010(QI(O/OWW) NP/D)P
400
0A 6
HIc 0
-8 o
U i
w "4
44 a
0 P4
CLU "4
0*
C)J
Z'o o- O1oO obo ;00o0 000*0
(alOADI W) NP/D
The results from the R-0.5 overpeak tests are shown on linear axes in
Figure 5.57. The overall trends are similar to those shown for the R-0 tests;
however, it appears that the amount of retardation is smaller with increasing
R-ratio.
-152-

6.0 MECHANISM STUDIES
This section of the report describes the experimental work performed to
better understand the mechanisms which control the time-dependent crack growth
of Alloy 718 and Rene'95.
6.1 APPROACH OF MECHANISM STUDIES
These experiments were intended to aid in the interpretation and modeling
of the crack growth behavior and can be divided into four areas:
1. fractographic examination
2. vacuum tests
3. metallographic sectioning experiments
4. characterization of crack tip damage zones
6.1.1 Fractographic Examination
As a crack grows through a material, the resultant fracture surfaces
leave a history of the deformation and fracture events. Although It is
difficult to describe the entire fracture behavior from fractographic
appearance, the changes in fracture mode with alloy, temperature, environment,
ano cycling conditions may provide clues as to the parameters which
participate in the fracture events. Fractography was performed on selected
specimens to better understand time-dependent crack growth.
6.1.2 Vacu= Tests
As reported in the literature survey, the time-dependent crack growth
process can be -'ascribed in terms of creep-fatigue-environment interactions.
It is almost impossible to separate creep-fatigue interactions; however the
environmental part can be eliminated by perforwing crack growth tests in a
high vacuum cnvironment. Crack growth tests were performed in the high vacuum
facility at GEAE to help understand the influence of environment on the

time-dependent crack growth process of these alloys. Fractography was also
performed on many of the vacuum test specimens.
6.1.3 MetallograDhic Sectioning Experiments
The threshold measurements showed that R-0, threshold values increase
with longer hold times and lower test frequencies. When those data were
presented, it was argued that this was consistant with creep-assisted crack
tip blunting or stress redistribution near the crack tip. Several threshold
tests were performed, duplicatit., selected conditiuas reported in Section 5,
except the specimens were not broken after reaching the crack growth
threshold. Metallographic sectioning was performed on these specimens to
examine the morphology of the crack tip.
6.1.4 Characterization of Crack TiR Damage Zones
During the Alloy 718 conscant AK tests, evidence of transient crack
growth behavior was observed (Figure 5.41). These observations we:-c o .-en
subjective in nature. During this part of the investigation, the size of the
transient zone was measured in both Rene'95 and Alloy 718. Individual Allcy
718 specimens were also tested in solely in air, solely in vacuum, and
sequentially in both air and vacuum to isolate the creep- and
environmentally-induced damage at the crack tip.
6.2 FRACTOGRAPHY OF SPECIMENS TESTED IN AIR
Scanning electron microscopy (SEM) was useo to study the fracture surface
morphology of selected Rene'95 and All,," 718 tebc specimens. For constant AK
hold time and frequency te~ts fractogLaphic examinatious were performed at
the specimer mid-thickness a.,. crack depths ct.:responding to the midpoint of
each Kmax-cycle type segment. These midpoint positions were determined from
post test crack length measurements and data analysis results. Accurate
location of these positions for SEM study was achieved using a traveling stage
controlled by a micrometer graduated In 0.001. - increments. The region used
to measure the crack groth treshold in decreasing AK threshold tests
-15t
was located in a similar manner. Constant load tests were examined at the
specimen mid-thickness for crack depths which sampled the entire region of
static crack growth. These positions corresponded to regular intervals of
crack length and were also located on the SEM using the traveling stage.
The fractographic results for tests performed in air are reported in four
sections. The first three present the observations for Rene'95 constant AK
(Region II), threshold (Region 1), and retardatio'n tests. The fourth section
describes the fracture appearance of the Alloy 718 constant AK test specimens.
Table 6.1 lists the Rene'95 specimens and associated test conditions used in
the fractographic study. Fractographic observations for the vacuum tests are
reported along with the vacuum data in Section 6.3.
6,2.1 Rene'95: Constant AK (Region I') Obser-ation,
The examination of constant AK, R-O, hold time specimens tested at 538,
593, and 649"C revealed fracture morphologies that ranged from entirely
transgranular to entirely intergranular. The results are summarized in Table
6.2 where the observations for all three hold times (4, 30, and 300 seconds)
are generalized for each Kmax level and temperature. T indicates a mode that
is entirely transgranular, I indicates a mode that is entirely intergranular,
and I + T indicates a mixed mode, where intergraaular failure is prominent.
As evident from the table, the combinatiorn of decreasing temperature and
higher Kmax resulted in an increased tendency for transgranular failure. It
was also observed for mixed mode cases that t.he amount of transgranular
failure decreased with increasing hold tice TAis behavior is illustrated in
the SEM micrographs of Figure 6.1, where the morphology for hold times of 4
and 300 seconds is compared for the two mixed mode cases; 538*C and Kmax - 20
MPa/m, and 593"C and Kmax - 44 MPa m. At both temperature - Kmaxcombinations, the 300 second hold time has resulted in more pronounced
intergranular failure.
As indicated by the asterisk in Table 6.2, slight evidence of
transgranular failure was also observed for the 4 second hold time region of
the 649"C test specimen. The SEM micrographs of Figure 6.2 compare the
-!55-

Table 6.1: Rene°95 Simple Cycle Specimens Evaluated in FractographicStudies
Test Temperature TestNumber ("C) R Type Variable
AF19 538 0.0 constant AK hold time
AF45 593 0.0 constant AK hold time
AF54 593 0.0 constant AK frequency
AF44 593 0.5 constat AK hold timeAF66 593 0.5 constant AK frequency
AF59 593 0.8 constant AK hold timeAFI2 593 0.8 constant AK frequency
AF5O 593 static thresholdAF70 593 static constant load
AF03 649 0.0 ronstant AK hold timeAF05 649 0.0 constant AK frequencyAF14 649 0.0 threshold 3 sec. cycleAF63 649 0.0 threshold 30 sec. holdAF06 649 0.0 threshold 300 sec. holdAP18 649 0.0 threshold 30 sec. cycleAF1O 649 0.0 threshold 300 sec. cycle
AF15 649 0.5 constant &K hold timeAF09 649 0.5 threshold 3 sec. cycleAF16 649 0.5 threshold 300 sec. holdAF23 649 0.5 threshold 300 sec. cycle
AF72 649 0.8 constant AK hold timeAF55 649 0.8 threshold 3 sec. cycleAF21 649 0.8 threshold 30 sec. holdAF30 649 0.8 threshold 300 sec. holdAF40 649 0.8 threshold 300 sec. holdAF69 649 0.8 threshold 300 sec. cycle
AF17 649 static thresholdAF60 649 static constant load
-156-

Table 6.2: Sumumary Of Rene'95 R-0 Fractography Results For Hold Time Test
Specimens
Temperature K mx(MPa,/m)
(*C) 20 max 44
538 l+T T T
593 1 I+T
649 1 1
*some evidence of transgranular failure
-157-

211
!-,Op
( bd
fr'l ', rv orp olo '.'' o
I I i 11 P -H RPTIO-' v ci ine r i s t t. s t e d i i it1r tTd c iiiIioII
f 1 t! ow lll % / sec ild ho d t ine cycl ( ) 1 * (: . I o
2ml. o)S c rd o d fM F e ,(c 9 6 . lyl &il'/ c o
ho IK d4 i nt-cvcIe. ai 1 43C i h Kml )S( 1l 1 T(
r:,< .c

a r
Inro aphs showingF Peg'Oi
11lipo gh, of cct10()secon
s p ii ,ii t

fracture appearance for the 4 second hold time segment of this specimen, wh~ch
appears slightly transgranular, Figure 6.2a, with those for the 30 and 300
second hold times, which are clearly lntergranular, Figures 6.2b and 6.2c.
inese detailed findings are consistent with the general trends described
above.
The fractographic observations for the.538*C hold time specimen
correlated with the peculiar trends observed in its crack growth behavior
(Figure 5.4a). At low Kmax, increasing hold time accelerated crack growth
rates and could be associated with an increase in the amount of intergranular
failure (compare Figures 6.1a and 6.1b). At the other Kmax levels, there was
either no hold time effect (intermediate Kmax), or a reverscd effect (high
Kmax) where increased hold time resulted in lower growth rates. The fracture
morphology for each hold time segment at these higher Kmax levels appeared to
be entirely transgranular. SEN micrographs for the 4 and 300 second hold time
regions at theso Kax levels are shown in Figure 6.3.
One possible explanation for the reduction in crack growth rates with
increased hold time at the high Kmax condition is that localized crack tip
blunting and/or stress redistribution is occurring. No evidence of this
phenomenon was revealed by the fractography; the morphology for the 300 second
hold time was similar to that of the 4 second hold time (Figures 6.3c and
6.3d).
There is also a correlation between fractographic observations and crack
growth behavior for the 593*C test (FiguLc ..41') Fcr the corditipn of mixed
mode failure (high Kmax; see Table 6.2), the acceleration of growth rates with
hold time could again be associated with an increase in the auount of
intergranular fracture. Fractography-crack growth behavior correlations for
the other Kmax levels of this test, or the 649"C hold time test, Figure 5.3,
are not possible since the fracture mode for these remaining conditions was
predominantly intergrar.2.ar It should be pointed out, however, that the
condition where slight evidence of transgranular failure was observed (649*C,
4 second hold time, high Kmax) again corresponds to the lowest growth rates at
that KMax level.
-160-

(a)
(C)
F I V LIr-e 63 SFM ml c rographs sho witip, Rel lon I I f r; t rrorpl olop" ot
Conlstanft AK, R-0 Rvute ') spe( iit-ei testtul iii air at) ,
cotnditionis of (a) Initermediate Ylax " second hold ti m. CYC(1P
(b) Intermediate Kmiax, 300) second hold time cycle. (c) high
Kinax. 4 second hold time cycle, and (d) high Kl.x 3(t)0 secorud
hold time cycle.

The study of constant AK, R-O, frequency specimens tested at 593 and
649"C also revealed a range in fracture morphology. Table 6.3 compares the
fractographic observations for the 593"C frequency and hold time test
speiflens. In this table tiere are two designations for mixed nade fracture,
I+T and T+I, representing more prominent intergranular or more prominent
transgranular failure, respectively. As was the case for the hold time
specimen, an increase in cycle duration typically promoted intergranular crack
growth. A noticeable difference in fracture mode between the hold time and
frequency cycled specimens, however, was observed at the low Kmax condition.
Table 6.3 shows that the frequency test specimen exhibited mixed mode
fracture, while the companion hold time specimen exhibited intergranular
fracture. These features are illustrated in Figure 6.4, where SEM micrographs
for 30 second cycle period and 30 second hold time at the low Kmax level are
compared. Note that the transgrartular regions for the frequency test specimen
are distinguished by flat fa.tes. As indicated in Table 6.3, the 30 secund
cycle period region contained the largest amount of transgranular fracture for
the frequency test specimen at the low Kmax level.
The fatigue mode characteristics of the frequency test can be correlated
with the observed crack growth behavior, Figure 5.9a. At low Kmax, there is
little effect of cycle period, and mixed mode fracture was observed. These
crack growth rates are also much slower than those observed for the hold time
test at this Kmax level, which exhibited intergranular failure for each hold
time. At all other conditions for the frequency test, there is a clear
influence of cycle period and a transition to completely intergranular
failure.
Under most conditions, the 649*C, constant AK, frequency specimen
fracture was similar to that of the companion hold time test. At low
frequency, however, mixed mode fracture was clearly evident at the high Kmax
level (the 4 second hold time segment exhibited very little transgranular
failure), and the intermediate Kmax level contained a slight amount of
transgranular failure (the 4 second hold time segment exhibited intergranular
failure). Figure 5.3 showed that the hold time test had faster growth rates
at these Kmax levels. The fractography results are again consistent with the
-162-
4,1
o
41
W4'
V
~t
-Vo
WO
0
0 00 4
~0Un
KJ0 o"
0
4,j.4
,w 0
0 c-
- 4 .4-C4C .4
0 Vcc
0.
-4 L
ovC£ 4C
-163- .
=i:: i i I I I I I I QI I I I

Table 6.3: Summary Of Rene'95 593"C, R-0 Hold Time and Frequency
Fractographic Observations
cycle hold
Kmax period fatigue time fatigue
(MPalm) (sec) mode (sec) mode
3 I+T 4 1
19 30 T+I 30 I
300 I+T 300 1
3 14I
21 30 1 30 I
300 I 300 I
3 T+I 4 T+I
44 30 I 30 I+T
300 I 300 I
-164-

trend for R-0, hold time and frequency test crack growth rates at a given Kmax
level to increase with increased amounts of intergranular fracture.
Increasing the R-ratio for 593 and 649C hold time tests resuIted in
intergranular fracture for all hold times and Kmax levels. As described
previously, some mixed mode failure was observed for the R-0 tests at these
temperatures.
The effects of R-ratio and frequency on fracture mode were only studied
for the 593"C tests. At an R-ratio of 0.5, the occurrence of transgranular
fracture was again diminished with increasing R-ratio. Although predominantly
intergranular, some transgranular failure appeared to be present at the
conditions where mixed mode was observed for the R-0 test (see Table 6.3).
For the R-0.8 test specimen, evidence of transgrar.ular fracture was further
diminished at the high Kmax level, but some transgranular fracture was
observed at the 3 and 30 6econd cycle periods for the intermediate Kmax level.
The R-0 and 0.5 specimens exhibited intergranular failure under these
conditions. The SEM mirographs of Figure 6.5, show the observed morphology
for the 3 second cycle period of the R-0 and R-0.8 specimens at the
intermediate Kmax level. A comparison of frequency and hold time effects on
crack growth rates for these R-ratios revealed that for comparable Kmax
cycle time segments, the presence of some transgranular failure in the
frequency test specimen was associated with similar or significantly reduced
crack growth rates.
The remaining description of Regio-n !I fracture -.,ode pertains to the 593
and 649*C static tests. Cracking for these specimens occurred in an
intergranular mode, independent of the test control technique (constant load
or decreasing AK). The 649"C constant load specimen selected for examination
was precracked with a ramp period of 3 seconds to reduce the initial AK. At
this condition, the crack would not propagate under static loading.
Subsequent 3 second ramp cycling was performed to grow the crack to a larger
size. It was necessary to increase the AK by nearly 50 percent to achieve
static crack growth. Study of this region revealed an intergranular fracture
mode both before and after the arrest position. This indicates that the
-165-

4 V
'4
Q-0
U
U
166-(

arrest was not caused by a change in fracture mode, and that again, the
possible occurrence of local crack tip blunting and/or stress redistribution
was not supported by fractographic observations.
6.2.2 Rene'95: Region I Observations
The fractographic study of Region I threshold specimens considered all
649°C conditions shown on Figure 5.19 except the 4 second hold time, R-0.8
condition. The fracture mode for all specimens except the 3 second cycle
period snecimen tested at R-O, was completely intergranular in the region of
crack arrest. For this exception, some isolated transgranular-flat faceted
areas were observed within a predominantly intergranular morphology. Figure
5.19 shows that this condition resulted in the lowest threshold of all cyclic
tests. The SEM micrographs of Figure 6.6 show the fracture morphology in the
region of uLek arrest for the R-O, 3 scond cycle period specimen, and ,Le
cyclic specimen having the next highest threshold. The latter specimen was
tested at R-0 with a 30 second hold time and exhibited intergranular fracture.
6.2.3 Rene'95: Retardation Test Observations
The 649"C, R-0, hold time specimen tested with a 20 percent overpeak was
selected for SEM study of Region II retardation effects. The fracture mode
for all Kmax-hold time combinations was intergranular. As previously
described, subtle transgranular fracture in a predominantly intergranular mode
was observed for the companion non-overpeaked specimen at the high Kmax level
2nd h second hzold rime condition. For this condition, the verpeak thus
promoted intergranular fracture. A much more noticeable difference between
the hold time fracture regions of the overpeak specimen and the companion hold
time specimen was observed at low magnification. The low magnifications SEM
micrographs in Figure 6.7 show the entire region of crack growth for both of
these specimens. As hold time duration increases at each Kmax level, the
non-overpeaked specimen exhibits a much more tortuous fracture surface.
-167-

10
0
i 00
410
0 -
u~ .'4 4g~ 4 4
PW1
0) -
o o.
44 4
1o68-
Fiur 6 . SE inc ogah shw n t. frcnr su fc•fc ntn K -
,,
Rene'95 hold t imp specimens tested In+ air at 1,/#()*c and c.ondit ions
of- (a) -3 an ( n';

6.2.4 Alloy 718: Constant AK (Region 11) Hold Time Observations
The R-0, constant Kmax, hold time specimens tested at 593 and 649*C were
be!'-ctcd for the SEM-study of Alloy 718 Region II morphology. The fracture
morphology at 593°C and the low Kmax level transitioned from mixed mode to a
predominantly intergranular mode as hold time increased. Figure 6.8 shows SEM
micrographs which illustrate the morphology for each low Kmax segment. As the
Kmax level increased, the tendency for intergranular failure with increasing
hold time diminished. Figure 6.9 shows micrographs for the 4 and 300 second
hold times at the intermediate and high Kmax levels. For the high Kmax level,
the 300 second hold time has resulted in negligible intergranular failure.
At 649"C, a trend in fracture morphology transition like that of the
593"C test was observed at the low Kmax level, but intergranular fracture
becawe more prevalent with increasing Kmax and hold time. The SEM ,aicrographs
of Figure 6.10 show the morphology for the 4 and 300 second hold times at the
intermediate and high Kmax levels for the 649"C specimen. Whereas the 593"C
specimen had negligible intergranular failure for the high Kmax, 300 second
hold time, Figure 6.9d, the 649C test exhibits complete intergranular
failure, Figure 6.10d. The effects of hold time on fatigue crack growth rates
were much more pronounced for the 649"C test at all Kmax levels. This
correlates with the pronounced increase in the amount of intergranular
fracture, particularily at the high Kmax level.
6.3 VACUUM RESULTS
Region II vacuum crack growth tests were performed on both Rene'95 and
Alloy 718. The selected test conditions are listed in Table 6.4. The intent
of these tests was to determine the role of the environment on the crack
growth rates and failure modes. This section will describe both the crack
growth data and fractographic examination results of specimens tested in high
vacuum.
-170-

15 un .1015 u In
(a) (b)
F igur 6.8:
S FM In1C2 roF ( r a p)- I I owi Ilp, R e j in o 1)
f riic t u r e lmio~ rhoIo !v o f c o is t ant i AK,
r.~~I R - I I ov / 1.8 s H ,lilh( i s 10 k, 0(i Ii i
lo I M )) 3 0 st- onnc d oI .i lilt cvs I
I O n; 1 ,c lo K0(011(1 O 1(1 ll ho ldV(
t i me Cv"C 1e

-
IV
(a) (b)
b 'e
15 -1511.
/.
4 . . 1 . ' 'I .4
(') '(t
Figure 6. 9: SEM nicrographs showing Region 1I fracture morpholoogv of
constant AK, R-() Alloy 718 specimen tested in air at ")30C anid
con(itions of (a) intermediate Kmax, 4 seconid hold time cycle,
(b) intermediate Kmax, 300 second hold time cycle, (c) high
Kmkx, 4 second hold time cycle, and (d) high Kax, 300 second
hold time cycle.
-*l 7-

'A :4 qSmm r~#
PAL
lip
%4/
Ilk.
''A
or-
c m I ;1 11 t A ,, k -( A I I (),- ' 181M( I i ', (- ,t e (I I ii LI I i I ( ( . I'
L' lndi t i () I IS Ci o I I i lit C tint' li t ilIV I " sec 1)1( ho I d t Iit c V
4r ' tC M a 0 )( 11( I " i w' I c VI 1 C anid ( () 111 gh i MI S (t( O II
hol t ci I i' t 4

Table 6.4: Vacuum Crack Growth Specimens
Temperature Hold Time
Material Specimen (C) R (sec)
Rene'95 AF26 593 0.0 0
Rene'95 AF71 649 0.0 0AF78 649 0.0 0AF76 649 0.0 300AF37 649 0.8 0
Alloy 718 A13-18 649 0.0 0A13-01 649 0.0 300
-174-
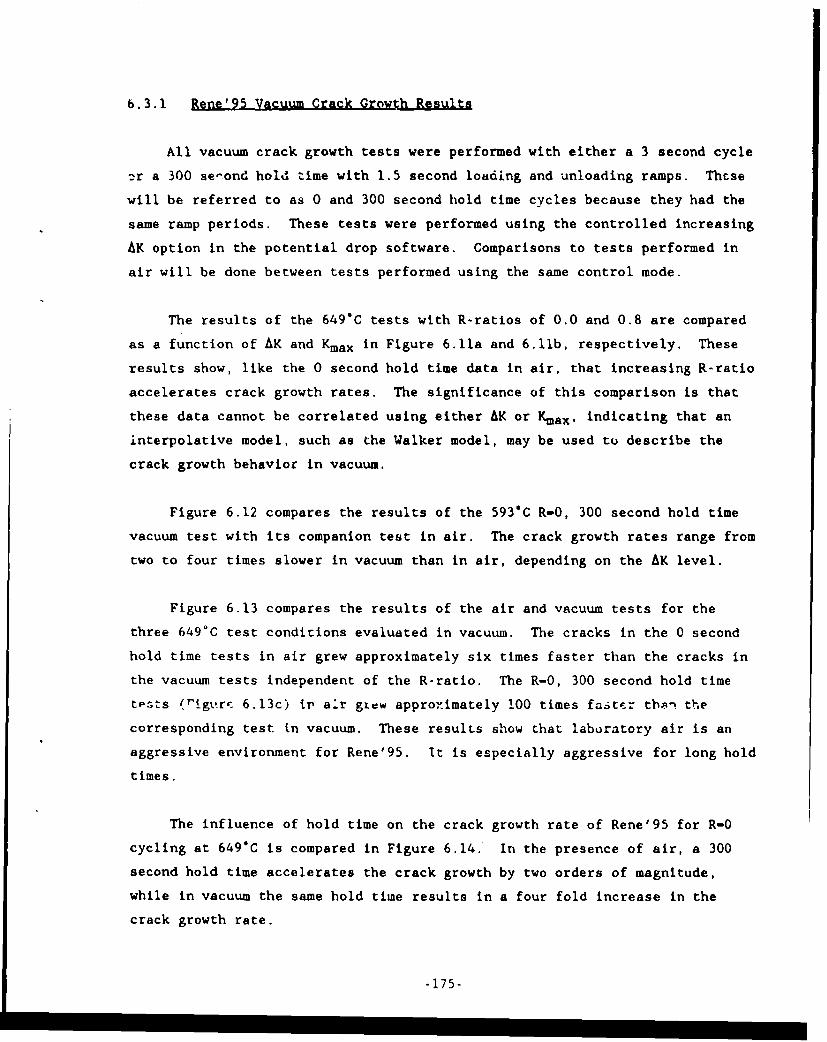
6.3.1 Rene'95 Vacuum Crack Growth Results
All vacuum crack growth tests were performed with either a 3 second cycle
or a 300 se-ond hold time with 1.5 second loading and unloading ramps. Thcse
will be referred to as 0 and 300 second hold time cycles because they had the
same ramp periods. These tests were performed using the controlled increasing
AK option in the potential drop software. Comparisons to tests performed in
air will be done between tests performed using the same control mode.
The results of the 649"C tests with R-ratios of 0.0 and 0.8 are compared
as a function of AK and Kmax in Figure 6.11a and 6.11b, respectively. These
results show, like the 0 second hold time data in air, that increasing R-ratio
accelerates crack growth rates. The significance of this comparison is that
these data cannot be correlated using either AK or Kmax, indicating that an
interpolative model, such as the Walker model, may be used to describe the
crack growth behavior in vacuum.
Figure 6.12 compares the results of the 593"C R-0, 300 second hold time
vacuum test with its companion test in air. The crack growth rates range from
two to four times slower in vacuum than in air, depending on the AK level.
Figure 6.13 compares the results of the air and vacuum tests for the
three 649'C test conditions evaluated in vacuum. The cracks in the 0 second
hold time tests in air grew approximately six times faster than the cracks in
the vacuum tests independent of the R-ratio. The R-0, 300 second hold time
tpts (rigvrc 6.13c) it air gxew appro-imately 100 times fastcr tb I the
corresponding test in vacuum. These results show that laboratory air is an
aggressive environment for Rene'95. It is especially aggressive for long hold
times.
The influence of hold time on the crack growth rate of Rene'95 for R-0
cycling at 649"C is compared in Figure 6.14. In the presence of air, a 300
second hold time accelerates the crack growth by two orders of magnitude,
while in vacuum the same hold tiwe results in a four fold increase in the
crack growth rate.
-175-
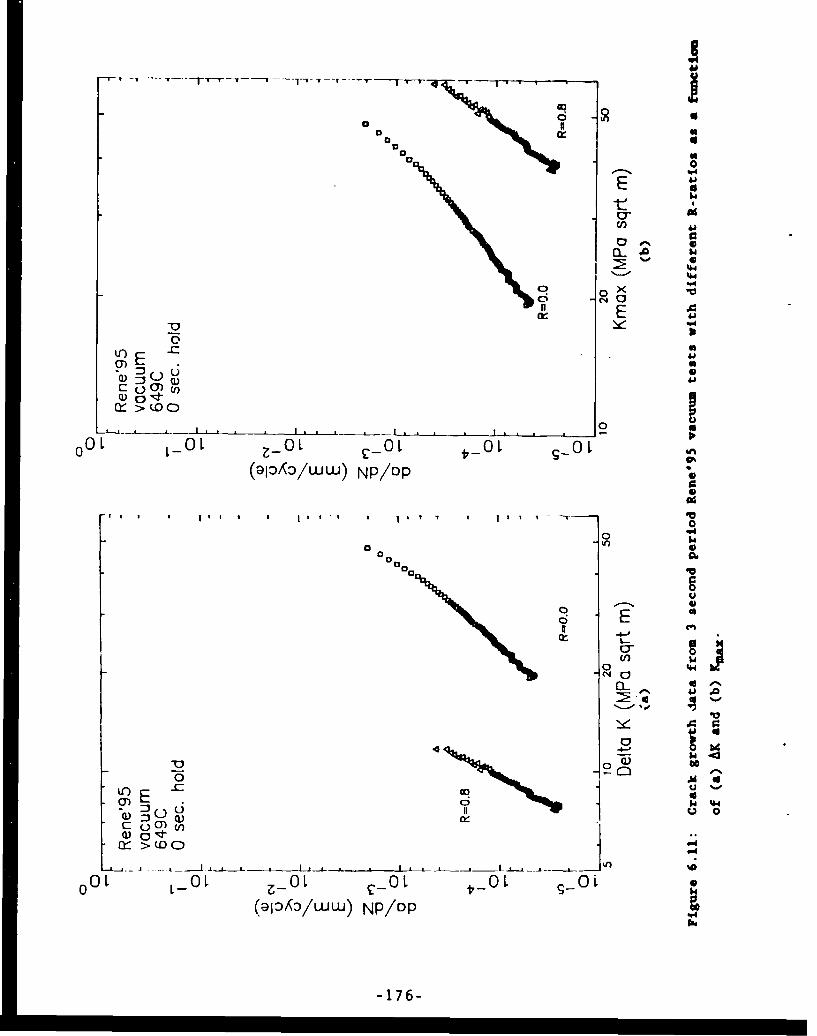
0 0
0 000
cT 4
'4
00
U-) p~a'
S00 (fl
0 L - L . -- O LO O
(91040/ww) Np/op
0
0 4
clEl
00LO p
0 Iwo:3 u Q:3 ak
0I L) Y.c'
(1) 0 ,q
Q- >(D (
%Db~
0 OL L- 0 Z- L OLOL 0
(DIDA/ww) P/Dp0
-176-,

Rene'95593CR=O.O
7 0 sec. hold0
U
0
E 0
a I DD a
0 air 00000 A0 0013100t) a
A
0I-
10 20 50Kmax (MPo sqrt m)
Figure 6.12: Comparison of Rene'95 crack growth rates measured in air and
vacuum for tests cycled at 593"C with R-0 and 0 second hold
time.
-177-

C 00 C
Rene'95 Rere'95649C 649CR=0.0 R=0.80 sec. hold - 0 sec. hold
OL -
E E
V .- 0 L
7o _ _ _ _ _
On~ 4
t0 20 " '0 20 soKmax (MPo sqrt m) Kmox (MPa sqrt m)
(a) (b)
0
Rene'95649CR=0.0 Figure 6.13:300 sec. hold aa -a
SComparison of _.,ne'95 crack growth
rates measured in air and vacuum foroj
E tests cycled at 6490C with (a) R-0Eaitd 0 second lold time, (b) R-0.8
[ or and 0 second hold time, and (c) R-0and 300 second hold time.
10 20 50
Kmox (MPo sqrt m)
(c)
-178-

0 D0
aE
o2 F0C w0
w C) -.- 1 a0
0 6 LO
.4 44
a4 0
x
04)
0 Z0
'.4
(9I~z/w)179D-.

The influence of test temperature on the R-O, 3 second cycle crack growth
rates in air and vacuum are shown in Figure 6.15. The crack growth rates are
faster in air, but the relative influence of temperature on the crack growth
rates is similar.
6.3.2 Alloy 718 Vacuum Crack Growth Results
The only vacuum crack growrh tests performed on Alloy 718 specimens were
at 649*C with R-0 and hold times of 0 and 300 seconds. Figure 6.16 compares
the results of the vacuum tests to the corresponding tests performed in air.
The presence of air accelerates the no hold time crack growth rates by a
factor of approximately three, while for 300 second hold times, this factor is
in excess of an order of magnitude.
Figure 6.17 compares these results as a function of the hold time. In
air, a 300 second hold time accelerates the crack growth rate by a factor of
approximately twenty. Hold time also accelerates the crack propagation rate
in vacuum, but to a much smaller extent.
6.3.3 Rene'95 Vacuum Tent Fractogravhic Observations
Three z ene'95 specimens were selected for SEM study of Region II fracture
morphology after vacuum testing: the 649*C, R-0, 3 second cycle period and 300
second hold time svecinens, and the 593*C, R-0, 3 second cycle period
specimen. Each was examined at Kmax levels corresponding to the companion
consLant Ymdx afr test specimens (low and intermediate Kmax fOL th- 6';90C
tests; all three Kmax levels for the 593*C test). At 649*C, the vacuum
tested, 3 second cycle period specimen exhibited transgranular fracture at the
low Kmax level and predominantly transgranular fracture at the intermediate
Kmax level. Under comparable conditions, the constant Kmax air test exhibited
predominantly intergranular failure (some cinor evidence of tranagranular
cracking was observed at the intermediate Kmax level), and similar crack
growth rates. The 649*C, vacuum tested, 300 second hold time specimen showed
intergranular failure, like the companion constant Kmax air test, but crack
growth rates were more than an order of magnitude slower. The growth rates
-180-
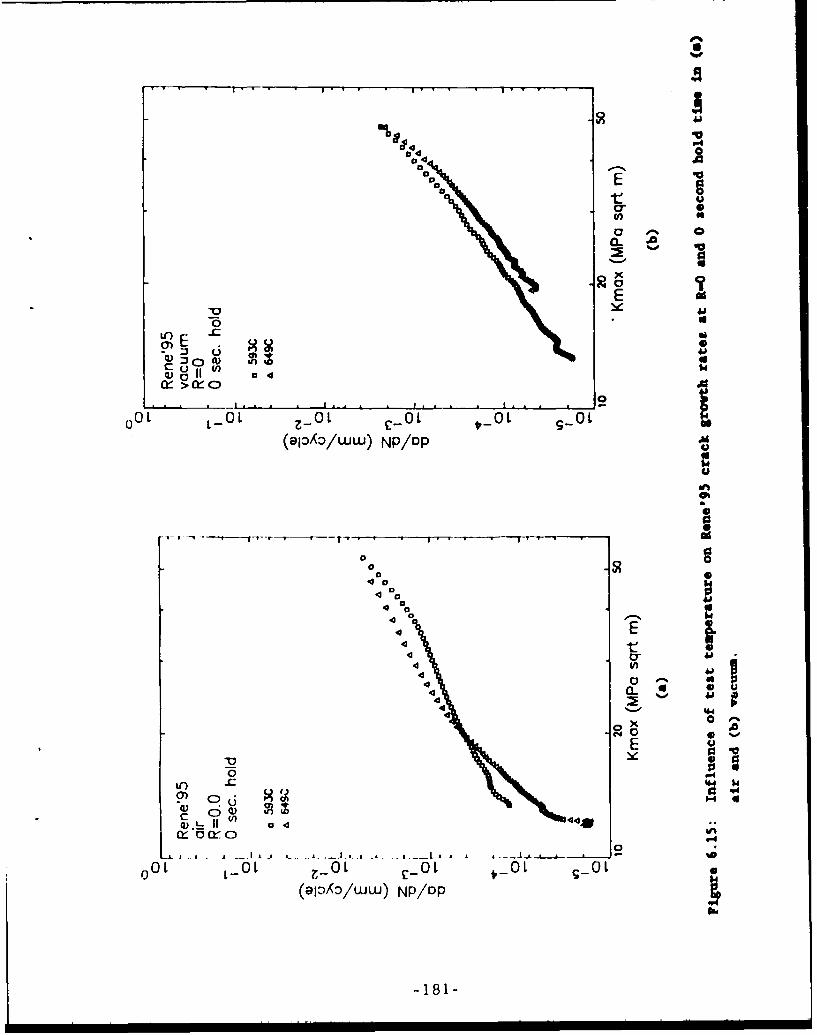
00 a
00
~~~ 0 '0 O to
o *0
V~ 0 0
00
0 0L ~0L 0-~ L . 0t ~ 0 a(;Dpz(D/JW) NP/P
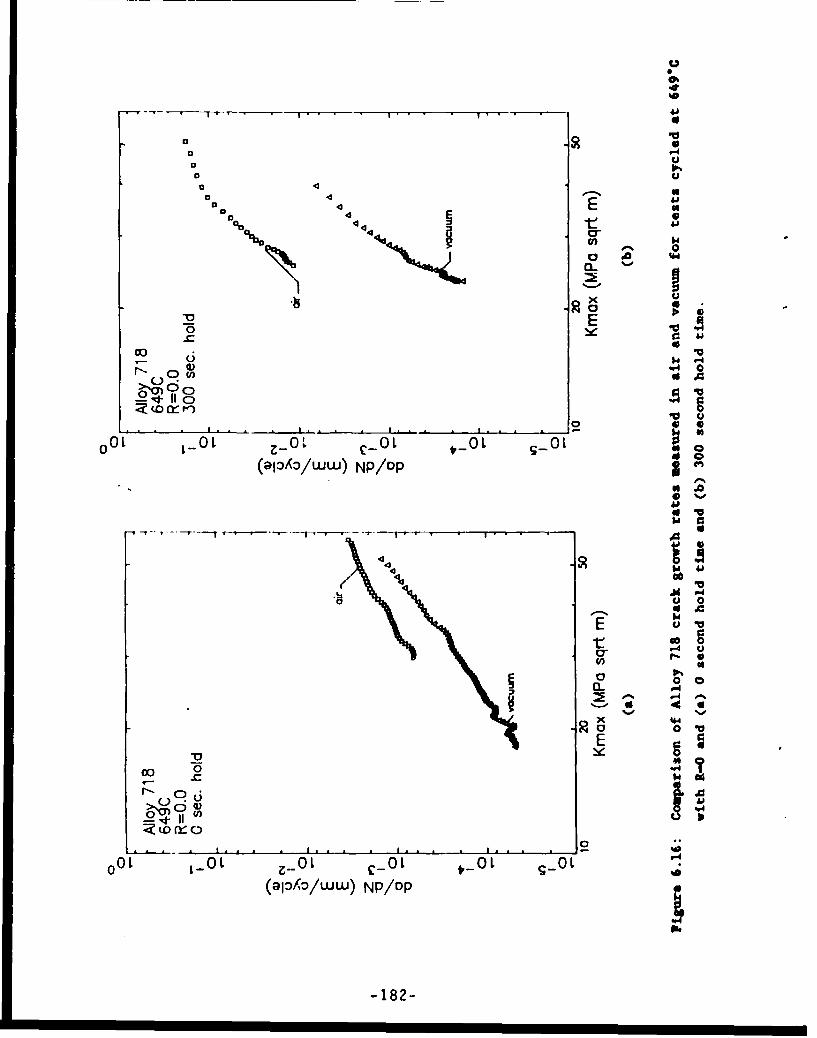
000
00
o I-i
o o4
0 44 0
10
r4 U)-% 0
N 4 4 4
'4
001 t t0 L 0 -0OL 0 t
(910A3/ww) NP/P
-182-

0 1.
000
EE
4
04 os
43.
43r
0
4 4
4 0~4E
00 0
0 440
'd- 11-
4
O183
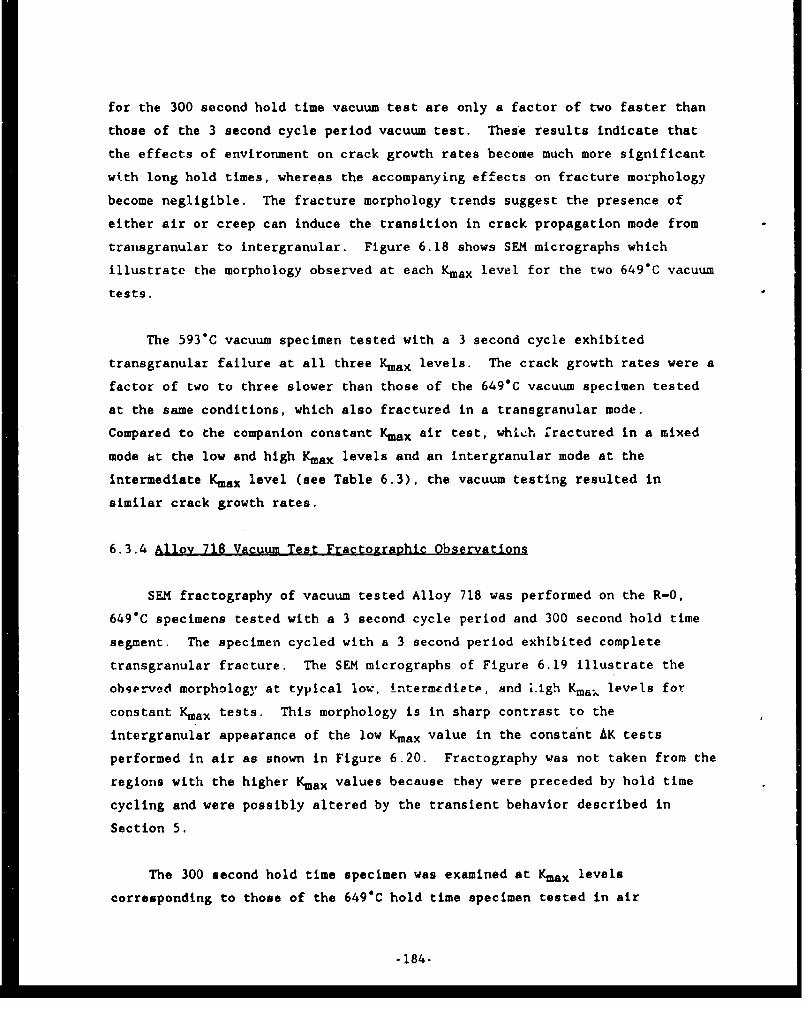
for the 300 second hold time vacuum test are only a factor of two faster than
those of the 3 second cycle period vacuum test. These results indicate that
the effects of environment on crack growth rates become much more significant
w.th long hold times, whereas the accompanying effects on fracture morphology
become negligible. The fracture morphology trends suggest the presence of
either air or creep can induce the transition in crack propagation mode from
tranagranular to intergranular. Figure 6.18 shows SEM micrographs which
illustrate the morphology observed at each Kmax level for the two 649% vacuum
tests.
The 593C vacuum specimen tested with a 3 second cycle exhibited
transgranular failure at all three Kmax levels. The crack growth rates were a
factor of two to three slower than those of the 649*C vacuum specimen tested
at the same conditions, which also fractured in a transgranular mode.
Compared to the companion constant Kmax air test, whih rractured in a mixed
mode at the low and high Kmax levels and an intergranular mode at the
intermediate Kmax level (see Table 6.3), the vacuum testing resulted in
similar crack growth rates.
6.3.4 Alloy 718 Vacuum Test Fractozraphic Observations
SEN fractography of vacuum tested Alloy 718 was performed on the R-0,
649"C specimens tested with a 3 second cycle period and 300 second hold time
segment. The specimen cycled with a 3 second period exhibited complete
transgranular fracture. The SEM micrographs of Figure 6.19 illustrate the
observed morphology at typical low, intermdliete, and i.1gh Kma; levPls for
constant Kmax tests. This morphology is in sharp contrast to the
intergranular appearance of the low Kmax value in the constant AK tests
performed in air as shown in Figure 6.20. Fractography was not taken from the
regions with the higher Kmax values because they were preceded by hold time
cycling and were possibly altered by the transient behavior described in
Section 5.
The 300 second hold time specimen was examined at Kmax levels
corresponding to those of the 649*C hold time specimen tested in air
-184-

AW~
I -m
44(P '
A0, ~ Ur
A (ji
18 F(.. n i;c;M n vi phs 5;lhow i rig, RegF.i oil I I f rac u ure ivorpro I or,% o f
I. ic 1uw;eR-() Rerre 9l) spec'i Hulils tcvst ed ill vnccrurn atl 6 490 and
C'OTIli t Ions of' (a) low K 2 %*3 (C T( CVC' k e (Iid h
fntermdiat(e K]iXIN 3 SeCOTId C.VC le period, (c ) low KmIx * 300
s;econd ho(l1d ti me cyvcle, and (d) into rined laIte KI."\ 300 seconld
1hold( t i no c Vt' 1

W, I 4~rv 6 11
f vc (uremorho r~vof - 44'
I p -i a'- Io
Kira
)SO

I i 15 U111'-'
Figure 6.20: SEM micrograph showing Region II fracture morphology for
constant AK, R-O Alloy 718 specimen tested in air at 649"C with
a 3 second cycle period (low Kmax level).
-1i8/-
(described in th&e previous section). Due the small: range in Kmax for the
vacuum test, the comparison was limited to the intermediate Kmax level. The
SEM micrograph of Figure 6.21 shows that intergranular fracture occurred.
Intergranular fracture was also observed for the 300 second hold-time segment
of the air test specimen at this Kmax level.
6.3.5 Discussion of Vacuum Results
The vacuum test results showed a strong influence of environment on the
crnrk growth rates as has been reported by previous
investigators( 1 2 "14 ,1 8 ,25,29). It was noteworthy that 300 second hold time
cycling mt 649"C in vacuum accelerated the crack growth rates relative to the
no hold time (20 cpm) cycling and resulted in a transition from a
transgranular to intergranular fracture mode for both Rene'95 and Alloy 718.
A 6iwilar change in fracture mode and crack growth rates was observed when
comparing zero hold time tests in air and vacuum. The Rene'95 crack growth
rate data for these three cycling condition are shown in Figure 6.22. In the
lowest crack growth rate condition, cracks grow in a transgranular mode.
Increasing the hold time in vacuum or changing the environment to air results
in a similar increase in crack growth rates and intergranular crack
propagation. These results suggest that intergranular crack growth can be
caused by either creep deformation or environmental damage. This behavior
suggests that there is a strong creep-fatigue-environment interaction during
the time-dependent crack growth in nickel-base superalloys. The five fold
acceleration in crack growth rate shown in Figure 6.22 is larger than
anLirpat-4 from the superposition concept and may suggest that 4nterg-snulsr
crack propagation is inherently faster than transgranular propagation.
Figure 6.23 shows the 649*C crack growth data for the same three cycling
conditions in Alloy 718. Again the condition with the lowest propagation
rates has a transgranular crack growth mode. Increasing the hold time in
vacuum or adding the influence of air increases the crack growth rate and
causes a transition from transgranular to intergranu. . failure. The crack
growth rates are not as similar for th6 latter two :)rditions in Alloy 718 as
compared to Rene'95; however, the overall trends are the same.
-188-

A
-AU
Figure 6.21: SEN micrograph showing Region I] fracture morphology of
K-increase, R-0 Alloy 718 specimen tested in vacuum at 649%*
with a 300 second hold time cycle (intermediate K level).
-189-

0
Rene'95649CR=O.O
0x air, 0 sec. holda vacuum, 0 sec. holda vacuum, 300 sec. holdQ)
o
U~ 0XEOX
zC ,p A0 x ,x X 613
xx x
0 6xl xxx
0
xLO x
0 I
10 20 50
Kmax (MPa sqrt m)
Figure 6.22: Comparison of Rene95 crack growth rates measured at 649C for
R-O cycling with 0 second hold time in air and vacuum and 300
second hold time in vacuum.
-190-

0-
I
Alloy 718649C
0
x air, 0 sec. holda vacuum, 0 sec. holdo vacuum, 300 sec. hold
(DD
° jE D
Zr
0
0-
0
10 20 50Kmax (MPa sqrt m)
Figure 6.23: Comparison of Alloy 718 crack growth rates measured at 6494C for
R-0 cycling with 0 second hold time in air and vacuum and 300
second hold time in vacuum.
-191-

6.4 METALLOGRAPHIC SECTIONING STUDIES
A metallographic study was performed to determine whether crack tip
blunting could be detected through metallographic examination of a crack. For
this study, Rene'95 and Alloy 718 specimens were subjected to threshold
testing using a R-0, 300 second hold time cycle. This test condition was
expected to promote blunting. Both specimens were left intact after the crack
arrested. The crack tip region was studied after step polishing in the
specimen thickness direction.
The optical micrographs of Figure 6.24a show the entire crack observed
fnr the Rene'95 specimen at approximately mid-thickness in a low magnification
montage. Figures 6.24b and 6.24c show high magnification optical micrographs
of the crack tip region before and after etching, respectively. From Figure
6.24a, it can be seen that the crack faces remain relatively tightly spaced
over the entire crack length. Near the position of crack arrest, several
discontinuous segments of cracking are present, Figure 6.24b, and the crack
tips of each of these segments, as well as short branched segments, appear
relatively sharp. The etched ricrograph of Figure 6.24c shows that the crack
was following an intergranular path.
The optical micro&raphs of Figure 6.25 illustrate characteristics of the
crack and crack tip region for the Alloy 718 specimen at approximately mid
thickness. The low magnification montage, Figure 6.25a, shows a relatively
large separation between the crack faces over the entire pre-arrest, steady
state growth nrea. Frot the high nagnification micrographz showing the crack
arrest'region, Figures 6.25b, 6.25c, and 6.25d, it can be seen that the
cracking is discontinuous and that prior to the end of the cracking, a large
grain has acted as an obstacle in the general propagation path. These
micrographs (Figures 6.25c and 6.25d) also show that the crack is following an
intergranular path and that the crack tips of various segments appear
relatively sharp (Figure 6.25b). It is evident, however, that the separation
between crack faces in the region of crack arrest is still relatively large.
-192-

200 um(a)
.~A.
* 'II.* ,,ii. .,
,- .*, . .
• '- r"" "
20urn , 20urn(b) (c)
Figure 6.24: Optical micrographs showing crack in K-shed, R-O kene'95
specimen tested in air at 649"C with a 300 second hold time
cycle; (a) low magnification view of entire crack, (b) high
magnification view of crack in arrest region (unetched
microstructure), and (c) high magnification view of crack in
ar.est region (etched microstructure).
-193-

. V
P MM
(a) *1m
(b) 4u
(c) (d)
Figure 6.25: Optical micrographs showing crack in K-shed, R-0 Alloy 718
specimen tested in air at 649GC with a 300 second hold time
cycle; (a) low magnification view of entire crack. (b) high
magnification view of crack in arrest region (unetched
microstructure), and (c) and (d) high magnification views of
crack in arrest region (etched microstructure).
-194-
Although evidence of blunted crack tips was not detected by the
metallographic study, several differences between the Rene'95 and Alloy 718
specimens were observed. The crack in the Alloy 718 specimen showed a larger
separation between its two faces and was subject to large grains acting as
obstacles for the preferred intergranular growth mode. Possible explanations
for the large separation include massive Mode II displacement giving rise to a
shifting of the crack faces (ie., one of the mechanisms believed to promote
roughness-induced closure), a large bending component for this specimen
geometry and loading condition, or a large amount of localized creep
deformation in the vicinity of the crack as it propagates and eventually
arrests. Since the separation appears too large for the Mode II related
explanation, and the bending component would be both small and elastic, it is
believed that localized creep was principally responsible for the wide crack
face separation. The large difference between the Rene'95 and Alloy 718
upecimens is consistent with the lower creep capability of Alloy 718.
6.5 MECHANISM TESTING PROGRAM
As shown in Section 5, the constant AK testing of Alloy 718 resulted in
some peculiar transients in crack growth rates when transitioning from 300
second hold time cycles to 3 second cycle periods. This section will describe
several additional experiments performed to investigate this behavior.
Examination of the data from Alloy 718 tests described in Section 5
showed that the transient zone could be described by the distance over which
r he vrack growth rat was accelerated. Tn Zhis repjrt, that dlbtanLc t'ill be
call a damage zone. This terminology does not imply anything about the damage
or the mechanism leading to the more rapid crack growth, but only that there
apparently is a zone of damage where the crack growth is more rapid. Figure
6.26 shows the size on this zone as a function of Kmax and R ratio for the
593"C tests previously described in Section 5. These data show that the zzne
increases in size with K level and R-ratio. The dependency on K suggests that
it to somehow related to the size of the plastic or creep zone around the
crack tip. The R-ratio dependency may suggest a high sensitivity to creep
deformation. The creep process would be interrupted with large amounts of
-195-

0
Alloy 718593C
* 300 sec. hold
R=0.8 A
E
LW*Z d0
SR=0.5
0
CI0
R=0.0
0
010 20 3040
Kmax (MPa sqrt m)
Figure 6.26: Variation of damage zone size with R-ratio and Yme for Alloy
718 cycled at 593'C with a 300 second hold time.
-196-
cyclic loading (low R) and therefore the size of this zone would be small.
This size effect trend does not rule out the possibility of a high diffusivity
zone where an embrittling species (presumably oxygen) could create a low
ductility region at the tip of the crack.
To further investigate the development of this zone, crack growth
experiments were performed where constant AK segments with hold times of 4,
30, and 300 seconds were separated by segments with 3 second cycles. This is
shown in Figure 6.27 for an Alloy 718 test performed at 649"C with a R-ratio
of 0.0. After the 300 second hold time segment, another 3 second cycling
segment was performed. The specimen was then held at zero load for a period
of six to eight hours. The intent of this zero load hold time was to
determine if a damage zone would form by diffusion of the damaging species
into the crack tip zone. It would have been more desirable to do this under a
small load, but concern about static crack growth ruled out the ube of applied
loads. After the zero load hold, a final 3 second cycle period was performed.
Tests of this type were conducted using Rene'95 and Alloy 718 specimens heated
to 593 and 649°C. The specimens were cycled at R-0 with a Kmax of
approximately 30 MPatm. The size of the damage zone was measured after each
hold time segment. These results are shown in Figure 6.28. Increasing
temperature and hold time duration increased the size of the damage zone. The
zones were much larger in Alloy 718 than in Rene'95. No damage zones could be
detected in the Rene'95 test performed at 593"C. No damage was detected after
any of the zero load hold time exposures independent of test temperature or
material. These results further suggest that the zone is related to time
dependent def!rmation (creep) anO nvL tc i.he diffusion of some e~abrittling
species into the deformed zone at the tip of the crack; however, crack closure
could prevent the crack tip from being exposed to the environment.
The environment can be eliminated by performing tests in vacuum, so the
transition from 300 second hold time cycling to 3 second period cycling was
investigated using all four combinations of air and vacuum on Alloy 718
specimens cycled at R-0 with Kmax- 40 MPam. These results are shown in
Figure 6.29. The damage zone was only observed when the 20 cpm cycling was
performed in air, independent of whether the hold time cycling was performed
-197-

Alloy 718649CKmax =31R=O.O
6.6 hourShold at
zwo load
C.)
00
0 11o p I p
0 1000 2000 3000 4000 5000 6000 7000cycles
Figure 6.27: Variatiop of crack length with cycles for damage zone experiment
in air.
-198-
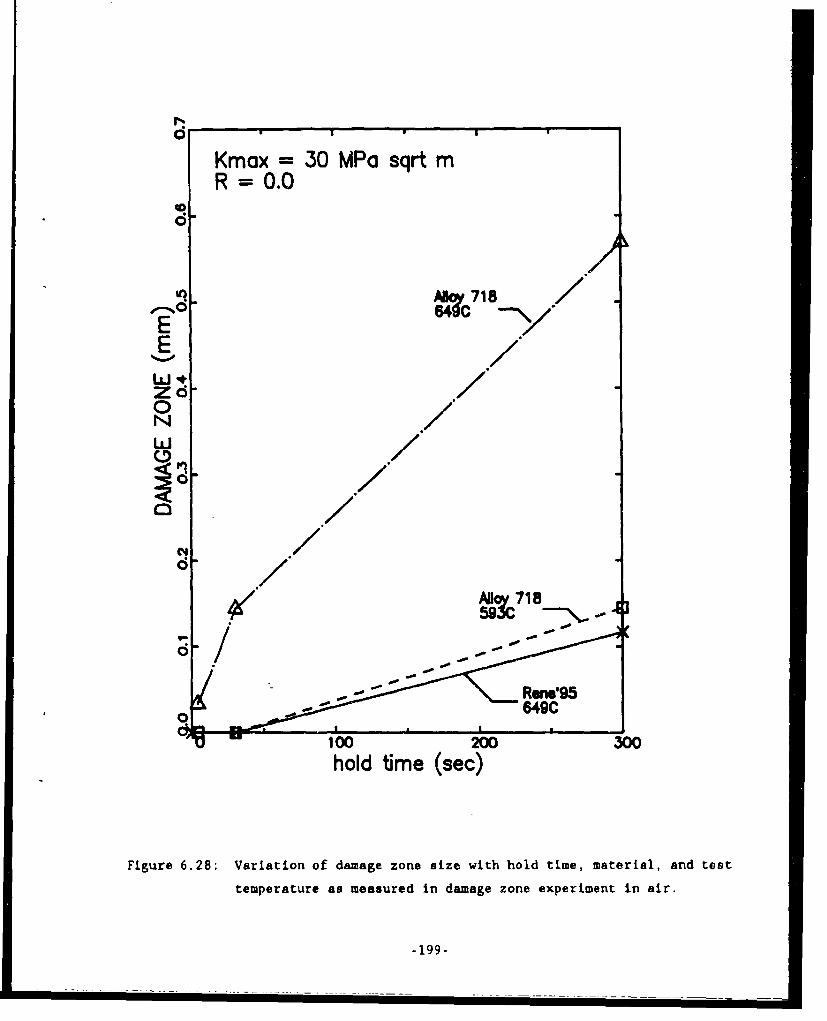
Kmax = 30 MPa sqrt mR=0.O
0
M 7 7187/
67
.. 70 /N U.7
.7.7/
M5j9YC718
- Rem'950 649C
100 200W0hold time (sec)
Figure 6.28: Variation of damage zone size with hold time, material, and test
temperature as measured in damage zone experiment in air.
-199-

u
000 11 DO
41 $
0U
)t U
541
04
4:
OD~ GoU
0o0
Ix ism
4V
-200-
in air or vacuum, The damage zone was never observed when the rapid cycling
was performed in vacuum. These data suggest that a damage zone is created
during the 300 second hold time cycling no matter what the environment, but
for the accelerated crack growth to occur oxygen must be present at the crack
tip during the rapid cycling. These experiments further document the close
interaction between creep and environment in the mechanisms of time-dependent
crack growth.
Another interesting behavior which occurred in the tests performed in
tiis investigation was the tunneling of the cracks where crack growth was
faster in the interior of the specimens relative to that along the specimen
surface. The amount of tunneling was quantified by measuring the difference
between the crack length at the mid-thickness position and the average of the
two surface crack length measurements. An increase in this value corresponds
to a larger difference between the surface and center crack lengths and thus
more tunneling. The results for the R-0 and R-0.5 constant AK and retardation
tests are reported in Table 6.5. These measurements came after the highest
Kmax or K.1 300 second hold time segment and have similar values of Kmax or
Khold. These results show that increasing temperature and R-ratio increases
the amount of tunneling. The tunneling is also more pronounced in Alloy 718
than Rene'95, the more creep resistant material. These data also show that a
10% overpeak has either little effect or increases the amount of tunneling
relative to the non-ovepeak, constant AK results. The 20% overpeak tests
exhibit less tunneling that the 10% overpeak tests. It was also noted in the
threshold tests that the amount of tunneling increased with hold time, cycle
pcriod and Vax level.
The non-overpeak results show that increasing the amount of time for
creep deformation results in more tunneling. This trend is identical to the
damage zone sizes. This suggests that the criterion for crack advance is very
sensitive to state of stress. The center of a through crack specimen is much
closer to a plane strain condition than the surface location which is very
close to a plane stress condition. The lack of constraint in the plane stress
loading apparently results in significantly lower crack growth rates. This
suggests that the models developed in this investigation for the growth of
-201-

Table 6.5: Crack Curvature Data
Rene'95 Alloy 718
5930C 649*C 593*C 649*C
simple cycle 0.45 0.89 0.37 1.72
R-0.0 10% overpeak. 0.43 0.84 1.80
20% overpeak 0.40 0.29 0.55
simple cycle 1.06 1.18 1.18 1.63
R-0.5 10% ovurpeak 0.96 1.64 3.61
202 overpeak 0.66 0.38 2.12
-202-

through cracks may have to be modified significantly if they are to be applied
to surface cracks.
The amount of tunneling in the retardation tests is very interesting.
The value of Khold in theses tests were similar to the Kmax values in the
constant AK tests, so the values of Kol were higher. The larger amount of
tunneling sometimes observed in the 10% overpeak tests suggests that creep
deformation is related to the maximum value of K in the cycle and not
necessarily the K during the hold time. The decreased amount of tunneling in
the 20% overpeak tests combined with the detection of the transient damage
zones in the Alloy 718 retardation tests suggests that although creep
deformation is occurring during hold time following the overpeaks, but that
the retardation is suppressing the static crack growth. The possibility of
creep-induced stress relaxtion during this type of cycle may help to
racioLalize the larger effect of small overpeaks on static crack growth
relative to cyclic crack growth.
6.6 DISCUSSION
fractographic study of Rene'95 specimens tested in air indicated that
cyclic crack growth is associated with transgranular fracture while static or
time dependent crack growth is associated with intergranular fracture.
Transgranular fracture was observed for the 538C, 20 cpm test, which
represents nominally cyclic behavior, while intergranular fracture was
observed for the 593 and 649*C static tests. The fractographic study of
specituens ce:ted under a wide range of test conditio-s at 593 am; 649*0 qhc'ged
trends in fracture morphology that were consistent with these results. As
hold time or cycle period increased for a given Kmax , it was typically
observed that transgranular fracture diminished. In the comparison of
frequency and hold time effects, it was also typically observed that the hold
time cycle promoted intergranular fracture. The difference in fracture mode
under cyclic and static conditions suggests that superposition is the
appropriate approach for modeling time dependent crack growth.
-203-

The fractographic studies also revealed evidence of a competition between
static crack growth damage mechanisms and creep-induced crack tip blunting or
stress redistribution. As Kmax level increased for the 538"C test, the
fracure morphology for the 300 second hold time cycle transitioned from
predominantly intergranular to entirely transgranular. It was also observed
that the high R-ratio, 593*C frequency test showed increased evidence of
transgranular fracture. In all other cases, increasing the R-ratio diminished
transgranular fracture. These findings indicate that cyclic behavior has
dominated conditions where more pronounced static behavior would be expected.
The trends in R-0.8 threshold behavior also suggested the presence of
competing mechanisms. As hold time increased, the threshold initially
diminished as expected for a more pronounced influence of static damage, but
reversed this trend for the 300 second hold time condition. This suggests
that a creep-induced blunting or stress redistribution mechanism may become
more dominant than a static damage mechanism for cycles with long hold times.
Metallographic sectioning of an Alloy 718 threshold crack growth specimen
cycled at 649"C with a 300 second hold time showed no evidence of localized
crack tip blunting, but there was a relatively large crack opening over the
entire length of the crack. This suggests that creep-induced stress
redistribution may be more important than localized blunting. Stress
redistribution would locally relax the stresses at the crack tip so that
larger applied loads would be necessary to propagate a crack. The influence
of this type of mechanism would be most easily observed for low crack growth
rates where the relaxation can occur over a significant period of time without
the crack growing through the relaxation zone. This is a potential
explanation for the trend of increasing threshold values w'th incre.,sing
frequency or hold time for the R-0 tests. Further evidence of stress
relaxation and redistribution was observed in a 649"C static test where a
significant increase in AK after steady growth in a 20 cpm precrack was
necessary to promote static crack growth.
Hold time crack growth experiments on both Alloy 718 and Rene'95
specimens resulted in accelerated crack growth and intergranular fracture
modes. The damage zone experiments strongly suggest that damage is created by
creep, but must be activated by the environment. Both sets of experiments
-204-

suggest that the time dependent crack growth process in nickel-base
superalloys is caused by a complex interactions between creep, fatigue, and
environment.
The results of the mechanism tests strongly suggest that creep induced
deformation can result in both localized stress relaxation and damage zones.
Linear elastic fracture mechanics does not describe the apparent stress
relaxation behavior. It may be necessary to use nonlinear fracture mechanics
parameters to model the time dependent crack growth for situations which are
dominated by the stress relaxation phenomenon.
-205-

7.0 CRACK GROWTH MODELING
This section of the report will describe the models used to determine the
tiue-dependent crack growth behavior and their application to predict the
649*C crack growth data of Alloy 718 and Rene'95. A description of a computer
code which implements the models will also be described. This description
preceeds the comparison of the predictions and experimental data because the
code was used extensively throughout those evaluations.
7.1 CRACK GROWTH MODELS
Four basic models were developed or utilized during this investigation:
1. interpolation model of the threshold behavior
2. interpolation model of time-dependent crack growth
3. superposition model of crack growth
4. retardation model
Each of these will be discussed in seperate sections. The threshold model was
common to both the interpolation and superposition model and the retardation
model is applicapable only to the superposition model.
The sigmoidal (Knaus) crack growth equation was selected for describing
the crack growth behavior in both the interpolative model and the cyclic
portion of the superposition model. This selection was made because of the
ability of the sigmoidal equation to independently adjust the portions of the
crack growth curves (Regions I, II, and III). The Sinh curve is symmetric
relative to its inflection point, so as the threshold is increased, the
apparent toughness (onset of Region III) is also reduced. Based on the
observed changes in threshold with R-ratio, cycle period, and hold time, it
does not appear that the Sinh model can accurately model this behavior. The
inablility of the Sinh equation to adequately treat these phenomena primarily
results from having four constants rather than the six in the sigmoidal
equation. The number of variables in the Sinh equation could be increased to
obtain the additional flexibily which already exists in the sigmoidal
-207-
equation. This approach was not taken because the resulting equation would
probably have many of che same characteristics as the sigmoidal equation. In
addition, there is a relatively large experience base with the sigmoidal
equation to model the transitions between the various parts of the crack
growth curve.
7.1.1 Interolation Model Of Threshold Values
Variation of the threshold behavior with hold time and cycle period were
highly dependent on the R-ratio of the cycle. It appears that this results
from the competition between static crack growth and stress redistribution
near the crack tip. This competition cannot be treated explicitly using
linear elastic fracture mechanics (LEFM) principles, so it was approximated
using an interpolative model with LEFM parameters.
The model was developed in terms of the R-ratio (R), the cycle ramp time
(V) and the hold time (T). Using this nomenclature, T equals zero for the
frequency tests and V equals 3 seconds for the constant AK hold time tests.
The form of rhe interpolation model equation was developed based on several
limiting cases:
1. As V and T approach zero, the influence of R will follow a Walker
type relationship.
2. For static crack growth (V-O, T approaches infinity, and R
approaches unity), the threahold value should approach the static
threshold (Kth)s.
3. The increase in threshold with V or T should increase with R :atio
as was observed in experiments.
-208-

The equation developed to meet these boundary conditions is:
(Kth)max - (Kth)s + IK(-R)"0 - (Kth)s]exp(-AV-BT)
+ C (1-R) ln(l+DV+ET) (7.1)
where Ko - (Kth)eff for cyclic (non time dependent) loading
(Kth)s - static crack growth rate threshold
A,B,C,D,E - material constants
The second term of this expression diminishes with more time-dependent
conditions (increasing V and/or T) so that (Kth)max approaches (Kth)s. The
third term results in an increase of (Kth)max with more time-dependent
conditions. The amount of this increase diminishes with increasing R-ratio.
The concept behind this approach is that cyclic plasticity will generate
mobile dislocations which may then enhance the ability of the material to
creep. Although this seems correct, it is not known to have been demonstrated
experimentally for this materials.
This expression meets the three boundary conditions described above. For
non time dependent conditions(V-0, T-0), the exponential term is unity and the
logarithmic term is zero so Equation 7.1 reduces to
(Kth)max - Ko(l-R)"m (7.2)
which is identical to the Walker relationship. For static crack growth, the
second and third terms in Equation 7.1 are zero so (Kth)max is equal to
(Kth)s.
The values of the constants KO , m, and A through E were evaluated using
nonlinear optimization techniques. This value of (Kth)max was then used in
the interpolation model.
The threshold value calculated using the interpolation threshold model
was used as the threshold value for the cyclic crack growth curve. This
required adjustment of the cyclic crack growth constants so not to alter the
-209-

Region II cyclic crack growth rates. The values of B and Q were changed so
that the position of the inflection point and the crack growth rate at the
inflection point did not change. The values of P, D and Kc were not altered.
Using the nomenclature introduced during the literature review (Section 2.0),
the log of the inflection point (xi) can be expressed in terms of the log of
Kth (xo ) and the log of Kc (xf)
xi - [xfIQ + xo/(-D)] / [/Q + .(-D)] (7.3)
By fixing the inflection point (xi) and adjusting the threshold according to
the threshold interpolation model to xo', a new value of Q (Q') can be
calculated by rearranging Equation 7.3:
Q' - [(xf-xo')/Q + (xo-xo')/(-D)] / (xf-Xo) (7.4)
The log of the crack growth rate (y) is expressed as
y - B + P (x-xo ) + Q[log(x-xo)] + D[log)xf-x)] (7.5)
The new value of B (B') can be determined by setting x equal to xI and
requiring that y at the inflection point (yi) be identical with the new and
old values of Kth, B, and Q. It can be shown that
B' - yi + PZ7/Q' + Q' log(Z/Q') - D log(Z./(-D)) (7.6)
whore Z - (nf-xo) / (iQ' + J(-)))
This approach was utilized to adjust the cyclic crack growth curve for
the changes in time-dependent threshold. Sample calculations were performed
using the cyclic curve generated for Rene'95 at 649*C with several higher
values of thresholds. The results of these alterations are shown in Figure
7.1. The ability of this approach to increase the threshold without
significantly influencing the Region II crack growth rates illustrates the
flexibility of the sigoidal crack growth equation.
-210-

0
.0
U ' DE EI
toL
0
0
0
00
I'
0
5 10 20 50Keff (MPa sqrt m)
Figure 7.1: Sigxoidal crack growth rate curve adjusted to permit static
crack growth below the static crack growth threshold.
-211-

7.1.2 Interoolation Model
The interpolative model developed in this program was based on the
sigmoidal (Knaus) crack growth equation where che value of K was replaced by
the maximum value of K in a cycle (Kmax). The expression developed in the
interpolative threshold model was used for (Kth)max. The values of Kc and D
were held constant. K. sets the cyclic toughness and D controls the
transition between Region II and III crack growth. Neither of these will
influence the portion of the crack growth curve which has a significant
trfluenre on residual life.
The values of B, P, and Q were permitted to vary according to the
following equations:
B - B1 + B2 ln(l-R) + B3 ln(l+V) +B4 ln(l+T)
P - P1 + P2 ln(l-R) + P3 ln(l+V) +P4 ln(l+T) (7.7)
Q - Q1 + Q2 ln(l-R) + Q3 ln(l+V) +Q4 ln(l+T)
This formalism was the same formalism used in the Sinh interpolation model
developed in previous investigations.( 3 6 "38 ). The constants for B, P, and Q
comprise an array of 12 coefficients. The values of the array were determined
from the available crack growth data using nonlinear optimization techniques.
It should be noted that in essence, this type of model is primarily an
empirical curve fitting approach. The interpolative models for B, P, and Q do
not directly consider the mechanisms which control time-dependent crack
g. o0: Lh.
7.1.3 SuDeroosition Model
The superposition used in this investigation is based on the linear
superposition approach reported by Wei and coworkers(4 5' 4 6 ). This model was
evaluated by using the static crack growth data to model time-dependent crack
growth. It should be noted that with this approach, no hold time or low
frequency test data were used to determine any material properties.
-212-

The static crack growth rate curve was represented using a Paris
relatiopship. This permitted closed form integration as first reported by
Christoff(21) and presented in the literature review section of this report.
Two modifications were made to this approach. The first was the inclusion of
the static threshold and not permitting static crack growth below (Kth)s.
This process is shown in Figure 7.2 for a triangular shaped cycle with a
R-ratio of zero. The entire loading cycle is indicated by dashed lines. Only
the portion above the static threshold (indicated by the solid line), will be
permitted to coutribute to static crack growth. This is rather easily
accomplished by adjusting the R ratio and changing the time integration
interval.
The second modification was a slight change in the integration procedure
developed by Christoff(21 ). The modification included the fact that K
increases as the crack grows. This has an almost negligible effect when the
time-dependent portion of the calculation is small. This is not the case for
some of the very rapid crack growth rates measured during long hold time and
low frequency tests in this investigation. This was accomplished by assuming
that for any specific loading situation, K is proportional to the square root
of the crack length.
K - (Kl+ K t) J(a/ao) (7.8)
where a - current crack length
a. - crack length at the start of the loading
segment
K 1 - K at the start of the loading segment
AK - the change in K during the loading segment
-213-

I p
staticthreshold
/\/\
CII
~/\
L I
0N //\
/\
/\
// /
/\/\
0 10O0 200 300time (sec)
Figure 7.2: Schema~tic diagraum of uperpoition model including a static
crack growth threshold.
214-
: :i .. . . / . .. . i : i . . . . I : [ . .. . I. . .I. . . . :

Integration of Equation 7.8 results in
ha/ao - [1 + (2-n) CF Kmaxn T]2/(2-n) -1 (7.9)
where F - 1 for hold times
F - [ (1 - R(l+n)) / (1 - R)] / (1 + n) for ramps
T - time duration of loading segment above (Kth)s
Kmax - the maximum K in the loading segment
R - actual or adjusted R ratio
and C,n - Paris constants for static crack growth
It can be shown by series expansion that as the second term in the brackets of
Equation 7.9 approaches zero, this expression is identical to those developed
by Christoff(21). The function F in Equation 7.9 has the same effective time
relationship for loading ramps as shown in Figure 2.4.
7.1.4 Retardation Model
The retardation model used in this investigation was a modified
Willenborg model developed for cyclic retardation of nickel-base
superalloys(4 9). The Willenborg model described in the literature review
section was modified reflecting some of the experimentally observed behavior.
The two most significant changes were that the distance over which retardation
was observed was equal to twice the overpeak plastic zone (rol) where rol was
defined to be
rol - (1 / 2f) (Kol/Uy)2 (7.10)
This result was very similar to that reported by Mills and Hertzberg(7 1) in
aluminum alloys.
Another frequently reported event was observed immediately after the
overpeak, where the crack growth rates decreased rapidly to a minimum followed
by a gradual increase to the non-retarded value such as previously shown in
Figure 5.31. The original Willenborg model predicts an instantaneous drop in
-215-

K following the overpeak, but data like that shown in Figure 5.31 indicates
that the drop is more gradual. Examination of data of this type for several
materials, test temperatures, overpeak ratios, and Kmax levels showed that the
distance of the minimum in ciack growth rate occurred at ((rp)old)/2 , half the
plastic zone size as calculated with the K prior to the overpeak. Presumably
this is a zone which had been damaged prior to the application of the
overpeak.
The modified Willenborg model developed for nickel-base superalloys
altered the distance Amax over which the retardation would occur and included
the gradual rather than instantaneous drop in Kred. The modified Willenborg
equation reflecting the change in Amax is
Kred -(Kol [2 r0 12 -(rol-(rp)n)A] / [2 r0 12 ] Kmax)# (7.11)
The maximum value of Kred occurs when A - ((rp)old)/2 and equals
(Kred)min - (Kol (2 r0 12 -(rol-(rp)n)(((rp)old)/2) / 2ro1
2 - Kmax )# (7.12)
It is more convenient to represent these expressions in terms of the terms T1
and T2
Kred - -T1 -2 Kmax) # (7.13)
When A is greater than ((rp)old)/2
T1 - i 1 (1 r, 1 2 -(roi-(rp)n)A / 2rol 2
and T2 - 1 (7.14)
At A -((rp)old)/2
(Tl)min -Kol (2 r0 12 -(rol-(rp)n)(((rp)old)/2) / 2rol 2
and (T2)min - 1 (7.15)
As a mission analysis is performed, the values of T1 and T2 are saved for
later use. When a new overpeak is applied the values of T1 and T2 vary
linearly with A starting with the old values ((T1)old and (T2)old) for A
-216-

equals zero and equalling (Tl)min and (T2)min when A equals (rp)old/2 . When A
is less than (rp)old/2
T - (Tl)old (1 - 2A/(rp)nold) + (Tl)min 2A /(rp)nold
and T2 - (T2)old (1 - 2A/(rp)nold) + 2A /(rp)nOld (7.16)
With frequent repetious overpeaks so that the crack growth increment is
less that (rp)nold/2, the value of (T2)old approaches unity. Under this
circumstance the value of Kred can be approximated by (Kol - Kmax) .
The solid lines in Figure 7.3 illustrates the variation in K predicted by
this model for a single overpeak. The dashed line illustrates the case for
closely spaced multiple overpeaks.
The modified Willenborg model has been applied Co Lests of nickel base
superalloys which received a single overpeak after approximately 0.25 mm (0.01
inch) of growth(4 9). For these materials, the value of + is not a constant
but a function of Kmax. Based on the experimental data, the following
expression was developed for 4:
4 - #1 + #2 Kmax (7.17)
For cyclic crack growth the value of fl was zero. The impact this behavior is
that the relative retardation increases with Kmax. The constants fl and #2
are the only adjustable constants in this model. As noted in the literature
r, e', zectio., tIhe value of f should always be less Lhn unf-y.
This model has also been applied to specimens with simple missions
without hold times and adequately predicted their lives. The amount of
relative retardation diminished as the R-ratio increased because, for the most
part, the cyclic crack growth rates for nickel base superalloys are controlled
by AK for high R-ratios (m+ - 1) while for negative R-ratios the growth is
controlled by Kmax.
-217-

Modified Willenborg Model
applied K-
2 (rp)o0I
Kred
firstoverpeak
I Multipleoverpeaks
~1 - (rp)old
distance
Figure 7.3: Schematic diagram of modified Willenborg retardation model
-218-

Weerasooriya and Micholas(5 0 ) used a Willenborg type model to predict the
crack growth rates in Alloy 718 during overpeak hold time cycles so it seems
reasonable to use the modified Willenborg model discussed above to model
retardation during static crack growth. The data shown in Figure 5.31
illustrates that the modified Willenborg model accurately predicts the
position of the minimum in crack growth rate and the extent of the retardation
zone. The only difference between the cyclic and static crack retardation
models is that the value of # was defined in terms of Kol rather than Kmax for
static retardation.
" +1 + 42 Kol (7.18)
The application of cyclic and static retardation result in some rather
different conclusions. Cyclic retardation should be applied for those cycles
where Kmax is less than Kol. The combination of static Letardation with the
linear superposition model requires that static retardation should be applied
at all values of K less than Kol. Consider, for example, a load controlled,
R-0, constant amplitude, constant frequency test. The K at the maximum load
(Kmax) would increase with each cycle due to the increase in crack length.
This would result in no cyclic retardation. If static retardation is applied
to the same cycle, there are benefits because the value of K should be reduced
at all K levels below Kmax. Figure 7.4 illustrates the application of the
modified Willenborg model to this type of cycle. For simplicity sake it is
assumed that # equals unity so that Kred equals Kmax - K. Combination of the
static retardation with the static threshold results in a significant decrease
of the time period over whiLh statt- caTak gro,:th v'ule be -alculated. The
use of Equation 7.19 also dictates that linear loading segments remain linear
after the application of the retardation model so that the superposition model
equations developed in Section 7.1.3 can still be used.
The experimental data in Section 5 showed that 20% overpeaks in
combination with hold times resulted in unmeasurable amounts of static crack
growth during the hold time loading at high levels of K. For this to occur,
the effective K during the hold time (Khold - Kred) must be below the static
threshold. The retardation model is applied to a R-0, 20% overpeak, with Kol
-219-

0o applied
/--cycle
0
0C.,' ° /
E
0 o / static 7./ thresholdI- /
0/C14/
I \'
(0(0
0 5 10 15 20 25 30
time (sec)
Figure 7.4: Application of static retardation to constant amplitude,
constant frequency tests.
-220-

- 48 MP4m in Figure 7.5. It is assumed that Kred equals (Kol-K)#. and that
the static threshold is 9 MPaJm, which seems reasonable based on the static
crack growth thresholds shown in Section 5. The retardation model was
applied using retardation constants of I and 4. Crack growth 4ould be
expected in the former case but suppressed for any case where 4 is in excess
of 4. This simple case illustrates that the values of # necessary to predict
the static crack growth are in excess often in excess of unity. These seem
like unreasonable values, but may reflect the time-dependent relaxation of
stresses. This may be related to the significance of creep deformation
asqnpi'red with creep-fatigue-environment interactions.
These large values of # were necessary to predict the retardation of hold
times at intermediate K levels. If these same constants were applied to
constant amplitude low frequency tests, very little time-dependent crack
gruwLih was predicted. This issue was resolved by applying the -..y'ic
retardation constants to loading ramps and using static retardation constants
for hold time segments.
Table 7.1 summarizes the approach taken to calculate 4 (Kmax or Kol) and
which set of 41 and #2 constants are used to calculate 4.
7.2 ADVANCED CUMULATIVE DAMAGE CYCLE (ACDCYCLE) COMPUTER CODE
This section of the report describes the residual life prediction code
which implements the models described in the previous sections. This code is
rest..cted to through crack analyses in compact specimens and tw,. t-ypes of
single edge notch specimens. This program is known as ACDCYCLE (Advanced
gumulative 1amage CYCLE) and was written using Fortran 77 and compiled on an
IBM XT with an 8087 math coprocesser chip. This program was delivered to the
Air Force Material Laboratory in a compiled form for their use and
distribution. The program was written to be extremely user friendly and
permits input of necessary data (material properties, specimen geometry, and
mission) with either data files or manual entry. There are checks within the
code to prevent the use of non-existent data files as well as prevention of
writing on top of already existing files.
-221-

0
0
11111Static =
C4
0 5 10 15 20 25 30time (sec)
Figure 7.5: Application of static retardation to overpeak hold time test
cycl.
-222-

Table 7.1: Application of Retardation Constants
Cycle Calculation of 4'RetardationType ( lorKConstants
cyclic Koax cyclic
static ramp K01 cyclic
static hold Ko1 static
-223-

The following sections will describe the basic options, input/output
capabilities, and details of performing a residual life estimate.
7. 2.1 ACDCYGi.E..QyL 4U
The program was wz -. using a menu format which has the following seven
options:
1. Calculate a crack growth rate
2. Estimate a residual life
3. Calculate the crack growth increment for one cycle
4. Restart the residual life estimate
5. Perform analysis from stacked files
6. Calculate a crack growth curve
7. Stop
2P.ion 1 calculates the crack growth rste for a specified mission. This
feature does not permit the use of retardation models because the retardation
constants are dependent on the previous loading history of the specimen.
Ofton 2 calculates the number of cycles required to grow a given amount
for a specified mission and material properties. This life is terminated by
either a final crack length or when Kmax approaches the material toughness
(Kc).
a jo calculates the crack growth increment for one cycle. The chief
purpose of this option is to perm't the inclusion of a single overpeak pr'or
to subsequent cycling.
QLto./ permits a continuation of a residual life estimate using a
different set of material properties and/or mission types. The restart option
retains the history dependent constants such as those used to perform
retardation modeling. This option, when combined with option 3, can calculate
the number of cycles necessary to grow a crack a specified distance following
an overpeak.
-224-

Qj1 L~._ allows the program to be run many times from a file constructed
with the desired parameters. This option was included for use in predicting
the lives of the constant K hold time-overpeak tests.
Qion permits the calculation of the crack growth rate for a given
mission. The crack growti rates are calculated using the 3ame parts of the
program used in Option 3. and Jo not include the effects of retardation. The
calculations are initia-ed at a value of Kmax which is 0.5 percent greater
than (Kth)max fur that mission. The crack growth rates are then calculated
for valueR of K higher by ,ne percent over the previous value. This procedure
is terminated when either (1) Kmax approaches Kc or when the crack growth rate
exceeds 2.5 x 10⁻¹ mm/aycle (I x 10-2 inch/cycle).
After completior. of the desired option the software returns to the main
menu for anoLlitr calculation (Option 1 through 6) or termination of it6
activities (Option 7).
7.2.2 ACDXCLE-Inut and Output
After selection of one of the six options described in the previous
section, the crack growth model, material properties, specimen geometry, and
mission proflie must be selected. The material, specimen, and mission data,
once input, are stored in computer files to facilitate their use in future
computations.
After sie.trior- ef the option, the first information selected is wiich
crack growth model. ACDCYCLE was written to perform the evaluations using
either (1) the interpolation or (2) the combined interpolation-superposition
models de'cribed in the previous section. If the interpolative model is
selected, the retardation model cannot be applied.
Tle r aterial constants are different for each of the crack growth models
so a stparate materials data file must be maintained for each
material/temperature/model combination. When ACDCYCLE is used with the
interpo.ation-superposition model, the static crack growth, cyclic
-225-

retardation, and static retardation options can be selected (on or off)
without setting up a separate data file for each of these combinations.
ACDCYCLE can perform crack growth analyses fur thrae though crack rype of
laboratory specimens. The K-solution used for the buttonhead single edge
notch (SEN) specimen is the Harris solution(6 1). The Tada solution(72 ) was
used for the pin-loaded SEN specimen and the K-solution recommended by
ASTM(68 ) was used for the compact specimen. In addition to the type of
specimen, the initial crack length, specimen width (W), and final crack length
4re input. The final crack length is used to terminate a residlial life
option. This is particularly useful in combination with the restart / stacked
case option to predict the behavior in a specimen which has been cycled in
several different ways.
ACDCYCLE permits prediction of crack growth under eitiei.
stress-controlled or K-controlled conditions. Several unique features have
been built into this computer code to (1) facilitate easy use of simple
missions, (2) to permit the use of a single mission files for cases where only
the level of stress or K changes, and (3) to permit the repetition of a
mission block. A simple mission is considered to be comprised of a loading
ramp with a time increment V/2, a hold time of length T, and an unloading ramp
with a time increment of V/2. This mission can be described in terms of a
ramp time (V which is the sum of increasing and decreasing time), a hold time
(T), and R-ratio. ACDCYCLE pernits the user to input the values of V, T, and
R and the code creates a mission file with the appropriate stress (or K)
pat;c. he* iress or K levels can be changed by specifying thc maxi-tum ]vel
of stress or K multiplier for a mission which had the proper time and relative
loading sequence. The multiple mission block is introduced by giving the
number of times a mission should be repeated (a value of one in just a single
mission). This option is useful in modeling constant K tests where
retardation may have occurred between blocks of load-controlled cycling.
After the model, material, specimen, and mission information is input,
the user has the option of having the output stored in a data file as well as
appearing on the PC monitor (and printer if so desired). The output lists all
-226-
the model, material, specimen, and mission input data as well as the results.
The advantage of having the output stored on a data file is that it can be
edited for subsequent computer plotting. For example, the predicted crack
grcD.iLh Late curves shown in this seccion were ccmputex plotted from files
created using Option 6 of ACDCYCLE.
7.2.3 Residual Life Calculations
The residual life calculations performed in ACDCYCLE use three
subroutines - RESLIF, ONECYCLE, AND MODWIL. The r~sidual life calculation is
monitored and controlled in RESLIF. The numerical integration is performed
using the increment of crack growth in one mission cycle and numerically
integrating it with respect to mission cycles using a second order Runge-Kutta
technique. Each time the increment in crack length is required, RESLIF calls
the subroutine ONECYCLE. Within this subroutine, the current crack length and
the loads for that mission cycle (adjusted for K-controlled tests, if
appropriate) are used to calculate the corresponding increment in crack
length. The calculations within ONECYCLE will be described using the 10 point
mission shown schematically in Figure 7.6. The calculations will be described
separately for the interpolation and the interpolation-superposition model.
A single cyclic loading was considered to end when the load reaches a
local minimum such as at mission points 1, 4, 6, and 10 in Figure 7.6. The
interpolation model considers only the ramp times (V), hold times (T) and
R-ratio (R) for each cyclic loading. The crack advance during a given mission
cycle was calculated by determining the values f V T an,. P for each cyclic
load. The interpolative crack growth equation then calculates the crack
growth increment (da/dN). The crack length is then incremented, the values of
K are updated, and this procedure is repeated until the end of one mission
cycle. This steps in this procedure for the mission shown in Figure 7.6 are
listed In Table 7.2.
The interpolative-superposition model was applied in a slightly different
fashion. The cyclic crack growth rate was applied for each loading cycle,
then the amount of static crack growth was calculated for the segment between
-227-

06
09
01
ti me (t)
Figure 7.6: Schematic example of a mission analyzed by ACDCYCLE.
-228-

Table 7.2: Sequence Of Mission Analysis In ACDCYCLE Using Interpolation
Crack. Growth M~odel
Step Mission Point Range R V T
1 1 to 4 Pl/P3 (t4.tl)+(t4-t3) (t3-t2)
2 4 t.-% 6 P5/P4 (t6-t4) 0
3 6 to 10 P6/P7 (t8.t6) +(tlO-t9) (t9-t8)
-229-

adjacent mission points. This process was repeated until the end of the
entire mission cycle. If the maximum value of K in one load-unload cycle was
less than that calculated for (Kth)max according to the interpolative
thiesiiold model, no cyclic ,z sLatic crack growth was actributed to that
loading cycle. The steps in this procedure are described in Table 7.3. Not
shown in the table are the calculations for V, T, and R for steps 1, 5, and 8.
These were identical to those shown in Table 7.2 for the interpolative model.
In both models, the crack lengths were updated and the values of K were
recalculntpd before each step listed in Tables 7.2 and 7.3. If retardation
was used in the interpolation-ruperposition model, each time the values of K
were updated the retardation model was applied using a subroutine called
MODWIL. The values of K were reduced, and for loading ramps, the value of R
was recalculated using the K values as modified by the retardation model. It
should be noted that the values of the history dependent retardation values
were stored at several points during these calculations. If it was necessary
to reduce the mission cycle increment in RESLIF or the time increment for
static calculations in ONECYCLE, the integration was repeated using a smaller
cycle or time increment along with the old values of the crack length and
retardation terms.
7.3 MODELING OF RENE'95 AT 649"C
The most extensive modeling was performed on Rene'95 at 649"C because of
the larger data base at this temperature - material combination. The
followin6 sictlr-s w'll dee-ribc the application of the models desc.:izd in
Section 7.1 to these data and critique their ability to predict the
oxperimental data.
All the data in this investigation were obtained in English units (kni,
ksilin, inch, inch/cycle, and inch/sec). The constants for the time-dependent
crack growth models were also determined using these units. The materials
constants listed in the tables in this section are also in English units,
however all comparisons are made in SI units.
-230-

Table 7.3: Sequence Of Mission Analysis In ACDCYCLE Using Interpolation +
ZupeJrposition Crack Growth Model
Step Mission Point Range Type of Analysis
*1 1ito 4 cyclic
2 1 to 2 static
3 2 to 3 static
4 3 to 4 static
5 4 to 6 cyclic
v 4 to 5 static
7 5 to 6 static
8 6 to 10 cyclic
9 6 to 7 static
10 7 to 8 static
11 8 to 9 static
12 9 to 10 static
-231-

There was very little near toughness crack growth data generated in this
investigation. Therefore, the value of Kc in both the interpolative and
superposition models was set to 65.9 MPa~m (60 ksi/in). This value was
v=leLted based on extensive.residual life estimations fcz Re"..'95. Increasing
the value of Kc above this level does not significantly improve the calculated
residual lives because of the rapid crack growth rates at the upper end of the
Region II portion of the curve.
7.3.1 Rene'95 Threshold model
The material constants for the interpolation threshold model (Equation
7.1) were determined using nonlinear optimization techniques in order to
minimize the error between the predictions and the experimental data
previously shown in Figure 5.19. The constants for the thceshold
ineripolatlion model are listed in Table 7.4. The results of this modci are
compared to the data in Figure 7.7. The comparison of the hold time threshold
tests are shown in Figure 7.7a. The model accurately predicts the influence
of hold times for R ratios of 0 and 0.5. The sudden decrease in threshold
with hold time for R-0.8 is predicted well, but does not adequately increase
for longer hold times to predict the R-0.8, 300 second hold time data point.
This was the most poorly predicted threshold data point for Rene'95 at 649"C.
Figure 7.7b shows a similar comparison for the 649C low frequency tests on
Rene'95. This model predicts most of these threshold values within I MPam.
This model was used in both the interpolative and superposition, so from
tbis ,(,:.T on the superpositil'n model will te cA'led the int-rpo!a:1-1.ii +
superposition model.
7.3.2 Rene'95 Interpolation Model
Nonlinear optimization techniques were used to determine the 649"C
Rene'95 experimental data presented in Section 5.2 were used to determine the
value of D and the 12 constants necessary to describe B, P, and Q. The values
of these constants are listed in Table 7.5. The comparison between this model
-232-

Table 7.4: Constants for 6496C Rene.95 Interpolation Threshold Miodel -
Kco - 10.148
Ka - 9.302
a - 0.23386
A - 2.8862 x 10⁻³
B - 6.0360 x 10⁻²
C - 1.7172
D - 4.2790 x 10⁻²
E - 6.7776 x 10⁻²
-233-
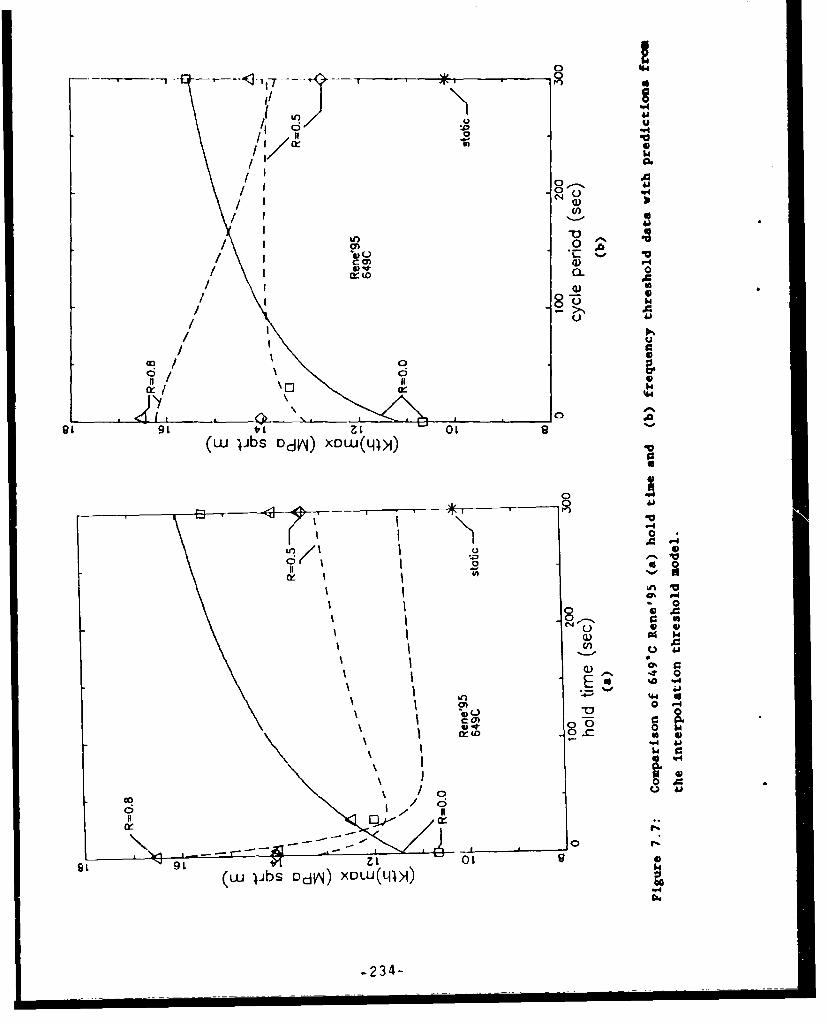
IIw
.
C)l .09.
CLo 0
>% A
0 0
(wu jibs D~dV) XC)WL14) 10
00
Lo u
It-
0
LU)
4 01
9t~. -L 0u i s D N D U Ll i
-24
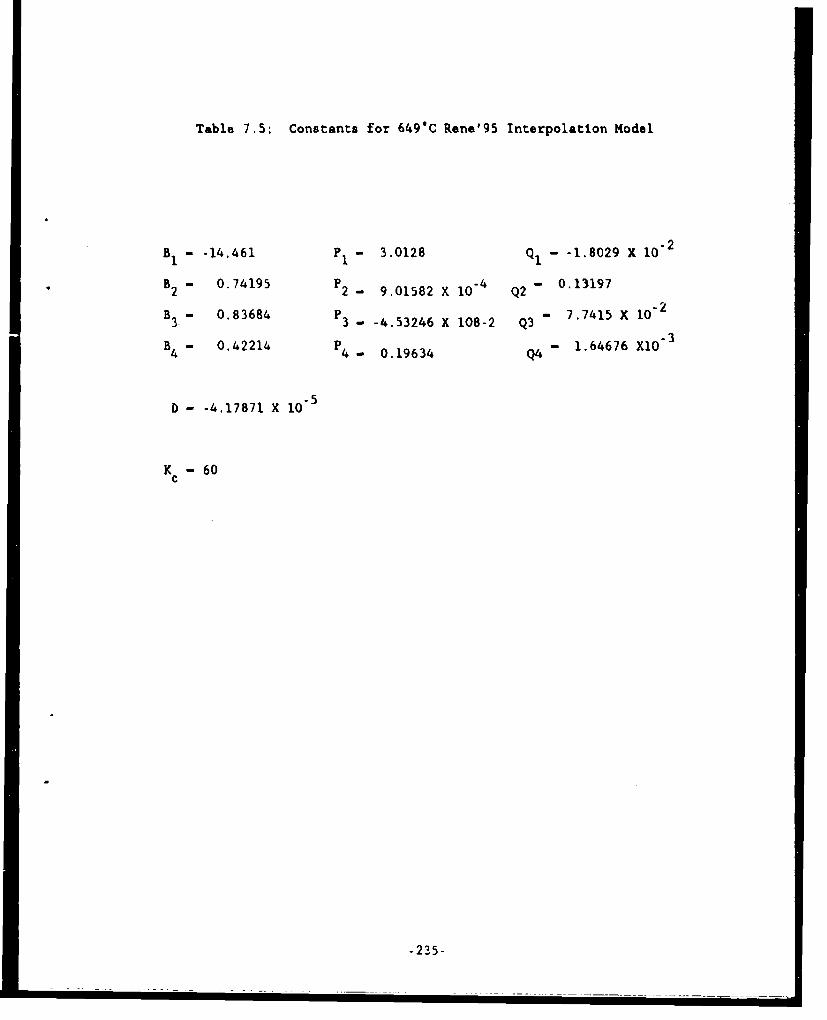
Table 7.5: Constants for 649*C Rene'95 Interpolation Model
B 1- "-14.461 P1-3.0128 Q1- -1.8029 X 10- 2
B2 - 0715P 2 - 9.01582 X 10- Q2 0.39
B 3- 0.83684 P 3- 4526X182 Q 7.7415 X 10- 2
B 4- 0.42214 p 4 - 0.19634 Q4 - 1.64676 XlO-
D - -4.17871 X 10'
K - 60
-235-

and the experimental data will be presented in Section 7.3.4 along with tha
results of the interpolation+superposition model.
7.3.3 Rene'95 Interpoiacion + Superposition Model
The time-dependent contribution of this model is determined using the
superposition of cyclic and static crack growth; however, interpolation models
were used to model the threshold (Section 7.3.1) and the Walker model was used
to model the influence of R-ratio or. the cyclic crack growth rates.
As hoLed in Section 6, it appears that intergranular crack growth is
faster than transgranular growth even in the absence of environment. Most of
the time-dependent crack growth occurred in an intergranular mode, so data
from specimens which resulted in intergranular crack growth were used to
deve-up L'c cyclic crack growth rate curve. The test specimcn uad :c ccllect
near threshold data which had the least amount of time-dependent crack growth
was the specimen tested with an R ratio of zero and & Lycle period of 3
seconds. As described in Section 6, the crack growtr- I this tests was just
slightly higher than determined in vacuum with a 30. :'-.ond hold time, a
conditions which also had intergranular crack propagation.
The influence of R-ratio was treated using the Walker model, as discussed
in the literature review. High R-ratio tests performed in air appeared to
have some amount of time-dependent crack growth because of the difference in
the near-threshold regime. As a result, the vacuum test performed with a 3
:.eo:,d L~ cie period and n R-ratio of 0.8 was use to determ.n: iht -olkv&
exponent.
Nonlinear optimization was performed on the data from these two test
specimens to determine the values ot Kth, D, P, Q, D, and m+. The values of
these constants are listed in Table 7.6. Figure 7.8 shows the crack growth
data from the two test specimen discussed above plotted against to effective
value of K (Ketf) as defined by the Walker relationship (Equation 2.14). Also
shown in this figure is the curve represented by the constants listed in Table
7.6. The agreement between the tests data and the curve is excellent.
-236-

Table 7.6: Constants for 649*C Rene'95 Superposition Model
* Cyclic Constants
Kth - 9.8329 Q - 0.49779
K* - 60.0 D - -9.8968 x 10⁻²
B - -12.924 M+- 0.72032
F - 2.9466
Static Constants
Ke w 9.302
C - 6.098 x 10⁻¹¹
n - 3.63
Static Retardation Constants
#1 - 0.9566
#- 0.1867
-2 37-

0
..- , •I. . . . ] l| I c I II I:=I I = I I _ -
Rene'95 AIo 649C
0
°1
I
0'~
0
>1
I0- a R-0.0, air
SR=0.8, vacuum
0
0
10 20 50Keff (MPa sqrt m)
Figure 7.S: Cyclic crack growth curve used in :he 649"C Rene'95
superposition model.
-238-
The static crack growth curve used in the superposition model is
represented by a Paris equation truncated at the lower end by a threshold
value. The static threshold vdlue was taken to be the lowest value of K at
which crack growz'i was measured in the 64;*" Rene'95 static K-shed test. Thc
649°C static crack growth data shown in Figure 5.28 were edited to eliminate
the near-threshold regime in the K-shed test and the artificial threshold data
or "tails" in the constant load tests. Linear regression analysis to the
logarithmic form of the Paris equation was performed to determine the best fit
through the edited data. The static threshold and Paris equation constants
are listed in Table 7.6. This curve is shown through the 649"C Rene'95 static
crack growth data in Figure 7.9. This looks to be a gooL fit to the data, but
as noted in Section 5, there is a rather wide amount of scatter in these data.
The scatter may affect the establishment of a reliable static crack growth
curve. The quality of this curve is extremely important because it is the
source of the time-dependent contributL.,1 to the supeLpobition model.
The correlation between the superposition model predictions and the
experimental data are presented in the next section.
7.3.4 Comparison of Predicted and Measured Crack Growth
The constants listed in Tables 7.4 though 7.6 were entered in materials
data files and the crack growth option in ACDCYCLE was used to generate crack
growth curves for the 18 different testing conditions evaluated in this
program (3 R-ratios x 3 frequencies and 3 R-ratios x 3 hold times). It is
impnrtent to nc'.e ha 'iiesc daL. -'rc used to establish1 the material
constants for the interpolation model but data from only one of the eighteen
conditions were used to determine the superposition model constants.
It should also be remembered that these calculations do not include any
benefit of retardation. Retardation can significantly slow down the crack
growth rates in frequency tests and any type of tests with very rapid crack
growth. This will be discussed and treated later in this section.
-239-

*Rene'95649C
rQ)
Eo
-0 LO
0A
0-K hecostn la
/
10 20 5
KIMasqtm
Figur 7/:Sai rc rwhcrv sdi h 4* ee9
(240
The prediction of the hold time tests will be discussed before the
frequency tests because there is little influence of retardation on the
increasing K hold time data. Figure 7.10 shows the comparison of the
experimental daLf with Lhe -predictions of both models for 649C ,R-O hold .it©
tests on Rene'95. In these figures the small symbols represent the results
from the threshold tests while the large symbols represent the data from the
constant AK tests. The solid line is the prediction from the interpolation
model (I) while the dashed line represents the interpolation + superposition
(I+S) model prediction. The results of the constant AK tests were lower than
the incrpasing K tests, particularly for the hold time tests due to
recardation between constant load cycling segments so the increasing K
portions of the threshold tests are considered to be a better indicator or
provide more accurate crack growth rates. In all cases the predictions of the
totally interpolative model are below those of the I+S model. This results
piari'.y frow Lh©s inclusion of the constant AK data in deLtrmining the
material constants. Exclusion of these data would undoubtedly increase the
predicted crack growth rates but would lead to other errors for situations
such as R-0, 4 Qacond hold time (Figure 7.10) where there are no increasing K
data from the threshold tests. The I+S model accurately predicts the R-0, 30
second hold time data and is less than 2 times lower than the 300 second hold
time data. In the case of the R-0, 300 second hold time, the prediction of
the I model is almost six times lower than the I+S prediction and over ten
times lower than the experimental data.
The comparison of the R-0.5 hold time experiments and predictions are
bi,,jwn its Figu.re i.11. For the two lower hold times, ) oth moiusl ile abcve thp
constant AK data. The only R-0.5 hold time tests with increasing K data from
the threshold test was one with a 300 second hold time (Figure 7.11c). In
that case, the predictions from the two models bracket the experimental Region
II data. The I+S model more accurately predict the response at lower K levels
relative to the predictions at higher K levels.
One reason for this influence of K on the predicted crack growth rates
might be the way in which these predictions are performed in ACDCYCLE. For
simple cycles like those predicted in Figure 7.11, the interpolation model
-241-

0 -
. . .- ,_ . _ - - . . . . . .. . . -
Rene'95r Re-e'95" 649C T 1 6-9C
o . R=0.0 ,0-4 sec. hold,- 30 sec. ho'd
0. -
-~ -
0)1.
0-~
IN,
II
E E~
z I z
0"
.or
0 - -: 0- -
. . . .I 0.
5 10 20 505 10 (M20 so
Kmax (MPo sqrt m) Kmax (MPo sqrt n)
(a) (b)
2 ) ; I . . . .... - .. . .-' " '
* Qe 'e957 649C
.300 sec. hold "- Figure 7.10:
0
Comparison of experimental data with
*predictions from interpolation model
EL (I) and interpolation +
z sltpeLpusiLiGr mcdPl (!+S) for
0o Co .Rene'95 tested at 649C with R-0.0
and hold times of (a) 4 seconds, (b)
o1 30 seconds, and (c) 300 seconds.
GoL I
S 10 20 50
Kmox (MPo sort m)
(c)

6o 0
R Rene'95Rene'95 T-69
7 649C .- 649CSR=0.5 - R0.5"- =4 . h30 sec. hold4-ec hold
1 = tSOC .I
E 1 , 1 E * o.
-0.0 Ae.hl
z z-0
-- q~crp .t o n odel (l+S fo
(0 0
400
'- -- I+S
5 10 20 50
Kmax (MP sqrt m) Kmax (MPo sqrt m)
(a) (b)
Rene'95-7 649CAoR=0.5 7Fgr .1300 sec. hold .Fgr .1
Coprio of experimental data withprditin from interpolation model
0- u;crposftion model (I+S) for
0 Rene'95 tested at 649*C with R-0.5
and hold times of (a) 4 seconds, (b)
- 30 seconds, and (c) 300 seconds.
CD
Kmoax (MPa sqrt m)
(c)
-243-

calculates a crack growth rate based on the initial crack length. When the
interpolation model is applied, the crack length is incremented after each
cyclic and static calculation. During long hold times this results in K
lvels hiher than specified at Gc SOat L uf txe ycle. This also occurs
during the testing as well.
Figure 7.12 shows the predictions and the data for the 649*C, R-0.8 hold
time tests on Rene'95. In general both models adequately predict the Region
II crack growth response. The largest deviation occur in the near threshold
regimec. Both models use the same threshold interpolation model. As noted
earlier, the threshold model fairly accurately predicts the initial drop in
threshold with increasing hold times but does not predict the increased
threshold for a 300 second hold time as shown in Figure 7.12c.
The comparison of Lhe model* and experimenLal data for the R-0 frequency
tests are shown in Figure 7.13. The test results shown in Figure 7.13a
represent one of the tests used to establish the cyclic crack growth curve for
the I+S model. Both models accurately predict the results for the lower two
frequencies. For a 300 second cycle period, the totally interpolative model
predicts the response much better than the I+S model which overpredicts the
crack growth rates by a factor of four.
Figure 7.14 shows the predictions and data from the 6490C, R-0.5
frequency tests. The crack growth data from the 300 second cycle period
threshold test shown in Figure 7.14c were from the K-shed portion of that
test. Ns ixirreasine, K daa ,erc obtzJned in thaL specimen. It would be
expected that the true crack growth rates would lie slightly higher than those
shown foi the constant AK data. The predictions of the interpolation model
seem to fall below the data, while the superposition model appears to
accurately predict the response.
The comparisons for the R-0.8 frequency tests are shown in Figure 7.15.
For these test conditions, the I and I+S model predictions of the Region II
crack growth rates are different by at least an order of magnitude. Based on
the data from the threshold tests (small symbols), the superposition model
-244-

Rene'956-9C 7 6-9C
. =,. R=0,84 sec. h o!d ,30 sec. hold
U C)-
E E
-- -S - -- -0v-- -- "' L -_ -• - - ' _- -" "
z
010
I II --- ,-
I - fI -
5 10 20 50 5 10 20 50Kmax (MPo sqrt m) Kmax (MPa sqrt m)
(a) (b)
Rer.e'957- 649C ,SR=0.89 Figure 7.12:
.300 sec. ic!d
2: -- ,K Comparison of experimental data with
_ 2) - predictions from interpolation model
N ,,/ (I) and interpolation +
E o_ superposition model (I-S) for
Rene'95 tested at 649"C with R-0.8
7 and hold times of (a) 4 seconds, (b)
,- 30 seconds, and (c) 300 seconds.
- - -I
5 !0 20
Kncx '.VPc scrt )
(c)
-245-

-- er'e5
0 '.- 30 sec. ce:oc- sec. oeriod.
C-.
0~..
u, OL , --EE
E z
'N -zzz
001-* o. -' I
-, I -I es• - -I+S 1,
t B
. .
S 10,i 20 ' 50 5 1020505 10205 Kmax (MPa sqrt m
Kmox (MPo sqrt m)
(a) (b)
0
Rene'95- 649C /
O. R=0.0- 300 sec. period Figure 7.13:
OLrI. - - Comparison of experimental data with
- predictions from interpolation model
E T (I) and interpolation +
- super:positiui, model (I+S) for
z iRene'95 tested at 649"C with R-0.0
and cycle periods of (a) 3 seconds,to
I-I (b) 30 seconds, and (c) 300 seconds.
10 2 50
' ' ' Io o . . .Kmax (MPo sqrt m)
(c)
-246-
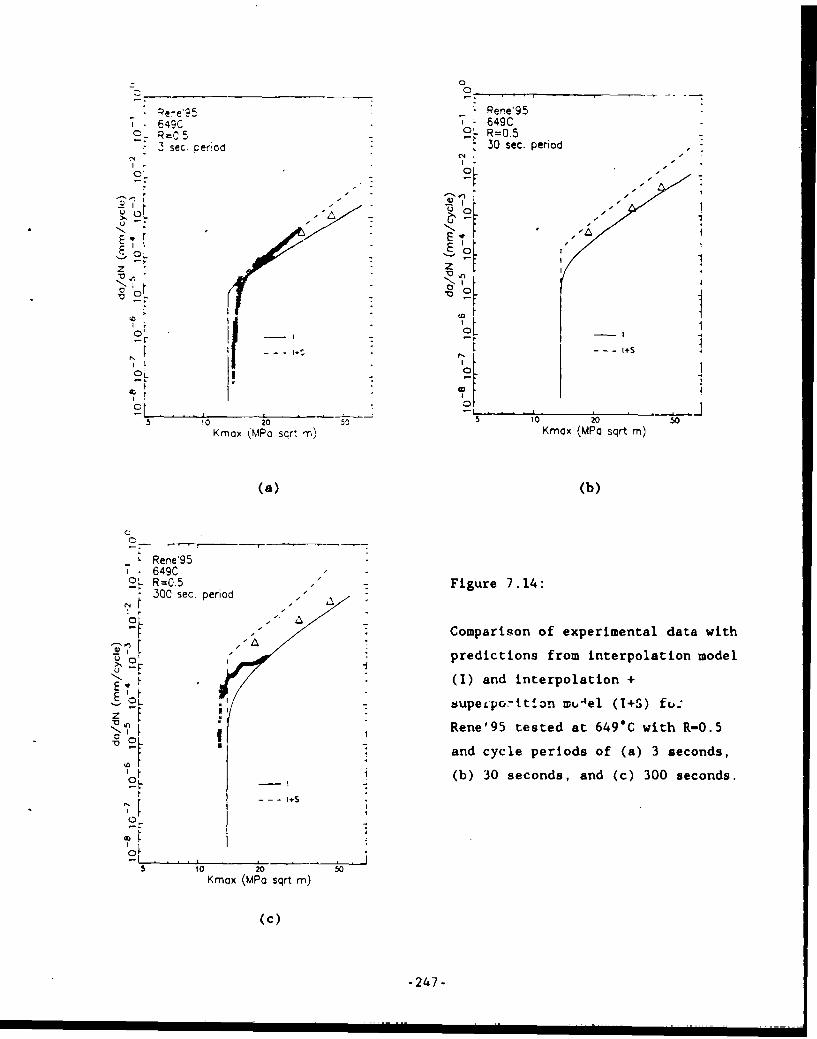
0
Peee'^5 rene'95• 649C 7 649CSRoL R=0.5
Ssec. ceriod - 30 sec. period3 sec c-.d .,
I S
£ ':_. - -,
Fr -. 0 -
o 'o "Lo
- II ! -4
0L II I
' 0 20 so 10 20 soKmox MPo sqr! -r-) Kmox (MPa sqrt m)
(a) (b)
C
Rene'95T.649C2" R=0.5 Figure 7.14:
300 sec. period
i-"
I
S. Comparison of experimental data with
predictions from interpolation model
E (I) and interpolation +
EupeLpo-ttlon MkAel (I+S) fu:
1 Rene'95 tested at 649"C with R-0.5
and cycle periods of (a) 3 seconds,
I (b) 30 seconds, and (c) 300 seconds.
or-
S 10 20 50Kmax (MPo sqrt m)
(c)
-247-

0
Rene'95 L Rene'95
7 649C 7 649Ca- R=0.8 oL R=0.8
3 sec. per-od 30 sec. period "
o -- I L. - -
E'o; E
zt z* - . , . 7
0' 10.[-
0-'
Kmox (MPa sqrt n) Kmax (MPa sort rn)
(a) (b
0 .,
-- '95
F,,. ---'g5
- 64g9to? R=0.8 ,Figure 7.15:S300 sec. period
-: ." " Comparison of experimental data withSpredictions from interpolation model
0-
0(I) and interpolation +
E p upe-positfon model Qi+S for
z
IRene'95 tested at 649*C with R-0.8
-. .and cycle periods of (a) 3 seconds,
0. "(b) 30 seconds, and (c) 300 seconds.
N I-
0
5 10 20 so
Kmax (MPo sqrt m)
(c)
-248-

appears to be overpredicting the lives by a factor of two or three while the
interpolation model is und~rpredicting the lives by a similar amount.
Bvth models accurately pLseikt. Li genteral trends in thz crack growth
response. The interpolation model suffers from consideration of some of the
artificially low constant AK test data. It is very encouraging to observe the
ability of the superposition model to predict the long hold time and cycle
period data because none of those data were used to develop the non-threshold
time dependent contribution to the crack growth rates.
One of the major concerns with interpolation models is the ability of
that model to predict the response outside the range of conditions over which
the model was calibrated. There was no additional data available from this
investigation to compare with these models but work by Weesooriya(24 ) has
clearly established that there lb a transition .or cycle dependent to time
dependent growth with increasing cycle period or hold time. The interpolation
and superposition model developed for Rene'95 at 649*C was evaluated for
R-ratios of 0, 0.5, and 0.8 and for hold times and cycle periods ranging from
0.01 to 1000 seconds. The loading ramps associated with the hold time cycles
were each 0.005 seconds long resulting in a cyclic time (V) of 0.01 seconds or
a cycle 0.01 seconds longer than the hold time. This rapid loading was used
so that the influence of loading rate would be small compared to the hold time
effect. Predictions were performed for cycles with a maximum K (Kmax) of 40
MPaJm using the crack growth option in ACDCYCLE. This value of Kmax was
selected so that the cyclic threshold was exceeded.
Figure 7.16 show the predictions of the superposition model for hold
times and cycle periods. The transition from cycle to time dependency with
increasing cycle time is observed for both types of cycles. There is a strong
influence of R-ratio at rapid cycling due to the impact of R on AK which to a
large extent controls the cyclic crack growth rates. As hold time increases
(Figure 7.16a), there is no longer any influence of R on the crack growth
rates. The influence of R reverses from the cyclic to time dependent portion.
This response in qualitatively similar to the results of Weerasooriya(2 4 ) for
Alloy 718.
-249-

9 0 q.4
0 CLoC)
u 0
0 U 4
C) 0
o) -r (o.
- .0
o~'woLf)L I Iu
0 U-) 0 6
(:DID/w NP/) *d C1_________0_____:____________________
'-I-I-- . . . .. . . . . . . . . . . . . . . . . . 0
OL~~~~ ..4 0L 00
(ej:)X1WL-* NP C.
-250-4
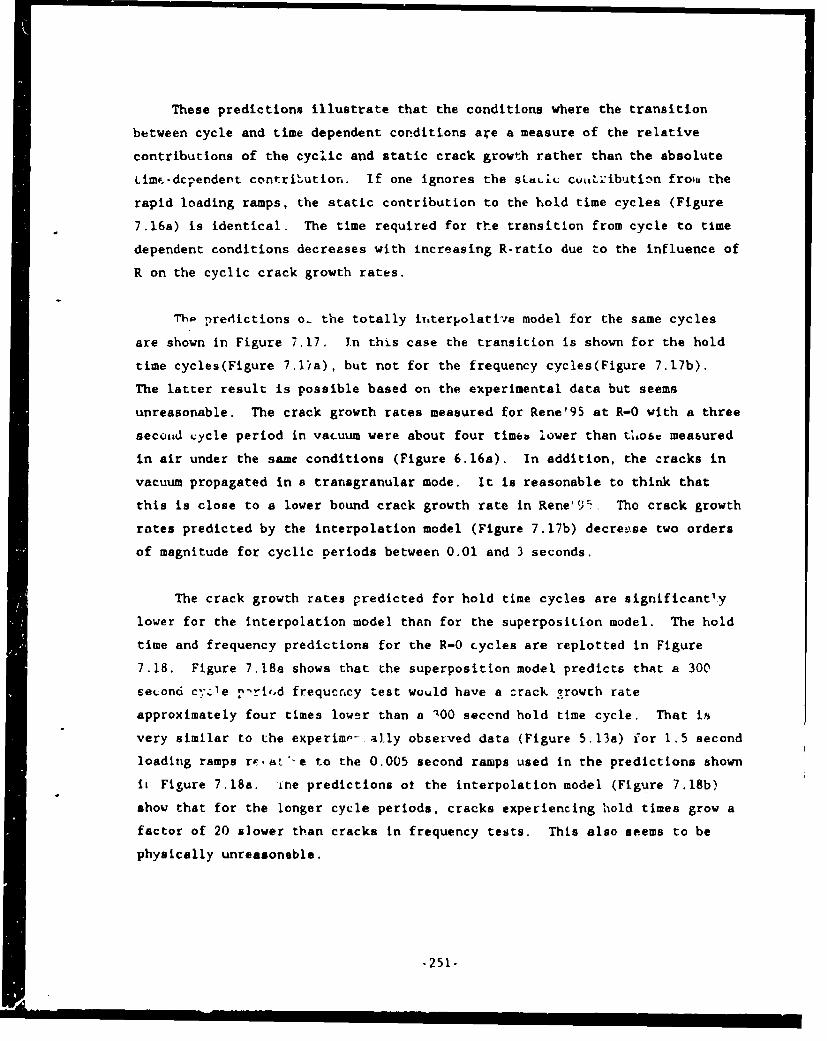
These predictions illustrate that the conditions where the transition
between cycle and time dependent conditions are a measure of the relative
contributions of the cyclic and static crack growth rather than the absolute
LimC-dcpendent contribution. If one ignores the SLdLiC cVLtLributi~n frowu the
rapid loading ramps, the static contribution to the hold time cycles (Figure
7.16a) is identical. The time required for rfe transition from cycle to time
dependent conditions decreases with increasing R-ratio due to the influence of
R on the cyclic crack growth rates.
Tho predictions o. the totally iyterpolative model for the same cycles
are shown in Figure 7.17. In this case the transition is shown for the hold
time cycles(Figure 7.1)a), but not for the frequency cycles(Figure 7.17b).
The latter result is possible based on the experimental data but seems
unreasonable. The crack growth rates measured for Rene'95 at R-O with a three
seccoid cycle period in vacuum were about four times lower than tl~osc measured
in air under the same conditions (Figure 6.16a). In addition, the cracks in
vacuum propagated in a tranagranular mode. It is reasonable to think that
this is close to a lower bound crack growth rate in Rene'9K Tho crack growth
rates predicted by the interpolation model (Figure 7.17b) decretxse two orders
of magnitude for cyclic periods between 0.01 and 3 seconds.
The crack growth rates predicted for hold time cycles are significantly
lower for the interpolation model than for the superposition model. The hold
time and frequency predictions for the R-0 cycles are replotted in Figure
7.18. Figure 7.18a shows that the superposition model predicts that a 300
second c:-zle prried frequcncy test would have a crack growth rate
approximately four times lower than a 100 secend hold time cycle. That is
very similar to the experimp- ally observed data (Figure 5.13a) ior 1.5 second
loading ramps rc.,'-e to the 0.005 second ramps used in the predictions shown
It Figure 7.18a. ine predictions ot the interpolation model (Figure 7.18b)
show that for the longer cycle periods, cracks experiencing hold times grow a
factor of 20 slower than cracks in frequency tests. This also seems to be
physically unreasonable.
-251-
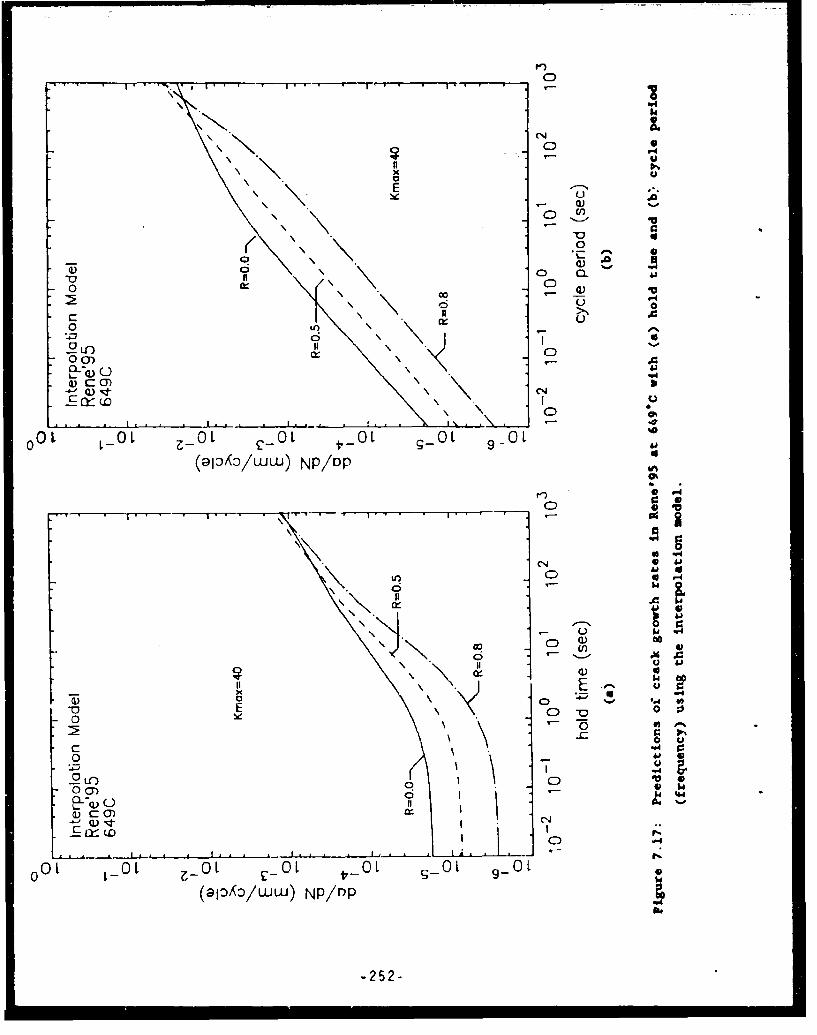
0
00
E: E
a 0i
0 (LC4)
0 LO
-2 U-) CD00) -A
.) C)
CN.
\ 00
0) *p
c "4
00IV,
2 U- 05
0\l
ClU
0~~~~~~~. L -0L 0
0903ww PD
-252-

Q
C
ccJ
C)-
044
0 1, 0 L.0 t t-t-J *
Iw
Q)o~/uw NPQ
_r; - 64
Ed) E
a) -t 1_ _ _ _ _ _ _ _ _ _ _ _ C)
0 L - t Z0 L_ L 1-0 OL 9 o

The reason for this behavior is an extreme sensitivity of the
interpolation model to low frequencies. A second set of hold time predictions
was performed with a loading and unloading ramp of 1.5 seconds, the
experimental condi L!nb used in this investigaLion. rigures 7.10 through ?'. 2
demonstrated that the interpolation model adequately predicts crack growth
during this type of cycle. Figure 7.19 compares the predictions for the 0.005
second and 1.5 second loading ramps. The stperposition model (Figure 7.19a)
predicts a very small influence of loading ramp and only when the crack growth
rate is dominated by the crack growth associated with the loading ramps. The
interpolation model (Figure 7.19b) predicts sixty fold difference in crack
growth rates over the entire range of hold times.
The excessive sensitivity of the interpolation model to frequencies could
be remedied by collecting data over a wider range of conditions or
reformulating the equations describing B, P, and Q. Thi.f, sisitivity
demonstrates a basic weakness of any interpolation methodology. The
interpolation approach is basically a curve fitting technique and if the range
of input data or the constructions of the crack growth constantn do not
adequately cover all conditions over which the crack growthn predictions must
be performed, this type of model can lead to extremely erroneous predictions.
On this basis, the remaining effort in this investigation will consider
only superposition models. This approach has the additional benefit that the
concept behind the model reflects the underlying mechanisms of time dependent
crack growth as reported in Section 6. By the basic nature of the model, it
wil. lay.- -how the trans.tiun from cycle to time dependei.t behavior.
7.3.5 Retardation model
The retardation model discussed in Section 7.2 was applied the 649"C
Rene'95 hold time retardation tests. Retardation is history dependetnt so the
static retardation constants were determined by predicting the entire crack
length history of each of the five 649"C Rene'95 hold time retardation tests.
This was accomplished using the stacked case option in ACDCYCLE. Figure 7.5
schematically illustrates that if the value of K is reduced to below the
-254-

0 cl
00
V~ 0
aA u0 N
E E0 a) 0 0 4
0 )C C- V~-4 -
0 0 L A
(aoklU)u -PD
'C 'COO
00) ~00
1/'%
x 0
CI.~ 01_0 0
(~AC)w NP0 it0
w Q) U
00
0C ,-. 0
0
Cao0/UU .- C.
-255-~

static threshold and the crack growth rate is independent of the hold time,
only a lower bound for # can be determined. This required that the value of 4
be evaluated for testing conditions which showed time-dependent behavior, so
the static retardation constants were %&trrmined using the 10 p4L6eL6 Ovcrpeak
tests. In each of the two 10 percent overpeak tests (R-0.0 and 0.5), there
were four hold time segments (0, 4, 30, and 300 seconds) at a constant value
of Kol. Repetitive ACDCYCLE analyses were performed to determine the value of
f, which best predicted the number of cycles for all four hold times. The
longer the hold time, the more sensitive the result was to f. figure 7.20
shows the resulting values of t for the six segments in these two tests. It
appears that It is linear with Kol and does not seem to be very sensitive to R
ratio. The line in this figure is the best fit through the data. The slope
and intercept determined the values of #1 and #2. The values of the
retardation constants are listed in rable 7.6.
The values of # are much larger that unity as anticipated from Figure
7.5 Consideration of elastic unloading requires that # not exceed 1. The
fact that # must exceed 1 suggests that this is not a good retardation model
and/or that other complex stress relaxation processes are occurring. The
strong influence of creep in time dependent crack growth suggests that the
latter may be true. Complicated creep-assisted stress redistribution probably
plays an important role in the retardation of static crack growth after only
relatively small overpeaks.
The values of Il and +2 were used to predict the number of cycles
raquiitd to propagate thrn',gh oil thp indi.vlduql ,cmeats in. the E'9C
overpeak hold time test specimens. These results are compared with the
experimentally measured values in Figure 7.21. The solid line in these
figures represents perfect agreement. The dashed lines enclose a region which
is witnin a factor of two of the perfect agreement. In all but a few
occasions, the predictions agree within a factor of two of the experimental
data. Most of those exceptions occurred for test conditions with 300 second
hold times.
-256-

I! I I
Rene'95649C10% overpeaks
0
-
C:0
o D0
0
0 _
0 R=0.0
A R=0.5
00 10 20 30 40 50 60
Kop (MPo sqrt m)
Figure 7.20: Variation of # with K.1 for 649*C Rene'95 hold time overpeak
tests with 1OX overpeaks.
-257-
x
00
N0 0
Nx 0x
.0 \ N V-4
A0
4
WU C
N A~ 0Noz00t 0 4o 0 A4
41 0paopN N 0 0
NC1 Aj 46
N NQ) "4
N 0 44
N w N 0
U-) XN
C) NFla~
CO~CN
pajoipaid N
-258-
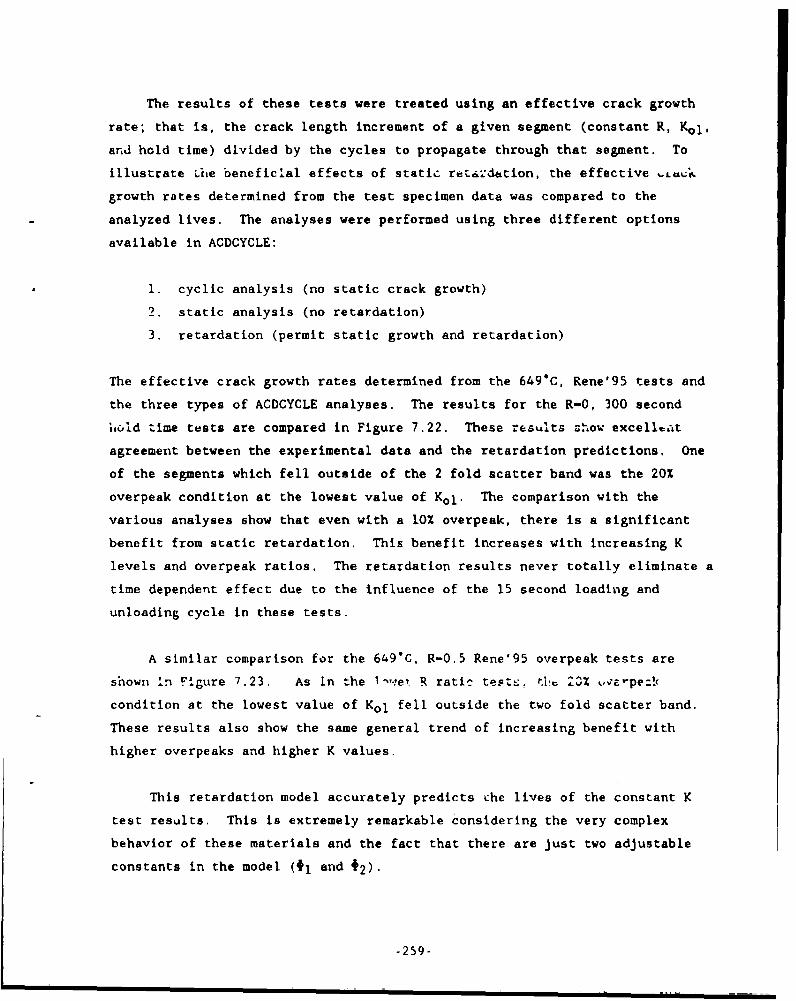
The results of these tests were treated using an effective crack growth
rate; that is, the crack length increment of a given segment (constant R, Kol,
and hold time) divided by the cycles to propagate through that segment. To
illustrate Lite beneficial effects of stati. retardation, the effective L-U;
growth rates determined from the test specimen data was compared to the
analyzed lives. The analyses were performed using three different options
available in ACDCYCLE:
1. cyclic analysis (no static crack growth)
2. static analysis (no retardation)
3. retardation (permit static growth and retardation)
The effective crack growth rates determined from the 649GC, Rene'95 tests and
the three types of ACDCYCLE analyses. The results for the R-0, 300 second
hlid time tests are compared in Figure 7.22. These results show excellv&t
agreement between the experimental data and the retardation predictions. One
of the segments which fell outside of the 2 fold scatter band was the 20Z
overpeak condition at the lowest value of Kol. The comparison with the
various analyses show that even with a 10% overpeak, there is a significant
benefit from static retardation. This benefit increases with increasing K
levels and overpeak ratios. The retardation results never totally eliminate a
time dependent effect due to the influence of the 15 second loading and
unloading cycle in these tests.
A similar comparison for the 649"C, R-0.5 Rene'95 overpeak tests are
shown In Figure 7.23. As in the l-we R ratic tes t.: 23% v,-pe:!x
condition at the lowest value of Kol fell outside the two fold scatter band.
These results also show the same general trend of increasing benefit with
higher overpeaks and higher K values.
This retardation model accurately predicts the lives of the constant K
test results. This is extremely remarkable considering the very complex
behavior of these materials and the fact that there are just two adjustable
constants in the model (fi and #2).
-259-

[ Rene'95 Rene'95649C 649CR=0.0 R=0.0
- 10% overpeak r 20% overpeoko0. 300 sec. hold 0 300 sec. ho!d -,
E Er
U41
r W
n 0
tO 20 50 1o 20 50Kop (MPa sqrt m) Kop (mPc! sqrt m)
(a) (b)
Rene'95649C
i R=0.0 Figure 7.22:1 507. overoeok
Sk 300 sec. hold
- Comparisoa of ACDCYCLE predictions
st at with experimental crack growth rates
o- in 649C, R-0.O Rene'95 hold timeE
- . ov=apeak tcqt-. with 300 second hold
4z ,. -Z-1 times and (a) 10%, (b) 20%, and (c)
cyic -] - 50% overpeaks.
I10 20 50
Kop (MPo sqrt m)
(c)
-260-

<@
* ' .4 ' , ' I ' . '
CC
LOLLn 0 v)
"4
< ben -. 0n
"4e
10 0M
C) 0
001 0> 01 £i 01AL
(7)~ af-
Na X1 w N4.)
-261- ~
The retardation model was used predict two situations encountered during
the prediction of the experimental data where there may be a significant
effect of retardation. Effective crack growth rates were determined by
permitting a crack Lo pLopagate 2.5 mm (0.1 inch) after it had fully developed
its retardation zone. These analyses were performed using the stacked case
option in ACDCYCLE. The first situation modeled was the R-0, 300 second cycle
period (frequency). It was previously shown (Figure 7.13c), that the
superposition model overpredicted this condition by about a factor of four.
The benefits of static retardation for loading ramps was shown in Figure 7.4.
This loading situation was modeled in three different ways:
I. no retardation
2. retardation witt. a block size of 1
3. retardation with a block size of 5
The block size is the number of cycles between load changes in these constant
AK tests. The block size of 5 was selected because that was the block size
for all three 300 second cycle segments in the R-0 test at 649"C. Figure 7.24
shows these three types of predictions along with the experimentally measured
crack growth rates. Static retardation reduces the predicted crack growth
rates by approximately 50 percent. There is relatively little influence of
block size until the crack growth rates get to high levels where there would
be a relatively large increment in crack growth between load adjustments.
Once this level is reached there is a rapid drop in the predicted crack growth
rates as indicated in Figure 7.24. It is difficult to perform these types of
autlysrs beca'ise ACDCYLE terminaLes the analysis whp-i Kmx r-ac., . 96' C'f Kc
There needs to be a significant increase in K during the cycle in order to
result in significant additional retardation.
The retardation constants used during loading ramps are the cyclic
constants and 4 cannot exceed 1. For hold time segments, the static constants
are used and there is no maximum value cap on 4. Under this situation, the
amount of retardation predicted for constant AK testing cycles may be
different for different block sizes. This cnncept was evaluated for the R-0,
300 second hold time tests which showed an order of magnitude difference in
-262-
C0
I 1I
Rene'95649C no retardationR=0.0300 sec. period
0
---V retardationU) block size= 1>1 /Ux
z x
0 7
o 9
zx x
retardationblock size = 5
0
10 20 50Kmax (MPa sqrt m)
Figure 7.24: Comparison of ACDCYCLE predictions with experimental crack
growth rates in 649*O, R-0.0 Rene'95 test with a cycle period of
300 seconds.
-263-

crack growth rate between constant load or increasing K tests and constant AK
tests. The results of the analysis with no retardation and retardation with a
block size of one is shown in Figure 7.25. Increasing K value results in more
teLarJation for the block size of 1. Once the critia! value is recched the
predicted crack growth rate drops precipitously. It is interesting that the
block sizes used in the constant AK segments shown in Figure 7.25 were 5 for
the lowest Kmax, 3 for the intermediate Kmax, and 1 for the highest Kmax. It
is interesting to note that the precipitous drop in K occurred between the
data points measured with block sizes of 3 and 1.
The results of the analyses shown in Figures 7.24 and 7.25 suggest that
static retardation can have a significant effect on the crack growth rates
measu ed in the constant AK tests. The observation that there was a much
larger difference between the two types of test data (constant AK vs.
increasing AK) in the hold time tests is also consioLrnt with the foLiulation
of the retardation model.
The different treatment of ramps and hold times is no problem for the
simple cycles evaluated in this investigation; however, as one performs
mission analyses, the difference between a hold time segment and a high
R-ratio ramp becomes almost indistinguishable. A similar problem exists for
other time-dependent crack growth models where no static crack growth is
assumed to occur for decteasing load ramps. If they are not counted, neither
should hold time segments which might interrupt those ramps. The latter type
of cycle is identical to those in the overpeak hold time tests where
significant timp dependent crack growth was ulb -r':cd for small values 3f th:
overpeak ratio. The potential difficulties suggest that this is a good
engineering approach to static retardation, but the process in poorly
understood, and the concept behind the retardation model may not reflect the
operating retardation mechanism.
7.4 MODELING OF ALLOY 718 AT 649"C
The crack growth data determined for Alloy 718 at 649'C were modeled
using procedures similar to those described in Section 7.3 for Rene'95. There
-264-

00
Rene'95649CR=0.O no300 sec. hold retardaton
• Kox Mx sqIm
E
0 se0onds
-265-
were two major exceptions - no Alloy 718 threshold data were obtained as a
function of frequency so only the hold time portion of the threshold model was
derived and a totally interpolative model for Alloy 718 was not developed for
tht reasons demonstrated iLI Seccion 7.3.4.
7.4.1 Alloy 718 Threshold Model
The material constants for the interpolation threshold model (Equation
7.1) were determined using the same nonlinear optimization techniques used for
Rene'95. An additional restriction was placed on the Alloy 718 model where
all constants related to testing frequency were set to zero because Alloy 718
threshold data was not collected as a function of test frequency. The
constants for the threshold interpolation model are listed in Table 7.7. The
results of this model are compared to the hold time threshold data as shown in
Figure 7.26. ThQ mod-! acturately predlctb the influence of hold times for R
ratios of 0 and 0.5. The sudden decrease in threshold at hold time of 30
seconds for a R-ratio of 0.8 was not modeled well, however the threshold at
all other conditions were predicted reasonably well. This model predicts most
of these threshold values within 5 MPam. The interpolative threshold model
comprised the interpolative portion of the Alloy 718 interpolation +
superposition model.
7.4.2 Alloy 718 Interpolation + Suoerposition Model
The time-dependent contribution to Alloy 718 crack growth (non-threshold)
was dretericf.ned usinig the supe;potition of cyzlic nnd static crack grolth. Tht.
static crack growth curve used in the superposition model is represented by a
Paris equation truncated at the lower end by a threshold value. The static
threshold value was taken to be the lowest value of K at which crack growth
was measured in the 649C Alloy 718 static K-shed test. The 649C static
crack growth data shown in Figure 5.52 were edited to eliminate the
near-threshold regime in the K-shed test and the artificial threshold data or
"tails" in the constant load tests. Linear regression analysis to tha
logarithmic form of the Paris equation was performed to determine the best fit
through the edited data. The static threshold and Paris equation constants
-266-
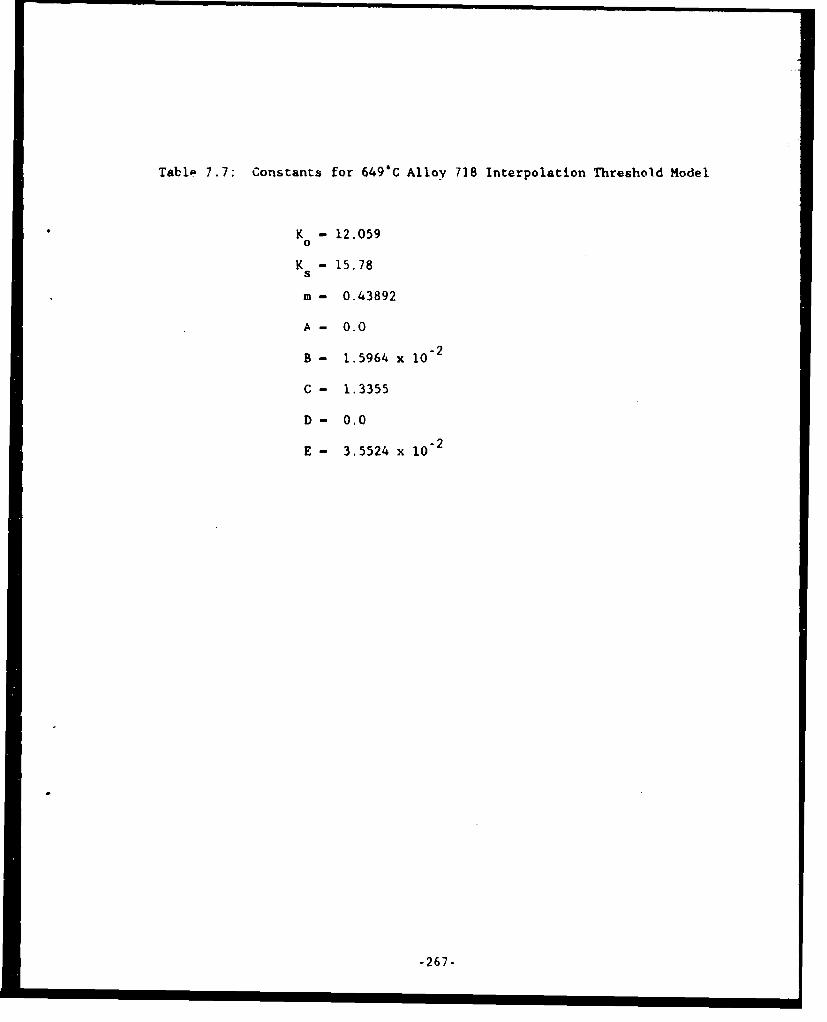
Table 7.7: Constants for 649%C Alloy 718 Interpolation Threshold Model
K - 12.0590
K - 15.78s
m - 0.43892
A - 0.0
B - 1.5964 x 10⁻²
C - 1.3355
D - 0.0
E - 3.5524 x 10'2
-267-
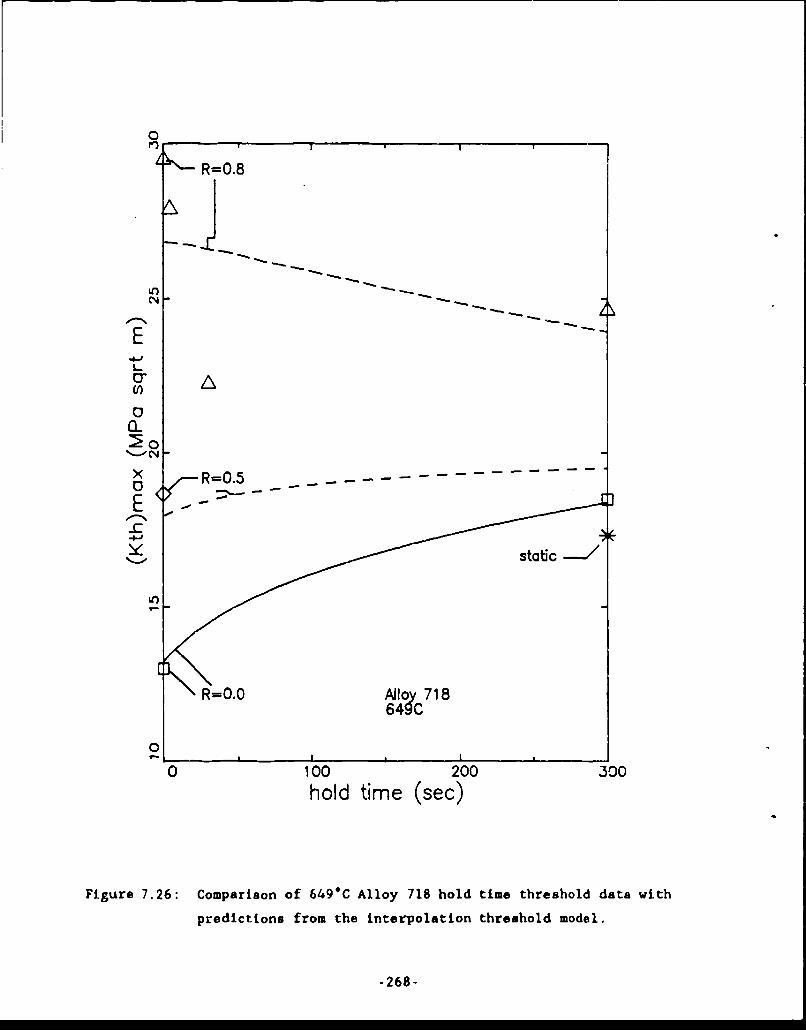
0
R=0.8
LO
C,)
E
0
E-
R=0-0Aflo 71 8
0
0 100 200 300hold time (sec)
Figure 7.26: Comparison of 649*C Alloy 718 hold time threshold data with
predictions from the interpolation threshold model.
-268-

are listed in Table 7.8. This curve is shown along with the 649"C Alloy 718
static crack growth data in Figure 7.27. This looks to be a good fit to the
data, but similar to the observed behavior in Rene'95, there is a large amount
of scatter in these data. The scatter may afftCL Lhe establishment of a
reliable static crack growth curve. The quality of this curve is extremely
important because it is the source of the time-dependent contribution to the
superposition model.
The 0 second hold time (3 second period) test data were used to determine
the cyclic crack growth constants. The procedure used for Alloy 718 was
different than that used for Rene'95. In Alloy 718, a cyclic crack growth
curve was drawn through the R-0 continuously cycled data. The constants of
the sigmoidal curve (Kth, B, P, Q, and D) were determined using nonlinear
optimization analysis of the R-0, 0 second hold time tests. As in the case of
Relke 95, the value of Kc was set to be 65.88 MFa/m (60 ksiin.). ACDCYCLE was
then used to combine the effect of the cyclic and static crack growth. The
resultant curve was above the R-0 cyclic data and had a slightly higher slope.
The slope of the calculated cyclic curve was decreased by adjusting the value
of P in the sigmoidal equation which controls the slope of the curve at the
inflection point which occurs in Region II. The totally cyclic curve,
superposition (cyclic + superposition) curve, and R-0, 0 second hold time data
are shown in Figure 7-28. These data show that the calculated superposition
curve falls through the experimental data.
The value of the Walker exponent (m+) was determined from the R-0.5, 0
second hold time test data using am iteration appeoach. The Lyc!ic curve,
superposition curve, and experimental data for the R-0.5, 3 second cycle are
shown in Figure 7-29 along with the crack growth data from the R-0.5, 0 second
hold time tests. The agreement is quite good at low K values and diminishes
with increasing stress intensity. The values of the cyclic crack growth
constants are listed In Table 7.8.
-269-

Table 7.8: Constants for 649% Alloy Superposition Model
Cyclic Constants
Kth - 11.848 Q - 0.85339
Kc- 60.0 D - -1.248 x 10⁻²
B - -11.939 M+- 0.50
P - 1.2129
Static Constants
Ks - 15.78
C - 5.517 x 10⁻¹³
n - 5.023
Static Retardation Constants
*1- -3.237
#2 - 0.241
-270-

0
Alloy 718AA6490C t
o A i
IA
(113
(n0) 0
N I"'!
E
/0/
-4 --j
0 0(0
I
0 a K shed
A constant load
0
10 20 50K (MPa sqrt m)
Figure 7.27: Static crack growth curve used in the 649GC Alloy 718
superposition model.
-271-

0
Alloy 7187 640C
O: R=0.00 sec. hold
o 0 superposition
Eo
0-
0
CD
10 20 50Kmox (MPa sqrt m)
Figure 7.28: Comparison of cyclic and superposition ACDCYCLE predictions with
Alloy 718 crack growth data measured during a R-0, 0 second hold
time test in air.
-272-
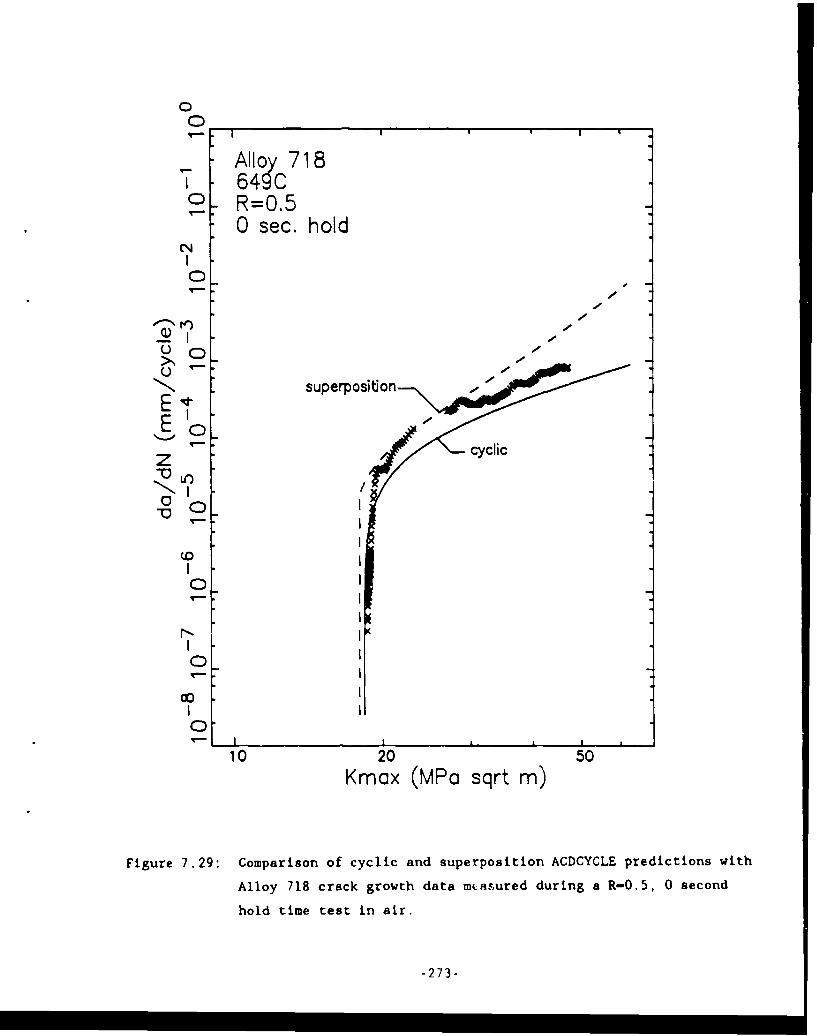
0
Alloy 718
C:' R=0.50 sec. hold
0
Q) I -
U -
E superposition
7 0
0
0
10 20 50Kmox (MPa sqrt m)
Figure 7.29: Comparison of cyclic and superposition ACDCYCLE predictions with
Alloy 718 crack growth data miasured during a R-0.5, 0 second
hold time test in air.
-273-
7.4.3 Comoarison of Predicted and Measured Crack Growth
The constants listed in Tables 7.7 and 7.8 were entered in materials data
files and tht crack growth option in ACDCYCLE was usad to generate crack
growth curves for the 12 different testing conditions evaluated in this
program (3 R-ratios x 4 hold times). Figure 7.30 shows the comparison of the
experimental data with the prediction of interpolation + superposition model
for 649*C, R-0 hold time tests on Alloy 718. As in the previous figures for
Rene'95, the small symbols represent the results from the threshold tests
while the large symbols represent the data from the constant AK tests. The
solid line is the prediction frum the interpolation + superposition model.
The results of the constant AK tests were lower than the increasing K tests,
particularly for the hold time tests due to retardation between constant load
cycling segments. Thus, the increasing K portion on the threshold tests are
considered to be a better indicator or pruvide more accurate crack growth
rates.
The interpolation + superposition model seems to adequately predict the
crack growth behavior for these R-0 hold time tests. The predictions for the
0, 4, and 30 second hold time tests show a step function increase in the crack
growth rates at K-levels slightly above the transition between Regions I and
II. This sudden increase occurs at the static threshold values. This
behavior occurs because the threshold values calculated for R-0 tests with
hold times less than approximately 200 seconds are less than the static crack
growth threshold (Figure 7.26). The only comparisons in this report will be
for rl-e rhiree R-ratios evaluaLed exporimental.y, however This tY.. of ? step
increase would also be predicted for other near-zero positive R-ratios for low
hold times. For the cases shown in Figure 7.30, either the changes in crack
growth rate are relatively small (hold times of 0 and 4 seconds) or the cyclic
and static threshold values a-e similar (30 second hold time) so that the
experimental data neither substantiate nor refutes this type of behavior.
More experimental work is required to evaluate the crack growth behavior in
this regime.
-274-
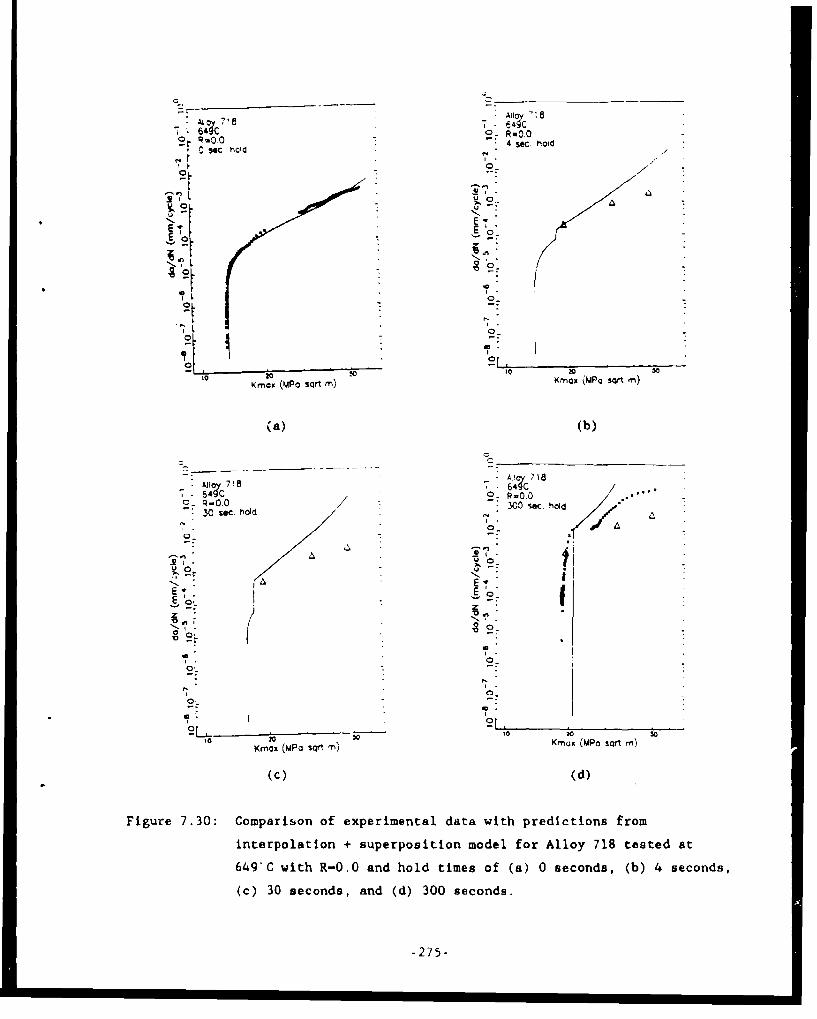
7
64o,' C. 6~o0 R=O.O,.O : 4 sec. hoid
C 34C ' d
7o7
*II
0_
Krnox (MPo sqrt M) Krnox 'MPa sqt rn)N I
ka) (b)
• lIo 7! 8 - 64 C64 C _R-0.0 .. "-7 R-0.O0/ 300 sec- hoic
30 .a
'j (-" 6 C - "~.
z10
10
?L ,o 20 s
'0. 00 50KnI Osftr) s
Kmox (MPo sqrk)Ko MP qtm
(c) (d)
Figure 7.30: Comparison of experimental data with predictions from
interpolation + superposition model for Alloy 718 tested at
6490C with R-0.0 and hold times of (a) 0 seconds, (b) 4 seconds,
(c) 30 seconds, and (d) 300 seconds.
-275-
Figure 7.31 compares the predictions between the interpolation +
superposition model and the Alloy 718 R-0.5 tests. With the exception of the
0 second hold time condition, no threshold tests were performed at this
R-ratio. The longer hold tirme tests show that the predictions are much higiler
than the results from the constant AK tests. It is not known if these
discrepancies result from inadequacies of the model or large amounts of
retardation during the constant AK tests. As anticipated, the R-0.5
predictions do not show the step function in crack growth rates because the
calculated (Kth)max values exceed the static threshold.
The R-0.8 test data are compared to the interpolation + superposition
predictions in Figure 7.32. For all hold times, the predictions are
approximately 2 to 4 times greater than the experimentally measured crack
growth rates. This type of model also overpredicted the crack growth rates
measuxed in Rene'95. This model correctly predicts the relaLive effects of
hold times, but appears to be inaccurate by a constant factor. This problem
could be alleviated by using an effective static crack growth curve determined
from hold time data, rather than from static crack growth tests. The combined
influence of cyclic and static loads may result in changes in the deformation
and stress fields near the crack tip and thus different crack growth rates
relative to those measured in specimens under statis loads.
7.4.4 Retardation Model
The modified Willenborg retardation model was used to model the overpeak
reLardation bchavior measured i.1 Alloy 718 Pt 649C. The Alluy 718
retardation constants were determined for ACDCYCLE analyses of the
experimental results from the 10% overpeak tests using the same approach as
described for Rene'95 in Section 7.3.5. Figure 7.33 shows the resulting
values of I determined from the 10% overpeak tests. As in the case of
Rene'95, it appears that f is linear with Kol and does not seem to be very
sensitive to R ratio. The line in this figure is the best fit through the
data. The slope and intercept determined the values of #1 and #2, The values
of the retardution constants are listed in Table 7.8. The major difference
between the Rene'95 and Alloy 718 retardation constants occur at low values of
-276-

Ail 718 - Ail oy 71864C 641C
'O. ROR-0.50 SC. hold ;o 4 O. hLd
E v
N 1 ( 41
E T L ,,
100I7
to o
- I "
o€ . 0 '
Kmox (MPo sqrt m) Kmox (MPo sqrt m)
(a) (b)
Cm
* Ajlcy 718. 649
ER-0.5 / - R-0.530 "C. hold 30 c. hold
0 L 6
1*1
I'
' 0 r
100
•7"-. . 6_
eL I , 0 20___ - 20 so
Kmax (UPO sqrt m) Kmax (MP sqrt m)
(c) (d)
Figure 7.31: Comparison of experimental data with predictions from
interpolation + superposition model for Alloy 718 tested at
649*C with R-0.5 and hold times of (a) 0 seconds, (b) 4 seconds,
(c) 30 seconds, and (d) 300 seconds.
-277-

.64I~ C1 7 " - v.7 639C a 64 C
0 SOC. hold 4 sec. hold
-L- 0o
Er
0,
to 0 " ,0 2 •Kmox (MPa sqt m) Kmox (MPo sqrt
(a) (b)
- oy 718 7oy "8
,64 C7 649C ""-6]
o. R=0.8 - 030 W. hold 300 sec. hod.
i
I-0.
10"~ I00 ot
7 ,
0
Kmox (MPo ot rn) Kmax (MPG Sqrt rr)
(c) (d)
Figure 7.32: Comparison of experimental data with predictions from
interpolation + superposition model for Alloy 718 tested at
649C with R-0.8 and hold times of (a) 0 seconds, (b) 4 seconds,
(c) 30 seconds, and (d) 300 seconds.
-278-
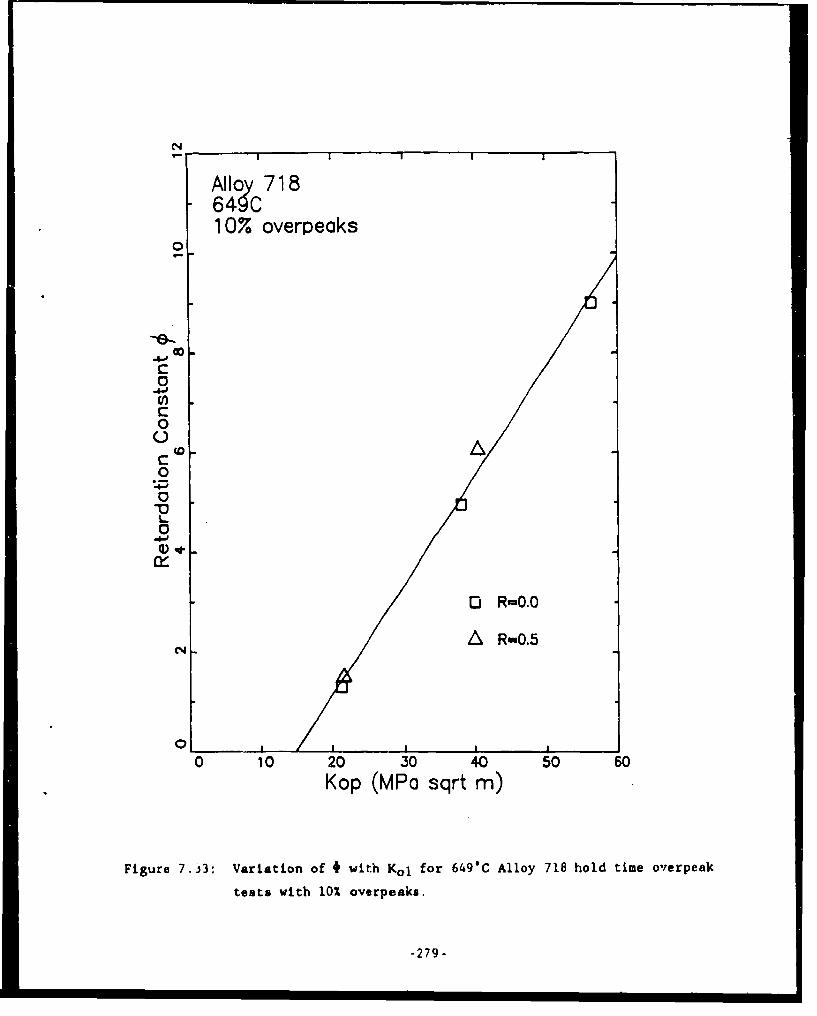
Alloy 718649010% overpeoks
0
0
0
0
0-.04
0
0 10 20 30 40 50 60Kop (MPa sqrt m)
Figure 7.j3: Variation of * with Ko1 for 649'C Alloy 718 hold time overpeelc
tests with 10% ovarpeaka.
-279-
Kol. The value of #1 was positive for Rene'95 but is negative for Alloy 718.
For Alloy 718, the value of # is positive only for Kol values greater than
14.75 MPajm (13.43 ksi/in.). This will probably have little effect on the
ability to predict the crack growth rates of Alloy 71' bec~usz in almost every
case, the cyclic and static threshold values (Figure 7.26) exceed this value.
The values of # for both Rene'95 and Alloy 718 can be much greater than unity.
As discussed in Section 7.3.5, this suggests that the strong influence of
overpeaks on retarding hold time crack growth results from complex stress
relaxacion processes.
The values of *1 and f2 were used to predict the number of cycles
required to propagate through all the individual segments in the 649"C Alloy
718 overpeak hold time test specimens. These results are cor,,pared with the
experimentally measured values in Figure 7.34. The solid line in these
figures represents perfect agreement. -Me dashed lines enclose a region which
is within a factor of two of the perfect agreement. In general, the agreement
is quite good; however, the model predicts longer lives than experienced
experimentally for R-O long live segments as shown in Figure 7.34a. The three
outliers correspond to long hold time situations at low values of Kol (21 to
24 MPajm). The longer predicted lives result from suppression of K to below
the static threshold where no hold time effect is calculated. This type of an
effect was observed to a leaser extent in the prediction of the R-0.5 overpeak
tests (Figure 7.34b). This may suggests that the static threshold should be
lower than that measured in the single static threshold tests performed on
Alloy 718 at 6490C. For most other cases, the retardation model combined with
tb inreipuiation + superposition model scnurn-ely ?redicted rhe lIveb of the
Alloy 718 overpeak tests.
The effective crack growth rates calculated using cyclic (no static or
retardation), static (no retardation), and retardation (including static)
analysis of the Alloy 718 overpeak tests was performed. The results of the
analysis and experimental data for the R-0, 300 second hold time tests are
shown in Figures 7.35 and 7.36. These results show excellent agreement
between the experimental data and the retardation predictions for all cases
vxcept those with low values of Kol as discussed previously. As observed for
-280-

6U
C44
o 0
N8
0
00 Nb
N -
Naopaj N
C-4
N ON
C- Z 0 V
7 00
C)4'
ow Uo Uo 01 0
N tblaid
-'J- IIN-281:
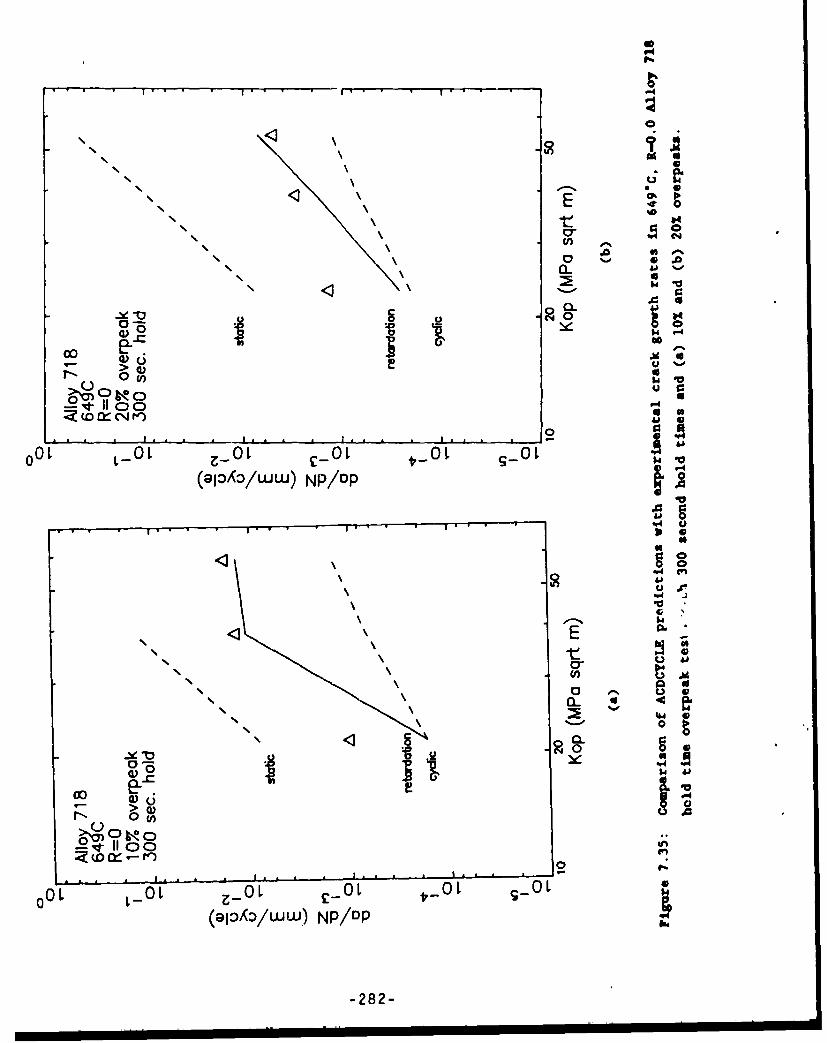
a
U9.
*I.. I.. * **. * I.
E0
NrC
00~
CN 0 0
a)-c
U V
O(J) 0
Q) s pq
Q080
0LA0 1 L 0L 0£ L 0 LO
o~ U-
NP/Dp
-282-

c"4
N I
N 00
o o
N 0% C
4
- I i * L _
o 0 _O (_40OL O c_ L,
>00
Ur n
A-2830
0I
000
>~ 6
4.
OVT 0C)(. - IaN *114J
N 90DIW NPO
N I -283-

Rene'95, there is a significant benefit from static retardation. This benefit
incteases with increasing K levels and overpeak ratios. The retardation
results never totally eliminate a time dependent effect due to the influence
of the 15 second loading and unloading cycle in these LeSCS.
A similar comparison for the 649"C, R-0.5, 300 second hold time Alloy 718
overpeak tests are shown in Figure 7.23. The prediction of the low Kol , 10%
overpeak condition was much lower than the experimentally measured crack
growth rate. This result also suggests the effective static threshold of
Alloy 71R is lower than that measured in the static threshold test. These
results also show the same general trend of increasing benefit with higher
overpeaks and higher K values.
These retardation model predictions for Alloy 718 were not as accurate as
those shown for Rene'95, but are still quite geod. IL appears thbt bome fine
tuning of the static threshold could improve the quality of these predictions.
These results show that this retardation model can provide relatively accurate
estimates of the suppression of hold time crack growth resulting from
overpeaks.
-284-
8.0 SUIOAR.Y AND CONCLUSIONS
An extensive crack growth data base was generated on both Rene°95 and
Alloy 718. These data covered eight orders of magnitude in crack growth rate
and included the influence of hold time, test frequency, R ratio, and overpeak
ratio. In general, Region II crack growth rates were proportional to the hold
time suggesting that these data can be predicted using a linear superposition
model. Increasing test temperature increased the acceleration in crack growth
rates due to time dependent crack growth.
The crack growth data measured in this investigation followed these
trends; however, there were some surprising low temperature Region II Rene'95
results and higher temperature near-threshold data for both materials which
suggest that localized crack tip blunting or stress redistribution can result
in lower crack growth rates than those anticipated from the static component
of crack growth. Sectioning experiments on an interrupted 649°C 300 second
hold time threshold test of Alloy 718 showed that the crack was open over the
entire range of crack length, but there was not evidence of localized
blunting. This suggested that creep-assisted stress relaxation and
redistribution may help to lower the crack tip stress concentration for
situations of relatively slow static crack growth (low temperatures and
near-threshold crack growth).
A very strong retardation effect was observed where relatively small
overpeaks could totally suppress time dependent crack growth. The strong
retardbrion effects combined with very rapid, ttme dependent crazk growth
rates resulted in artificially low crack growth rates during constant AK
testing. This type of testing should be avoided in future test programs.
Extensive fractography was performed on the fractured tests specimens.
The fracture mode of cyclic crack growth was transgranular; however, as the
amount of static crack growth increased, the fracture mode transitioned to an
intergranular mode. Qualitatively this supported the use of a superposition
model which separately considers the components of cyclic and static crack
growth. It was also shown that hold time cycling in vacuum resulted in higher
-285-

crack growth rates than continuous cycling in vacuum and a transition from
transgranular to intergranular crack growth. These results show the strong
influence of creep on time dependent crack growth. The faster crack growth
rates may suggest that intergranular crack propagation in inherently faster
than growth in a transgranular mode.
Transient crack growth behavior was observed between hold time cycling
and more rapid constant frequency testing. It was shown that a damage zone
was created at the crack tip which increased in size with reductions in creep
resistance (Alloy 718 vs. Rene'95), increasing temperature, increasing
R-ratio, and increasing hold time. These types of tests were also performed
on Alloy 718 at 649*C in air and vacuum. These results showed that the damage
zone was formed by creep, independent of environment; however, air was
necessary at the crack tip in order to cause accelerated crack growth. The
transient and vacuum crack growth tests showed that the time dependent crack
growth mechanism in nickel-base superalloys is a complex interaction between
creep, fatigue, and environment.
The crack growth data obtained in this investigation were modeled using a
sigmoidal (Knaus) crack growth equation due to the ability of this equation to
independently adjust the near-threshold and Paris regimes (Regions I and II).
The near-threshold crack growth data in this program were modeled using an
interpolative model to predict the influence of R-ratio, frequency, and hold
time. This model was then combined with either a totally interpolative model
or a linear superposition model to predict the time dependent crack growth
rates. The linear superposition arproach included the Walker model to account
for the influence of R on the cyclic crack growth rates. Only the 649"C
Rene'95 data were modeled using both an interpolation and an interpolation +
superposition models. These models adequately predicted the entire data base,
but the interpolation model made what appeared to be unreasonable estimates of
crack growth rates outside the range covered by the data base. On this basis,
the superposition model was selected as the best model.
-286-
The 649'C Alloy 718 data were also modeled using the linear superposition
model. For both materials the static crack growth component was predicted
from a curve constructed through the static crack growth data which showed a
relatively large amount of scatter. It may be possible to improve the quality
of the predictions by using an inferred static crack growth curve as
determined from hold time tests.
A modified Willenborg retardation model developed for cyclic retardation
was successfully applied to the overpeak hold time tests. It was necessary to
use material constants in excess of those considered reasonable. The large
amount of static crack growth retardation may be related to localized creep
deformation at the crack tip.
A computer code called ACDCYCLE was developed which can access all these
models and perform a variety of functions including residual life predictions
and the generation of crack growth rate curves. This code can be run on IBM
XT personal computers with an 8087 math coprocessor chip. This code was
delivered to the Air Force Materials Laboratory.
A superposition model was successfully developed but some of the
experimental data suggests that nonlinear has the potential for both
accelerating time-dependent crack growth through creep-induced damage or
slowing it down by creep-induced stress redistribution. It was necessary to
include an interpolation threshold model and a largely empirical retardation
model to accurately predict conditions which are believed to be highly
dependent on the stress redistritation. The ,upeLposition model worked well
for the situations considered in this investigation, but the development of
alloys with lower time dependent cra!- growth rates and / or application of
the current materials to higher temperatuts with the resultant lower creep
resistance may require the development and &pplication of non linear fracture
mechanics parameters to better describe time dependent crack growth behavior.
-287-

9.0 REFERENCES
1. L.F. Coffin, Jr., "The Effect of Vacuum on the High Temperature Low
Cycle Fatigue Behavior of Structural Metals", Corrosion Fatigue:
Chemistry. Mechanics. Microstructure, Proceedings of the Internatioal
Conference on Corrosion Fatigue, NACE, Houston, 1972, pp. 590-600
2. L.F. Coffin, Jr., "The Effect of High Vacuum on the Low Cycle Fatigue
Law", Met. Tr.,a.s., 3, 1972, pp. 1777-1788
3. L.F. Coffin, Jr., Fracture 1969, Proceedings of Second International
Conference on Fracture, Brighton, 1969, Chapman and Hall, London, 1969,
p.643
4. L.F. Coffin, Jr., Proceedings. of the Air Force Conference on Fatigue
and Fracture of Aircraft Structures and Materials, AFFDL TR 70-144, Air
Force Flight Dynamics Laboratory, Wright-Patterson AFB,
Wright-Patterson, Ohio, 1970, p.30 1
5. W.J. Ostergren, ASME-MPC Svmposium of Creep-Fatigue Interaction, MPC.3,
ASME, pp.170- 20 2
6. S.S. Manson, G.R. Halford, and M.H. Hirschberg, Design for Elevated
Temperature Environment, S.Y. Zamrik, editor, ASME, 1971, pp. 1 2 -2 8 .
7. G.R. Halford and J.F. Saltsman, Proceedings of ASME International
Conference on Adances in Life Prediction Methods, D.A. Woodford and
J.R. Whitehead, editors, ASME, 1963, pp. 17-26.
8. J.F. Saltsman and G.R. Halford, ASTM STP 942, ASTM, 1987,pp. xxx-xxx.
9. W.H. Chang, Superalloys - Processing, AIME, 1972, MCIC-72-10
10. D.A. Woodford and R.H. Bricknell, Embrittlement of Alloys, Academic
Press, 1982
-289-
11. Clavel and Pineau, Met, Trans., 2A, 1978, pp.471-480
12. R.M. relloux and J.S. Huang, Creep-Fatigue-Environment Interactions,
R.M. Pelloux and N.S. Stoloff, editors, TMS-AIME, 1980, p. 151.
13. J.P. Pedron and A. Pineau, Mat. Sci. Enj., 6, 1982, pp. 14 3-1 56
14. K.R. Bain and R.M. Pelloux, Met. Trans., 15A, 1984, pp. 381-388
15. A. Diboine and A. Pineau, Fat. Fract. Eng. Mat. Str., I0, 1987,pp.
141-151
16. K. Sadananda and S. Shahinian, Met. Trans., 8, 1977, pp. 439-449
17. K. Sadananda and S. Shahinian, Characterization of Materials for Service
at Elevated Temperatures, ASHE, Series MPC-7, George V. Smith, editor,
1978, pp. 10 7-12 7
18. S. Shahinian and K. Sadanadna, Engineering Aspects of Creep, j,1980, pp.
1
19. K. Sadananda and S. Shahinian, Metals Tech., 1982, pp. 18-25
20. James M. Larsen and Theodore Nicholas, "Cumulative-Damage Modeling of
Fatigue Crack Growth in Turbine Engine Materials", Engineering Fracture
Mechnlcs, 22, 1985, pp. 713-730
21. Jeffrey R. Christoff, "Evaluation of Fatigue-Creep Crack Growth in an
Engine Alloy", M.S. Thesis, Air Force Institute of Technology,
Wright-Patterson Air Force Base, Ohio, 1983.
22. T. Nicholas, T. Weerasooriya, and N.E. Ashbaugh, "A Model for
Creep/Fatigue Interaction in Alloy 718", ASTM STP 905, Fracture
Mechanics: Sixteenth Volume, ASTM, 1986, Philadelphia, Pa., pp.167-180
-290-

23. T. Nicholas and T. Weerasooriya, "Hold-Time Effects in Elevated
Temperature Gatigue Crack Propagation", ASTM STP 905, Fracture
Mecharics: Sixteenth Volume, ASTM, 1986, Philadilphia, Pa., pp.155-168
24. Tusit Weerasooriya, "Effect of Frequency on Fatigue Crack Growth Rate of
Inconel 718 at High Temperature", AFWAL-TR-87-4038, University of
Dayton, Dayton, Ohio. 45469, June 1987
25. H.D. Solomon and L.F. Coffin, Jr., ASTM STP 520, ASTM, 1973, pp.112-122.
26. H. D. Solomon, Met, Trans, 4, 1973, pp.341-347
27. S. Floreen, Met, Trans., 6A, 1975, pp. 1741-1749
28. A. Coles, R.E. Johnson, and H.G. Popp, J. of Enz. Mat. Tech., 98, 1976,
pp. 305-315
29. S. Floreen and R.H. Kane, Met.Trans., 10A, 197S, pp.1745-1751
30. Lee A. James and W.J. Mills, Eng. Frac. Mech., 22, 1985, pp. 797-818
31. B.A. Cowles, D.L. Sims, and J.R. Warren, "Evaluation of the Cyclic
Behavior of Aircraft Turbine Eisk Alloys", NASA-CR-1594039, Octobe'r 1978
32. D.A. Utah, "Crack Modeling in An Advance Powder Metallurgy Alloy",
AFWAL-TR-80-4098, July 1981
33. Robert C. Donath, "Crack Growth Behavior of Alloy IN100 Under Sustained
Load at 732"C (1350"F)", AFWAL-TR-80-4131, Air Force Materials
Laboratory, Wright-Patterson Air Force Base, Ohio 45433, April 1981
34. J.M. Larsen and T. Nicholas, ASIM STP 771, ASTM, 1983, pp. 11-536 -
11-552.
-291-

35. P.C. Paris, "Fatigue - An Interdisciplinary Approach", Proceedings 10 th
Sagamore Conference, Syracuse University Press, Syracuse, N.Y., 1964,
p. 107
36. R.M. Wallace, C.G. Annis, Jr., and D.L. Sims, "Application of Fracture
Mechanics at Elevated Temperatures", AFML-TR-76-176 Part II,
Wright-Patterson Air Force Base, April 1977
37. J.M. Larsen, B.J. Schwartz, and C.G. Annis, "Cumulative Damage Fracture
Mechanics Under Engine Spectra", Technical Report AFML-TR-79-4159,
Wright-Patterson AFB, Ohio January 1980
38. D.L. Sims and F.K. Haake, "Evaluation of Crack Growth in Advanced P/M
Alloys", AWWAL-TR-79-4160, Wright-Patterson Air Force Base, March 1980
39. W. Knaus, General Electric Aircraft Engines, unpublished research, 1965
40. K. Walker, "The Effect of Stress Ratio During Crack Propagation and
Fatigue for 2024-T3 and 7075-T6 Aluminum", E Environment and
Complex Load History on Fatijue Life, ASTM STP §2", ASTM, 1970, pp.1 -14
41. R.H. Van Stone, "The Influence of Temperature and Stress Ratio on the
Crack Growth Behavior of Rene'95", GE Aircraft Engines Report 82-640,
Cincinnati, Ohio 45215, 1982
42. R.H. Van Stone and D.D. Krueger, "Investigation of Direct Aged Inconel
718 Fatigue Behavior", Contract N00019-82-C-0373, Final Report, General
Electric Aircraft Engine Business Group, Cincinnati, Ohio 45215,
December 1984.
43. R.H. Van Stone, M.S. Gilbert, O.C. Gooden, and J.H. Laflen, AST. STP
W , ASTM, 1988, pp. 637-656
44. R.H. Van Stone and D.D. Krueger, ATM ST_ - , ASTM, 1988, pp. 883-906
-292-

45. FL.P. Wei and J.D. Landes, Mat. Res. Std., 9, 1969, pp. 25-46
46. J.P. Gallagher and R.P. Wei, Corrosion Fatigue, NACE-2, NACE,1972, pp.
409-423.
47. H.D. Solomon, Corrosion Fatigue, NACE-2, NACE, 1972, pp.4 2 0 -4 2 1
48. M.O. Spiedel, Hiegh T Irature Materials in Gas Turbines, 1974, p.20 6
49. R.H. Van Stone, GE Aircraft Engines, Cincinnati, Ohio 45215, unpublished
research, 1987
50. T. Weerasooriya and T. Nicholas, "Ovorload Effects in Sustained Load
Crack Growth in Inconel 718", Fracture Hechanics: Eighteenth Symposium,
ASTM $TEILa, ASTM, Philadelphia, 1987, to be published
51. J. Willenborg, R. Engle, and H. Wood, "A Crack Growth Retardation Model
Using an Effective Stress Concept", AFFDL-TM-71-l-FBR, Wright-Patterson
Air Force Base, Ohio, January 1971
52. D.R. Chang, D.D. Krueger, and R.A. Sprague, "Superalloy Powder
Processing, Properties, and Turbine Disk Application", published in
Superalloy 1984, ASK
53. D.D. Krueger, R.H. Van Stone, and M.F. Henry, "Metallurgical Effects on
Fatigue Behavior of Gas Turbine Disk Alloys", NAVAIR Contract
N00019-82-C-0226, Final Report, General Electric Aircraft Engine
Business Group, Cincinnati, Ohio 45215, 1985
54. L.A. James, J. of Eng. Mat. Tech., 1973, pp.254-256
55. D.D. Krufger, Stephen D. Antolovich, and R.H. Van Stone, Met. Trans.,
J.A, 1987, pp.1 4 3 1-14 4 9
-293-

56. R.H. Van Stone, D.D. Krueger, and L.T. Duvelius, ASTM STP 791, ASTM,
Philadelphia, 1983, pp.553 -558
57. J.l. Yuen, P. Roy, and W.D. Nix, Mer.Trans., &)L, 1985, pp. 1769-1775
58. K.S. Kim, R.H. Van Stone, S.N. Malik, and J.H. Laflen, "Elevated
Temperature Crack Growth", Contract NAS3-23940, Final Report, GE
Aircraft Engines, Cicicnnati, Ohio 45215, 1988
59. D.F. Paulonis, J.M. Oblak, and D.S. Duvall, Transactions ASM, 62, 1969,
pp. 611-622.
60. P.K. Wright, H. Jang, and H.G. Popp, "Fatigue and Fracture of Advanced
Blade Materials", AFWAL-TR-84-4166, GE Aircraft Engines, Cincinnati,
Ohio 45215, February 1985
61. D.O. Harris, J. Bas. Enj ,j2, 1967, p.4 9 .
62. S.N. Malik and M.S. Gilbert, GE Aircraft Engines, Cincinnati, Ohio
45215, private communication, 1986
63. R.P. Gangloff, Fat. Ent. Hat. and Structures, -4, 1981, pp. 15-33
64. J.R. Wilcox and M.F. Henry, General Electric Corporate Research and
Development, Schenectady, New York 12301, unpublished literature, 1984.
65. W.R. Catlin, D.C. Lord, T.A. Prater, and L.F. Coffin, "The Reversing DC
Potential Method", General Electric Corporate Research and Development,
Schenectady, New York 12301, accepted for publication by ASTM.
66. H.H. Johnson, Materials Research and Standards, , 1965, pp. 442-445.
67. M.F. Henry, General Electric Corporate Research and
Devel.opment,Schenectady, New York 12301, unpublished research, 1986.
-294-

68. "Standard Test Method For Measurement of Fatigue Crack Growth Rates",
E647-86a, .987 Annual Book of ASTM Stndards, 03.01, ASTM, 1987, pp.
899-926
69. D.D. Krueger, "Effects of Grain Size and Precipiatate Size on the
Fatigue Crack Behavior of Alloy 718 at 427C", M.S. Thesis, University of
Cincinnati, Cincinnati, Ohio 45215, 1984
70 L.P. Zawada and l. Niclolas, ASTM STP 945, ASTM, 1987,
71. W.J. Mills and R.W. Hertzberg, En&. Frac. Mech., 7, 1975, pp. 705-711
72. H. Tada, P.C. Paris, and G.R. Irwin, The Stress Analysis of Cracks
Handbook, Del Research Corporation, Hellertown, Pa. 1973
-295-
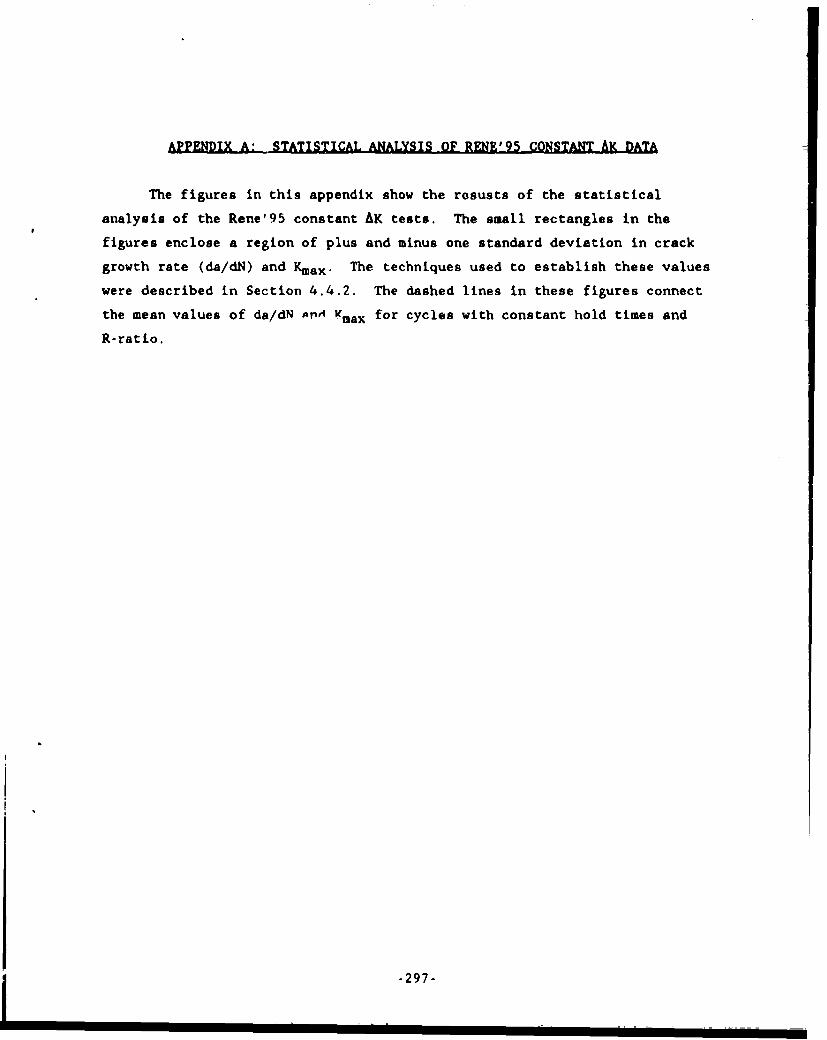
APPENDIX A: STATISTICAL ANALYSIS OF RENE'95 CONSTANT AK DATA
The figures in this appendix show the resusts of the statistical
analysis of the Rene'95 constant AK tests. The small rectangles in the
figures enclose a region of plus and minus one standard deviation in crack
growth rate (da/dN) and Kmax. The techniques used to establish these values
were described in Section 4.4.2. The dashed lines in these figures connect
the mean values of da/dN ^rA Vmax for cycles with constant hold times and
R-ratio.
-297-
0
Rene'95538CR=O.O
0-
C
EholdE(sec)
z -4
0--
0-
1O
0
10 20 50Kmax (MPa sqrt m)
Figure A.l: Statistical analysis results of Rene'95 constant AK hold time
crack growth data from specimen cycled at 538"C with a R-ratio
of 0.0.
-298-

Rene'95 Rene'95593C 593CR=0.0 R=0.5 '
ZN 00 1 e
450 E /
N 0°
) -m
-ee9 cosan K odliedrc
Z 0., a
0 4 -
o 0
10 20 50 10 20
Kmax (MPa sqrt m) Kmax (MPo sqrt m)
(a) (b)
0
SRene'95
59(C)
R=0.8-
j Figure A.2:0
Statistical analysis results of
-%'(,,Rene'95 constant AK hold time crack
U- , soc growth data from specimens cycled atE /E/ 593"C with R-ratios of (a) 0.0, (b)
Z / 0.5, and (c) 0.8.
-//-.
(c))
-299-

Rene'95 Rene'95593C 593C"
R=O.O R=0.57T"
C -G~N *1
1
/E .3W0
Z 0 / 30
0 4 O
o o
10 20 so 10 oKmx (MPa sqrt m) Kmax (MPa sqrt m)
)(b)
0
Rene'95593CR=0.8
Figure A.3:
C
Statistical analysis results of- IN Rene'95 constant AK frequency crack
%,, -. / growth data from specimens .cycled atE/
E, 593C with R-ra'ioo of () 0.0, (b)
Z - 0.5, and (c) 0.8.
o - -
1~ *~30
4
ool0 .
10 20 50
Kmox (MPo sqrt m)
(c)-300-

o 0o 0
- - I
Rene'95 Rene'95649C 649CR=0.0 R=0.5 0
0 0 /
0~ 0300
,-- /
E E
0
In
Z1 01 I ..
10 20 so 10 20 so
Kmax (MPo sqrt m) Kmax (MPo sqrt m)
(a) (b)
0
Rene'95649C
7 R=0.8 Figure A.4:
0
/ / / Statistical analysis results of
Rene'95 constant AK hold time crack
o o growth data from specimens cycled at
E - 649% with R-r.tioe of (a) 0.0, (b)
Z 0.5, and (c) 0.8.
0
U,)
0
10 20 soKmax (MPo sqrt m)
(c)-301-

Rene'95 Rene'95649C 649CR=O.O R=0.5
o 0
d. , -
30. 30E-
- .3/ N 0
oi- evd
N 0- cyde
0 0
0'
10 20 50 10 20 50Kmax (MPa sqrt m) Kmax (MPo sqrt m)
(a) (b)
C
Rene'95649CR0.8
Figure A.5:0
Statistical analysis results of
N Rene',5 constant AK frequency crackC 300 - growth data from specimens cycled at
E/E SO%649 with R-ratios of (a) 0.0, (b)
0.5, and (c) 0.8.'03
-
0 303
in
0d
OL
10 20 50Kmax (MPa sqrt m)
(c) -302-

APPENDIX B: STATISTICAL ANALYSIS OF RENE'95 OVERPEAK HOLD TIME DATA
The figures in this appendix show the resusts of the statistical
analysis of the Rene'95 overpeak hold time tests. The small rectangles in the
figures enclose a region of plus and minus one standard deviation in crack
growth rate (da/dN) and Kmax. The techniques used to establish these values
were described in Section 4.4.2. The dashed lines in these figures connect
the mean values of da/dN and Kmax for cycles with constant hold times and
R-ratio.
-303-

Rene'95 Ren'95593C 593CR-O.0 R-O.O
,Mi Ym4 hSMM h bm
ft E
S0
10 20 30 Khol (MaW nKhoid (MPo Wsq't m)
(a) (b)
0 0
R-ne95Rene'95R ne'95 i59C
593C R-0-0R-O.O
Khold (MPO Sqit m) KOd(P qim
(Cc) (d)
Fiur3.1: statistical analysis results of crack growth data from Rene'95
specimen AF73 cycled at 593*C wIth a 10% overpeak and R-ratio of
0.0 having hold times of (a) 0, (b) 4, (c) 30, and (d) 300
seconds.
.304-

7i-_ I~ 9Reme*95 593C593C R-0-0iR-0-0.
I r ak
raftI.2
E
20 so
10 20 50 Khdd (MPo sqrt m)Khold (MPa SO m)
(a) (b)
Rene'95 Pe'ne'95593C f 593CR-o.o R-00
I V
NO0 I INI4
E a E
,. I
ol ,o,,I z0? "
I -'
,I I]
10 20- CM0 2D 5Kho SOr) Khold (MPa sqrt m)
(c) (d)
Figure B.2: Statistical analysis results of crack growth data from Rene'95
specimen AF28 cycled at 593"C with a 20% overpeak and R-ratio of
0.1 having hold times of (a) 0, (b) 4, (c) 30. and (d) 300
seconds.
-305-
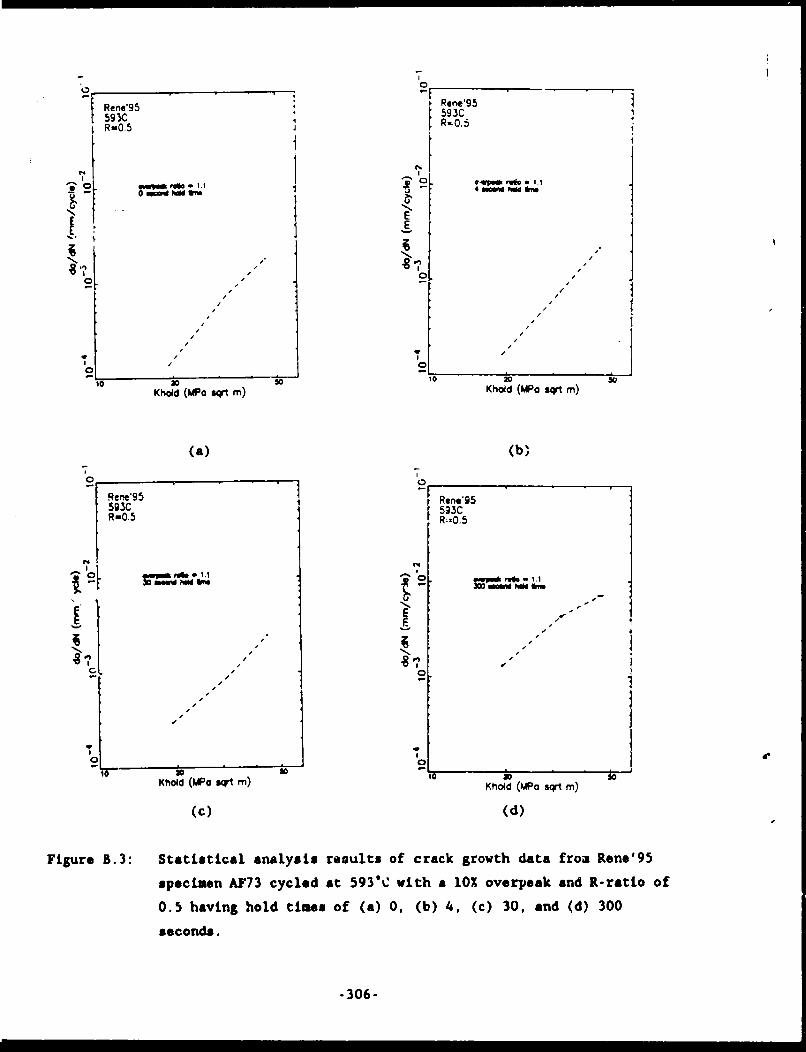
- 07
Rene'95 Rene'9559X 3C593CSRO.5 R-O.
0 fewps~ubl
- 7. h~ f OM ed.
N 4
j E
I N
0 00
,, I8 /
I 0
Kod(MPO atM) Kod(MPo sqtm)
(a) (b)
7 7
593C 5 3
Rw-5 R.-0.5
C4 .4
E
10 3Dos
Khold (MPo t m) Khod (MPa sqrt m)
(c) (d)
Figure B.3: Statistical analysis results of crack growth data from Rene'95
specimen AF73 cycled at 5935C with a 10% overpeak and R-ratio of
0.5 having hold times of (a) 0, (b) 4, (e) 30, and (d) 300
seconds.
-306-
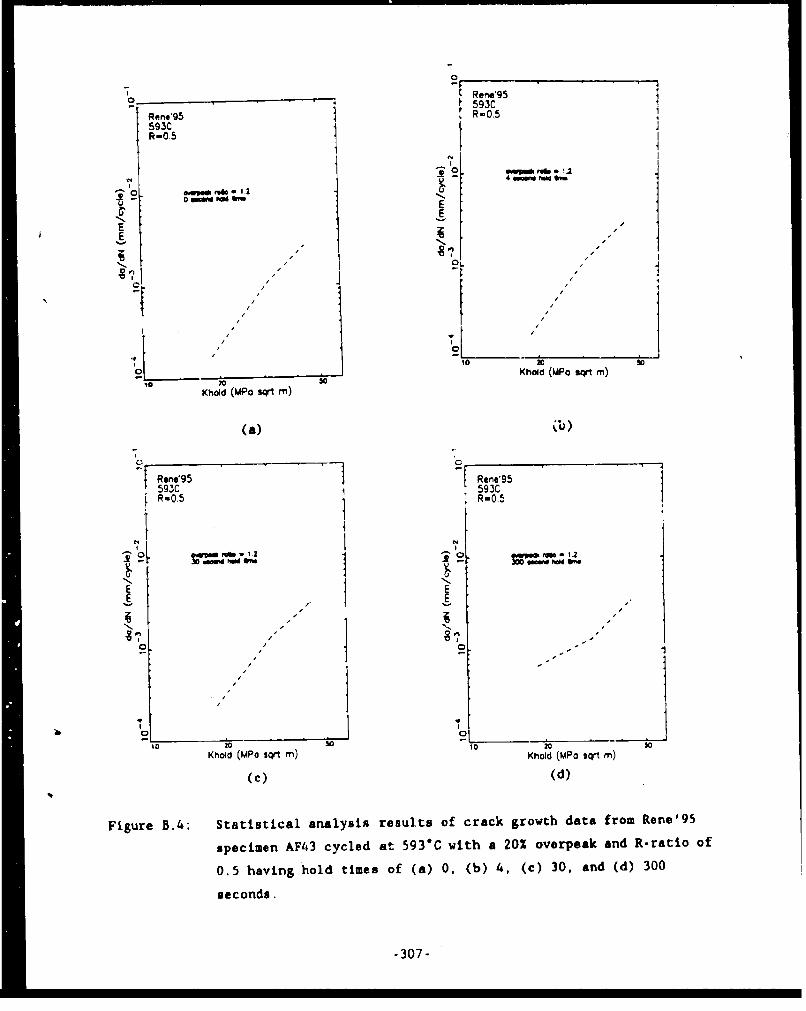
~Reme'95-- 593CRene' 5 R-0.5
593CR-0.5
N4 _- 4 GwWW hM
E
E 7E 'N
8"? " ,
V -i
it , i
/ /
0 Khl (Wo W r)
Khod (MPo W M)
(a) Ob)
t Rono'95 Rene'95593C 593CR-0.5 R-0.5
0N N
E E
/- •
0 0j
20 ; 10 20 5
Khod (MPo q't m) Khold (MPo sqrt m)
(c) (d)
Figure B.4: Statistical analysis results of crack growth data from Rene'95
specimen AF43 cycled at 593*C with a 20% overpeak and R-ratio of
0.5 having hold times of (a) 0, (b) 4, (c) 30, and (d) 300
seconds.
-307-

Rene'95649C Rem'95R-0.0 649CR-0.0
ICN N
o / ,
E
n
- 0 /
4
s4
0 0Wo so103
Khold (Mo m)Po sqrt m)
(a) (b)
64n9 54g
64C Ren'95R-O.O 649CR-0
1 0.
' 7T
0 so_'__ ____o
Kho~d (MPo uqrt m) Khold (MPo sqrt m)
(c) (d)
Figure B.5: Statistical analysis results of crack growth data from Rene'95
specimen AF68 cycled at 6499C with a 10% overpeak and R-ratio of
0.0 having hold times of (a) 0, (b) 4, (c) 30, and (d) 300
seconds.
"308"
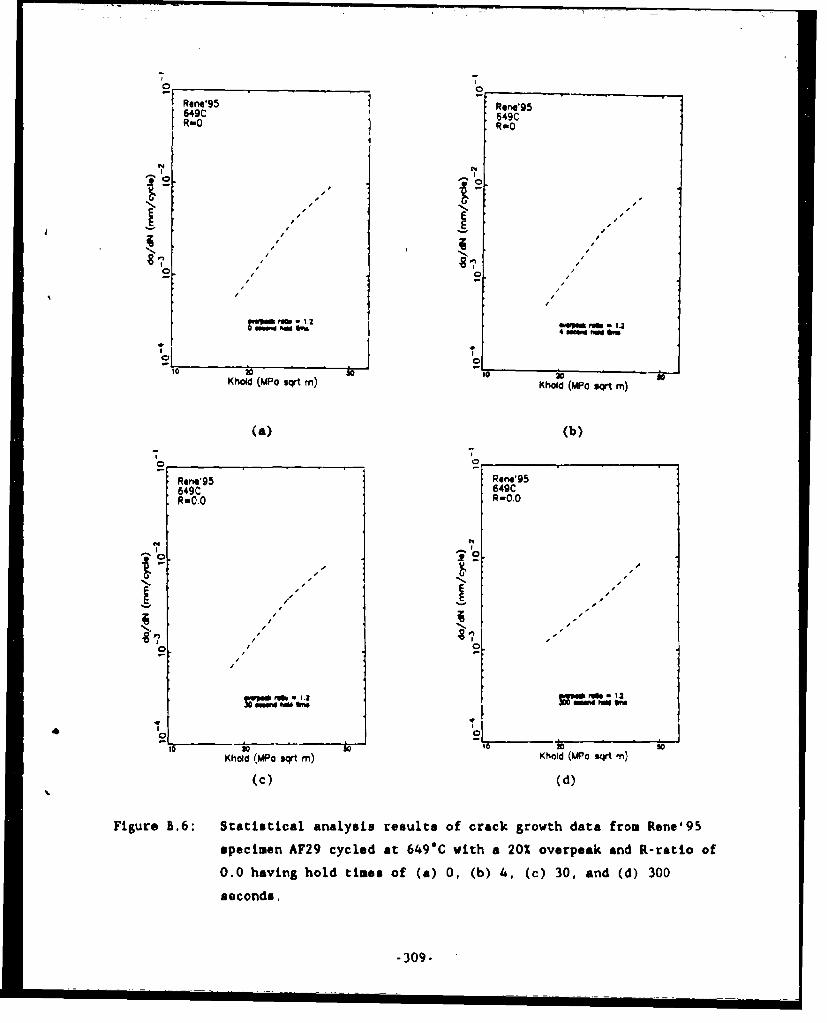
"7,,
Rens'95 Rone'95649C 649CR-0 R4O
/ C /s
N -
4 C4
/ /
fewh 1.2PAN 6lmO NMM~ relft .I3
__ o
4 SNOWi t"" GPM
10 03 03Khold (MPo sqt m) Khold (Po s m)
(a) (b)
Rone'95 Rne'95649C 649CR-0.0 R-OO
,/ -j~/ ,- -, -,"
N/ N
10 1O
Khold (MPo st m) Khold (WO mn)
(c) (d)
Figure B.6: Statistical analysis results of crack growth data from Rene'95
specimen AF29 cycled at 649*C with a 20% overpeak and R-ratio of
0.0 having hold times of (a) 0, (b) 4, (c) 30, and (d) 300
seconds.
-309-

00SRene'95 Rene'95
649C 649C
R-O 0 R,0.0
pE8? /
0 20
Khd (MWo uqrt m) Kl'hd (MPo eqt m)
a) (b)
0 -o
Rm'95
R-0.0 R-0-0
=..N o
o t0 "o - +
10 IQ
Khold (MPo sor m) Khod (MPa wr m)
(c) (d)
Figure B.7: Statistical analysis results of crack growth data from Rene'95
specimn AF34 cycled at 649"C wLh a 50Z overpeak and R-ratio of
0.0 having hold times of (a) 0, (b) 4, (c) 30, and (d) 300
seconds.
-310-
, =I= I = i : =... . . .. .. I . . . = .. .. i . . . . . . T .. ..
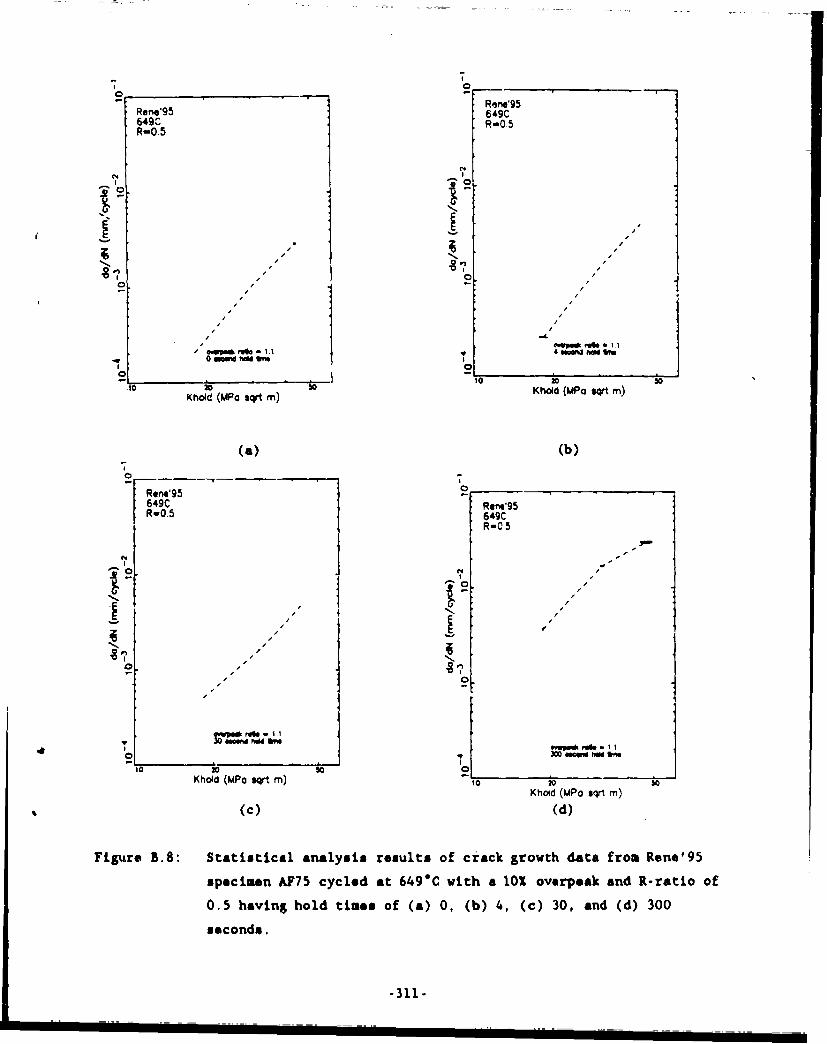
O7
0 _Rne'95
Rene'95 649C649,- R-0-5R-0.5
7pE
-, "
01
To 3D so hoJ QW
Kho~d (PA sortm) Khold (MPP sqt m)
(a) (b)7
Rene'g5 0649C Rene'95R-0.5 649C
R-05
- N7¢I
100
Khold (MPo sqr m) 10 2o 'oKhold (MPo sqrt m)
(c) (d)
Fig re B.8: Statistical analysis results of crack growth data from Rene'95
specimen AF75 cycled at 649C with a 10% overpeak and R-ratio of
0.5 having hold times of (a) 0, (b) 4, (c) 30, and (d) 300
seconds.
-311-

o _______ 0 ._______
Rem'95 Rne'95649C 649CR-0.5 R-0.5
8 ? , "8 ? ,o 0
iI
/
sei.s1.2 es.~o* rf - 1.2Od W v1 4 muWd it O
o o
Koi (Mho u m) KhoW (UPo wt m)
(a) (b)
o0
Rrw'95 Reno95640C 642CR-0.5 R-0.5
C214
N. N
o s
o 0
Khold (M~o Wq m) Khod (MPa uwt )
(c) (d)
Figure B.9: Statistical analysis results of crack growth data from Rene'95
specimen AF35 cycled at 649"C vith a 20% overpeak and R-ratio of
0.5 having hold times of (a) 0, (b) 4, (c) 30, and (d) 300
seconds.
-312-

APPENDIX C: STATISTICAL ANALYSIS OF ALLOY 718 CONSTANT AK DATA
The figures in this appendix show the resusts of the statistical
analysis of the Alloy 718 constant AK tests. The small rectangles in the
figures enclose a region of plus and minus one standard deviation in crack
growth rate (da/dN) and Kmax- The techniques used to establish these values
were described in Section 4.4.2. The dashed lines in these figures connect
the mean values of da/dN and Kmax for nycles with constant hold times and
R-ratio.
-313-

00
718 AloAM 718Afto 718 59YC59YC R=0.5
R=O.CI '0
had E
E E-
~ZZ
0.30 t
V 4
0I30 4
101 ' 0 0
10 20 so Kmox (MPo sqrt m)Krnoax (MPa sqrt m)
(a) (b)
0 - IAlloy 718R=0.8
RO3 Figure C. 1:
Statistical analysis results of
C4,hd) Alloy 718 constant AK hold time
-I. ,- crack growth data from specimens
S--- cycled at 5Q3C with R-ratios of (a)
Zv" O.O, (b) 0.5, and (c) 0.8.*'-0
4
10 20 5
Kmox (MPo sqrt m)
(c)-314.

oo 71-" Alloy 718Aloy 718 649C649C R=0.5R=0.0 hold 7
...300 ,.I
E0 3
"-- E
E/ E.Z 4" 4 "01
z7
0
,o- 1 oo -
-10 20 0 10 20
Kmox (MPo sqrt m) Kmox (MPa sqrt m)
(a) (b)0
loy 718 had64gC
7o[ .0 I - Figure C. 2:
00 Statistical analysis results ofu Alloy 718 constant AK hold time
E . crack growth data from specimensE - - cycled at t49"C with R-ratios u! ',a)
Z, 0 0.0, (b) 0.5, and (c) 0.8.
4
0
10 20
Kmox (MPa sqrt rn)
(c)-315-

APPENDIX D: STATISTICAL ANALYSIS OF ALLOY 718 OVERPEAK HOLD TIME DATA
The figures in this appendix show the resusts of the statistical
analysis of the Alloy 718 overpeak hold time tests. The small rectangles in
the figures enclose a region of plus and minus one standard deviation in crack
growth rate (da/dN) and Kmax . The techniques used to establish these values
were described in Section 4.4.2. The dashed lines in these figures connect
the mean values of da/dN and Kmax for cycles with cnnstant hold times and
R-ratio.
-317-

C
Jo 718Alloy 718 64dC5649 C R-O.0R=0.O-0
II
'02 =WI 31 1==
101
E" -, -. ,-- -=, - - -
o -on
0 -
I010 20 50
Kh20MQ qtm Khold (MFo sqrt m)
(a) (b)
Alloy 718649C1R0-0 Figure D.l:
Statistical analysis results of
.2 - - crack growth data from Alloy 718
E - specimen A13-02 cycled at 649*C with
E?
a 10% ovoo peak and R.rio of 0.0
having hold times of (a) 4, (b) 30,
and (c) 300 seconds.10%
' 10 20 50
Khold (MF~ ISqrt m)
(c)
-318-
=====
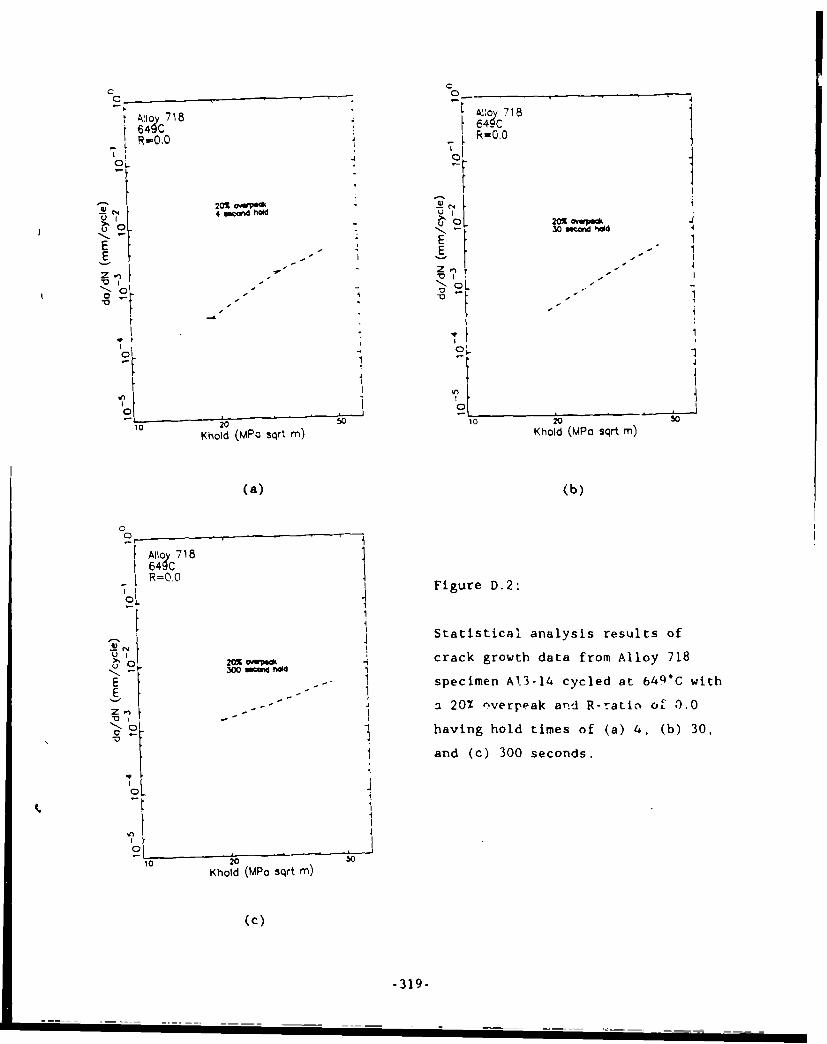
C
L k,:0 - 718
64O, C R=O.O
R00.E E
- E
z Z-c -"
10 20 s0o1 20 5
Khold (MPo sqrt m) Khold (MPO Sqrt m)
(a) (b)
64C
R=OC) Figure D.2:
I" I
I Statistical analysis results of
1* crack growth data from Alloy 718Eo seie A13t14 cycled at 64 with
E- ~~ 20% 'nverpeak an'] R-raticn of 0.0
having hold times of (a) 4, (b) 30,
0
and (c) 300 seconds.
o I
10 20 50
Khold (MPo sqrt m)
(c)
-319-

C C
-~i Alloy 718AP~o 718 A1 1
R=0.5 R-0.5
E L I OX""M k -
E
'-I iJZ4
'0 'oL3oL - -.'-
-i0. L
II Io
o oL
10 20 50 10"0 3
Khold (MPo sqrt m) Khol (MPo sqrt m)
(a) (b)
0
t AoI 718 I
R-0.5 Figure D. 3:
I Statistical analysis results of
- - , - -crack growth data from Alloy 718
E - specimen A13-32 cycled at 649*C
IFJ(1200*F) with a 10% ovecpe.k and
C) l R-ratio of 0.5 having hold times of
(a) 4, (b) 30, and (c) 300 seconds.
J
10 50
Khold (MPo sqrt m)
(c)
-320-

0 C- o
Alioy 718 Alo 718649C M4CR=0.5 R=0.5
o o~ 0
u 0 ~~2OXou. OWPO22'wiiN. 4scwnd hald N. 3 .Oamcad hil
E -E E
Z Z
00
- r
I I
0
O1o 20 50 ,o 20 so '
Khold (MPo sqrt m) Khold (MPo sqrt m)
(a) (b)
0
Alo 718649CR=0.5R. Figure D.4:
1 Statistical analysis results of
crack growth data from Alloy 718
E specimen A13-05 cycled at 649°C
I (1200"F) with P 20% overpeak and
No / R-ratio of 0.5 having hold times of
S1 (a) 4, (b) 30, and (c) 300 seconds.
C,,*1
10 20 50Khold (MPa sqrt m)
(c)
-321-
Top Related