


Languages
Pages
Legal


1 | P a g e
AFRICA REGIONAL INTEGRATION INDEX
(ARII): METHODOLOGICAL
NOTE
2019
2 | P a g e
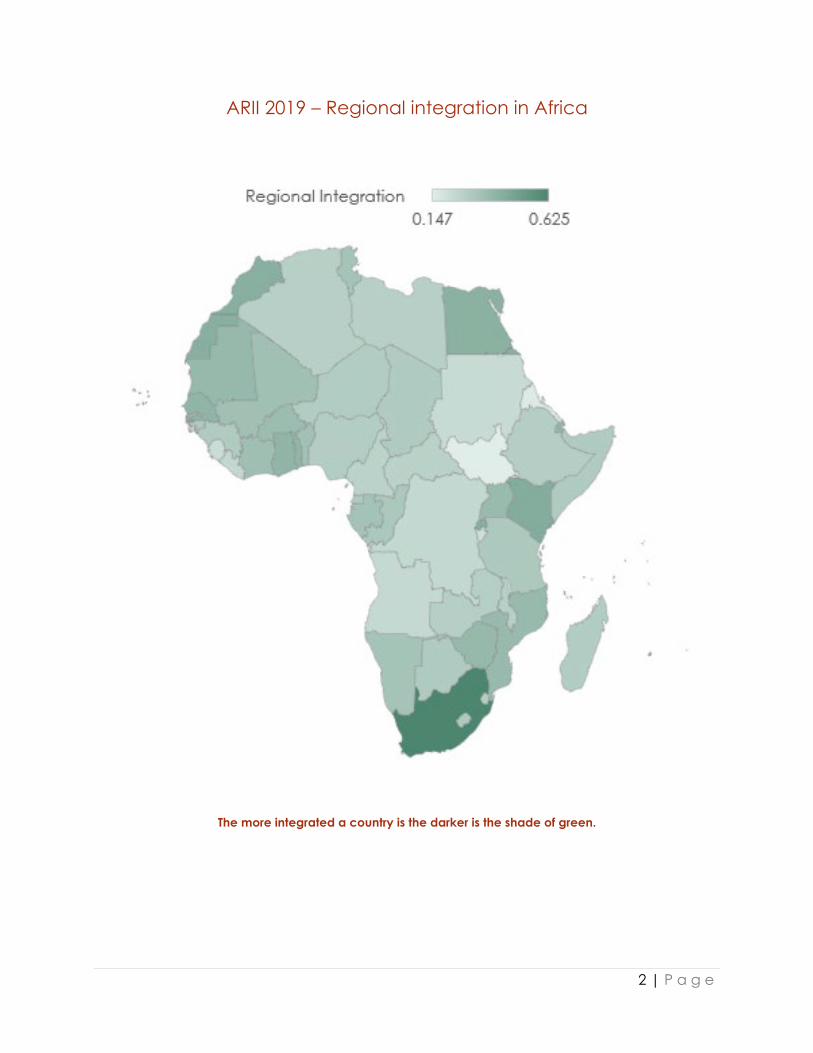
ARII 2019 – Regional integration in Africa
The more integrated a country is the darker is the shade of green.

3 | P a g e
Contents ARII 2019 – Regional integration in Africa ........................................................................................ 2
1. INTRODUCTION ................................................................................................................................. 6
2. DATA SOURCES, COVERAGE AND TREATMENT OF MISSING DATA ................................................ 7
6. NORMALISATION OF DATA AND ELIGIBILITY TESTS ........................................................................ 16
MIN-MAX NORMALISATION ............................................................................................................................ 16 ELIGIBILITY TESTS ............................................................................................................................................. 16
4. WEIGHTING AND PRINCIPAL COMPONENTS ANALYSIS ................................................................ 17
WHAT IS PCA? ............................................................................................................................................. 18 NUMBER OF COMPONENTS AND COMPUTATION OF WEIGHTS ............................................................................. 18 AGGREGATION SCHEME ................................................................................................................................ 19 PITFALLS OF PCA .......................................................................................................................................... 20
5. SENSITIVITY ANALYSIS PRE- AND POST-COMPUTATIONS .............................................................. 21
RESULTS OF SENSITIVITY ANALYSIS ...................................................................................................................... 21 Macroeconomic dimension ............................................................................................................ 22 Infrastructural dimension .................................................................................................................. 29 Discussion of the results of the sensitivity analysis .......................................................................... 34
6. OVERVIEW OF FINAL EMPIRICAL RESULTS ...................................................................................... 34
THE RELEVANCE OF INDICATORS IN THEIR DIMENSIONS ....................................................................................... 34 THE SIGNIFICANCE OF THE WEIGHTS ASSIGNED THROUGH PCA........................................................................... 35 EMPIRICAL RESULTS: DESCRIPTIVE STATISTICS ...................................................................................................... 37 EMPIRICAL RESULTS: CORRELATION STRUCTURES ................................................................................................ 47 EMPIRICAL RESULTS: ELIGIBILITY TESTS ................................................................................................................ 52 EMPIRICAL RESULTS: PCA AND WEIGHTINGS ..................................................................................................... 57 WEIGHTS ASSIGNED THROUGH PCA ................................................................................................................ 66 RANKINGS USING PCA WEIGHTS VS EQUAL WEIGHTS - AFRICAN LEVEL ............................................................... 68
REFERENCES ............................................................................................................................................. 71
ANNEX: EVOLUTION IN THE CHOICE OF VARIABLES AND DIMENSIONS .................................................................. 73

4 | P a g e
List of tables Table 1 Statistical tests before and after the removal of the investment variable at the macroeconomic dimension and overall dimensions ............................................................. 22 Table 2 Statistical tests before and after the winsorisation of the inflation variable at the macroeconomic dimension and overall dimensions ............................................................. 23 Table 3 Statistical tests with and without the investment variable at the macroeconomic dimension and overall dimensions (winsorised data) ............................................................. 26 Table 4 Statistical tests with and without the currency variable at the macroeconomic dimension and overall dimensions (winsorised data) ............................................................. 28 Table 5 Statistical tests with and without the inflation variable at the macroeconomic dimension and overall dimensions (winsorised data) ............................................................. 28 Table 6 Statistical tests with and without the SAATM variable at the infrastructural dimension and overall dimensions ............................................................................................. 29 Table 7 Statistical tests with and without the SAATM variable and Electricity variable at the infrastructural dimension and overall dimensions ............................................................. 30 Table 8 Statistical tests showing various combinations of variables ..................................... 33 Table 9 Descriptive statistics - Africa .......................................................................................... 38 Table 10 Descriptive statistics - SADC ........................................................................................ 39 Table 11 Descriptive statistics - ECOWAS .................................................................................. 40 Table 12 Descriptive statistics – CEN-SAD .................................................................................. 41 Table 13 Descriptive statistics - COMESA ................................................................................... 42 Table 14 Descriptive statistics - ECCAS ...................................................................................... 43 Table 15 Descriptive statistics - IGAD ......................................................................................... 44 Table 16 Descriptive statistics - EAC ........................................................................................... 45 Table 17 Descriptive statistics - AMU .......................................................................................... 46 Table 18 Pearson Correlation Coefficients-Africa ................................................................... 47 Table 19 Pearson Correlation Coefficients - SADC .................................................................. 47 Table 20 Pearson Correlation Coefficients - ECOWAS ............................................................ 48 Table 21 Pearson Correlation Coefficients – CEN-SAD ........................................................... 48 Table 22 Pearson Correlation Coefficients - COMESA ............................................................ 49 Table 23 Pearson Correlation Coefficients - ECCAS ............................................................... 49 Table 24 Pearson Correlation Coefficients - IGAD................................................................... 50 Table 25 Pearson Correlation Coefficients - EAC .................................................................... 50 Table 26 Pearson Correlation Coefficients - AMU.................................................................... 51 Table 27 Statistical test results - Africa ........................................................................................ 52 Table 28 Statistical test results - SADC ........................................................................................ 52 Table 29 Statistical test results - ECOWAS .................................................................................. 53 Table 30 Statistical test results – CEN-SAD ................................................................................. 53 Table 31 Statistical test results - COMESA .................................................................................. 54 Table 32 Statistical test results - ECCAS ...................................................................................... 54 Table 33 Statistical test results - IGAD ......................................................................................... 55

5 | P a g e
Table 34 Statistical test results - EAC ........................................................................................... 55 Table 35 Statistical test results - AMU .......................................................................................... 56 Table 36 Results of PCA and weights derived for indicators and dimensions - Africa ...... 57 Table 37 Results of PCA and weights derived for indicators and dimensions - SADC ...... 58 Table 38 Results of PCA and weights derived for indicators and dimensions - ECOWAS 59 Table 39 Results of PCA and weights derived for indicators and dimensions – CEN-SAD 60 Table 40 Results of PCA and weights derived for indicators and dimensions - COMESA . 60 Table 41 Results of PCA and weights derived for indicators and dimensions - ECCAS .... 62 Table 42 Results of PCA and weights derived for indicators and dimensions - IGAD ....... 63 Table 43 Results of PCA and weights derived for indicators and dimensions - EAC ......... 64 Table 44 Results of PCA and weights derived for indicators and dimensions - AMU ........ 65 Table 45 Weights of indicators and dimensions for Africa and RECs ................................... 66
List of figures Figure 1 Comparing integration rankings with (old) and without (revised) the investment variable for the overall regional and macroeconomic rankings ......................................... 24 Figure 2 Comparing integration rankings before (old) and after (revised) the inflation variable is winsorised for the overall regional and macroeconomic rankings ................... 25 Figure 3 Comparing integration rankings with (old) and without (revised) the investment variable (winsorised inflation data) for the overall regional and macroeconomic rankings ........................................................................................................................................... 27 Figure 4 Comparing integration rankings with (old) and without (revised) the SAATM variable for the overall regional and infrastructural rankings ................................................ 31 Figure 5 Comparing integration rankings with (old) and without (revised) both the SAATM and Electricity variables for the overall regional and infrastructural rankings ...... 32 Figure 6 Comparing rankings using PCA and equal weights ................................................ 68 Figure 7 Comparing rankings using PCA and equal weights (ARII 18 variables) ............... 69 Figure 8 Statistical test comparing rankings using PCA and equal weights ....................... 70

6 | P a g e
1. Introduction
Regional integration is a complex concept. It is generally conceived as englobing several aspects of economic integration from production to social cross-border linkages that contribute to enhancing economic growth. Moreover, the actual workings of regional integration are far from being homogenous, its mechanism differs from region to region. The advantages it brings along, however, in terms of increased economic activities and growth, are regionwide. The Africa Regional Integration Index (ARII) 2019 is constructed as a composite index: it is made up of several indicators that reflect the state and efforts towards achieving greater regional integration in Africa. It draws from the economic literature on the subject and the experiences of the different collaborating partners and international institutions to define its conceptual framework. After robust sensitivity analyses and reviews by experts, the final index is composed of 16 indicators grouped into 5 dimensions1, namely, trade, productive, macroeconomic, infrastructural and free movement of people dimensions. Although all the indicators used in ARII are relevant, their influence on regional integration may vary. As such, the use of an equal weighting system where all indicators have the same weight is deemed problematic as it can overweigh and/or underweigh some indicators thereby producing biased scores. However, it is a daunting task to assign weights in an objective manner as there exists no consensus in the literature as to which method is the best (Nardo et al., 2005). There are many ways to give weights to indicators including weights obtained through expert judgements also known as budget allocation systems. The latter method is costly and often criticised for unduly adding subjective bias to indexes. Therefore, it is highly recommended to resort to a statistical methodology2 that allows the robust computation of weights while maintaining objectivity. One such technique is principal components analysis (PCA). This methodology has been tested previously in the construction of well-known regional integration indexes and other indexes (Huh & Park, 2017; König, 2015). Its use is motivated by its capacity to derive weights based on the structure of the data and its ability to preserve the variations in the data. Thus, it does not rely on subjective judgements to assign weights. ARII 2019 makes use of PCA to determine the weights of both single indicators and the dimensions. In other words, a two-stage weighting procedure is adopted, i.e., where the single indicators inside each dimension are first assigned weights and then weights are given to the dimensions. 1 Readers can refer to the ARII 2019 report for more details. The following section of this Note describes the indicators used in each dimension. 2 Statistical methodology although objective they may sometimes provide results that go against intuition, this is largely because the quality of data is never perfect. The best weighting methodology would be a combination of expert judgements with statistical methodology.

7 | P a g e
This methodological note is organized as follows. The following section details the data sources for the variables used in ARII 2019. It also documents the treatment of missing data and any other calculations that were performed. Section 3 describes the normalization procedure and the eligibility tests that are recommended when PCA is used. The weighting procedure, that is, principal components analysis, is documented in section 4; the choice of the number of components together with the aggregation procedure is also described. Section 5 describes the sensitivity analyses that were made to control the validity of the index structure, that is the variables in the dimensions and the credibility of the ranking. Section 6 discusses the empirical results in light of the relevance of the indicators and dimensions. The significance of the weights assigned through PCA is controlled for by computing the index using an alternative methodology that uses equal weights. The following sections report the empirical results for Africa and the 8 RECs: the descriptive statistics, the overall correlation structures, the eligibility tests for the conduct of PCA, the computation of weights, a summary of the weights, a comparison of the weights assigned through PCA and equal weights.
2. Data sources, coverage and treatment of missing data
Overview of dimensions and indicators used in ARII 2019
1. Trade Integration
a. Average tariff on imports b. Share of intra-regional exports over GDP c. Share of intra-regional imports over GDP d. Share of intra-regional trade e. AfCFTA (Only at continental level)
2. Productive Integration
a. Share of intra-regional intermediate exports b. Share of intra-regional intermediate imports c. Merchandise trade complementarity index
3. Macroeconomic Integration
a. Number of bilateral investment treaties b. Regional convertibility of currency c. Regional inflation differential
4. Infrastructural Integration
a. AfDB Composite Infrastructure index b. Proportion of intra-regional flight connections
5. Free Movement of People
a. Free Movement of Persons Protocol (Kigali) b. Number of countries that may obtain a visa on
arrival c. Number of countries that require a visa

8 | P a g e
Detailed description of indicators and variables
Dimension Trade Indicator Level of tariff on imports (intra-regional import) Data sources Market Access Map, International Trade Centre
(International Trade Centre, 2018) Variables used Ad valorem equivalents of applied tariffs at
minimum rates Year coverage Latest data available. For most countries data
date back to 2017, 2016 and 2015 except for Eritrea, Libya and Sierra Leone where data date back to 2006
Country coverage All except Somalia and South Sudan Calculation Bilateral tariff rate (import-weighted) that each
country i applied to country j and averaged over all countries in the region
Details Applied tariffs refer to actual tariffs imposed by the importing country and this is an appropriate measure of actual trade integration. Moreover, these rates also include the preferences that a country may grant to certain trading partners
Treatment of missing data
• Data for Somalia is sourced from the Somalian Chamber of Commerce, Industry and Agriculture
• Data for South Sudan is obtained from the PWC tax summary https://www.pwc.co.za/en/assets/pdf/tax-summaries/south_sudan_2014.pdf
Dimension Trade Indicator Share of intra-regional goods export (%GDP) Data sources UNCTAD, (UN COMTRADE, 2018) Variables used Merchandise exports and GDP Year coverage Latest available and consistent data (2014, 2015,
2016) Country coverage All except South Sudan Calculation The ratio of merchandise exports of country i over
GDP. Exports and GDP are the averages of 2014-2016 data.
Details The average of the 3 years is used so as to minimize data discrepancies that often exist for trade data in the African context
Treatment of missing data
Data for South Sudan is retrieved from the UN Comtrade database. However, since there is no data on the exports of South Sudan, South Sudan’s exports are imputed by adding up each of its partner’s imports. To be consistent, the average of

9 | P a g e
2014-2016 is used. Moreover, the same classification as UNCTAD, i.e., SITC Rev. 3 is used.
Dimension Trade Indicator Share of intra-regional goods import (%GDP) Data sources UNCTAD Variables used Merchandise imports and GDP Year coverage Latest available and consistent data (2014, 2015,
2016) Country coverage All except South Sudan Calculation The ratio of merchandise imports of country i over
GDP. Imports and GDP are the averages of 2014-2016 data.
Details The average of the 3 years is used so as to minimize data discrepancies that often exist for trade data in the African context
Treatment of missing data
Data for South Sudan is retrieved from the UN Comtrade database. However, since there is no data on the imports of South Sudan, South Sudan imports are imputed by adding up each of its partner’s exports. To be consistent, the average of 2014-2016 is used. Moreover, the same classification as UNCTAD, i.e., SITC Rev. 3 is used.
Dimension Trade Indicator Share of intra-regional goods trade (%total
regional trade) Data sources UNCTAD Variables used Merchandise exports and merchandise imports Year coverage Latest available and consistent data (2014, 2015,
2016) Country coverage All except South Sudan Calculation The sum of country i merchandise exports and
imports to all other countries in the region over the total regional merchandise exports and imports. Exports and imports are the averages of 2014-2016.
Details The average of the 3 years is used so as to minimize data discrepancies that often exist for trade data in the African context
Treatment of missing data
Same as previous
Dimension Trade Indicator AfCFTA Data sources African Union (African Union, 2019) Variables used Signature and ratification of the AfCFTA

10 | P a g e
Year coverage Latest available update up to July 2019 (Niamey Summit)
Country coverage All Calculation Countries are assigned a score of 0 if they did not
sign, a score of 1 if they signed and a score of 2 if they ratified the agreement
Details Treatment of missing data
Not applicable
Dimension Productive Indicator Share of intra-regional exports of intermediate
goods Data sources UN Comtrade Variables used Intermediate goods exports Year coverage Latest available and consistent data (2014, 2015,
2016) Country coverage 41 + 13 imputations (Chad, Comoros, Dem. Rep. of
the Congo, Djibouti, Equatorial Guinea, Eritrea Ethiopia, Gabon, Guinea-Bissau, Liberia and Somalia)
Calculation The sum of country i intermediate exports to all other countries in the region over the total regional exports. Exports are the average of 2014-2016 data.
Details Intermediate goods are defined as the sum of the following categories in BEC: 111* Food and beverages, primary, mainly for industry 121* Food and beverages, processed, mainly for industry 21* Industrial supplies not elsewhere specified, primary 22* Industrial supplies not elsewhere specified, processed 31* Fuels and lubricants, primary 322* Fuels and lubricants, processed (other than motor spirit) 42* Parts and accessories of capital goods (except transport equipment) 53* Parts and accessories of transport equipment
Treatment of missing data
Missing data for country i, is imputed by summing up intermediate imports for each country importing from country i for which data are available. The resulting value provide an

11 | P a g e
underestimate of the intermediate exports of country i (as data is not available for all countries)
Dimension Productive Indicator Share of intra-regional imports of intermediate
goods Data sources UN Comtrade Variables used Intermediate goods imports Year coverage Latest available and consistent data (2014, 2015,
2016) Country coverage 41 + 13 imputations (Chad, Comoros, Dem. Rep. of
the Congo, Djibouti, Equatorial Guinea, Eritrea Ethiopia, Gabon, Guinea-Bissau, Liberia and Somalia)
Calculation The sum of country i intermediate imports to all other countries in the region over the total regional exports. Imports are the average of 2014-2016.
Details Intermediate goods are defined as above Treatment of missing data
Missing data for country i, is imputed by summing up intermediate exports for each country exporting to country i for which data are available. The resulting value provides an underestimate of the intermediate imports of country i.
Dimension Productive Indicator Merchandise trade complementarity index Africa /
RECs Data sources UNCTAD Variables used Merchandise exports and merchandise imports Year coverage Latest available and consistent data (2014, 2015,
2016) Country coverage All except South Sudan Calculation As per Michaely (1996), TCI of a country is the sum
of the absolute value of the difference between the import shares and the export shares (at 3-digit SITC, Revision 3 level) of the countries or country groups under study, divided by two:
Sejmk = the index of trade complementarity of exporter j with importer k i = goods in 3 digit SITC Revision 3 j = exporter k = importer Eij = the share of goods i in country j’s total exports to the region

12 | P a g e
Mik = the share of goods i in country k’s total imports from the region
Details Michaely (1996) formula is adapted to the African level and at each REC level to better capture regional integration. TCI measures to what extent the export profile of each African country matches the import profile of the region
Treatment of missing data
South Sudan value is estimated as 1 standard deviation below the average (South Sudan performance on similar variables tends to be below the average).
Dimension Infrastructure Indicator Infrastructure development index Data sources AfDB Infrastructure development index, (AfDB,
2016) Variables used Overall Infrastructure development index Year coverage 2016 Country coverage All Calculation As is Details Treatment of missing data
Not applicable
Dimension Infrastructure Indicator Proportion of intra-regional flight connections Data sources African Airlines Association (AFRAA, 2018) Variables used Flight connections from each country to the
remaining countries in the region Year coverage 2017 Country coverage All Calculation The total number of flight connections from
country i to each of the countries in the region over the total number of flight connections in the region
Details Treatment of missing data
Not applicable
Dimension Macroeconomic Indicator Number of bilateral investment treaties Data sources World Bank, 2017 Variables used Number of bilateral investment treaties in force Year coverage Up to 2017

13 | P a g e
Country coverage All Calculation The total number of bilateral investment treaties
net of those that have not been ratified and/or have been terminated within the region
Details Treatment of missing data
Not applicable
Dimension Macroeconomic Indicator Regional convertibility of national currencies Data sources National and regional central banks Variables used Number of convertible currencies Year coverage Latest data up to October 2018 Country coverage All except Eritrea Calculation The number of countries in a region with which a
country shares a common currency or with which its currency is convertible as reported by each country’s central bank
Details Treatment of missing data
Eritrea’s value takes the same value as that reported in ARII 2016
Dimension Macroeconomic Indicator Regional inflation differential Data sources World Economic Outlook, IMF (International
Monetary Fund, 2018) Variables used Inflation differential Year coverage October 2017 Country coverage All except Somalia Calculation Inflation differential is the difference between
country i inflation rate and that of the official target for the region. In the absence of the official target, the minimum positive value for the region is set as a target.
Details The inflation rate of South Sudan of 380 has been winsorised3 to 35 so as to reduce the variability of the data but care has been taken so that it remains the highest value.
Treatment of missing data
Somalia’s value is imputed from an external source value, https://tradingeconomics.com/somalia/inflation-cpi
Dimension Free movement of people
3 Winsorisation, named after the biostatistician Charles P. Winsor, is the transformation of statistiscal data so as to render extreme values less extreme so as to reduce the effect of spurious outliers

14 | P a g e
Indicator Ratification of the Protocol on the Free Movement of Persons
Data sources African Union Variables used Ratification of the Protocol on the Free Movement
of Persons, Right of Residence and Right of Establishment (Article 43(2) Treaty establishing the African economic community
Year coverage Up to July 2019 (Niamey Summit as stopping point) Country coverage All Calculation The variable takes a value of 1 if the country has
ratified the protocol and 0 otherwise Details Treatment of missing data
Not applicable
Dimension Free movement of people Indicator The number of countries which citizens may obtain
a visa on arrival Data sources African Development Bank, Visa Openness Index
2018 version Variables used The number of countries whose citizens may obtain
a visa on arrival Year coverage 2018 (latest data available) Country coverage All Calculation The variable sums the number of countries whose
citizens may obtain a visa on arrival to enter country i.
Details Rwanda has completely opened up its borders to EAC members but it the Visa Openness database record that the country does not grant visa on arrival. This information was corrected so as not to penalize the country.
Treatment of missing data
Not applicable
Dimension Free movement of people Indicator The number of countries that require a visa Data sources African Development Bank, Visa Openness Index
2018 version Variables used The number of countries whose citizens require a
visa Year coverage 2018 (latest data available) Country coverage All

15 | P a g e
Calculation The variable sums the number of countries whose citizens strictly require a visa to enter country i.
Details Treatment of missing data
Not applicable

16 | P a g e
6. Normalisation of data and eligibility tests
Min-Max normalisation ARII is made up of extremely varied indicators measured in different units from the rate of inflation differential to the ratification of the AfCFTA. This renders aggregation of the single indicators into a composite index difficult and comparison between themselves and between RECs not straightforward. Additionally, a common scale is a pre-requisite before applying principal components analysis. Therefore, all the indicators are normalised so that they range between 0 and 1 where 0 denotes the lowest integration level and 1 the highest level. A simple normalisation procedure known as the min-max rescaling procedure is used. This basic normalisation method is used to avoid influencing the data which is often the case when making use of more sophisticated techniques such as the z-scores (Nardo et al., 2005; Gu, Greensmith, Oates, & Aickelin, 2009). Each indicator q for each country is normalized as follows
𝑞𝑞 − 𝑞𝑞𝑚𝑚𝑚𝑚𝑚𝑚𝑞𝑞max−𝑞𝑞𝑚𝑚𝑚𝑚𝑚𝑚
where 𝑞𝑞𝑚𝑚𝑚𝑚𝑚𝑚and 𝑞𝑞𝑚𝑚𝑚𝑚𝑚𝑚 are the maximum and minimum values of each indicator q across all countries in the region. Note that for indicators where the lowest value reflects more integration, for example, a high tariff rate would mean less integration than a low tariff rate, the formula is adjusted as follows
1 − 𝑞𝑞 − 𝑞𝑞𝑚𝑚𝑚𝑚𝑚𝑚𝑞𝑞max−𝑞𝑞𝑚𝑚𝑚𝑚𝑚𝑚
The adjusted formula has been applied to the following indicators:
1. Level of tariff on imports 2. Regional inflation differential 3. Number of countries that require a visa
Eligibility tests The following tests are performed for each dimension in ARII to ensure that the data are suitable to undergo PCA. They are also performed on the aggregated dimensions.
i. Cronbach Coefficient Alpha

17 | P a g e
Cronbach’s alpha is the most common estimate of the internal consistency of indicators. It is performed to measure the extent to which indicators in each of the five dimensions of ARII are interrelated and, therefore, may measure a single unidimensional phenomenon. However, a high alpha may also be the result of separate clusters that intercorrelate highly even though the clusters themselves do not have a high correlation.
ii. Bartlett’s test of sphericity Since PCA is only useful when there is some degree of correlation between the variables, Bartlett’s test of sphericity is used to check whether the observed correlation matrix diverges significantly from the identity matrix.
iii. Kaiser-Meyer-Olkin (KMO) Sampling adequacy is ensured by checking the Kaiser-Meyer-Olkin (KMO) index where partial correlation is used to measure the relation between two variables excluding the effects of other variables. A high KMO (usually > 0.5) indicates that PCA is relevant.
4. Weighting and Principal Components Analysis
The different items of a composite index do not necessarily have the same economic significance; therefore, weights are necessary to account for these differences. However, heavy weights on sub-indicators can strongly influence the final scores of countries and they should, therefore, be assigned using a sound methodology (Nardo et al., 2005). Principal components analysis is used to compute non-subjective weights to assign to each indicator and dimensions before building the aggregate index. There are many ways to assign weights and they all have advantages and disadvantages. However, weights based on statistical models prevail as they require no a priori assumptions. The use of PCA as a weighting scheme is now established in the literature that covers the construction of social indices and, particularly, regional integration indices (Huh & Park, 2017; König, 2015). Often items of composite indicators tend to be correlated, i.e., they measure the same concept, and using an equal weighting scheme will lead to double-counting. Weights given through PCA correct for overlapping information of correlated indicators. The following briefly describes the PCA methodology (Giri, 1996; Jolliffe, 2002).
18 | P a g e
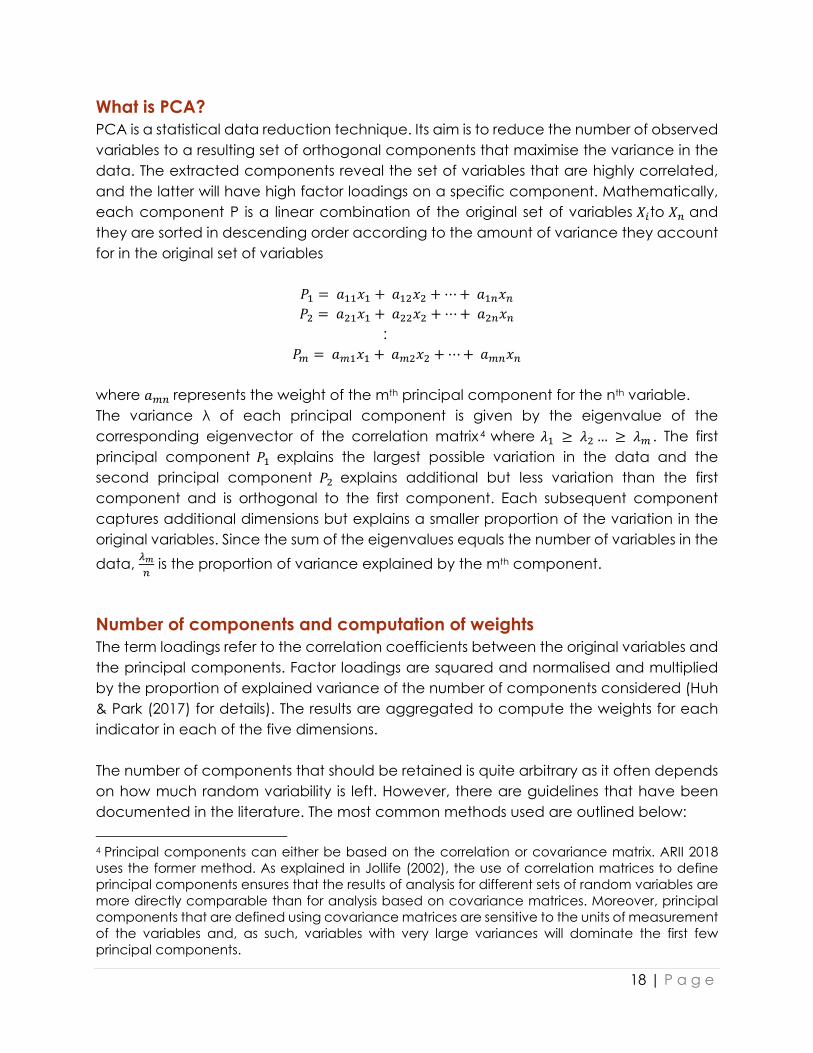
What is PCA? PCA is a statistical data reduction technique. Its aim is to reduce the number of observed variables to a resulting set of orthogonal components that maximise the variance in the data. The extracted components reveal the set of variables that are highly correlated, and the latter will have high factor loadings on a specific component. Mathematically, each component P is a linear combination of the original set of variables 𝑋𝑋𝑚𝑚to 𝑋𝑋𝑚𝑚 and they are sorted in descending order according to the amount of variance they account for in the original set of variables
𝑃𝑃1 = 𝑎𝑎11𝑥𝑥1 + 𝑎𝑎12𝑥𝑥2 + ⋯+ 𝑎𝑎1𝑚𝑚𝑥𝑥𝑚𝑚 𝑃𝑃2 = 𝑎𝑎21𝑥𝑥1 + 𝑎𝑎22𝑥𝑥2 + ⋯+ 𝑎𝑎2𝑚𝑚𝑥𝑥𝑚𝑚
: 𝑃𝑃𝑚𝑚 = 𝑎𝑎𝑚𝑚1𝑥𝑥1 + 𝑎𝑎𝑚𝑚2𝑥𝑥2 + ⋯+ 𝑎𝑎𝑚𝑚𝑚𝑚𝑥𝑥𝑚𝑚
where 𝑎𝑎𝑚𝑚𝑚𝑚 represents the weight of the mth principal component for the nth variable. The variance λ of each principal component is given by the eigenvalue of the corresponding eigenvector of the correlation matrix4 where 𝜆𝜆1 ≥ 𝜆𝜆2 … ≥ 𝜆𝜆𝑚𝑚 . The first principal component 𝑃𝑃1 explains the largest possible variation in the data and the second principal component 𝑃𝑃2 explains additional but less variation than the first component and is orthogonal to the first component. Each subsequent component captures additional dimensions but explains a smaller proportion of the variation in the original variables. Since the sum of the eigenvalues equals the number of variables in the data, 𝜆𝜆𝑚𝑚
𝑚𝑚 is the proportion of variance explained by the mth component.
Number of components and computation of weights The term loadings refer to the correlation coefficients between the original variables and the principal components. Factor loadings are squared and normalised and multiplied by the proportion of explained variance of the number of components considered (Huh & Park (2017) for details). The results are aggregated to compute the weights for each indicator in each of the five dimensions. The number of components that should be retained is quite arbitrary as it often depends on how much random variability is left. However, there are guidelines that have been documented in the literature. The most common methods used are outlined below: 4 Principal components can either be based on the correlation or covariance matrix. ARII 2018 uses the former method. As explained in Jollife (2002), the use of correlation matrices to define principal components ensures that the results of analysis for different sets of random variables are more directly comparable than for analysis based on covariance matrices. Moreover, principal components that are defined using covariance matrices are sensitive to the units of measurement of the variables and, as such, variables with very large variances will dominate the first few principal components.

19 | P a g e
Scree plot
The use of the scree plot is one of the simplest ways of determining the appropriate number of components that mostly accounts for the phenomenon under study. It graphs the eigenvalue against the number of components and it is recommended to keep only components that are above the sharp drop-off in the plot (Cattell, 1966).
Kaiser criterion One of the most popular methods is to drop components whose eigenvalues is less than 1 because the variance they explain is lower than in a single variable (Kaiser, 1960).
Variance explained Rather than relying on the methods above where the variance explained varies, it is common practice to set a threshold for the amount of variance explained and only keep the number of components that satisfies this criterion.
Jollife’s rule It is simply a less strict rule compared to the Kaiser criterion and recommends dropping components with eigenvalues below 0.70.
Broken-stick model It recommends retaining components that explain more variance than would be expected by randomly dividing the variance into p parts (Peres-Neto, Jackson, & Somers, 2005).
ARII relies on a combination of the first three rules listed above. While the scree plots provide the basis for the number of significant components, it is ensured that the number of components finally retained cumulatively account for more than 70 per cent of the total variance in the data and individually contribute to more than 10 per cent of the variance in the data.
Aggregation scheme Indicators in a composite index can be aggregated using a linear or a geometric aggregation method. Linear aggregation is an additive method that involves the summation of individual indicators. It ensures full compensability, that is poor performance in some indicators can be compensated by good performance on others. Geometric aggregation is a multiplicative method and it involves partial compensability where countries with higher scores are given more importance. Given that indicators in ARII have been normalized and are on the same scale and that indicators have already been weighted to reflect their importance, a linear aggregation method is used. The weighted scores for each indicator are summed to obtain grand scores for each dimension. PCA is then applied to the dimensions to obtain dimensional

20 | P a g e
weights. The weighted dimensions are then linearly aggregated to obtain the final regional integration index.
Pitfalls of PCA Although lauded with advantages that are convenient for the construction of indexes, such as the maintenance of objectivity and the preservation of the variations that exist in the data, PCA has to be used with caution.
1. As explained above, PCA relies on the correlation of the data. However, correlation may not be a good indicator of the real influence that some variables have on the phenomenon that is being studied.
2. Data revisions and updates completely change the results obtained through PCA as new correlations are explored.
3. PCA is still sensitive to small sample size. 4. Outliers have a major influence on PCA. 5. The importance of individual indicators that may be relevant for policy is masked
when using PCA.
21 | P a g e
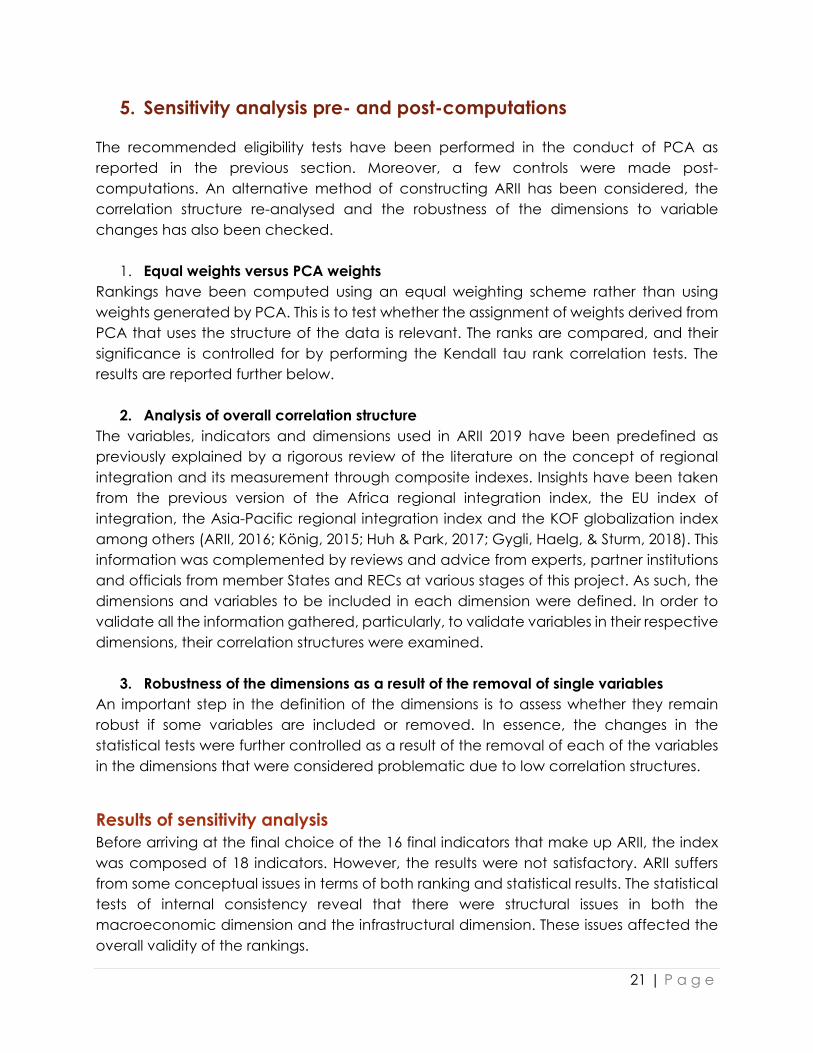
5. Sensitivity analysis pre- and post-computations
The recommended eligibility tests have been performed in the conduct of PCA as reported in the previous section. Moreover, a few controls were made post-computations. An alternative method of constructing ARII has been considered, the correlation structure re-analysed and the robustness of the dimensions to variable changes has also been checked.
1. Equal weights versus PCA weights Rankings have been computed using an equal weighting scheme rather than using weights generated by PCA. This is to test whether the assignment of weights derived from PCA that uses the structure of the data is relevant. The ranks are compared, and their significance is controlled for by performing the Kendall tau rank correlation tests. The results are reported further below.
2. Analysis of overall correlation structure The variables, indicators and dimensions used in ARII 2019 have been predefined as previously explained by a rigorous review of the literature on the concept of regional integration and its measurement through composite indexes. Insights have been taken from the previous version of the Africa regional integration index, the EU index of integration, the Asia-Pacific regional integration index and the KOF globalization index among others (ARII, 2016; König, 2015; Huh & Park, 2017; Gygli, Haelg, & Sturm, 2018). This information was complemented by reviews and advice from experts, partner institutions and officials from member States and RECs at various stages of this project. As such, the dimensions and variables to be included in each dimension were defined. In order to validate all the information gathered, particularly, to validate variables in their respective dimensions, their correlation structures were examined.
3. Robustness of the dimensions as a result of the removal of single variables An important step in the definition of the dimensions is to assess whether they remain robust if some variables are included or removed. In essence, the changes in the statistical tests were further controlled as a result of the removal of each of the variables in the dimensions that were considered problematic due to low correlation structures.
Results of sensitivity analysis Before arriving at the final choice of the 16 final indicators that make up ARII, the index was composed of 18 indicators. However, the results were not satisfactory. ARII suffers from some conceptual issues in terms of both ranking and statistical results. The statistical tests of internal consistency reveal that there were structural issues in both the macroeconomic dimension and the infrastructural dimension. These issues affected the overall validity of the rankings.

22 | P a g e
The sub-sections below describe the sensitivity analyses5 that have been conducted to identify the most optimal set of indicators so as to render ARII more robust while maintaining the validity of the concept of regional integration that echoes the current state of affairs.
Macroeconomic dimension
Step 1 Issue: The investment variable computed as the number of bilateral investment treaties in force has a low correlation in its dimension and it is also negatively correlated with the currency convertibility variable. As shown in Table 1, its scale reliability coefficient, 0.15, is low compared to the acceptable level of 0.5. Moreover, it fails to pass the Barlett test of sphericity.
Action: Removing the investment variable to check whether there are improvements in the consistency test and the ranking of the dimension.
Result: Table 1, second column, shows little improvement in the Cronbach alpha coefficient measuring scale reliability. Moreover, the p-value for the Bartlett test of sphericity is not significant, i.e., there appears to be no relation between the two variables considered, inflation differential and currency convertibility.
Figure 1 reports considerable changes in the rankings, particularly, the drastic decline in the positions of Egypt and Mauritius. The rank of South Africa’s worsens in the macroeconomic dimension. Sierra Leone becomes the second-best integrated country on macroeconomic dimension and Libya remains at an abnormally high rank of seventh.
It appears that the not so realistic position of these countries may be driven by other factors.
Table 1 Statistical tests before and after the removal of the investment variable at the macroeconomic dimension and overall dimensions
Variables used: Macroeconomic: Inflation Currency Investment
Macroeconomic: Inflation Currency
Dimensions Dimensions revised
Test scale = mean(unstandardized items)
Average interitem covariance: 0.0021098 0.0034478 0.0051976 0.0040324 Number of items in the scale: 3 2 5 5 Scale reliability coefficient: 0.1529 0.1859 0.4885 0.4051 Determinant of the correlation matrix 0.968 0.987 0.462 0.509 Bartlett test of sphericity
Chi-square 1.643 0.69 39.049 34.098
5 The sensitivity analyses were conducted before the final adjustment of the data for the following two variables: AfCFTA and number of countries that grant visas on arrival. Since the sensitivity analyses focus on the macroeconomic and infrastructural dimensions where the data was not affected, the results of the sensitivity analyses remain valid.

23 | P a g e
Degrees of freedom 3 1 10 10 p-value 0.65 0.406 0 0 H0: variables are not intercorrelated
Kaiser-Meyer-Olkin Measure of Sampling Adequacy
KMO 0.452 0.5 0.505 0.527
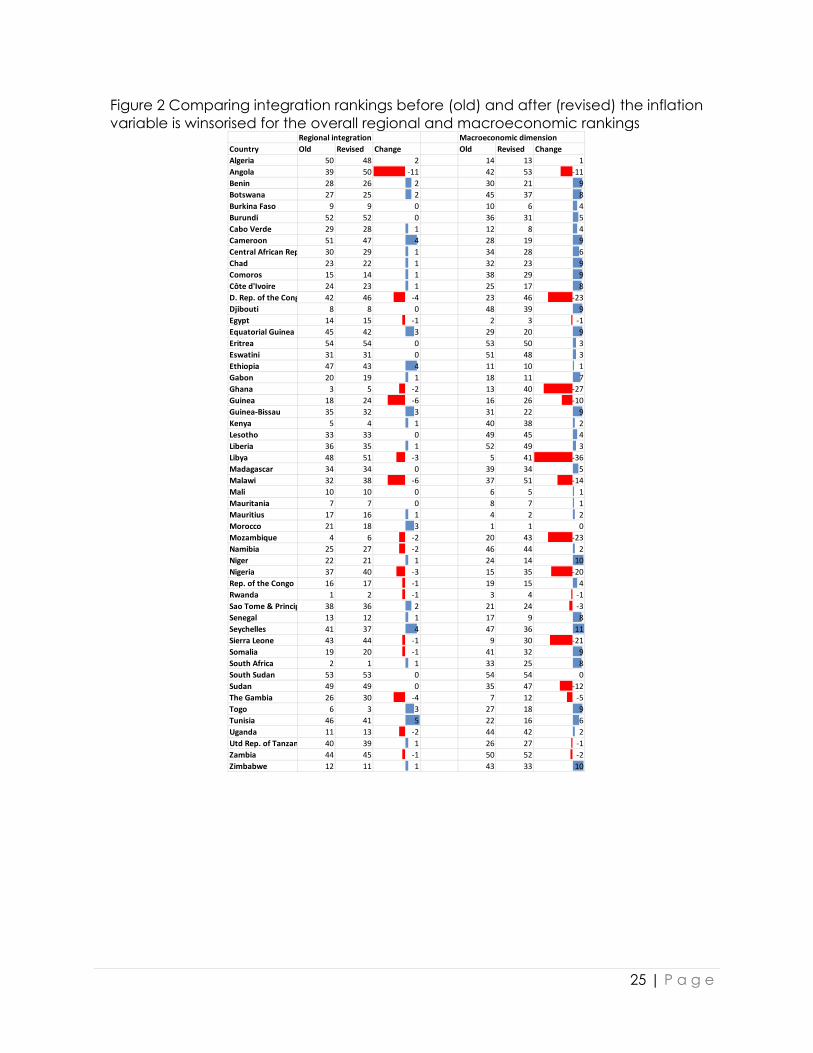
Step 2 Issue: Given that the removal of the investment variable does not improve the results, it is suspected that the problem lies in the other variables. It was identified that the inflation differential variable suffers from the presence of outlier which increases the variance in the data and consequently affects the PCA results, and possibly the overall rankings
Action: The inflation variable is winsorised to cater to the extreme value reported for South Sudan inflation rate. This will reduce the variance that was unduly inflated by the outlier.
Result: Statistical test shows some improvement. The scale reliability coefficient increases only to 0.19 which is still far from the accepted benchmark of 0.5 but better than before. The Bartlett test remains insignificant.
However, ranking seems to be more in line with reality. In particular, the positions of Libya and Sierra Leone decline in the macroeconomic dimension. The ranking of South Africa improves from 33rd to 25th.
Table 2 Statistical tests before and after the winsorisation of the inflation variable at the macroeconomic dimension and overall dimensions
Macroeconomic: Inflation Currency Investment
Macroeconomic: Inflation-Winsorised Currency Investment
Dimensions Dimensions revised
Test scale = mean(unstandardized items)
Average interitem covariance: 0.0021098 0.0036542 0.0051976 0.0051159 Number of items in the scale: 3 3 5 5 Scale reliability coefficient: 0.1529 0.1941 0.4885 0.4759 Determinant of the correlation matrix 0.968 0.976 0.462 0.459 Bartlett test of sphericity
Chi-square 1.643 1.245 39.049 39.369 Degrees of freedom 3 3 10 10 p-value 0.65 0.742 0 0 H0: variables are not intercorrelated
Kaiser-Meyer-Olkin Measure of Sampling Adequacy
KMO 0.452 0.498 0.505 0.489

24 | P a g e
Figure 1 Comparing integration rankings with (old) and without (revised) the investment variable for the overall regional and macroeconomic rankings
Regional integration Macroeconomic dimensionCountry Old Revised Change Old Revised ChangeAlgeria 50 51 -1 14 34 -20Angola 39 44 -5 42 52 -10Benin 28 22 6 30 20 10Botswana 27 27 0 45 41 4Burkina Faso 9 9 0 10 15 -5Burundi 52 52 0 36 29 7Cabo Verde 29 25 4 12 8 4Cameroon 51 48 3 28 18 10Central African Rep 30 24 6 34 26 8Chad 23 17 6 32 22 10Comoros 15 14 1 38 32 6Côte d'Ivoire 24 20 4 25 14 11D. Rep. of the Cong 42 40 2 23 11 12Djibouti 8 8 0 48 45 3Egypt 14 39 -25 2 53 -51Equatorial Guinea 45 42 3 29 19 10Eritrea 54 53 1 53 51 2Eswatini 31 29 2 51 49 2Ethiopia 47 49 -2 11 37 -26Gabon 20 19 1 18 23 -5Ghana 3 2 1 13 6 7Guinea 18 16 2 16 12 4Guinea-Bissau 35 28 7 31 21 10Kenya 5 5 0 40 30 10Lesotho 33 33 0 49 46 3Liberia 36 38 -2 52 50 2Libya 48 46 2 5 7 -2Madagascar 34 35 -1 39 36 3Malawi 32 30 2 37 31 6Mali 10 13 -3 6 24 -18Mauritania 7 7 0 8 5 3Mauritius 17 36 -19 4 40 -36Morocco 21 34 -13 1 3 -2Mozambique 4 6 -2 20 28 -8Namibia 25 26 -1 46 43 3Niger 22 18 4 24 13 11Nigeria 37 32 5 15 10 5Rep. of the Congo 16 15 1 19 25 -6Rwanda 1 1 0 3 1 2Sao Tome & Princip 38 31 7 21 9 12Senegal 13 10 3 17 16 1Seychelles 41 43 -2 47 44 3Sierra Leone 43 37 6 9 2 7Somalia 19 23 -4 41 42 -1South Africa 2 3 -1 33 35 -2South Sudan 53 54 -1 54 54 0Sudan 49 50 -1 35 47 -12The Gambia 26 21 5 7 4 3Togo 6 4 2 27 17 10Tunisia 46 47 -1 22 33 -11Uganda 11 11 0 44 39 5Utd Rep. of Tanzan 40 41 -1 26 27 -1Zambia 44 45 -1 50 48 2Zimbabwe 12 12 0 43 38 5
25 | P a g e
Figure 2 Comparing integration rankings before (old) and after (revised) the inflation variable is winsorised for the overall regional and macroeconomic rankings
Regional integration Macroeconomic dimensionCountry Old Revised Change Old Revised ChangeAlgeria 50 48 2 14 13 1Angola 39 50 -11 42 53 -11Benin 28 26 2 30 21 9Botswana 27 25 2 45 37 8Burkina Faso 9 9 0 10 6 4Burundi 52 52 0 36 31 5Cabo Verde 29 28 1 12 8 4Cameroon 51 47 4 28 19 9Central African Rep 30 29 1 34 28 6Chad 23 22 1 32 23 9Comoros 15 14 1 38 29 9Côte d'Ivoire 24 23 1 25 17 8D. Rep. of the Cong 42 46 -4 23 46 -23Djibouti 8 8 0 48 39 9Egypt 14 15 -1 2 3 -1Equatorial Guinea 45 42 3 29 20 9Eritrea 54 54 0 53 50 3Eswatini 31 31 0 51 48 3Ethiopia 47 43 4 11 10 1Gabon 20 19 1 18 11 7Ghana 3 5 -2 13 40 -27Guinea 18 24 -6 16 26 -10Guinea-Bissau 35 32 3 31 22 9Kenya 5 4 1 40 38 2Lesotho 33 33 0 49 45 4Liberia 36 35 1 52 49 3Libya 48 51 -3 5 41 -36Madagascar 34 34 0 39 34 5Malawi 32 38 -6 37 51 -14Mali 10 10 0 6 5 1Mauritania 7 7 0 8 7 1Mauritius 17 16 1 4 2 2Morocco 21 18 3 1 1 0Mozambique 4 6 -2 20 43 -23Namibia 25 27 -2 46 44 2Niger 22 21 1 24 14 10Nigeria 37 40 -3 15 35 -20Rep. of the Congo 16 17 -1 19 15 4Rwanda 1 2 -1 3 4 -1Sao Tome & Princip 38 36 2 21 24 -3Senegal 13 12 1 17 9 8Seychelles 41 37 4 47 36 11Sierra Leone 43 44 -1 9 30 -21Somalia 19 20 -1 41 32 9South Africa 2 1 1 33 25 8South Sudan 53 53 0 54 54 0Sudan 49 49 0 35 47 -12The Gambia 26 30 -4 7 12 -5Togo 6 3 3 27 18 9Tunisia 46 41 5 22 16 6Uganda 11 13 -2 44 42 2Utd Rep. of Tanzan 40 39 1 26 27 -1Zambia 44 45 -1 50 52 -2Zimbabwe 12 11 1 43 33 10
26 | P a g e
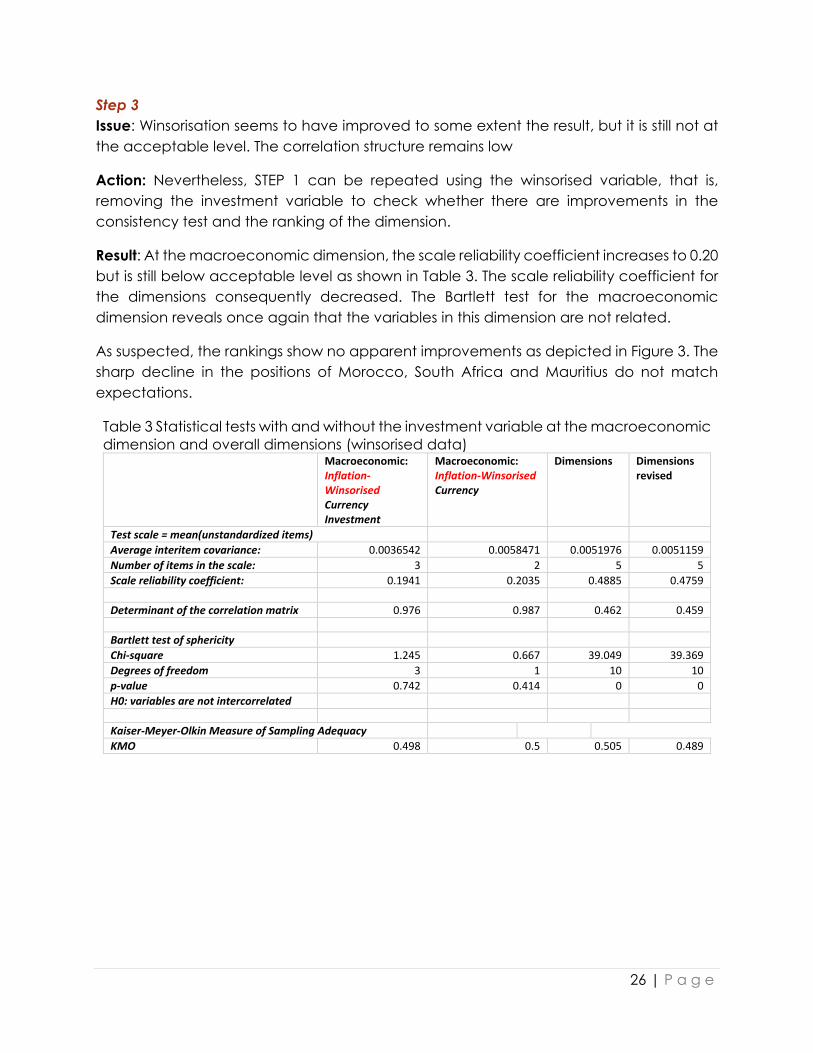
Step 3 Issue: Winsorisation seems to have improved to some extent the result, but it is still not at the acceptable level. The correlation structure remains low
Action: Nevertheless, STEP 1 can be repeated using the winsorised variable, that is, removing the investment variable to check whether there are improvements in the consistency test and the ranking of the dimension.
Result: At the macroeconomic dimension, the scale reliability coefficient increases to 0.20 but is still below acceptable level as shown in Table 3. The scale reliability coefficient for the dimensions consequently decreased. The Bartlett test for the macroeconomic dimension reveals once again that the variables in this dimension are not related.
As suspected, the rankings show no apparent improvements as depicted in Figure 3. The sharp decline in the positions of Morocco, South Africa and Mauritius do not match expectations.
Table 3 Statistical tests with and without the investment variable at the macroeconomic dimension and overall dimensions (winsorised data)
Macroeconomic: Inflation-Winsorised Currency Investment
Macroeconomic: Inflation-Winsorised Currency
Dimensions Dimensions revised
Test scale = mean(unstandardized items) Average interitem covariance: 0.0036542 0.0058471 0.0051976 0.0051159 Number of items in the scale: 3 2 5 5 Scale reliability coefficient: 0.1941 0.2035 0.4885 0.4759
Determinant of the correlation matrix 0.976 0.987 0.462 0.459
Bartlett test of sphericity
Chi-square 1.245 0.667 39.049 39.369 Degrees of freedom 3 1 10 10 p-value 0.742 0.414 0 0 H0: variables are not intercorrelated
Kaiser-Meyer-Olkin Measure of Sampling Adequacy
KMO 0.498 0.5 0.505 0.489

27 | P a g e
Figure 3 Comparing integration rankings with (old) and without (revised) the investment variable (winsorised inflation data) for the overall regional and macroeconomic rankings
Step 4 Issue: The removal of the investment variable does not improve the statistical tests.
Action: Removing the variable regional convertibility of currency to check for its impact on the test results and on the macroeconomic dimension.
Regional integration Macroeconomic dimensionCountry Old Revised Change Country Old Revised ChangeRwanda 2 1 1 Morocco 1 2 -1Togo 3 2 1 Mauritius 2 27 -25South Africa 1 3 -2 Egypt 3 48 -45Kenya 4 4 0 Rwanda 4 1 3Ghana 5 5 0 Mali 5 17 -12Mauritania 7 6 1 Burkina Faso 6 7 -1Mozambique 6 7 -1 Mauritania 7 3 4Djibouti 8 8 0 Cabo Verde 8 4 4Burkina Faso 9 9 0 Senegal 9 8 1Senegal 12 10 2 Ethiopia 10 41 -31Zimbabwe 11 11 0 Gabon 11 16 -5Mali 10 12 -2 The Gambia 12 11 1Uganda 13 13 0 Algeria 13 34 -21Comoros 14 14 0 Niger 14 5 9Niger 21 15 6 Rep. of the Congo 15 20 -5Rep. of the Congo 17 16 1 Tunisia 16 26 -10Chad 22 17 5 Côte d'Ivoire 17 6 11Gabon 19 18 1 Togo 18 9 9Côte d'Ivoire 23 19 4 Cameroon 19 10 9Guinea 24 20 4 Equatorial Guinea 20 12 8Benin 26 21 5 Benin 21 13 8Somalia 20 22 -2 Guinea-Bissau 22 14 8Cabo Verde 28 23 5 Chad 23 15 8Central African Rep 29 24 5 Sao Tome & Princip 24 19 5The Gambia 30 25 5 South Africa 25 38 -13Botswana 25 26 -1 Guinea 26 22 4Guinea-Bissau 32 27 5 Utd Rep. of Tanzan 27 23 4Namibia 27 28 -1 Central African Rep 28 21 7Morocco 18 29 -11 Comoros 29 24 5Mauritius 16 30 -14 Sierra Leone 30 18 12Sao Tome & Princip 36 31 5 Burundi 31 30 1Eswatini 31 32 -1 Somalia 32 37 -5Lesotho 33 33 0 Zimbabwe 33 28 5Madagascar 34 34 0 Madagascar 34 40 -6Equatorial Guinea 42 35 7 Nigeria 35 29 6Liberia 35 36 -1 Seychelles 36 32 4Seychelles 37 37 0 Botswana 37 33 4Utd Rep. of Tanzan 39 38 1 Kenya 38 31 7Egypt 15 39 -24 Djibouti 39 35 4Nigeria 40 40 0 Ghana 40 25 15Sierra Leone 44 41 3 Libya 41 45 -4Malawi 38 42 -4 Uganda 42 39 3Tunisia 41 43 -2 Mozambique 43 49 -6D. Rep. of the Cong 46 44 2 Namibia 44 42 2Cameroon 47 45 2 Lesotho 45 43 2Zambia 45 46 -1 D. Rep. of the Cong 46 36 10Ethiopia 43 47 -4 Sudan 47 51 -4Algeria 48 48 0 Eswatini 48 44 4Angola 50 49 1 Liberia 49 46 3Sudan 49 50 -1 Eritrea 50 47 3Libya 51 51 0 Malawi 51 50 1Burundi 52 52 0 Zambia 52 52 0South Sudan 53 53 0 Angola 53 53 0Eritrea 54 54 0 South Sudan 54 54 0

28 | P a g e
Result: Statistical test deteriorates. The scale reliability coefficient becomes close to zero; this indicates the poor relationship between the variable inflation and investment. The removal of the currency variable is not recommended.
Table 4 Statistical tests with and without the currency variable at the macroeconomic dimension and overall dimensions (winsorised data)
Macroeconomic: Inflation-Winsorised Currency Investment
Macroeconomic: Inflation-Winsorised Investment
Dimensions Dimensions revised
Test scale = mean(unstandardized items)
Average interitem covariance: 0.0036542 0.0001716 0.0051976 0.0058734 Number of items in the scale: 3 2 5 5 Scale reliability coefficient: 0.1941 0.0069 0.4885 0.5035
Determinant of the correlation matrix 0.976 1 0.462 0.478
Bartlett test of sphericity
Chi-square 1.245 0.001 39.049 37.329 Degrees of freedom 3 1 10 10 p-value 0.742 0.98 0 0 H0: variables are not intercorrelated
Kaiser-Meyer-Olkin Measure of Sampling Adequacy
KMO 0.498 0.5 0.505 0.547
Step 5 Issue: Given the above results, for completeness, the problem may be lying in the inflation variable.
Action: Removing the inflation variable to check for its impact on the test results and on the macroeconomic dimension.
Result: Statistical test deteriorates. Thus, the resulting ranking is not reported.
Table 5 Statistical tests with and without the inflation variable at the macroeconomic dimension and overall dimensions (winsorised data)
Macroeconomic: Inflation-Winsorised Currency Investment
Macroeconomic: Currency Investment
Test scale = mean(unstandardized items)
Average interitem covariance: 0.0036542 0.004944 Number of items in the scale: 3 2 Scale reliability coefficient: 0.1941 0.1916
Determinant of the correlation matrix 0.976 0.989 Bartlett test of sphericity
Chi-square 1.245 0.583 Degrees of freedom 3 1 p-value 0.742 0.445 H0: variables are not intercorrelated
Kaiser-Meyer-Olkin Measure of Sampling Adequacy
KMO 0.498 0.5

29 | P a g e
Infrastructural dimension
Step 1 Issue: The statistical tests at the infrastructural dimension show some structural issues. It has a low scale reliability coefficient pointing to the poor internal consistency of the variables in the dimension. The low KMO indicates that PCA may not be very useful in defining weights. The variable SAATM seems to be the problem at hand given its negative correlation with the variable infrastructure index.
Action: Removing the SAATM variable to check whether there are improvements in the consistency test and the ranking of the dimension.
Table 6 Statistical tests with and without the SAATM variable at the infrastructural dimension and overall dimensions
Infrastructure: Infrastructure Connections Electricity SAATM
Infrastructure: Infrastructure Connections Electricity
Dimensions Dimensions revised **
Test scale = mean(unstandardized items)
Average interitem covariance: 0.00415 0.00385 0.0051159 0.0049669 Number of items in the scale: 4 3 5 5 Scale reliability coefficient: 0.159 0.2479 0.4759 0.4868
Determinant of the correlation matrix 0.776 0.913 0.459 0.354
Bartlett test of sphericity
Chi-square 12.921 4.671 39.369 52.459 Degrees of freedom 6 3 10 10 p-value 0.044 0.198 0 0 H0: variables are not intercorrelated
Kaiser-Meyer-Olkin Measure of Sampling Adequacy
KMO 0.359 0.482 0.489 0.46 ** Macroeconomic dimension includes Inflation (winsorised). Investment, currency variables
Results: The scale reliability coefficient increases both at the infrastructural dimension and at overall dimensions level as shown in Table 6 above. However, at the infrastructural dimension, the Barlett test statistic loses its significance pointing to possible incongruencies in variables in the dimension.
Ranking on the infrastructural dimension appears to be in line with expectations. There is a sharp decline in the ranks of Central African Rep., Liberia, Sierra Leone and Chad by 25 positions. Contrarily the positions of Seychelles, Tunisia, Libya, Mauritius and Algeria improved considerably.
Overall regional integration ranking tends to reflect the current state of integration. The position of Namibia improves by 13 ranks upwards while that of Mali declines from 10th to 18th position.

30 | P a g e
Step 2 Issue: The removal of the SAATM variable in the infrastructural dimension improves the scale reliability coefficient, however, the Barlett’s test of sphericity becomes insignificant because of the low correlation in the dimension.
Action: Removing both the electricity and SAATM variables to check whether there are improvements in the consistency test.
Result: The scale reliability coefficient improves considerably on the infrastructural dimension and slightly on the overall dimension. The sphericity test becomes significant as reported in Table 7.
There are considerable reshuffling of the rankings following the removal of the two variables, particularly at the top and bottom of the list: Seychelles, Tunisia, Mauritius, Libya and Algeria gain more than 20 places upwards. Contrarily. Central African Republic, Liberia, Sierra Leone, Niger and Chad lose 24 places and more. Eswatini suffers the most dropping from 5th to 40th position; this is because it is a top importer of electricity which is not accounted for anymore. Overall, the new regional ranking is in line with expectations.
Table 7 Statistical tests with and without the SAATM variable and Electricity variable at the infrastructural dimension and overall dimensions
Infrastructure: Infrastructure Connections Electricity
Infrastructure: Infrastructure Connections
Dimensions Dimensions revised **
Test scale = mean (unstandardized items)
Average interitem covariance: 0.00385 0.01177 0.0051159 0.005863 Number of items in the scale: 3 2 5 5 Scale reliability coefficient: 0.2479 0.4199 0.4759 0.5115
Determinant of the correlation matrix 0.913 0.902 0.459 0.352
Bartlett test of sphericity
Chi-square 4.671 4.308 39.369 52.759 Degrees of freedom 3 1 10 10 p-value 0.198 0.038 0 0 H0: variables are not intercorrelated
Kaiser-Meyer-Olkin Measure of Sampling Adequacy
KMO 0.482 0.5 0.489 0.462 ** Macroeconomic dimension includes Inflation (winsorised). Investment, currency variables

31 | P a g e
Figure 4 Comparing integration rankings with (old) and without (revised) the SAATM variable for the overall regional and infrastructural rankings
Regional integration Infrastructural dimensionCountry Old Revised Change Country Old Revised ChangeSouth Africa 1 1 0 Namibia 9 1 8Rwanda 2 2 0 South Africa 1 2 -1Togo 3 3 0 Botswana 2 3 -1Kenya 4 4 0 Morocco 21 4 17Mauritania 7 5 2 Egypt 3 5 -2Djibouti 8 6 2 Seychelles 27 6 21Ghana 5 7 -2 Tunisia 28 7 21Mozambique 6 8 -2 Libya 29 8 21Senegal 12 9 3 Mauritius 30 9 21Uganda 13 10 3 Kenya 4 10 -6Mauritius 16 11 5 Eswatini 5 11 -6Comoros 14 12 2 Algeria 31 12 19Morocco 18 13 5 Gabon 6 13 -7Namibia 27 14 13 Ethiopia 8 14 -6Somalia 20 15 5 Côte d'Ivoire 7 15 -8Burkina Faso 9 16 -7 Cameroon 33 16 17Zimbabwe 11 17 -6 Cabo Verde 32 17 15Mali 10 18 -8 Zambia 34 18 16Egypt 15 19 -4 Togo 13 19 -6Cabo Verde 28 20 8 Zimbabwe 10 20 -10The Gambia 30 21 9 Senegal 35 21 14Gabon 19 22 -3 Nigeria 12 22 -10Rep. of the Congo 17 23 -6 Ghana 11 23 -12Botswana 25 24 1 Benin 14 24 -10Lesotho 33 25 8 Utd Rep. of Tanzania 36 25 11Guinea-Bissau 32 26 6 Mozambique 16 26 -10Côte d'Ivoire 23 27 -4 Rwanda 15 27 -12Madagascar 34 28 6 Mali 17 28 -11Niger 21 29 -8 Comoros 38 29 9Chad 22 30 -8 The Gambia 37 30 7Guinea 24 31 -7 Uganda 39 31 8Seychelles 37 32 5 Burkina Faso 18 32 -14Benin 26 33 -7 Lesotho 44 33 11Sao Tome & Principe 36 34 2 Djibouti 40 34 6Tunisia 41 35 6 Sao Tome & Principe 41 35 6Malawi 38 36 2 Angola 42 36 6Eswatini 31 37 -6 Malawi 43 37 6Utd Rep. of Tanzania 39 38 1 Equatorial Guinea 45 38 7Central African Rep. 29 39 -10 Sudan 46 39 7Equatorial Guinea 42 40 2 Rep. of the Congo 19 40 -21Zambia 45 41 4 Madagascar 47 41 6Liberia 35 42 -7 Guinea 20 42 -22D. Rep. of the Congo 46 43 3 Mauritania 48 43 5Algeria 48 44 4 D. Rep. of the Congo 49 44 5Cameroon 47 45 2 Burundi 50 45 5Nigeria 40 46 -6 Niger 22 46 -24Sudan 49 47 2 Guinea-Bissau 51 47 4Ethiopia 43 48 -5 Central African Rep. 23 48 -25Angola 50 49 1 Liberia 24 49 -25Libya 51 50 1 Sierra Leone 25 50 -25Sierra Leone 44 51 -7 Chad 26 51 -25Burundi 52 52 0 Somalia 52 52 0South Sudan 53 53 0 Eritrea 53 53 0Eritrea 54 54 0 South Sudan 54 54 0

32 | P a g e
Figure 5 Comparing integration rankings with (old) and without (revised) both the SAATM and Electricity variables for the overall regional and infrastructural rankings
Regional integration Infrastructural dimensionCountry Old Revised Change Country Old Revised ChangeSouth Africa 1 1 0 South Africa 1 1 0Kenya 4 2 2 Egypt 3 2 1Rwanda 2 3 -1 Seychelles 27 3 24Mauritius 16 4 12 Morocco 21 4 17Ghana 5 5 0 Tunisia 28 5 23Togo 3 6 -3 Mauritius 30 6 24Djibouti 8 7 1 Libya 29 7 22Morocco 18 8 10 Kenya 4 8 -4Mauritania 7 9 -2 Algeria 31 9 22Senegal 12 10 2 Ethiopia 8 10 -2Mozambique 6 11 -5 Côte d'Ivoire 7 11 -4Egypt 15 12 3 Cabo Verde 32 12 20Uganda 13 13 0 Zimbabwe 10 13 -3Comoros 14 14 0 Zambia 34 14 20Zimbabwe 11 15 -4 Nigeria 12 15 -3Burkina Faso 9 16 -7 Gabon 6 16 -10Cabo Verde 28 17 11 Cameroon 33 17 16Mali 10 18 -8 Ghana 11 18 -7Somalia 20 19 1 Botswana 2 19 -17Seychelles 37 20 17 Senegal 35 20 15Tunisia 41 21 20 Namibia 9 21 -12Côte d'Ivoire 23 22 1 Utd Rep. of Tanzania 36 22 14The Gambia 30 23 7 Rwanda 15 23 -8Gabon 19 24 -5 Benin 14 24 -10Rep. of the Congo 17 25 -8 Comoros 38 25 13Guinea-Bissau 32 26 6 The Gambia 37 26 11Madagascar 34 27 7 Uganda 39 27 12Sao Tome & Principe 36 28 8 Mali 17 28 -11Guinea 24 29 -5 Djibouti 40 29 11Namibia 27 30 -3 Sao Tome & Principe 41 30 11Chad 22 31 -9 Togo 13 31 -18Lesotho 33 32 1 Angola 42 32 10Utd Rep. of Tanzania 39 33 6 Malawi 43 33 10Niger 21 34 -13 Burkina Faso 18 34 -16Benin 26 35 -9 Equatorial Guinea 45 35 10Malawi 38 36 2 Mozambique 16 36 -20Equatorial Guinea 42 37 5 Sudan 46 37 9Botswana 25 38 -13 Rep. of the Congo 19 38 -19Central African Rep. 29 39 -10 Madagascar 47 39 8Zambia 45 40 5 Eswatini 5 40 -35Algeria 48 41 7 Guinea 20 41 -21Nigeria 40 42 -2 Mauritania 48 42 6Libya 51 43 8 D. Rep. of the Congo 49 43 6Cameroon 47 44 3 Burundi 50 44 6Eswatini 31 45 -14 Guinea-Bissau 51 45 6Liberia 35 46 -11 Lesotho 44 46 -2D. Rep. of the Congo 46 47 -1 Central African Rep. 23 47 -24Ethiopia 43 48 -5 Liberia 24 48 -24Angola 50 49 1 Sierra Leone 25 49 -24Sudan 49 50 -1 Niger 22 50 -28Sierra Leone 44 51 -7 Chad 26 51 -25Burundi 52 52 0 Somalia 52 52 0South Sudan 53 53 0 Eritrea 53 53 0Eritrea 54 54 0 South Sudan 54 54 0

33 | P a g e
Step 3 Issue: The removal of both the electricity and SAATM variables tend to improve the scale reliability coefficient on the infrastructural dimension. It is, however, pertinent to test how the combination of other variables affects the robustness of the dimension.
Action: Test how the combination of the other variables affects the scale reliability coefficient and Bartlett test.
Result: As reported in Table 8 Statistical tests showing various combinations of variables there is no improvement in the scale reliability coefficient.
Table 8 Statistical tests showing various combinations of variables Variables used: Infrastructure Infrastructure Infrastructure Infrastructure
Infrastructure Infrastructure
Connections Connections Connections Connection
s Connections
Electricity Electricity
Electricity Electricity Electricity
SAATM
SAATM SAATM SAATM SAATM SAATM Original v1 v2 v3 v4 v5 v6 v7
Test scale = mean(unstandardized items)
Average interitem
covariance:
0.00415 0.00385 0.01177 0.00610 0.00974 0.00640 0.00749 0.17941
Number of items in the scale:
4 3 2 3 3 2 3 2
Scale reliability coefficient:
0.159 0.2479 0.4199 0.1457 0.2388 0.0876 0.1754 0.2068
Determinant of the correlation
matrix
0.776 0.913 0.902 0.792 0.906 0.994 0.97 0.979
Bartlett test of sphericity
Chi-square 12.921 4.671 4.308 11.908 5.043 0.3 1.58 1.117 Degrees of
freedom 6 3 1 3 3 1 3 1
p-value 0.044 0.198 0.038 0.008 0.169 0.584 0.664 0.291 H0: variables are
not intercorrelated
Kaiser-Meyer-Olkin Measure of Sampling Adequacy
KMO 0.359 0.482 0.5 0.381 0.463 0.5 0.47 0.5

34 | P a g e
Discussion of the results of the sensitivity analysis The various sensitivity analyses carried out show how the tests vary with the different combination of variables on the macroeconomic and infrastructural dimensions.
The macroeconomic dimension benefitted from the winsorisation of the inflation differential variable and overall ranking shows improvement. Nevertheless, the dimension suffers from very poor correlation among its variables and sensitivity analyses failed to provide a combination of variables that passes the statistical tests. This result points to the incongruency in the dimension that regroups variables that are not measuring the same concept. It would have been best to revise the variables used in this dimension or re-allocate them to other dimensions. However, because no other exhaustive variables are available at this stage, the three variables are retained but the inflation differential variable is winsorised.
The infrastructural dimension benefitted to some extent from the removal of the SAATM variable as the scale reliability coefficient improves. It benefitted even further when both the SAATM and the electricity trade variables were removed so that the Bartlett test also becomes significant. Thus, these two variables were removed. The AfDB composite index in the infrastructural dimension is itself capturing various key components of infrastructure including electricity, and transport and communication. These two variables account to some extent for the two variables previously removed, thus, ensuring comprehensiveness of the dimension.
6. Overview of final empirical results
The relevance of indicators in their dimensions In general, indicators in their dimensions are correlated and statistical tests performed on the overall dimensions show acceptable results. However, there are some issues at individual dimensions levels that should be addressed in future editions of the index.
The scale reliability coefficients tend to be low for some dimensions. The macroeconomic dimension has the lowest scale reliability coefficients for many regions, for instance, for Africa and CEN-SAD (See Table 27 and Table 30). The infrastructural dimension for the ECOWAS region also suffers from a low scale reliability coefficient. These results reveal that not all the indicators in these dimensions are measuring the same underlying concept they are supposed to reflect.
The trade integration dimension also has a low scale reliability coefficient, for instance, it is only 0.45 for Africa and 0.37 for COMESA ((See Table 27 and Table 31). It is suspected that the indicator AfCFTA is acting as noise as it is only reflecting an institutional arrangement status and not measuring actual trade integration as compared to the

35 | P a g e
other indicators in the dimension. In fact, removing the AfCFTA as an indicator improves the scale reliability coefficient. Results are not reported here.
An analysis of the correlation structures as shown in the tables in section 8 reveal low correlations. In the case of Africa, as depicted in Table 18, there are very few cells on the diagonals that are highlighted green, that is, that have a high positive correlation (greater than 0.3). In the macroeconomic dimension, two cells are red-coloured pointing to the negative correlation between its variables. This evidences that the variables included in this dimension are not well-related and should not in principle be grouped together. This issue should be addressed in subsequent editions of ARII to arrive at a more robust conceptual framework.
The latter problem persists even for the RECs: all the variables on the macroeconomic dimensions are negatively correlated for CEN-SAD as shown in Table 21. ECOWAS also suffers from the same flaw, see Table 20. Low correlation is also a feature of the free movement of people dimension for SADC and the smaller communities, EAC and AMU as shown in Table 25 and Table 26 respectively.
Most dimensions at the African level pass the Bartlett’s test of sphericity except for the infrastructural and macroeconomic dimension as evidenced in Table 27; the p-values on these dimensions are insignificant. On the contrary, most dimensions at the RECs level fail to pass the test. Moreover, the free movement of people dimension appears to have some specification problems as it reveals collinearity when we consider the tests performed for AMU and ECOWAS.
The KMO tests at the dimensional level are more or less around 0.5 for Africa. However, the results for the trade dimension is lowest indicating that there is poor coherence amongst its indicators. AMU and EAC also suffer from very weak KMOs for the trade dimensions.
On a positive note, generally speaking, the tests performed on the aggregated dimensions have better performances revealing that the 5 dimensions together, trade, productive, macroeconomic, infrastructure and free movement of people, are contributing to measure regional integration. This result does not hold for the small REC AMU.
The significance of the weights assigned through PCA Table 45 reports all the weights that have been assigned to indicators and dimensions using PCA. The details of the computation of the weights are reported in the section Empirical results: PCA and weightings. As is evident, PCA assigned different weights to the same indicators and dimensions for different regions. This is because the structure of the data is different for different regions.

36 | P a g e
At the African level, the macroeconomic dimension is assigned the highest weight while the free movement of people dimension has the lowest weight. The macroeconomic dimension has more variance which explains its weight. In general, the free movement of people dimension has less variability as such it has the lowest weight. The productive dimension also has a low weight; it is relatively more related to the trade dimension, thus less significant overall. Contrarily, the trade dimension has the highest weight for ECOWAS while its macroeconomic dimension has the lowest weight.
To cross-check the validity of the results, rankings of countries are computed using an equal weighting system (using the final structure of ARII with 16 indicators) rather than using weights assigned through PCA. The results are reported in Figure 6 and show no drastic change in rankings. The most obvious changes are Morocco and Egypt that lose nine positions with the equal weights ranking (due to their low performance on the free movement of people dimension) and Somalia that gains 8 positions. Statistical tests are performed on the two sets of results both at the overall regional integration level and at the level of each dimension to determine whether they are statistically different. The non-parametric statistical test Kendall tau reveals that there is no statistical difference between the PCA-weighted and equal-weighted rankings as revealed in Figure 8.
However, it should be noted that when comparison of the rankings using PCA weights and equal weights was done using the previous ARII structure with 18 indicators, the results were different, revealing considerable changes in the ranking of some countries as is evident by the longer red bars (negative change) and blue bars (positive change). For instance, Ivory Coast gains eight places with equal weight and is positioned 16th. The Gambia loses six places while Nigeria gains six.
It can be concluded that PCA weights were compensating for some of the discrepancies that exist in the data and dimensions. It is therefore especially useful when the structure of the index is not well-defined due to poor data quality. It provides results that reflect the current state of regional integration. Therefore, the use of PCA is warranted.
When the conceptual framework is better defined, as in the case of ARII 2019 after modifications have been made following sensitivity analysis, PCA results tend to be closer to those using equal weights. The use of variables that are all explaining the same underlying concept provides no room for giving more importance to one variable over another.

37 | P a g e
Empirical results: Descriptive statistics Description of variables abbreviation:
Variable name Description Tariff Average intra-regional import tariffs Trade Share of intra-regional trade (over regional trade) Exports Share of intra-regional exports over GDP Imports Share of intra-regional imports over GDP ACFTA AfCFTA Intermediates import Share of intra-regional intermediate exports Intermediates export Share of intra-regional intermediate imports TCI Merchandise trade complementarity index Inflation Regional inflation differential Investment Number of bilateral investment treaties in force Currency Regional convertibility of currency AfDB Infrastructure AfDB Composite Infrastructure index Connections Number of intra-regional flight connections Required Number of countries that require a visa
Arrival Number of countries that may obtain a visa on arrival
Protocol Free movement of persons protocol (Kigali) Trade_d Aggregated trade dimension Productive_d Aggregated productive dimension Macro_d Aggregated macroeconomic dimension Infrastruc~d Aggregated infrastructural dimension Movement_d Aggregated free movement of people dimension

38 | P a g e
Table 9 Descriptive statistics - Africa T rade dimens ion Obs Mean S td Dev. Min Max
T ariff 54 0.83 0.20 0 1 T rade 54 0.06 0.14 0 1
E xports 54 0.17 0.19 0 1 Imports 54 0.11 0.17 0 1 AC F T A 54 0.65 0.35 0 1
Productive dimens ion Obs Mean S td Dev. Min Max Intermediates imports 54 0.12 0.17 0 1 Intermediates exports 54 0.08 0.17 0 1
T C I 54 0.38 0.18 0 1
Macroeconomic dimens ion
Obs Mean S td Dev. Min Max
Inflation 54 0.79 0.23 0 1 C urrency 54 0.26 0.22 0 1
Inves tment 54 0.12 0.21 0 1
Infras tructural dimens ion
Obs Mean S td Dev. Min Max
AfDB Infras tructure 54 0.25 0.24 0 1 C onnections 54 0.19 0.17 0 1
F ree movement of people
Obs Mean S td Dev. Min Max
R equired 54 0.49 0.37 0 1 Arr ival 54 0.27 0.37 0 1
Protocol 54 0.56 0.50 0 1
Aggregated Dimens ions
Obs Mean S td Dev. Min Max
T rade_d 54 0.38 0.12 0.11 0.73 Productive_d 54 0.20 0.13 0.05 1.00
Macro_d 54 0.40 0.13 0.02 0.81 Infras tructure_d 54 0.22 0.17 0.01 0.90
Movement_d 54 0.44 0.31 0.01 1.00

39 | P a g e
Table 10 Descriptive statistics - SADC T rade dimens ion Obs Mean S td. Dev. Min Max
T ariff 16 0.88 0.27 0 1 T rade 16 0.16 0.24 0 1
E xports 16 0.24 0.25 0 1 Imports 16 0.24 0.28 0 1
Productive dimens ion Obs Mean S td. Dev. Min Max
Intermediates imports 16 0.38 0.37 0 1 Intermediates exports 16 0.15 0.24 0 1
T C I 16 0.25 0.23 0 1
Macroeconomic dimens ion Obs Mean S td. Dev. Min Max
Inflation 16 0.78 0.30 0 1 C urrency 16 0.32 0.31 0 1
Inves tment 16 0.16 0.29 0 1
Infras tructural dimens ion Obs Mean S td. Dev. Min Max
AfDB Infras tructure 16 0.26 0.31 0 1 C onnections 16 0.17 0.24 0 1
F ree movement of people Obs Mean S td. Dev. Min Max
R equired 16 0.80 0.28 0 1 Arr ival 16 0.27 0.37 0 1
Protocol 16 0.44 0.51 0 1
Aggregated Dimens ions Obs Mean S td. Dev. Min Max
T rade_d 16 0.34 0.18 0.01 0.59 Productive_d 16 0.24 0.23 0.06 0.99
Macro_d 16 0.42 0.18 0.09 0.72 Infras tructure_d 16 0.21 0.23 0.02 0.89
Movement_d 16 0.49 0.23 0.22 1.00

40 | P a g e
Table 11 Descriptive statistics - ECOWAS T rade dimens ion Obs Mean S td.
Dev. Min Max
T ariff 15 0.921 0.26 0 1
T rade 15 0.266 0.30 0 1
E xports 15 0.295 0.30 0 1
Imports 15 0.353 0.30 0 1
Productive dimens ion Obs Mean S td. Dev. Min Max
Intermediates imports 15 0.14 0.25 0 1
Intermediates exports 15 0.14 0.25 0 1
T C I 15 0.41 0.31 0 1
Macroeconomic dimens ion
Obs Mean S td. Dev. Min Max
Inflation 15 0.552 0.21 0 1
C urrency 15 0.133 0.35 0 1
Inves tment 15 0.831 0.31 0 1
Infras tructural dimens ion
Obs Mean S td. Dev. Min Max
AfDB Infras tructure 15 0.305 0.24 0 1
C onnections 15 0.292 0.26 0 1
F ree movement of people
Obs Mean S td. Dev. Min Max
R equired 15 1.000 0.00 1 1
Arr ival 15 1.000 0.00 1 1
Protocol 15 0.200 0.41 0 1
Aggregated Dimens ions Obs Mean S td. Dev. Min Max
T rade_d 15 0.438 0.16 0.20 0.77
Productive_d 15 0.220 0.20 0.00 0.72
Macro_d 15 0.469 0.18 0.25 0.86
Infras tructure_d 15 0.298 0.17 0.07 0.66
Movement_d 15 0.733 0.14 0.67 1.00

41 | P a g e
Table 12 Descriptive statistics – CEN-SAD T rade dimens ion Obs Mean S td. Dev. Min Max
T ariff 29 0.78 0.27 0 1
T rade 29 0.21 0.26 0 1
E xports 29 0.19 0.26 0 1
Imports 29 0.24 0.27 0 1
Productive dimens ion Obs Mean S td. Dev. Min Max
Intermediates imports 29 0.12 0.19 0 1
Intermediates exports 29 0.11 0.20 0 1
T C I 29 0.46 0.26 0 1
Macroeconomic dimens ion Obs Mean S td. Dev. Min Max
Inflation 29 0.47 0.32 0 1
C urrency 29 0.13 0.24 0 1
Inves tment 29 0.78 0.24 0 1
Infras tructural dimens ion Obs Mean S td. Dev. Min Max
AfDB Infras tructure 29 0.27 0.26 0 1
C onnections 29 0.34 0.25 0 1
F ree movement of people Obs Mean S td. Dev. Min Max
R equired 29 0.61 0.36 0 1
Arr ival 29 0.28 0.38 0 1
Protocol 29 0.62 0.49 0 1
Aggregated Dimens ions Obs Mean S td. Dev. Min Max
T rade_d 29 0.38 0.16 0.03 0.78
Productive_d 29 0.26 0.15 0.03 0.62
Macro_d 29 0.44 0.15 0.19 0.94
Infras tructure_d 29 0.30 0.21 0.06 0.80
Movement_d 29 0.51 0.31 0.00 1.00

42 | P a g e
Table 13 Descriptive statistics - COMESA T rade dimens ion Obs Mean S td Dev. Min Max
T ariff 21 0.856 0.287 0 1
T rade 21 0.301 0.295 0 1
E xports 21 0.322 0.263 0 1
Imports 21 0.289 0.284 0 1
Productive dimens ion Obs Mean S td Dev. Min Max
Intermediates imports 21 0.202 0.238 0 1
Intermediates exports 21 0.246 0.299 0 1
T C I 21 0.507 0.292 0 1
Macroeconomic dimens ion
Obs Mean S td Dev. Min Max
Inflation 21 0.117 0.217 0 1
C urrency 21 0.155 0.240 0 1
Inves tment 21 0.778 0.294 0 1
Infras tructural dimens ion
Obs Mean S td Dev. Min Max
AfDB Infras tructure 21 0.311 0.316 0 1
C onnections 21 0.322 0.250 0 1
F ree movement of people
Obs Mean S td Dev. Min Max
R equired 21 0.319 0.382 0 1
Arr ival 21 0.549 0.414 0 1
Protocol 21 0.286 0.463 0 1
Aggregated Dimens ions Obs Mean S td Dev. Min Max
T rade_d 21 0.445 0.166 0.15 0.95
Productive_d 21 0.328 0.212 0.07 0.83
Macro_d 21 0.365 0.148 0.12 0.67
Infras tructure_d 21 0.317 0.180 0.07 0.66
Movement_d 21 0.385 0.361 0.00 1.00

43 | P a g e
Table 14 Descriptive statistics - ECCAS T rade dimens ion Obs Mean S td.
Dev. Min Max
T ariff 11 0.55 0.39 0 1
T rade 11 0.28 0.31 0 1
E xports 11 0.27 0.32 0 1
Imports 11 0.22 0.33 0 1
Productive dimens ion Obs Mean S td. Dev. Min Max
Intermediates imports 11 0.19 0.30 0 1
Intermediates exports 11 0.36 0.37 0 1
T C I 11 0.41 0.30 0 1
Macroeconomic dimens ion
Obs Mean S td. Dev. Min Max
Inflation 11 0.75 0.29 0 1
C urrency 11 0.00 0.00 0.00 0.00
Inves tment 11 0.58 0.28 0 1
Infras tructural dimens ion
Obs Mean S td. Dev. Min Max
AfDB Infras tructure 11 0.48 0.32 0 1
C onnections 11 0.27 0.32 0 1
F ree movement of people
Obs Mean S td. Dev. Min Max
R equired 11 0.42 0.31 0 1
Arr ival 11 0.09 0.30 0 1
Protocol 11 0.82 0.40 0 1
Aggregated Dimens ions Obs Mean S td. Dev. Min Max
T rade_d 11 0.36 0.22 0.08 0.89
Productive_d 11 0.32 0.22 0.08 0.87
Macro_d 11 0.68 0.25 0.00 0.92
Infras tructure_d 11 0.37 0.26 0.00 0.83
Movement_d 11 0.47 0.25 0.06 1.00

44 | P a g e
Table 15 Descriptive statistics - IGAD T rade dimens ion Obs Mean S td. Dev. Min Max
T ariff 8 0.78 0.34 0 1 T rade 8 0.37 0.41 0 1
E xports 8 0.36 0.41 0 1 Imports 8 0.24 0.33 0 1
Productive dimens ion Obs Mean Std. Dev. Min Max Intermediates imports 8 0.27 0.33 0 1 Intermediates exports 8 0.25 0.44 0 1
T C I 8 0.47 0.36 0 1
Macroeconomic dimens ion Obs Mean Std. Dev. Min Max Inflation 8 0.33 0.36 0 1
C urrency 8 0.25 0.46 0 1 Inves tment 8 0.73 0.32 0 1
Infras tructural dimens ion Obs Mean Std. Dev. Min Max AfDB Infras tructure 8 0.48 0.41 0 1
C onnections 8 0.48 0.34 0 1
F ree movement of people Obs Mean Std. Dev. Min Max R equired 8 0.50 0.42 0 1
Arrival 8 0.45 0.39 0 1 Protocol 8 0.75 0.46 0 1
Aggregated Dimens ions Obs Mean Std. Dev. Min Max T rade_d 8 0.44 0.17 0.23 0.74
Productive_d 8 0.32 0.34 0.04 0.91 Macro_d 8 0.42 0.19 0.25 0.85
Infras tructure_d 8 0.48 0.31 0.04 1.00 Movement_d 8 0.54 0.37 0.06 1.00

45 | P a g e
Table 16 Descriptive statistics - EAC T rade dimens ion Obs Mean S td. Dev. Min Max
T ariff 6 1.000 0.000 1 1 T rade 6 0.473 0.432 0 1
E xports 6 0.393 0.363 0 1 Imports 6 0.448 0.415 0 1
Productive dimens ion
Obs Mean Std. Dev. Min Max
Intermediates imports
6 0.482 0.361 0 1
Intermediates exports
6 0.458 0.449 0 1
T C I 6 0.360 0.434 0 1
Macroeconomic dimens ion
Obs Mean Std. Dev. Min Max
Inflation 6 0.500 0.408 0 1 C urrency 6 0.820 0.402 0 1
Inves tment 6 0.000 0.000 0 0
Infras tructural dimens ion
Obs Mean Std. Dev. Min Max
AfDB Infras tructure
6 0.572 0.361 0 1
C onnections 6 0.537 0.372 0 1
F ree movement of people
Obs Mean Std. Dev. Min Max
R equired 6 0.833 0.408 0 1 Arrival 6 0.500 0.474 0 1
Protocol 6 0.667 0.516 0 1
Aggregated Dimens ions
Obs Mean Std. Dev. Min Max
T rade_d 6 0.440 0.270 0.117 0.829 Productive_d 6 0.434 0.374 0.003 0.910
Macro_d 6 0.660 0.362 0.000 0.991 Infras tructure_d 6 0.555 0.339 0.000 1.000
Movement_d 6 0.664 0.191 0.410 1.000

46 | P a g e
Table 17 Descriptive statistics - AMU T rade dimens ion Obs Mean S td.
Dev. Min Max
T ariff 5 0.579 0.427 0 1 T rade 5 0.557 0.448 0 1
E xports 5 0.306 0.408 0 1 Imports 5 0.488 0.428 0 1
Productive dimens ion Obs Mean Std. Dev.
Min Max
Intermediates imports 5 0.445 0.418 0 1 Intermediates exports 5 0.407 0.386 0 1
T C I 5 0.496 0.428 0 1
Macroeconomic dimens ion
Obs Mean Std. Dev.
Min Max
Inflation 5 0.743 0.423 0 1 C urrency 5 0.400 0.365 0 1
Inves tment Constant
Infras tructural dimens ion
Obs Mean Std. Dev.
Min Max
AfDB Infras tructure 5 0.633 0.382 0 1 C onnections 5 0.384 0.392 0 1
F ree movement of people
Obs Mean Std. Dev.
Min Max
R equired 5 0.333 0.471 0 1 Arrival 5 0.200 0.447 0 1
Protocol 5 0.200 0.447 0 1
Aggregated Dimens ions Obs Mean Std. Dev.
Min Max
T rade_d 5 0.481 0.198 0.253 0.790 Productive_d 5 0.449 0.330 0.000 0.796
Macro_d 5 0.571 0.310 0.167 0.998 Infras tructure_d 5 0.509 0.325 0.000 0.906
Movement_d 5 0.222 0.349 0.000 0.833

47 | P a g e
Empirical results: Correlation structures Green High correlation >.3 Red Negative correlation <0
Table 18 Pearson Correlation Coefficients-Africa Free Movement Productive Trade Macroeconomic Infrastructure
1 2 3 4 5 6 7 8 9 10 11 12 13 14 15 16 1 Required 1.00 2 Arrival 0.90 1.00 3 Protocol 0.13 0.09 1.00 4 Intermediates import -0.14 -0.22 -0.32 1.00 5 Intermediates export -0.15 -0.22 -0.27 0.75 1.00 6 TCI 0.08 0.07 -0.02 0.22 0.28 1.00 7 Trade -0.09 -0.15 -0.25 0.79 0.93 0.43 1.00 8 Tariff -0.05 -0.10 -0.04 0.15 0.12 -0.19 0.14 1.00 9 Exports 0.06 -0.11 -0.18 0.41 0.16 -0.23 0.15 0.11 1.00
10 Imports -0.08 -0.15 0.01 0.25 -0.03 -0.42 -0.06 0.18 0.66 1.00 11 ACFTA 0.04 -0.10 0.35 0.03 0.06 0.01 0.15 0.14 0.19 0.01 1.00 12 Currency 0.09 -0.02 0.17 -0.22 -0.08 -0.06 -0.10 -0.04 -0.23 -0.25 0.30 1.00 13 Inflation 0.30 0.19 -0.09 -0.06 -0.11 0.02 -0.03 -0.08 0.10 0.01 0.31 0.11 1.00 14 Investment -0.18 -0.15 -0.31 0.09 0.14 0.14 0.16 -0.03 -0.15 -0.22 -0.06 -0.11 0.00 1.00 15 Infrastructure -0.02 -0.03 -0.47 0.29 0.31 0.28 0.35 0.09 0.09 -0.11 -0.08 -0.13 0.07 0.58 1.00 16 Connections -0.04 -0.10 -0.27 0.69 0.68 0.38 0.76 0.04 0.08 -0.21 0.21 -0.04 0.08 0.32 0.28 1.00
Table 19 Pearson Correlation Coefficients - SADC 1 2 3 4 5 6 7 8 9 10 11 12 13 14 15
1 Required 1.000 2 Arrival 0.446 1.000 3 Protocol -0.358 -0.057 1.000 4 Intermediates import -0.053 -0.463 -0.247 1.000 5 Intermediates export -0.141 -0.372 -0.186 0.620 1.000 6 TCI 0.040 -0.103 -0.218 0.310 0.803 1.000 7 Trade -0.091 -0.384 -0.289 0.721 0.972 0.778 1.000 8 Tariff 0.224 -0.402 -0.462 0.302 0.179 0.090 0.234 1.000 9 Exports -0.006 -0.485 -0.245 0.266 0.060 -0.228 0.135 0.387 1.000
10 Imports -0.045 -0.412 0.053 0.265 -0.167 -0.406 -0.031 0.323 0.610 1.000 11 Currency 0.293 0.164 0.314 -0.063 0.056 0.222 0.007 -0.226 -0.388 -0.368 1.000 12 Inflation 0.490 0.223 -0.511 -0.001 0.071 -0.127 0.116 0.063 0.212 0.195 -0.226 1.000 13 Investment 0.303 -0.017 -0.269 -0.038 0.207 0.370 0.199 0.227 -0.236 -0.336 0.254 0.192 1.000 14 Infrastruc~e 0.255 0.094 -0.484 0.053 0.347 0.430 0.360 0.258 -0.066 -0.204 -0.323 0.384 0.405 1.000 15 Connections 0.063 -0.266 -0.209 0.626 0.961 0.845 0.952 0.215 -0.029 -0.212 0.151 0.073 0.332 0.386 1.000

48 | P a g e
Table 20 Pearson Correlation Coefficients - ECOWAS
1 2 3 4 5 6 7 8 9 10 11 12 13 14 15 1 Required . 2 Arrival . . 3 Protocol . . 1.000 4 Intermediates import . . 0.031 1.000 5 Intermediates export . . -0.157 0.161 1.000 6 TCI . . 0.020 0.594 0.229 1.000 7 Trade . . -0.022 0.746 0.720 0.499 1.000 8 Tariff . . 0.159 0.168 0.128 0.215 0.194 1.000 9 Exports . . 0.243 0.399 -0.081 0.413 0.186 0.278 1.000
10 Imports . . 0.377 0.156 -0.306 -0.286 0.015 -0.537 -0.053 1.000 11 Currency . . -0.127 -0.092 0.081 -0.453 0.065 -0.494 -0.036 0.481 1.000 12 Inflation . . 0.136 0.120 -0.612 0.018 -0.460 0.016 0.351 0.125 -0.356 1.000 13 Investment . . 0.294 -0.062 -0.088 -0.091 -0.119 0.125 -0.131 0.070 -0.032 0.208 1.000 14 Infrastructure . . -0.208 0.016 0.078 0.099 0.023 0.219 -0.129 -0.376 0.162 -0.251 -0.132 1.000 15 Connections . . 0.119 0.882 0.366 0.606 0.849 0.203 0.537 0.104 0.029 -0.142 -0.044 -0.049 1.000
Table 21 Pearson Correlation Coefficients – CEN-SAD 1 2 3 4 5 6 7 8 9 10 11 12 13 14 15
1 Required 1.000 2 Arrival 0.725 1.000 3 Protocol 0.246 0.173 1.000
4 Intermediates import -0.031 -0.228 -0.263 1.000
5 Intermediates export -0.116 -0.258 -0.401 0.356 1.000
6 TCI -0.163 -0.112 0.062 0.018 0.129 1.000 7 Trade -0.098 -0.292 -0.410 0.775 0.779 0.031 1.000 8 Tariff -0.057 -0.200 -0.002 0.103 0.096 -0.270 0.165 1.000 9 Exports 0.379 0.072 0.039 0.405 0.052 -0.094 0.258 0.198 1.000
10 Imports 0.210 -0.213 0.035 0.242 -0.124 -0.285 0.134 0.040 0.283 1.000 11 Currency 0.042 -0.320 -0.139 0.115 0.180 -0.290 0.173 0.265 0.283 0.494 1.000 12 Inflation 0.491 0.289 0.191 0.016 -0.374 -0.031 -0.207 -0.015 0.348 0.129 -0.071 1.000 13 Investment -0.403 -0.195 -0.282 0.096 0.146 -0.072 0.286 -0.056 -0.166 -0.138 -0.023 -0.076 1.000 14 Infrastructure -0.360 -0.191 -0.501 0.103 0.275 -0.159 0.331 0.037 -0.120 -0.303 0.020 -0.315 0.679 1.000 15 Connections -0.031 -0.270 -0.327 0.762 0.540 0.038 0.844 0.018 0.422 0.155 0.202 -0.038 0.448 0.384 1.000

49 | P a g e
Table 22 Pearson Correlation Coefficients - COMESA 1 2 3 4 5 6 7 8 9 10 11 12 13 14 15
1 Required 1.000
2 Arrival 0.760 1.000
3 Protocol 0.472 0.646 1.000
4 Intermediates import -0.120 -0.147 -0.009 1.000
5 Intermediates export -0.252 -0.287 0.097 0.716 1.000
6 TCI 0.306 0.324 0.236 0.196 0.266 1.000
7 Trade -0.213 -0.243 -0.057 0.831 0.797 0.426 1.000
8 Tariff 0.022 -0.166 -0.230 0.118 0.015 -0.228 0.125 1.000
9 Exports 0.308 -0.061 -0.009 0.510 0.331 0.237 0.368 0.270 1.000
10 Imports 0.365 0.320 0.234 0.269 -0.115 0.217 0.003 -0.232 0.270 1.000
11 Currency 0.242 0.264 0.377 -0.057 -0.148 0.182 -0.027 0.048 0.076 0.368 1.000
12 Inflation 0.491 0.346 0.176 -0.545 -0.454 0.188 -0.367 -0.111 -0.113 -0.102 0.169 1.000
13 Investment -0.454 -0.242 -0.305 -0.088 0.119 0.053 0.278 -0.043 -0.397 -0.369 -0.144 -0.061 1.000
14 Infrastructure -0.086 -0.357 -0.328 -0.116 0.198 0.073 0.114 0.045 -0.004 -0.294 -0.205 -0.039 0.457 1.000
15 Connections -0.037 -0.042 0.131 0.398 0.274 0.244 0.628 -0.023 0.104 -0.044 0.184 0.048 0.214 -0.204 1.000
Table 23 Pearson Correlation Coefficients - ECCAS 1 2 3 4 5 6 7 8 9 10 11 12 13 14 15
1 Required 1 2 Arrival 0.631 1 3 Protocol 0.110 0.149 1 4 Intermediates import 0.103 -0.133 -0.548 1 5 Intermediates export -0.129 0.148 -0.221 0.492 1 6 TCI 0.274 0.059 0.034 0.209 -0.174 1 7 Trade 0.146 -0.110 -0.093 0.593 0.531 0.219 1 8 Tariff -0.179 -0.337 0.503 -0.439 -0.060 0.219 0.062 1 9 Exports 0.416 0.382 -0.092 0.287 0.532 0.090 0.737 -0.127 1
10 Imports 0.015 -0.210 0.270 -0.146 -0.191 -0.175 0.161 0.019 0.158 1 11 Currency 0.650 0.496 0.360 0.106 0.138 0.020 0.144 -0.303 0.300 0.240 1 12 Inflation 0.422 0.063 -0.225 0.067 0.214 -0.087 0.206 -0.080 0.370 0.238 0.530 1 13 Investment . . . . . . . . . . . . . 14 Infrastructure 0.010 0.178 -0.002 -0.116 0.082 0.428 -0.108 -0.039 0.244 0.261 0.152 0.209 . 1 15 Connections 0.138 -0.111 -0.452 0.733 0.542 0.505 0.673 -0.135 0.559 -0.153 0.141 0.373 . 0.351 1

50 | P a g e
Table 24 Pearson Correlation Coefficients - IGAD 1 2 3 4 5 6 7 8 9 10 11 12 13 14 15
1 Required 1 2 Arrival 0.930 1 3 Protocol 0.492 0.601 1 4 Intermediates import 0.269 0.096 0.474 1 5 Intermediates export 0.341 0.049 0.308 0.769 1 6 TCI 0.652 0.472 0.304 0.398 0.721 1 7 Trade 0.103 -0.220 0.086 0.731 0.886 0.362 1 8 Tariff -0.283 -0.430 -0.327 0.052 0.266 0.246 0.296 1 9 Exports 0.631 0.448 0.243 0.395 0.510 0.584 0.458 0.435 1
10 Imports 0.509 0.646 0.326 0.012 -0.262 -0.046 -0.389 -0.825 -0.269 1 11 Currency -0.213 -0.248 0.000 0.179 0.013 -0.376 0.215 0.045 -0.223 0.167 1 12 Inflation 0.565 0.353 -0.203 -0.002 0.342 0.539 0.288 0.050 0.617 -0.112 -0.612 1 13 Investment -0.616 -0.601 -0.333 -0.250 -0.286 -0.724 0.104 -0.036 -0.243 -0.429 0.000 -0.056 1 14 Infrastructure 0.405 0.262 0.396 0.333 0.638 0.702 0.464 0.471 0.788 -0.520 -0.461 0.510 -0.164 1 15 Connections 0.264 0.044 0.007 0.022 0.463 0.194 0.580 -0.081 0.314 -0.200 -0.048 0.575 0.336 0.394 1
Table 25 Pearson Correlation Coefficients - EAC 1 2 3 4 5 6 7 8 9 10 11 12 13 14 15
1 Required 1 2 Arrival -0.258 1 3 Protocol -0.316 -0.204 1 4 Intermediates import 0.398 -0.520 0.507 1 5 Intermediates export 0.499 -0.948 0.242 0.639 1 6 TCI 0.378 -0.878 0.447 0.556 0.935 1 7 Trade 0.497 -0.874 0.427 0.741 0.970 0.956 1 8 Tariff . . . . . . . . 9 Exports 0.530 -0.690 0.446 0.888 0.807 0.805 0.886 . 1 10 Imports -0.017 0.892 -0.011 -0.177 -0.760 -0.649 -0.616 . -0.296 1 11 Currency 0.600 0.344 -0.316 -0.088 -0.093 -0.186 -0.067 . -0.179 0.308 1 12 Inflation 1.000 -0.253 -0.335 0.399 0.490 0.361 0.485 . 0.526 -0.013 0.594 1 13 Investment . . . . . . . . . . . . . 14 Infrastructure 0.776 -0.385 0.305 0.554 0.647 0.708 0.754 . 0.725 -0.063 0.436 0.758 . 1 15 Connections 0.707 -0.545 -0.023 0.425 0.726 0.579 0.701 . 0.443 -0.486 0.591 0.696 . 0.708 1

51 | P a g e
Table 26 Pearson Correlation Coefficients - AMU 1 2 3 4 5 6 7 8 9 10 11 12 13 14 15
1 Required 1 2 Arrival -0.395 1 3 Protocol -0.395 1.000 1 4 Intermediates import -0.154 -0.595 -0.595 1 5 Intermediates export -0.331 -0.588 -0.588 0.249 1 6 TCI 0.025 -0.648 -0.648 0.940 0.191 1 7 Trade -0.377 -0.695 -0.695 0.752 0.815 0.697 1 8 Tariff 0.801 -0.758 -0.758 0.064 0.234 0.285 0.156 1 9 Exports -0.471 -0.419 -0.419 0.809 0.463 0.572 0.757 -0.270 1
10 Imports -0.395 0.669 0.669 -0.005 -0.567 -0.238 -0.395 -0.845 0.246 1 11 Currency . . . . . . . . . . . 12 Inflation -0.722 0.340 0.340 0.400 -0.061 0.403 0.297 -0.583 0.275 0.289 . 1 13 Investment 0.4841 -0.1021 -0.1021 0.3667 -0.6275 0.5654 -0.1824 0.2925 -0.1964 -0.0145 . 0.2371 1 14 Infrastructure 0.618 -0.928 -0.928 0.473 0.348 0.495 0.428 0.772 0.329 -0.499 . -0.585 0.1573 1 15 Connections -0.428 -0.548 -0.548 0.857 0.570 0.668 0.865 -0.129 0.981 0.064 . 0.281 -0.1609 0.409 1

52 | P a g e
Empirical results: Eligibility tests Table 27 Statistical test results - Africa
T rade Productive Macroeconomic Infras truc ture Movement Dimens ions
T es t s cale = mean (uns tandardized items )
Average inter item covarianc e: 0.007 0.012 0.004 0.004 0.054 0.006
Number of items in the s cale: 5 3 3 3 3 5
S cale reliability coeffic ient: 0.450 0.674 0.194 0.248 0.571 0.500
Determinant of the correlation matr ix 0.454 0.396 0.976 0.913 0.192 0.378
B artlett tes t of s pheric ity (H0: var iables are not intercorrelated) C hi-s quare 39.838 47.334 1.245 4.671 84.36 49.091
Degrees of freedom 10 3 3 3 3 10
p-value 0 0 0.742 0.198 0 0
K ais er-Meyer-Olkin Meas ure of S ampling A dequacy 0.449 0.545 0.498 0.482 0.502 0.461
Table 28 Statistical test results - SADC T rade Productive Macroeconomic Infras truc ture Movement Dimens ions
T es t s cale = mean (uns tandardized items )
Average inter item covarianc e: 0.019 0.042 0.009 0.028 0.037 0.014 Number of items in the s cale: 4 3 3 2 3 5 S cale reliability coeffic ient: 0.611 0.758 0.252 0.544 0.471 0.694
Determinant of the correlation matr ix 0.481 0.183 0.826 0.851 0.688 0.199
B artlett tes t of s pheric ity (H0: var iables are not intercorrelated) C hi-s quare 9.38 22.351 2.524 2.182 4.925 20.204 Degrees of freedom 6 3 3 1 3 10 p-value 0.153 0 0.471 0.14 0.177 0.027
K ais er-Meyer-Olkin Meas ure of S ampling A dequacy 0.59 0.471 0.378 0.5 0.477 0.637

53 | P a g e
Table 29 Statistical test results - ECOWAS T rade Productive Macroeconomic Infras truc ture Movement Dimens ions
T es t s cale = mean (uns tandardized items )
Average inter item covarianc e: 0.165 0.025 0.016 0.003
0.007
Number of items in the s cale: 4 3 3 2
5
S cale reliability coeffic ient: 0.490 0.601 0.401 0.094
0.624
Determinant of the correlation matr ix 0.601 0.613 0.834 0.998 0.203
B artlett tes t of s pheric ity (H0: var iables are not intercorrelated) C hi-s quare 6.034 5.959 2.208 0.03 18.346 Degrees of freedom 6 3 3 1 10 p-value 0.419 0.114 0.53 0.862 0.049
K ais er-Meyer-Olkin Meas ure of S ampling A dequacy 0.49 0.541 0.495 0.5 0.622
Table 30 Statistical test results – CEN-SAD
T rade Productive Macroeconomic Infras truc ture Movement Dimens ions
T es t s cale = mean (uns tandardized items )
Average inter item covarianc e: 0.008 0.007 0.003 0.025 0.059 0.011 Number of items in the s cale: 4 3 3 2 3 5 S cale reliability coeffic ient: 0.464 0.337 0.103 0.554 0.606 0.630
Determinant of the correlation matr ix 0.809 0.858 0.988 0.854 0.446 0.401
B artlett tes t of s pheric ity (H0: var iables are not intercorrelated) C hi-s quare 5.483 4 0.316 4.226 21.157 23.319 Degrees of freedom 6 3 3 1 3 10 p-value 0.484 0.261 0.959 0.04 0 0.01
K ais er-Meyer-Olkin Meas ure of S ampling A dequacy 0.596 0.497 0.482 0.5 0.532 0.597

54 | P a g e
Table 31 Statistical test results - COMESA T rade Productive Macroeconomic Infras truc ture Movement Dimens ions
T es t s cale = mean (uns tandardized items )
Average inter item covarianc e: 0.0102 0.0293 0.0075 0.0161 0.1084 0.0061 Number of items in the s cale: 4 3 3 2 3 5 S cale reliability coeffic ient: 0.369 0.647 0.287 0.332 0.825 0.404
Determinant of the correlation matr ix 0.656 0.453 0.95 0.958 0.246 0.343
B artlett tes t of s pheric ity (H0: var iables are not intercorrelated) C hi-s quare 7.52 14.41 0.93 0.79 25.49 18.74 Degrees of freedom 6 3 3 1 3 10 p-value 0.276 0.002 0.818 0.375 0 0.044
K ais er-Meyer-Olkin Meas ure of S ampling A dequacy 0.42 0.54 0.54 0.50 0.63 0.431
Table 32 Statistical test results - ECCAS
T rade Productive Macroeconomic Infras truc ture Movement Dimens ions
T es t s cale = mean (uns tandardized items )
Average inter item covarianc e: 0.0188 0.0182 0.0449 0.0359 0.0300 0.0129 Number of items in the s cale: 4 3 2 2 3 5 S cale reliability coeffic ient: 0.4387 0.3828 0.692 0.5194 0.5112 0.5897
Determinant of the correlation matr ix
0.413 0.648 matrix has zero values on diagonal 0.877 0.589 0.309
B artlett tes t of s pheric ity (H0: var iables are not intercorrelated) C hi-s quare 6.93 3.54 1.12 4.33 8.81 Degrees of freedom 6 3 1 3 10 p-value 0.328 0.316 0.291 0.228 0.55
K ais er-Meyer-Olkin Meas ure of S ampling A dequacy 0.47 0.38 0.50 0.52 0.55

55 | P a g e
Table 33 Statistical test results - IGAD T rade Productive Macroeconomic Infras truc ture Movement Dimens ions
T es t s cale = mean (uns tandardized items )
Average inter item covarianc e: 0.021 0.046 0.011 0.030 0.051 0.012 Number of items in the s cale: 4 3 3 2 3 5 S cale reliability coeffic ient: 0.613 0.773 0.292 0.545 0.587 0.662
Determinant of the correlation matr ix 0.374 0.202 0.746 0.85 0.685 0.145
B artlett tes t of s pheric ity (H0: var iables are not intercorrelated) C hi-s quare 11.638 19.447 3.568 2.031 4.601 22.193 Degrees of freedom 6 3 3 1 3 10 p-value 0.071 0 0.312 0.154 0.203 0.014
K ais er-Meyer-Olkin Meas ure of S ampling A dequacy 0.556 0.554 0.352 0.5 0.588 0.431
Table 34 Statistical test results - EAC T rade Productive Macroeconomic Infras truc ture Movement Dimens ions
T es t s cale = mean (uns tandardized items )
Average inter item covarianc e: 0.0979 0.1244 0.0974 0.0952 0.0222 0.0453 Number of items in the s cale: 3 3 2 2 3 5 S cale reliability coeffic ient: 0.8177 0.8835 0.7449 0.8288 0.2526 0.8084
Determinant of the correlation matr ix 0.071 0.073 0.648 0.499 0.758 0.001
B artlett tes t of s pheric ity (H0: var iables are not intercorrelated)
C hi-s quare 8.40 8.28 1.52 2.44 0.88 18.32 Degrees of freedom 3 3 1 1 3 10 p-value 0.039 0.04 0.218 0.119 0.831 0.05
K ais er-Meyer-Olkin Meas ure of S ampling A dequacy
0.39 0.61 0.50 0.50 0.36 0.26

56 | P a g e
Table 35 Statistical test results - AMU T rade Productive Macroeconomic Infras truc ture Movement Dimens ions
T es t s cale = mean (uns tandardized items )
Average inter item covarianc e: 0.3523 0.0801 0.0366 0.0612 0.1222 0.0470 Number of items in the s cale: 4 3 2 2 3 5 S cale reliability coeffic ient: 0.4879 0.7295 0.3801 0.5808 0.8115 0.832
Determinant of the correlation matr ix 0.004 0.107 0.832 0.739 . 0
B artlett tes t of s pheric ity (H0: var iables are not intercorrelated) C hi-s quare 10.16 4.84 0.46 0.65 . . Degrees of freedom 6 3 1 3 . 10 p-value 0.118 0.184 0.498 884 . .
K ais er-Meyer-Olkin Meas ure of S ampling A dequacy 0.23 0.51 0.50 0.40 . .

57 | P a g e
Empirical results: PCA and weightings Table 36 Results of PCA and weights derived for indicators and dimensions - Africa
E igenvectors
Loadings
Weights
C omponent E igenvalue Difference Proportion C umulative Variable C omp1 C omp2 C omp3 Unexplained
C omp1
C omp2
C omp3
C omp1 1.781 0.572 0.356 0.356
Tariff 0.313 0.351 0.851 0.036
Tariff 0.417 0.386 0.801
Tariff 0.249
C omp2 1.209 0.323 0.242 0.598
Trade 0.183 0.633 -0.137 0.440
Trade 0.244 0.696 -0.129
Trade 0.144
C omp3 0.886 0.045 0.177 0.775
E xports 0.655 -0.171 -0.253 0.143
E xports 0.875 -0.188 -0.238
E xports 0.221
C omp4 0.841 0.557 0.168 0.943
Imports 0.612 -0.407 0.059 0.130
Imports 0.817 -0.447 0.055
Imports 0.224
C omp5 0.283 . 0.057 1.000
AC FTA 0.255 0.531 -0.435 0.375
AC FTA 0.340 0.584 -0.409
AC FTA 0.161
C omponent E igenvalue Difference Proportion C umulative Variable C omp1 C omp2 Unexplained
C omp1
C omp2
C omp1 1.894 1.030 0.631 0.631
Intermedia~M 0.651 -0.306 0.117
Intermedia~M
0.896 -0.284
Intermedia~M 0.320
C omp2 0.864 0.622 0.288 0.919
Intermedia~X 0.665 -0.213 0.124
Intermedia~X 0.915 -0.198
Intermedia~X 0.318
C omp3 0.242 . 0.081 1.000
TC I 0.367 0.928 0.001
TC I 0.505 0.863
TC I 0.362
C omponent E igenvalue Difference Proportion C umulative Variable C omp1 C omp2 Unexplained
C omp1
C omp2
C omp1 1.157 0.161 0.386 0.386
Inflation 0.519 0.683 0.224
Inflation 0.558 0.682
Inflation 0.360
C omp2 0.997 0.150 0.332 0.718
C urrency 0.703 0.002 0.428
C urrency 0.756 0.002
C urrency 0.266
C omp3 0.846 . 0.282 1.000
Investment -0.487 0.730 0.195
Investment -0.523 0.729
Investment 0.374
C omponent E igenvalue Difference Proportion C umulative Variable C omp1 Unexplained
C omp1
C omp1 1.284 0.266 0.428 0.428
Infrastruc~e 0.707 0.358
Infrastruc~e 0.801
Infrastructure 0.500
C omp2 1.018 0.319 0.339 0.767
C onnections 0.707 0.358
C onnections 0.801
C onnections 0.500
C omponent E igenvalue Difference Proportion C umulative Variable C omp1 C omp2 Unexplained
C omp1
C omp2
C omp1 1.921 0.945 0.640 0.640
R equired 0.700 -0.091 0.051
R equired 0.970 -0.090
R equired 0.327
C omp2 0.976 0.874 0.325 0.966
Arrival 0.696 -0.137 0.051
Arrival 0.965 -0.135
Arrival 0.328
C omp3 0.103 . 0.034 1.000
Protocol 0.161 0.986 0.000
Protocol 0.224 0.975
Protocol 0.345
C omponent E igenvalue Difference Proportion C umulative Variable C omp1 C omp2 C omp3 Unexplained
C omp1
C omp2
C omp3
C omp1 1.950 0.867 0.390 0.390
Trade_d 0.224 -0.521 0.729 0.118
Trade_d 0.313 -0.542 0.700
Trade_d 0.223
C omp2 1.083 0.161 0.217 0.607
Productive_d 0.571 -0.258 -0.093 0.284
Productive_d 0.798 -0.268 -0.089
Productive_d 0.181
C omp3 0.922 0.119 0.184 0.791
Macro_d 0.254 0.790 0.369 0.072
Macro_d 0.355 0.823 0.354
Macro_d 0.235
C omp4 0.803 0.561 0.161 0.952
Infrastruc~d 0.647 0.161 0.014 0.157
Infrastruc~d 0.903 0.167 0.013
Infrastruc~d 0.213
C omp5 0.242 . 0.048 1.000
Movement_d -0.375 0.109 0.568 0.415
Movement_d -0.524 0.113 0.546
Movement_d 0.148

58 | P a g e
Table 37 Results of PCA and weights derived for indicators and dimensions - SADC E igenvectors
Loadings
Weights
C omponent E igenvalue Difference Proportion C umulative Variable C omp1 C omp2 Unexplained
C omp1 C omp2
C omp1 1.929 0.862 0.482 0.482
Tariff 0.505 0.284 0.422
Tariff 0.702 0.293
T ar iff 0.193
C omp2 1.068 0.433 0.267 0.749
Trade 0.198 0.864 0.128
Trade 0.275 0.893
T rade 0.291
C omp3 0.635 0.267 0.159 0.908
E xports 0.615 -0.149 0.247
E xports 0.854 -0.154
E xports 0.251
C omp4 0.368 . 0.092 1.000
Imports 0.572 -0.389 0.207
Imports 0.795 -0.402
Imports 0.265
C omponent E igenvalue Difference Proportion C umulative Variable C omp1 Unexplained
C omp1
C omp1 2.178 1.475 0.726 0.726
Intermedia~M 0.494 0.468
Intermedia~M 0.729
Intermedia~M 0.244
C omp2 0.703 0.583 0.234 0.960
Intermedia~X 0.652 0.074
Intermedia~X 0.962
Intermedia~X 0.425
C omp3 0.120 . 0.040 1.000
TC I 0.575 0.281
TC I 0.848
T C I 0.330
C omponent E igenvalue Difference Proportion C umulative Variable C omp1 C omp2 Unexplained
C omp1 C omp2
C omp1 1.260 0.071 0.420 0.420
Inflation -0.255 0.795 0.167
Inflation -0.287 0.866
Inflation 0.340
C omp2 1.189 0.638 0.396 0.816
C urrency 0.780 -0.168 0.201
C urrency 0.875 -0.183
C urrency 0.326
C omp3 0.551 . 0.184 1.000
Investment 0.572 0.584 0.183
Investment 0.642 0.636
Inves tment 0.334
C omponent E igenvalue Difference Proportion C umulative Variable C omp1 Unexplained
C omp1
C omp1 1.387 0.775 0.694 0.694
Infrastruc~e 0.707 0.306
Infrastruc~e 0.833
Infras tructure 0.500
C omp2 0.613 . 0.306 1.000
C onnections 0.707 0.306
C onnections 0.833
C onnections 0.500
C omponent E igenvalue Difference Proportion C umulative Variable C omp1 C omp2 Unexplained
C omp1 C omp2
C omp1 1.601 0.656 0.534 0.534
R equired 0.690 0.022 0.239
R equired 0.872 0.021
R equired 0.299
C omp2 0.944 0.489 0.315 0.848
Arrival 0.556 0.625 0.137
Arrival 0.703 0.607
Arr ival 0.339
C omp3 0.455 . 0.152 1.000
Protocol -0.464 0.780 0.080
Protocol -0.588 0.758
Protocol 0.362
C omponent E igenvalue Difference Proportion C umulative Variable C omp1 C omp2 Unexplained
C omp1 C omp2
C omp1 2.391 1.052 0.478 0.478
Trade_d 0.459 -0.390 0.294
Trade_d 0.709 -0.452
T rade_d 0.189
C omp2 1.338 0.722 0.268 0.746
Productive_d 0.556 0.167 0.224
Productive_d 0.859 0.193
Productive_d 0.208
C omp3 0.616 0.208 0.123 0.869
Macro_d 0.087 0.723 0.282
Macro_d 0.135 0.837
Macro_d 0.193
C omp4 0.408 0.160 0.082 0.951
Infrastruc~d 0.497 0.400 0.196
Infrastruc~d 0.768 0.463
Infras truc~d 0.216
C omp5 0.247 . 0.049 1.000
Movement_d -0.476 0.370 0.276
Movement_d -0.736 0.428
Movement_d 0.194

59 | P a g e
Table 38 Results of PCA and weights derived for indicators and dimensions - ECOWAS
E igenvectors
Loadings
Weights
C omponent E igenvalue Difference Proportion C umulative
Variable C omp1 C omp2 C omp3 Unexplained
C omp1 C omp2 C omp3
C omp1 1.685 0.572 0.421 0.421
Tariff 0.675 -0.142 -0.047 0.208
Tariff 0.876 -0.149 -0.042
T ar iff 0.220
C omp2 1.112 0.308 0.278 0.699
Trade 0.286 0.666 -0.665 0.013
Trade 0.372 0.702 -0.597
T rade 0.274
C omp3 0.805 0.407 0.201 0.900
E xports 0.395 0.504 0.735 0.020
E xports 0.513 0.532 0.659
E xports 0.272
C omp4 0.398 . 0.100 1.000
Imports -0.553 0.531 0.124 0.158
Imports -0.718 0.560 0.111
Imports 0.234
C omponent E igenvalue Difference Proportion C umulative
Variable C omp1 C omp2 Unexplained
C omp1 C omp2
C omp1 1.70211 0.805905 0.5674 0.5674
Intermedia~M 0.6484 -0.3229 0.1909
Intermedia~M 0.8459 -0.3057
Intermedia~M 0.311
C omp2 0.8962 0.494505 0.2987 0.8661
Intermedia~X 0.3657 0.9264 0.003248
Intermedia~X 0.4772 0.877
Intermedia~X 0.384
C omp3 0.401695 . 0.1339 1
TC I 0.6677 -0.1938 0.2075
TC I 0.8711 -0.1835
T C I 0.305
C omponent E igenvalue Difference Proportion C umulative
Variable C omp1 C omp2 Unexplained
C omp1 C omp2
C omp1 1.426 0.454 0.475 0.475
C urrency -0.609 0.501 0.228
C urrency -0.727 0.494
C urrency 0.322
C omp2 0.972 0.371 0.324 0.800
Investment 0.384 0.864 0.064
Investment 0.458 0.852
Inves tment 0.390
C omp3 0.601 . 0.201 1.000
Inflation 0.695 -0.038 0.310
Inflation 0.830 -0.038
Inflation 0.288
C omponent E igenvalue Difference Proportion C umulative
Variable C omp1 C omp2 Unexplained
C omp1 C omp2
C omp1 1.049 0.099 0.525 0.525
Infrastruc~e -0.707 0.707 0.000
Infrastruc~e -0.724 0.690
Infras tructure 0.500
C omp2 0.951 . 0.475 1.000
C onnections 0.707 0.707 0.000
C onnections 0.724 0.690
C onnections 0.500
C omponent E igenvalue Difference Proportion C umulative
Variable C omp1 C omp2 Unexplained
C omp1 C omp2
R equired 0.333
Arr ival 0.333
Protocol 0.333
C omponent E igenvalue Difference Proportion C umulative
Variable C omp1 C omp2 Unexplained
C omp1 C omp2
C omp1 2.298 0.923 0.460 0.460
Trade_d 0.537 0.348 0.170
Trade_d 0.814 0.408
T rade_d 0.226
C omp2 1.375 0.650 0.275 0.735
Productive_d 0.592 -0.109 0.179
Productive_d 0.897 -0.127
Productive_d 0.224
C omp3 0.725 0.378 0.145 0.880
Macro_d -0.208 0.577 0.443
Macro_d -0.315 0.677
Macro_d 0.152
C omp4 0.347 0.092 0.069 0.949
Infrastruc~d 0.561 -0.077 0.268
Infrastruc~d 0.851 -0.090
Infras truc~d 0.199
C omp5 0.255 . 0.051 1.000
Movement_d 0.056 0.727 0.267
Movement_d 0.084 0.852
Movement_d 0.200

60 | P a g e
Table 39 Results of PCA and weights derived for indicators and dimensions – CEN-SAD E igenvectors
Loadings
Weights
C omponent E igenvalue Difference Proportion C umulative
Variable C omp1 C omp2 C omp3 Unexplained
C omp1 C omp2 C omp3
C omp1 1.559 0.586 0.390 0.390
Tariff 0.399 0.709 0.517 0.047
Tariff 0.498 0.699 0.465
Tariff 0.285
C omp2 0.973 0.164 0.243 0.633
Trade 0.509 0.199 -0.797 0.043
Trade 0.635 0.196 -0.717
Trade 0.286
C omp3 0.809 0.150 0.202 0.835
E xports 0.609 -0.129 0.108 0.396
E xports 0.761 -0.128 0.097
E xports 0.181
C omp4 0.659 . 0.165 1.000
Imports 0.459 -0.665 0.292 0.173
Imports 0.573 -0.656 0.263
Imports 0.248
C omponent E igenvalue Difference Proportion C umulative
Variable C omp1 C omp2 Unexplained
C omp1 C omp2
C omp1 1.384 0.396 0.461 0.461
Intermedia~M 0.661 -0.340 0.281
Intermedia~M 0.778 -0.338
Intermedia~M 0.303
C omp2 0.989 0.361 0.330 0.791
Intermedia~X 0.701 -0.036 0.318
Intermedia~X 0.825 -0.036
Intermedia~X 0.287
C omp3 0.627 . 0.209 1.000
TC I 0.266 0.940 0.029
TC I 0.313 0.935
TC I 0.409
C omponent E igenvalue Difference Proportion C umulative
Variable C omp1 C omp2 Unexplained
C omp1 C omp2
C omp1 1.093 0.070 0.364 0.364
C urrency 0.445 0.733 0.235
C urrency 0.465 0.741
C urrency 0.362
C omp2 1.023 0.139 0.341 0.705
Investment 0.497 -0.681 0.256
Investment 0.520 -0.688
Investment 0.351
C omp3 0.884 . 0.295 1.000
Inflation -0.745 -0.016 0.393
Inflation -0.779 -0.017
Inflation 0.287
C omponent E igenvalue Difference Proportion C umulative
Variable C omp1 C omp2 Unexplained
C omp1 C omp2
C omp1 1.384 0.768 0.692 0.692
Infrastruc~e 0.707 0.707 0.000
Infrastruc~e 0.832 0.555
Infrastructure 0.500
C omp2 0.616 . 0.308 1.000
C onnections 0.707 -0.707 0.000
C onnections 0.832 -0.555
C onnections 0.500
C omponent E igenvalue Difference Proportion C umulative
Variable C omp1 C omp2 Unexplained
C omp1 C omp2
C omp1 1.831 0.933 0.610 0.610
R equired 0.674 -0.183 0.139
R equired 0.912 -0.174
R equired 0.316
C omp2 0.898 0.627 0.299 0.910
Arrival 0.658 -0.292 0.131
Arrival 0.891 -0.277
Arrival 0.319
C omp3 0.271 . 0.090 1.000
Protocol 0.336 0.939 0.002
Protocol 0.455 0.890
Protocol 0.366
C omponent E igenvalue Difference Proportion C umulative
Variable C omp1 C omp2 C omp3 Unexplained
C omp1 C omp2 C omp3
C omp1 2.110 0.921 0.422 0.422
Trade_d 0.446 0.289 0.648 0.146
Trade_d 0.647 0.315 0.580
Trade_d 0.208
C omp2 1.189 0.387 0.238 0.660
Productive_d 0.324 -0.652 0.435 0.120
Productive_d 0.471 -0.711 0.390
Productive_d 0.215
C omp3 0.802 0.300 0.160 0.820
Macro_d 0.394 0.635 -0.131 0.178
Macro_d 0.573 0.693 -0.118
Macro_d 0.200
C omp4 0.502 0.106 0.100 0.921
Infrastruc~d 0.573 -0.058 -0.192 0.275
Infrastruc~d 0.832 -0.063 -0.172
Infrastruc~d 0.177
C omp5 0.397 . 0.079 1.000
Movement_d -0.461 0.291 0.581 0.180
Movement_d -0.670 0.318 0.520
Movement_d 0.200
Table 40 Results of PCA and weights derived for indicators and dimensions - COMESA

61 | P a g e
E igenvectors
Loadings
Weights
C omponent
E igenvalue
Difference
Proportion
C umulative
Variable C omp
1 C omp2 C omp3 Unexplaine
d
C omp1
C omp2
C omp3
C omp1 1.533 0.299 0.383 0.383
Tariff 0.407 -0.592 0.533 0.087
Tariff 0.504 -0.658 0.476
T ar iff 0.256
C omp2 1.234 0.435 0.309 0.692
Trade 0.573 -0.031 -0.749 0.048
Trade 0.709 -0.034 -0.670
T rade 0.267
C omp3 0.799 0.365 0.200 0.892
E xports 0.690 0.175 0.226 0.192
E xports 0.854 0.194 0.202
E xports 0.227
C omp4 0.434 . 0.109 1.000
Imports 0.176 0.786 0.322 0.108
Imports 0.218 0.873 0.288
Imports 0.250
C omponent
E igenvalue
Difference
Proportion
C umulative
Variable C omp
1 C omp2 Unexplaine
d
C omp1
C omp2
C omp1 1.843 0.966 0.614 0.614
Intermedia~M
0.651 -0.311 0.134
Intermedia~M
0.884 -0.291
Intermedia~M
0.318
C omp2 0.877 0.597 0.292 0.907
Intermedia~X
0.667 -0.200 0.144
Intermedia~X
0.906 -0.188
Intermedia~X
0.315
C omp3 0.280 . 0.093 1.000
TC I 0.362 0.929 0.002
TC I 0.491 0.870
T C I 0.367
C omponent
E igenvalue
Difference
Proportion
C umulative
Variable C omp
1 C omp2 Unexplaine
d
C omp1
C omp2
C omp1 1.254 0.315 0.418 0.418
C urrency 0.657 0.051 0.456
C urrency 0.736 0.049
C urrency 0.248
C omp2 0.940 0.134 0.313 0.731
Investment -0.507 0.768 0.123
Investment -0.568 0.745
Inves tment 0.400
C omp3 0.806 . 0.269 1.000
Inflation 0.558 0.638 0.227
Inflation 0.625 0.619
Inflation 0.352
C omponent
E igenvalue
Difference
Proportion
C umulative
Variable C omp
1 C omp2 Unexplaine
d
C omp1
C omp2
C omp1 1.204 0.409 0.602 0.602
Infrastruc~e -0.707 0.707 0.000
Infrastruc~e -0.776 0.631
Infras tructure
0.500
C omp2 0.796 . 0.398 1.000
C onnections 0.707 0.707 0.000
C onnections 0.776 0.631
C onnections 0.500
C omponent
E igenvalue
Difference
Proportion
C umulative
Variable C omp
1 Unexplained
C omp1
C omp1 2.260 1.721 0.753 0.753
R equired 0.575 0.254
R equired 0.864
R equired 0.330
C omp2 0.538 0.336 0.179 0.933
Arrival 0.621 0.130
Arrival 0.933
Arrival 0.385
C omp3 0.202 . 0.067 1.000
Protocol 0.534 0.356
Protocol 0.803
Protocol 0.285
C omponent
E igenvalue
Difference
Proportion
C umulative
Variable C omp
1 C omp2 C omp3 Unexplaine
d
C omp1
C omp2
C omp3
C omp1 1.817 0.453 0.364 0.364
Trade_d 0.631 -0.169 0.117 0.222
Trade_d 0.851 -0.197 0.122
T rade_d 0.181
C omp2 1.364 0.261 0.273 0.636
Productive_d
0.657 0.011 0.179 0.181
Productive_d
0.885 0.013 0.188
Productive_d
0.191
C omp3 1.103 0.695 0.221 0.857
Macro_d -0.226 0.669 0.394 0.125
Macro_d -0.304 0.782 0.414
Macro_d 0.204
C omp4 0.408 0.101 0.082 0.939
Infrastruc~d 0.336 0.693 -0.085 0.133
Infrastruc~d 0.453 0.809 -0.089
Infras truc~d 0.202
C omp5 0.307 . 0.061 1.000
Movement_d -0.083 -0.210 0.890 0.054
Movement_d
-0.111 -0.246 0.935
Movement_d 0.221

62 | P a g e
Table 41 Results of PCA and weights derived for indicators and dimensions - ECCAS E igenvectors
Loadings
Weights
C omponent E igenvalue Difference Proportion C umulative Variable C omp1 C omp2 Unexplained
C omp1 C omp2
C omp1 1.80191 0.770091 0.4505 0.4505
Tariff -0.0493 0.9356 0.09245
Tariff -0.06615 0.9504
T ar iff 0.320
C omp2 1.03182 0.105304 0.258 0.7084
Trade 0.6774 0.0891 0.165
Trade 0.9093 0.09048
T rade 0.295
C omp3 0.926514 0.686753 0.2316 0.9401
E xports 0.6829 -0.1431 0.1386
E xports 0.9167 -0.1453
E xports 0.304
C omp4 0.239761 . 0.0599 1
Imports 0.269 0.3103 0.7703
Imports 0.3611 0.3152
Imports 0.081
C omponent E igenvalue Difference Proportion C umulative Variable C omp1 C omp2 Unexplained
C omp1 C omp2
C omp1 1.49327 0.374751 0.4978 0.4978
Intermedia~M 0.7173 0.2434 0.1655
Intermedia~M 0.8765 0.2574
Intermedia~M 0.320
C omp2 1.11852 0.730309 0.3728 0.8706
Intermedia~X 0.6943 -0.3292 0.159
Intermedia~X 0.8484 -0.3482
Intermedia~X 0.322
C omp3 0.38821 . 0.1294 1
TC I 0.0592 0.9124 0.0637
TC I 0.07232 0.9649
T C I 0.358
C omponent E igenvalue Difference Proportion C umulative Variable C omp1 Unexplained
C omp1
C omp1 1.53032 1.06064 0.7652 0.7652
Inflation 0.7071 0.2388
C urrency 0.8747
C urrency 0.500
C omp2 0.469678 . 0.2348 1
C urrency 0.7071 0.2388
Inflation 0.8747
Inflation 0.500
C omponent E igenvalue Difference Proportion C umulative Variable C omp1 C omp2 Unexplained
C omp1 C omp2
C omp1 1.35089 0.701788 0.6754 0.6754
Infrastruc~e 0.7071 0.7071 0
Infrastruc~e 0.8219 0.5697
Infras tructure 0.500
C omp2 0.649106 . 0.3246 1
C onnections 0.7071 -0.7071 0
C onnections 0.8219 -0.5697
C onnections 0.500
C omponent E igenvalue Difference Proportion C umulative Variable C omp1 C omp2 Unexplained
C omp1 C omp2
C omp1 1.68006 0.728262 0.56 0.56
R equired 0.6788 -0.2164 0.1813
R equired 0.8799 -0.2111
R equired 0.311
C omp2 0.9518 0.583661 0.3173 0.8773
Arrival 0.6866 -0.1519 0.1861
Arrival 0.8899 -0.1482
Arr ival 0.309
C omp3 0.368139 . 0.1227 1
Protocol 0.2605 0.9644 0.000759
Protocol 0.3376 0.9409
Protocol 0.380
C omponent E igenvalue Difference Proportion C umulative Variable C omp1 C omp2 C omp3 Unexplained
C omp1 C omp2 C omp3
C omp1 2.0468 0.640347 0.4094 0.4094
Trade_d 0.4511 0.125 0.7761 0.07756
Trade_d 0.6454 0.1482 0.6957
T rade_d 0.217
C omp2 1.40646 0.602941 0.2813 0.6907
Productive_d 0.5763 -0.2901 0.0032 0.2017
Productive_d 0.8245 -0.3441 0.002853
Productive_d 0.188
C omp3 0.803516 0.364415 0.1607 0.8514
Macro_d 0.338 0.5465 -0.5197 0.1291
Macro_d 0.4835 0.6482 -0.4659
Macro_d 0.205
C omp4 0.439101 0.134979 0.0878 0.9392
Infrastruc~d 0.5898 -0.1865 -0.3129 0.1604
Infrastruc~d 0.8438 -0.2212 -0.2805
Infras truc~d 0.197
C omp5 0.304122 . 0.0608 1
Movement_d 0.048 0.7528 0.1722 0.1744
Movement_d 0.06869 0.8928 0.1543
Movement_d 0.194

63 | P a g e
Table 42 Results of PCA and weights derived for indicators and dimensions - IGAD C omponent E igenvalue Difference Proportion C umulative
Variable C omp1 C omp2 Unexplained
C omp1 C omp2
C omp1 2.3597 1.4358 0.5899 0.5899
Tariff 0.5675 -0.4043 0.0889
Tariff 0.8718 -0.3886
T ariff 0.277
C omp2 0.9239 0.3406 0.2310 0.8209
Trade 0.4281 0.5609 0.2769
Trade 0.6576 0.5391
T rade 0.220
C omp3 0.5833 0.4502 0.1458 0.9667
E xports 0.4349 0.5583 0.2657
E xports 0.6681 0.5366
E xports 0.224
C omp4 0.1331 . 0.0333 1.0000
Imports -0.5527 0.4586 0.0849
Imports -0.8490 0.4408
Imports 0.279
C omponent E igenvalue Difference Proportion C umulative
Variable C omp1 Unexplained
C omp1
C omp1 2.2717 1.6686 0.7572 0.7572
Intermedia~M 0.5535 0.3041
Intermedia~M 0.8342
Intermedia~M 0.306
C omp2 0.6030 0.4778 0.2010 0.9582
Intermedia~X 0.6382 0.0748
Intermedia~X 0.9619
Intermedia~X 0.407
C omp3 0.1253 . 0.0418 1.0000
TC I 0.5352 0.3494
TC I 0.8066
T C I 0.286
C omponent E igenvalue Difference Proportion C umulative
Variable C omp1 C omp2 Unexplained
C omp1 C omp2
C omp1 1.6146 0.6146 0.5382 0.5382
C urrency 0.7042 -0.0908 0.1911
C urrency 0.8948 -0.0909
C urrency 0.309
C omp2 1.0000 0.6146 0.3333 0.8715
Investment 0.0642 0.9959 0.0016
Investment 0.0816 0.9959
Inves tment 0.382
C omp3 0.3854 . 0.1285 1.0000
Inflation -0.7071 0.0000 0.1927
Inflation -0.8985 0.0000
Inflation 0.309
C omponent E igenvalue Difference Proportion C umulative
Variable C omp1 C omp2 Unexplained
C omp1 C omp2
C omp1 1.3940 0.7880 0.6970 0.6970
Infrastruc~e 0.7071 0.7071 0.0000
Infrastruc~e 0.7071 0.7071
Infras tructure 0.500
C omp2 0.6060 . 0.3030 1.0000
C onnections 0.7071 -0.7071 0.0000
C onnections 0.7071 -0.7071
C onnections 0.500
C omponent E igenvalue Difference Proportion C umulative
Variable C omp1 Unexplained
C omp1
C omp1 2.3678 1.7961 0.7893 0.7893
R equired 0.6036 0.1374
R equired 0.9287
R equired 0.364
C omp2 0.5717 0.5112 0.1906 0.9798
Arrival 0.6269 0.0696
Arrival 0.9646
Arrival 0.393
C omp3 0.0605 . 0.0202 1.0000
Protocol 0.4927 0.4252
Protocol 0.7581
Protocol 0.243
C omponent E igenvalue Difference Proportion C umulative
Variable C omp1 C omp2 Unexplained
C omp1 C omp2
C omp1 2.5920 1.2062 0.5184 0.5184
Trade_d 0.5380 0.1970 0.1960
Trade_d 0.8662 0.2319
T rade_d 0.202
C omp2 1.3858 0.8149 0.2772 0.7956
Productive_d 0.5558 0.0161 0.1988
Productive_d 0.8949 0.0190
Productive_d 0.201
C omp3 0.5709 0.2584 0.1142 0.9098
Macro_d -0.1504 0.7772 0.1042
Macro_d -0.2421 0.9150
Macro_d 0.225
C omp4 0.3125 0.1737 0.0625 0.9722
Infrastruc~d 0.4690 0.3893 0.2197
Infrastruc~d 0.7551 0.4583
Infras truc~d 0.196
C omp5 0.1388 . 0.0278 1.0000
Movement_d 0.3987 -0.4531 0.3034
Movement_d 0.6419 -0.5334
Movement_d 0.175

64 | P a g e
Table 43 Results of PCA and weights derived for indicators and dimensions - EAC E igenvectors
Loadings
Weights
C omponent E igenvalue Difference Proportion C umulative
Variable C omp1 Unexplained
C omp1
T ariff 0
C omp1 2.23087 1.50534 0.7436 0.7436
Trade 0.6584 0.03281
Trade 0.9835
T rade 0.434
C omp2 0.725528 0.681923 0.2418 0.9855
E xports 0.5872 0.2307
E xports 0.8771
E xports 0.345
C omp3 0.0436054 . 0.0145 1
Imports -0.4708 0.5056
Imports -0.7031
Imports 0.222
C omponent E igenvalue Difference Proportion C umulative
Variable C omp1 C omp2 Unexplained
C omp1 C omp2
C omp1 2.43337 1.92594 0.8111 0.8111
Intermedia~M 0.5082 0.8549 0.0006436
Intermedia~M 0.7928 0.609
Intermedia~M 0.340
C omp2 0.507434 0.448239 0.1691 0.9803
Intermedia~X 0.6178 -0.2776 0.03204
Intermedia~X 0.9638 -0.1977
Intermedia~X 0.329
C omp3 0.0591953 . 0.0197 1
TC I 0.6 -0.4383 0.02651
TC I 0.9359 -0.3122
T C I 0.331
C omponent E igenvalue Difference Proportion C umulative
Variable C omp1 Unexplained
C omp1
C omp1 1.59952 1.19903 0.7998 0.7998
Inflation 0.7071 0.2002
Inflation 0.8943
Inflation 0.500
C omp2 0.400485 . 0.2002
C urrency 0.7071 0.2002
C urrency 0.8943
C urrency 0.500
C omponent E igenvalue Difference Proportion C umulative
Variable C omp1 C omp2 Unexplained
C omp1 C omp2
C omp1 1.708 1.41599 0.854 0.854
Infrastruc~e 0.7071 0.7071 0
Infrastruc~e 0.9241 0.3821
Infras tructure 0.500
C omp2 0.292004 . 0.146 1
C onnections 0.7071 -0.7071 0
C onnections 0.9241 -0.3821
C onnections 0.500
C omponent E igenvalue Difference Proportion C umulative
Variable C omp1 C omp2 Unexplained
C omp1 C omp2
C omp1 1.32543 0.129112 0.4418 0.4418 R equired -0.7663 -0.1836 0.1813
R equired -0.8823 -0.2008 R equired 0.325
C omp2 1.19632 0.718066 0.3988 0.8406 Arrival 0.2323 0.8142 0.1354
Arrival 0.2675 0.8905 Arrival 0.343
C omp3 0.478252 . 0.1594 1 Protocol 0.5989 -0.5508 0.1616
Protocol 0.6895 -0.6024 Protocol 0.332
C omponent E igenvalue Difference Proportion C umulative Variable C omp1 C omp2 Unexplained
C omp1 C omp2
C omp1 2.95818 1.75952 0.5916 0.5916 Trade_d 0.5256 -0.2353 0.1166
Trade_d 0.9039 -0.2576 T rade_d 0.213
C omp2 1.19866 0.4359 0.2397 0.8314 Productive_d 0.4814 -0.5045 0.00951
Productive_d 0.8279 -0.5523 Productive_d 0.238
C omp3 0.762763 0.685505 0.1526 0.9839 Macro_d 0.3756 0.5125 0.268
Macro_d 0.6459 0.5611 Macro_d 0.176
C omp4 0.0772579 0.0741195 0.0155 0.9994 Infrastruc~d 0.5512 0.0591 0.09698
Infrastruc~d 0.9481 0.06468 Infras truc~d 0.217
C omp5 0.0031384 . 0.0006 1 Movement_d 0.2172 0.6512 0.3521
Movement_d 0.3737 0.7129 Movement_d 0.156

65 | P a g e
Table 44 Results of PCA and weights derived for indicators and dimensions - AMU E igenvectors
Loadings
Weights
C omponent E igenvalue Difference Proportion C umulative
Variable C omp1 C omp2 Unexplained
C omp1 C omp2
C omp1 2.0086 0.2421 0.5021 0.5021
Tariff 0.6587 -0.1099 0.1072
Tariff 0.9335 -0.1461
T ariff 0.236
C omp2 1.7665 1.5465 0.4416 0.9438
Trade 0.2594 0.6878 0.0291
Trade 0.3676 0.9142
T rade 0.257
C omp3 0.2200 0.2149 0.0550 0.9987
E xports -0.1503 0.7175 0.0453
E xports -0.2130 0.9536
E xports 0.253
C omp4 0.0050 . 0.0013 1.0000
Imports -0.6901 -0.0026 0.0433
Imports -0.9781 -0.0035
Imports 0.253
C omponent E igenvalue Difference Proportion C umulative
Variable C omp1 C omp2 Unexplained
C omp1 C omp2
C omp1 2.0341 1.1261 0.6780 0.6780
Intermedia~M 0.6812 -0.1715 0.0293
Intermedia~M 0.9716 -0.1634
Intermedia~M 0.330
C omp2 0.9080 0.8501 0.3027 0.9807
Intermedia~X 0.2886 0.9564 0.0001
Intermedia~X 0.4116 0.9113
Intermedia~X 0.340
C omp3 0.0579 . 0.0193 1.0000
TC I 0.6728 -0.2365 0.0285
TC I 0.9596 -0.2254
T C I 0.330
C omponent E igenvalue Difference Proportion C umulative
Variable C omp1 C omp2 Unexplained
C omp1 C omp2
C omp1 1.2371 0.4743 0.6186 0.6186
Inflation 0.7071 0.7071 0.0000
Inflation 0.7865 0.6176
Inflation 0.500
C omp2 0.7629 . 0.3814 1.0000
Investment 0.7071 -0.7071 0.0000
Investment 0.7865 -0.6176
Inves tment 0.500
C omponent E igenvalue Difference Proportion C umulative
Variable C omp1 C omp2 Unexplained
C omp1 C omp2
C omp1 1.4094 0.8188 0.7047 0.7047
Infrastruc~e 0.7071 0.7071 0.0000
Infrastruc~e 0.8395 0.5434
Infras tructure 0.500
C omp2 0.5906 . 0.2953 1.0000
C onnections 0.7071 -0.7071 0.0000
C onnections 0.8395 -0.5434
C onnections 0.500
C omponent E igenvalue Difference Proportion C umulative
Variable C omp1 C omp2 Unexplained
C omp1 C omp2
C omp1 1.7994 0.6270 0.5998 0.5998
R equired 0.7298 0.1579 0.0125
R equired 0.9789 0.1710
R equired 0.332
C omp2 1.1724 1.1442 0.3908 0.9906
Arrival 0.6593 -0.4200 0.0110
Arrival 0.8844 -0.4547
Arrival 0.333
C omp3 0.0282 . 0.0094 1.0000
Protocol 0.1809 0.8937 0.0048
Protocol 0.2426 0.9677
Protocol 0.335
C omponent E igenvalue Difference Proportion C umulative
Variable C omp1 C omp2 Unexplained
C omp1 C omp2
C omp1 2.7799 1.5764 0.5560 0.5560
Trade_d 0.5835 0.0510 0.0505
Trade_d 0.9728 0.0559
T rade_d 0.238
C omp2 1.2035 0.2626 0.2407 0.7967
Productive_d 0.5758 0.1203 0.0611
Productive_d 0.9600 0.1319
Productive_d 0.236
C omp3 0.9409 0.8651 0.1882 0.9848
Macro_d 0.0860 0.6787 0.4251
Macro_d 0.1434 0.7445
Macro_d 0.144
C omp4 0.0758 0.0758 0.0152 1.0000
Infrastruc~d 0.5661 -0.2956 0.0041
Infrastruc~d 0.9438 -0.3243
Infras truc~d 0.250
C omp5 0.0000 . 0.0000 1.0000
Movement_d 0.0151 0.6595 0.4759
Movement_d 0.0252 0.7235
Movement_d 0.132

66 | P a g e
Weights assigned through PCA Table 45 Weights of indicators and dimensions for Africa and RECs
Weights by region Indicators Afric
a SADC
ECOWAS
CEN-SAD
COMESA
ECCAS
IGAD
EAC AMU
Tariff 0.249
0.165 0.220 0.285 0.256 0.320
0.277
0.000
0.236
Trade 0.144
0.292 0.274 0.286 0.267 0.295
0.220
0.434
0.257
Exports 0.221
0.268 0.272 0.181 0.227 0.304
0.224
0.345
0.253
Imports 0.224
0.276 0.234 0.248 0.250 0.081
0.279
0.222
0.253
ACFTA 0.161
0.000 0.000 0.000 0.000 0.000
0.000
0.000
0.000
Intermediates import 0.32
0 0.24
7 0.311 0.303 0.318 0.320 0.30
6 0.34
0 0.33
0 Intermediates export 0.31
8 0.40
7 0.384 0.287 0.315 0.322 0.40
7 0.32
9 0.34
0 TCI 0.36
2 0.34
6 0.305 0.409 0.367 0.358 0.28
6 0.33
1 0.33
0
Inflation 0.360
0.338 0.288 0.287 0.352 0.500
0.309
0.500
0.500
Currency 0.266
0.327 0.322 0.362 0.248 0.500
0.382
0.500
0.000
Investment 0.374
0.335 0.390 0.351 0.400 0.000
0.309
0.000
0.500
AfDB Infrastructure Index
0.500
0.500 0.500 0.500 0.500 0.500
0.500
0.500
0.500
Connections 0.500
0.500 0.500 0.500 0.500 0.500
0.500
0.500
0.500
Required Arrival 0.32
7 0.30
7 0.333 0.316 0.330 0.311 0.36
4 0.32
5 0.33
2 Protocol 0.32
8 0.35
4 0.333 0.319 0.385 0.309 0.39
3 0.34
3 0.33
3
Dimensions Weights by region

67 | P a g e
Trade 0.223
0.204 0.226 0.208 0.181 0.217
0.202
0.213
0.238
Productive 0.181
0.194 0.224 0.215 0.191 0.188
0.201
0.238
0.236
Macroeconomic 0.235
0.173 0.152 0.200 0.204 0.205
0.225
0.176
0.144
Infrastructural 0.213
0.194 0.199 0.177 0.202 0.197
0.196
0.217
0.250
Free Movement 0.148
0.235 0.200 0.200 0.221 0.194
0.175
0.156
0.132

68 | P a g e
Rankings using PCA weights vs Equal weights - African level Figure 6 Comparing rankings using PCA and equal weights
CountryPCA weights
Equal weights
Change in ranking
PCA weights
Equal weights
Change in ranking
PCA weights
Equal weights
Change in ranking
PCA weights
Equal weights
Change in ranking
PCA weights
Equal weights
Change in ranking
PCA weights
Equal weights
Change in ranking
South Africa 1 1 0 4 3 1 1 1 0 25 29 -4 1 1 0 45 45Kenya 2 2 0 18 13 5 7 7 0 38 38 0 8 8 0 10 10Rwanda 3 3 0 13 14 -1 33 33 0 4 2 2 23 23 0 6.5 6.5Mauritius 5 11 -6 33 35 -2 32 31 1 2 3 -1 6 6 0 29 25.5 3.Ghana 8 4 4 10 9 1 16 17 -1 40 33 7 18 18 0 8 8Togo 9 5 4 20 20 0 25 26 -1 18 15 3 31 31 0 6.5 6.5Morocco 4 13 -9 39 39 0 8 8 0 1 1 0 4 4 0 48 48Djibouti 10 6 4 12 15 -3 21 22 -1 39 42 -3 29 29 0 2 2Mauritania 13 7 6 29 27 2 51 51 0 7 6 1 42 42 0 4 4Senegal 7 8 -1 9 7 2 15 16 -1 9 9 0 20 20 0 14 14Mozambique 14 9 5 22 29 -7 14 13 1 43 41 2 36 36 0 5 5Egypt 6 15 -9 21 19 2 10 10 0 3 4 -1 2 2 0 47 47Uganda 15 10 5 15 12 3 18 18 0 42 44 -2 27 27 0 9 9Comoros 20 16 4 51 52 -1 39 40 -1 29 30 -1 25 25 0 2 2Zimbabwe 12 14 -2 5 5 0 17 15 2 33 36 -3 13 13 0 17 18 -Burkina Faso 16 17 -1 14 16 -2 27 25 2 6 7 -1 34 34 0 16 16.5 -0.Mali 18 20 -2 17 17 0 40 38 2 5 5 0 28 28 0 21 21Cabo Verde 22 21 1 43 43 0 41 43 -2 8 8 0 12 12 0 19 19Somalia 31 23 8 54 54 0 24 24 0 32 35 -3 52 52 0 2 2Seychelles 11 12 -1 32 34 -2 42 42 0 36 39 -3 3 3 0 12 12Côte d'Ivoire 17 22 -5 6 6 0 6 6 0 17 14 3 11 11 0 40 40Tunisia 24 26 -2 52 51 1 4 3 1 16 25 -9 5 5 0 39 39The Gambia 19 19 0 8 8 0 43 44 -1 12 10 2 26 26 0 20 20Gabon 23 24 -1 26 24 2 38 39 -1 11 11 0 16 16 0 33 32Rep. of the Congo 27 27 0 11 11 0 54 54 0 15 13 2 38 38 0 22 22Guinea-Bissau 35 30 5 46 46 0 31 32 -1 22 19 3 45 45 0 18 15Madagascar 37 31 6 38 40 -2 46 46 0 34 37 -3 39 39 0 12 12Namibia 25 28 -3 2 2 0 9 9 0 44 45 -1 21 21 0 46 46Guinea 33 32 1 27 25 2 47 47 0 26 26 0 41 41 0 23 23Sao Tome & Principe 26 25 1 24 22 2 12 14 -2 24 24 0 30 30 0 34.5 34.5Chad 32 33 -1 28 28 0 26 27 -1 23 21 2 51 51 0 26 27.5 -1.Lesotho 29 37 -8 3 4 -1 53 53 0 45 46 -1 46 46 0 25 25.5 -0.Niger 36 35 1 19 18 1 50 50 0 14 12 2 50 50 0 24 24Utd Rep. of Tanzania 28 29 -1 35 36 -1 20 19 1 27 28 -1 22 22 0 30 27.5 2.Benin 21 18 3 31 31 0 35 35 0 21 18 3 24 24 0 12 12Malawi 42 36 6 30 30 0 29 28 1 51 51 0 33 33 0 15 16.5 -1.Botswana 34 40 -6 7 10 -3 13 11 2 37 40 -3 19 19 0 43.5 43 0.Equatorial Guinea 30 34 -4 25 23 2 36 36 0 20 17 3 35 35 0 37 37Central African Rep. 45 41 4 47 47 0 30 30 0 28 27 1 47 47 0 27.5 29.5 -Zambia 41 39 2 16 26 -10 5 5 0 52 52 0 14 14 0 38 38Algeria 43 44 -1 50 49 1 23 21 2 13 22 -9 9 9 0 50.5 50.5Nigeria 38 38 0 34 33 1 2 2 0 35 31 4 15 15 0 41 41Libya 44 43 1 36 37 -1 34 34 0 41 34 7 7 7 0 54 54Eswatini 39 42 -3 1 1 0 48 48 0 48 48 0 40 40 0 43.5 43 0.Cameroon 46 46 0 48 48 0 11 12 -1 19 16 3 17 17 0 49 49Liberia 47 49 -2 45 45 0 22 23 -1 49 49 0 48 48 0 27.5 29.5 -Ethiopia 40 45 -5 23 21 2 52 52 0 10 20 -10 10 10 0 52 52D. Rep. of the Congo 48 47 1 42 41 1 45 41 4 46 43 3 43 43 0 32 32Angola 49 48 1 37 38 -1 3 4 -1 53 53 0 32 32 0 34.5 34.5Sudan 50 50 0 53 53 0 19 20 -1 47 47 0 37 37 0 36 36Sierra Leone 51 51 0 40 32 8 37 37 0 30 23 7 49 49 0 42 43 -Burundi 52 52 0 41 42 -1 44 45 -1 31 32 -1 44 44 0 50.5 50.5South Sudan 54 53 1 44 44 0 49 49 0 54 54 0 54 54 0 31 32 -Eritrea 53 54 -1 49 50 -1 28 29 -1 50 50 0 53 53 0 53 53

69 | P a g e
Figure 7 Comparing rankings using PCA and equal weights (ARII 18 variables)
Regional integration Trade integration Productive integration Macroeconomic integration Infrastructural integration Free movement of people
CountryPCA weights
Equal weights
Change in ranking
PCA weights
Equal weights
Change in ranking
PCA weights
Equal weights
Change in ranking
PCA weights
Equal weights
Change in ranking
PCA weights
Equal weights
Change in ranking
PCA weights
Equal weights
Change in ranking
Rwanda 1 2 -1 13 13 0 33 33 0 3 2 1 15 15 0 6.5 6.5South Africa 2 1 1 3 3 0 1 1 0 33 34 -1 1 1 0 45 45Ghana 3 3 0 8 8 0 16 17 -1 13 13 0 11 11 0 8 8Mozambique 4 5 -1 18 20 -2 14 13 1 20 20 0 16 16 0 5 5Kenya 5 4 1 15 12 3 7 7 0 40 40 0 4 4 0 10 10Togo 6 6 0 19 19 0 25 26 -1 27 26 1 13 12 1 6.5 6.5Mauritania 7 8 -1 22 22 0 51 51 0 8 8 0 48 48 0 4 4Djibouti 8 7 1 14 14 0 21 22 -1 48 48 0 40 40 0 2 2Burkina Faso 9 12 -3 29 29 0 27 25 2 10 10 0 18 18 0 13 14.5 -1.Mali 10 13 -3 16 15 1 40 38 2 6 6 0 17 17 0 19 19Uganda 11 10 1 12 11 1 18 18 0 44 44 0 39 39 0 9 9Zimbabwe 12 9 3 9 10 -1 17 15 2 43 43 0 10 9 1 15 16 -Senegal 13 14 -1 7 7 0 15 16 -1 17 16 1 35 35 0 12 12Egypt 14 11 3 20 18 2 10 10 0 2 3 -1 3 2 1 47 47Comoros 15 15 0 51 51 0 39 40 -1 38 38 0 38 37 1 2 2Rep. of the Congo 16 18 -2 10 9 1 54 54 0 19 19 0 19 19 0 20 20Mauritius 17 17 0 28 28 0 32 31 1 4 4 0 30 29 1 27 23.5 3.Guinea 18 19 -1 21 21 0 47 47 0 16 15 1 20 20 0 21 21Somalia 19 23 -4 54 54 0 24 24 0 41 41 0 52 52 0 2 2Gabon 20 21 -1 40 40 0 38 39 -1 18 17 1 6 5 1 29 30 -Morocco 21 20 1 32 33 -1 8 8 0 1 1 0 21 21 0 48 48Niger 22 26 -4 17 17 0 50 50 0 24 23 1 22 22 0 22 22Chad 23 24 -1 23 23 0 26 27 -1 32 31 1 26 26 0 24 25.5 -1.Côte d'Ivoire 24 16 8 5 5 0 6 6 0 25 25 0 7 8 -1 40 40Namibia 25 22 3 2 2 0 9 9 0 46 46 0 9 14 -5 46 46The Gambia 26 32 -6 25 25 0 43 44 -1 7 7 0 37 38 -1 18 18Botswana 27 25 2 6 6 0 13 11 2 45 45 0 2 3 -1 42.5 43 -0.Benin 28 27 1 26 26 0 35 35 0 30 29 1 14 13 1 36.5 36 0.Cabo Verde 29 29 0 41 41 0 41 43 -2 12 11 1 32 33 -1 17 17Central African Rep. 30 30 0 45 45 0 30 30 0 34 33 1 23 23 0 25.5 27.5 -Eswatini 31 28 3 1 1 0 48 48 0 51 51 0 5 7 -2 42.5 43 -0.Malawi 32 33 -1 24 24 0 29 28 1 37 37 0 43 43 0 14 14.5 -0.Lesotho 33 37 -4 4 4 0 53 53 0 49 49 0 44 46 -2 23 23.5 -0.Madagascar 34 34 0 34 34 0 46 46 0 39 39 0 47 47 0 11 11Guinea-Bissau 35 35 0 43 44 -1 31 32 -1 31 30 1 51 51 0 16 13Liberia 36 36 0 44 43 1 22 23 -1 52 52 0 24 24 0 25.5 27.5 -Nigeria 37 31 6 47 48 -1 2 2 0 15 14 1 12 10 2 41 41Sao Tome & Principe 38 38 0 38 38 0 12 14 -2 21 21 0 41 41 0 32.5 32.5Angola 39 39 0 31 32 -1 3 4 -1 42 42 0 42 42 0 32.5 32.5Utd Rep. of Tanzania 40 41 -1 49 49 0 20 19 1 26 32 -6 36 36 0 28 25.5 2.Seychelles 41 43 -2 27 27 0 42 42 0 47 47 0 27 27 0 36.5 36 0.D. Rep. of the Congo 42 45 -3 35 35 0 45 41 4 23 22 1 49 49 0 30 30Sierra Leone 43 44 -1 33 31 2 37 37 0 9 9 0 25 25 0 44 43Zambia 44 40 4 11 16 -5 5 5 0 50 50 0 34 34 0 38 38Equatorial Guinea 45 47 -2 39 39 0 36 36 0 29 28 1 45 44 1 35 36 -Tunisia 46 42 4 50 50 0 4 3 1 22 24 -2 28 28 0 39 39Ethiopia 47 46 1 37 37 0 52 52 0 11 12 -1 8 6 2 52 52Libya 48 48 0 30 30 0 34 34 0 5 5 0 29 30 -1 54 54Sudan 49 49 0 53 52 1 19 20 -1 35 35 0 46 45 1 34 34Algeria 50 50 0 48 47 1 23 21 2 14 18 -4 31 31 0 50.5 50.5Cameroon 51 51 0 46 46 0 11 12 -1 28 27 1 33 32 1 49 49Burundi 52 52 0 36 36 0 44 45 -1 36 36 0 50 50 0 50.5 50.5South Sudan 53 53 0 42 42 0 49 49 0 54 54 0 54 54 0 31 30Eritrea 54 54 0 52 53 -1 28 29 -1 53 53 0 53 53 0 53 53

70 | P a g e
Figure 8 Statistical test comparing rankings using PCA and equal weights
Prob > |z| = 0.0000 (continuity corrected)Test of Ho: rMovement_d_eq and rMovement_d are independent
SE of score = 133.915 (corrected for ties)Kendall's score = 1396Kendall's tau-b = 0.9859Kendall's tau-a = 0.9755 Number of obs = 54
. ktau rMovement_d_eq rMovement_d
Prob > |z| = 0.0000 (continuity corrected)Test of Ho: rInfrastructure_d_eq and rInfrastructure_d are independent
SE of score = 134.041Kendall's score = 1431Kendall's tau-b = 1.0000Kendall's tau-a = 1.0000 Number of obs = 54
. ktau rInfrastructure_d_eq rInfrastructure_d
Prob > |z| = 0.0000 (continuity corrected)Test of Ho: rMacro_d_eq and rMacro_d are independent
SE of score = 134.041Kendall's score = 1297Kendall's tau-b = 0.9064Kendall's tau-a = 0.9064 Number of obs = 54
. ktau rMacro_d_eq rMacro_d
Prob > |z| = 0.0000 (continuity corrected)Test of Ho: rProductive_d_eq and rProductive_d are independent
SE of score = 134.041Kendall's score = 1391Kendall's tau-b = 0.9720Kendall's tau-a = 0.9720 Number of obs = 54
. ktau rProductive_d_eq rProductive_d
Prob > |z| = 0.0000 (continuity corrected)Test of Ho: rTrade_d_eq and rTrade_d are independent
SE of score = 134.041Kendall's score = 1339Kendall's tau-b = 0.9357Kendall's tau-a = 0.9357 Number of obs = 54
. ktau rTrade_d_eq rTrade_d
Prob > |z| = 0.0000 (continuity corrected)Test of Ho: rI_eq and rI are independent
SE of score = 134.041Kendall's score = 1239Kendall's tau-b = 0.8658Kendall's tau-a = 0.8658 Number of obs = 54
. ktau rI_eq rI

71 | P a g e
References AfDB. (2016). The Africa Infrastructure Development Index 2016. Retrieved from African Development
Bank website: http://www.afdb.org/fileadmin/uploads/afdb/Documents/Publications/
Economic_Brief_-_The_Africa_Infrastructure_Development_Index.pdf
AFRAA. (2018). AFRAA – African Airlines Associations. Retrieved 31 May 2019, from http://afraa.org/
African Union. (2019). African Union. Retrieved 31 May 2019, from https://au.int/en
ARII. (2016). Africa Regional Integration Index - Report 2016. Retrieved from UNECA, AfDB, AUC website:
https://www.uneca.org/publications/africa-regional-integration-index-report-2016
Cattell, R. B. (1966). The scree test for the number of factors. Multivariate Behavioral Research, 1(2),
245–276. https://doi.org/10.1207/s15327906mbr0102_10
Giri, N. C. (1996). Multivariate statistical analysis. M. Dekker.
Gu, F., Greensmith, J., Oates, R., & Aickelin, U. (2009). PCA 4 DCA: The Application of Principal
Component Analysis to the Dendritic Cell Algorithm (SSRN Scholarly Paper No. ID 2830357).
Retrieved from Social Science Research Network website:
https://papers.ssrn.com/abstract=2830357
Gygli, S., Haelg, F., & Sturm, J.-E. (2018). The KOF Globalisation Index – Revisited [Working Paper].
https://doi.org/10.3929/ethz-b-000238666
Huh, H., & Park, C.-Y. (2017). Asia-Pacific Regional Integration Index: Construction, Interpretation, and
Comparison. http://dx.doi.org/10.22617/WPS178772-2
International Monetary Fund. (2018, April). World Economic Outlook Database. Retrieved 31 May 2019,
from https://www.imf.org/external/pubs/ft/weo/2018/01/weodata/index.aspx
International Trade Centre. (2018). Market Access Map - Improving transparency in international trade
and market access. Retrieved from

72 | P a g e
https://www.macmap.org/Default.aspx?ReturnUrl=%2fAdvancedSearch%2fTariffAndTrade%2fD
efault.aspx
Jolliffe, I. T. (2002). Principal Component Analysis (2nd ed.). Retrieved from
//www.springer.com/gp/book/9780387954424
Kaiser, H. F. (1960). The application of electronic computers to factor analysis. Educational and
Psychological Measurement, 20(1), 141–151.
König, J. (2015). The EU Index of Integration Effort. UNU-CRIS. Retrieved from http://cris.unu.edu/eu-
index-integration-effort
Michaely, M. (1996). Trade preferential agreements in Latin America: an ex-ante assessment. Policy
Research Working Paper 1583, The World Bank.
Nardo, M., Saisana, M., Saltelli, A., Tarantola, S., Hoffman, A., & Giovannini, E. (2005). Handbook on
Constructing Composite Indicators. https://doi.org/10.1787/533411815016
Peres-Neto, P. R., Jackson, D. A., & Somers, K. M. (2005). How many principal components? Stopping
rules for determining the number of non-trivial axes revisited. Computational Statistics & Data
Analysis, 49(4), 974–997.
UN COMTRADE. (2018). United Nations Statistics Division - Commodity Trade Statistics Database
(COMTRADE). Retrieved 31 May 2019, from https://comtrade.un.org/db/default.aspx

73 | P a g e
Annex: Evolution in the choice of variables and dimensions There were six dimensions proposed in the initial version of ARII 2019. In addition to the five dimensions that make up the final ARII 2019, there was also a social dimension that included 3 variables: mean years of schooling, gender equality and net migration within RECs. The inclusion of a social dimension was motivated by consultative meetings at the conceptual phase of the integration index: the rationale behind a social dimension is that for regional integration to be successful, favourable social arrangements have to be in place. The dimension was included, and results disseminated for initial validation. However, the dimension was subsequently removed as the variables in this dimension lack a regional component. The rationale behind each dimension is well-documented in the ARII report and not reproduced here. Only changes that were made in the construction of the index are briefly outlined. The variable AfCFTA was added to the trade dimension in the course of the making of ARII. The establishment of a free trade area is a stepping-stone in the advancement of regional integration. A country’s adherence to this agreement is an important signal to stakeholders as to its economic future. Although, constantly changing, the variable was included and updated numerous times as more countries ratified the agreement. The infrastructural dimension went through several changes. The variable net electricity trade (source from the Africa Energy Commission report) was initially included but a robust sensitivity analysis recommended its removal in order to improve the overall validity of the dimension. The cost of mobile roaming was also included in initial computations of the infrastructural dimension. Such a variable is highly significant for regional integration; modernization of African economies but removed because of the low quality of the data and its incompleteness. The variable Single African Air Transport Market is an initiative aiming at opening the African skies and there are currently 28 countries that signed the agreement. It was initially included but failed to pass the statistical tests. This is comprehensible as what really matters for integration is the implementation of such an agreement.

74 | P a g e
Disclaimer This Methodological Note has been prepared to accompany the ARII 2019 report and to explain the methodology used and to facilitate the interpretation of the empirical results obtained. The interpretations of the results and findings expressed herein are those of the author and do not necessarily reflect the views of the United Nations Economic Commission for Africa and its partners. Nor do they represent opinions of its officials or member States. The designation employed and the presentation of material on any graphs in this work do not imply the expression of any opinion whatsoever on the part of the United Nations concerning the legal status or name of any country, territory, city or area or of its authorities, or concerning the delimitation of its frontiers or boundaries. However, care has been taken to update such information to reflect the current state of affairs.
S. B. Sufrauj for ECA team
Top Related