


Languages
Pages
Legal

Affinity DiagramsOrganizing Ideas Into Common Themes
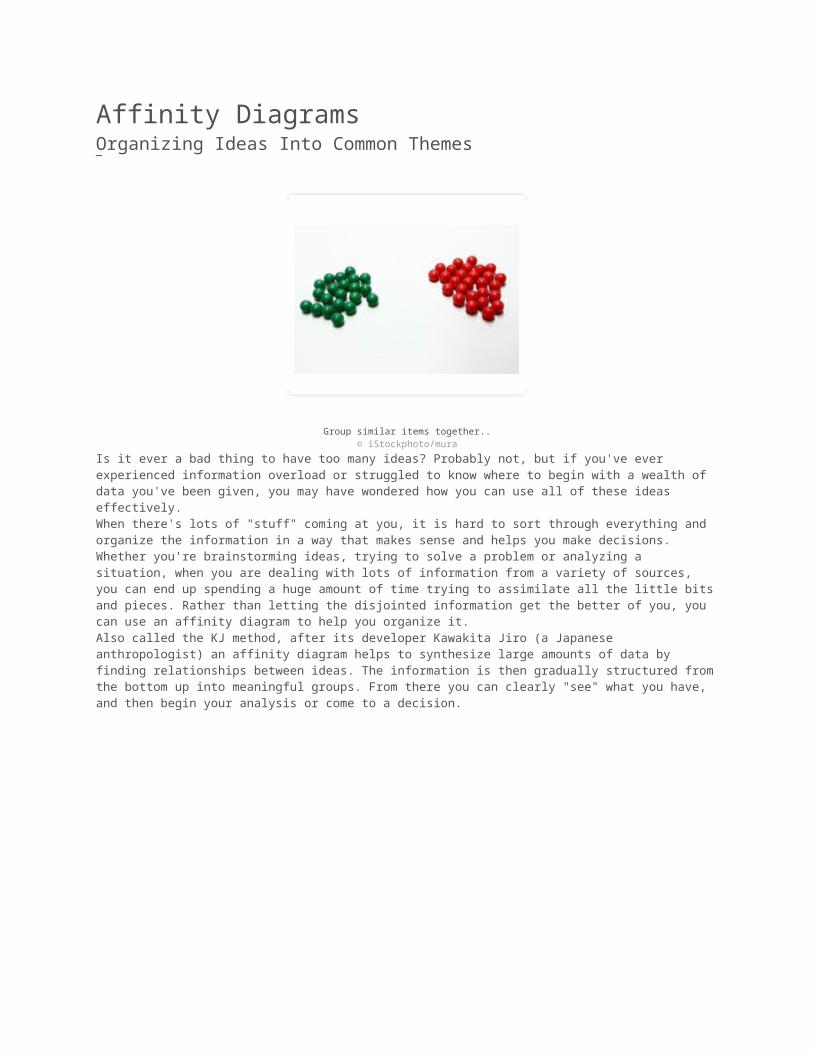
Group similar items together..© iStockphoto/mura
Is it ever a bad thing to have too many ideas? Probably not, but if you've ever experienced information overload or struggled to know where to begin with a wealth of data you've been given, you may have wondered how you can use all of these ideas effectively.When there's lots of "stuff" coming at you, it is hard to sort through everything and organize the information in a way that makes sense and helps you make decisions. Whether you're brainstorming ideas, trying to solve a problem or analyzing a situation, when you are dealing with lots of information from a variety of sources, you can end up spending a huge amount of time trying to assimilate all the little bits and pieces. Rather than letting the disjointed information get the better of you, you can use an affinity diagram to help you organize it.Also called the KJ method, after its developer Kawakita Jiro (a Japanese anthropologist) an affinity diagram helps to synthesize large amounts of data by finding relationships between ideas. The information is then gradually structured from the bottom up into meaningful groups. From there you can clearly "see" what you have, and then begin your analysis or come to a decision.
Affinity diagrams can be used to: Draw out common themes from a large amount of information
Discover previously unseen connections between various ideas or information
Brainstorm root causes and solutions to a problem
Because many decision-making exercises begin with brainstorming, this is one of the most common applications of affinity diagrams. After a brainstorming session there are usually pages of ideas. These won't have been censored or
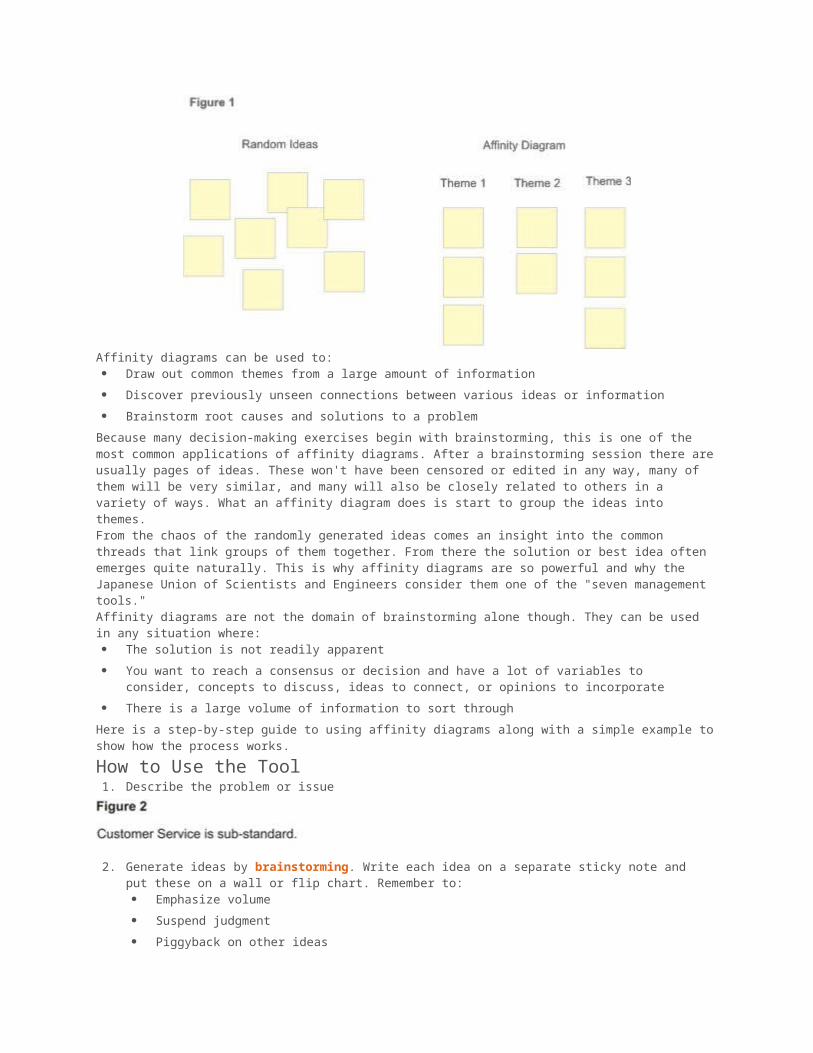
edited in any way, many of them will be very similar, and many will also be closely related to others in a variety of ways. What an affinity diagram does is start to group the ideas into themes.From the chaos of the randomly generated ideas comes an insight into the common threads that link groups of them together. From there the solution or best idea often emerges quite naturally. This is why affinity diagrams are so powerful and why the Japanese Union of Scientists and Engineers consider them one of the "seven management tools."Affinity diagrams are not the domain of brainstorming alone though. They can be used in any situation where: The solution is not readily apparent
You want to reach a consensus or decision and have a lot of variables to consider, concepts to discuss, ideas to connect, or opinions to incorporate
There is a large volume of information to sort through
Here is a step-by-step guide to using affinity diagrams along with a simple example to show how the process works.
How to Use the Tool1. Describe the problem or issue
2. Generate ideas by brainstorming. Write each idea on a separate sticky note and put these on a wall or flip chart. Remember to: Emphasize volume
Suspend judgment
Piggyback on other ideas
3. Sort ideas into natural themes by asking: What ideas are similar?
Is this idea connected to any of the others?
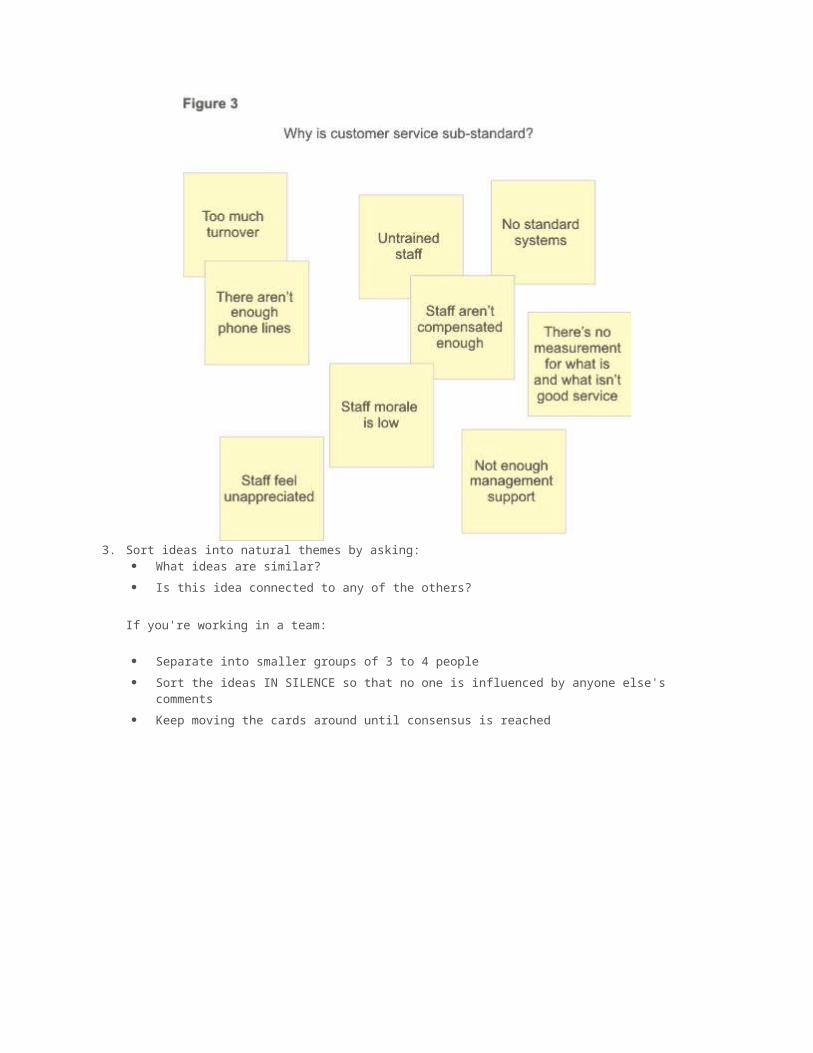
If you're working in a team:
Separate into smaller groups of 3 to 4 people
Sort the ideas IN SILENCE so that no one is influenced by anyone else's comments
Keep moving the cards around until consensus is reached
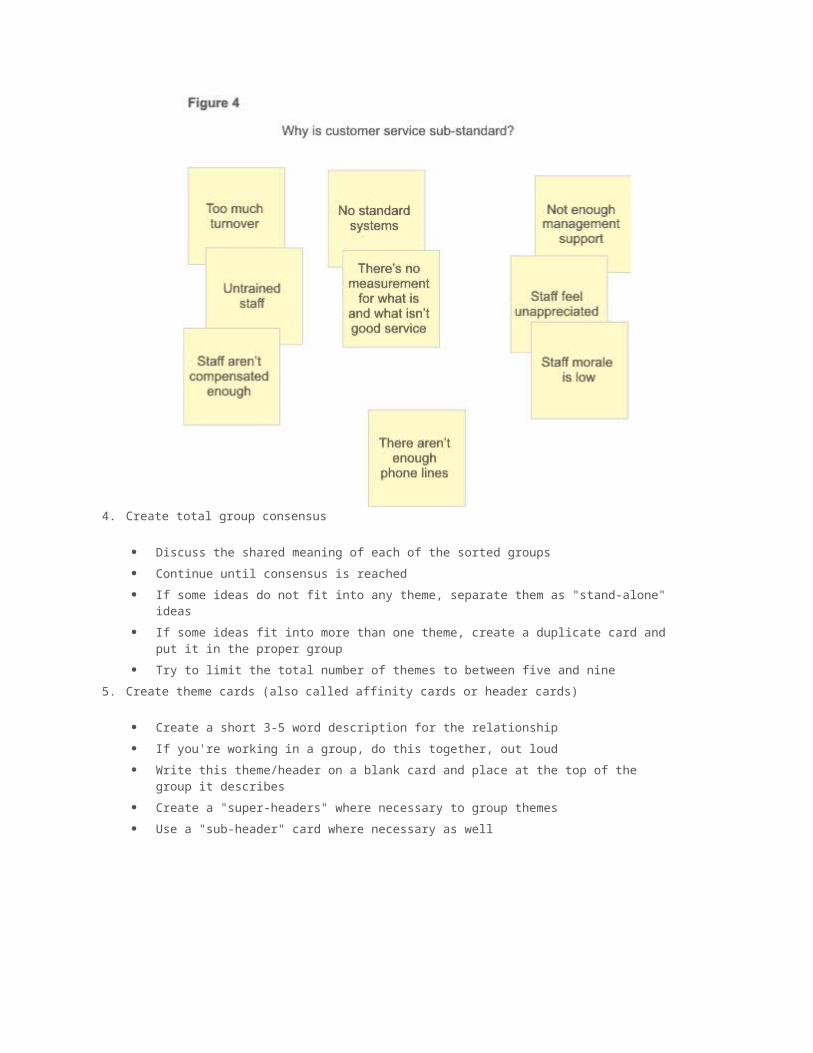
4. Create total group consensus
Discuss the shared meaning of each of the sorted groups
Continue until consensus is reached
If some ideas do not fit into any theme, separate them as "stand-alone" ideas
If some ideas fit into more than one theme, create a duplicate card and put it in the proper group
Try to limit the total number of themes to between five and nine
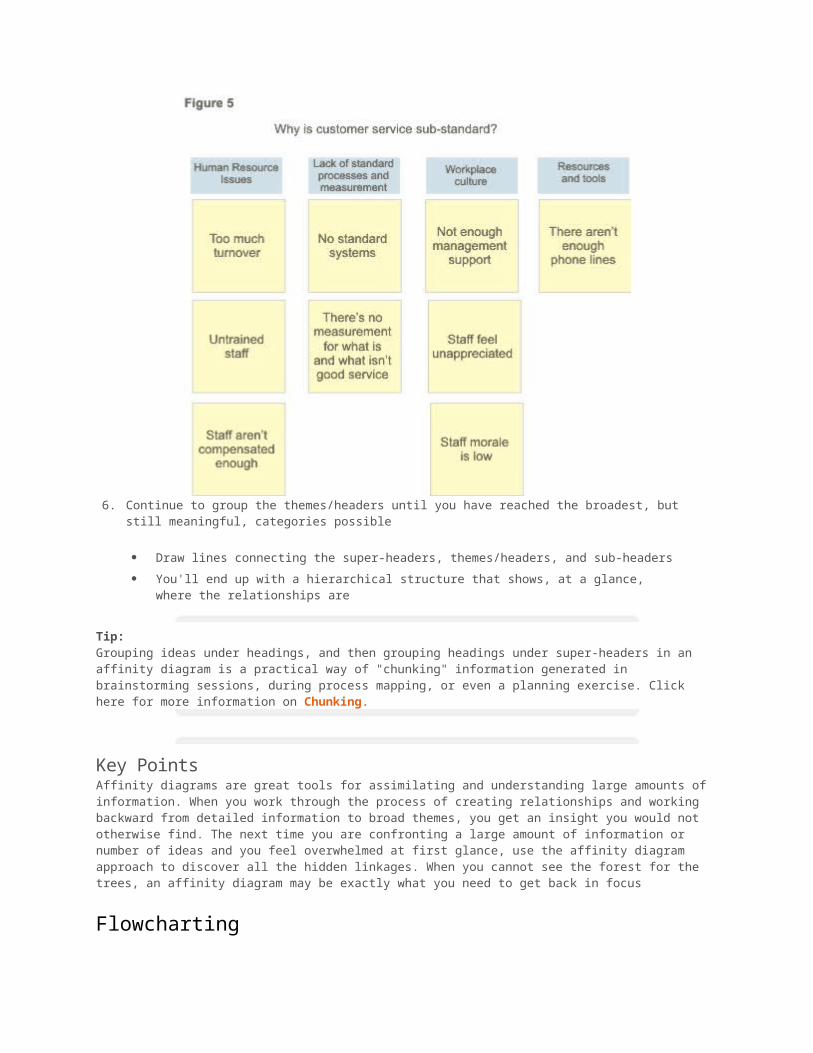
5. Create theme cards (also called affinity cards or header cards)
Create a short 3-5 word description for the relationship
If you're working in a group, do this together, out loud
Write this theme/header on a blank card and place at the top of the group it describes
Create a "super-headers" where necessary to group themes
Use a "sub-header" card where necessary as well
6. Continue to group the themes/headers until you have reached the broadest, but still meaningful, categories possible
Draw lines connecting the super-headers, themes/headers, and sub-headers
You'll end up with a hierarchical structure that shows, at a glance, where the relationships are
Tip: Grouping ideas under headings, and then grouping headings under super-headers in an affinity diagram is a practical way of "chunking" information generated in brainstorming sessions, during process mapping, or even a planning exercise. Click here for more information on Chunking.
Key PointsAffinity diagrams are great tools for assimilating and understanding large amounts of information. When you work through the process of creating relationships and working backward from detailed information to broad themes, you get an insight you would not otherwise find. The next time you are confronting a large amount of information or number of ideas and you feel overwhelmed at first glance, use the affinity diagram approach to discover all the hidden linkages. When you cannot see the forest for the trees, an affinity diagram may be exactly what you need to get back in focus
Flowcharting
Flowcharts are maps or graphical representations of a process. Steps in a process are shown with symbolic shapes, and the flow of the process is indicated with arrows connecting the symbols. Computer programmers popularized flowcharts in the 1960's, using them to map the logic of programs. In quality improvement work, flowcharts are
particularly useful for displaying how a process currently functions or could ideally function. Flowcharts can help you see whether the steps of a process are logical, uncover problems or miscommunications, define the boundaries of a process, and develop a common base of knowledge about a process. Flowcharting a process often brings to light redundancies, delays, dead ends, and indirect paths that would otherwise remain unnoticed or ignored. But flowcharts don't work if they aren't accurate, if team members are afraid to describe what actually happens, or if the team is too far removed from the actual workings of the process.
There are many varieties of flowcharts and scores of symbols that you can use. Experience has shown that there are three main types that work for almost all situations:
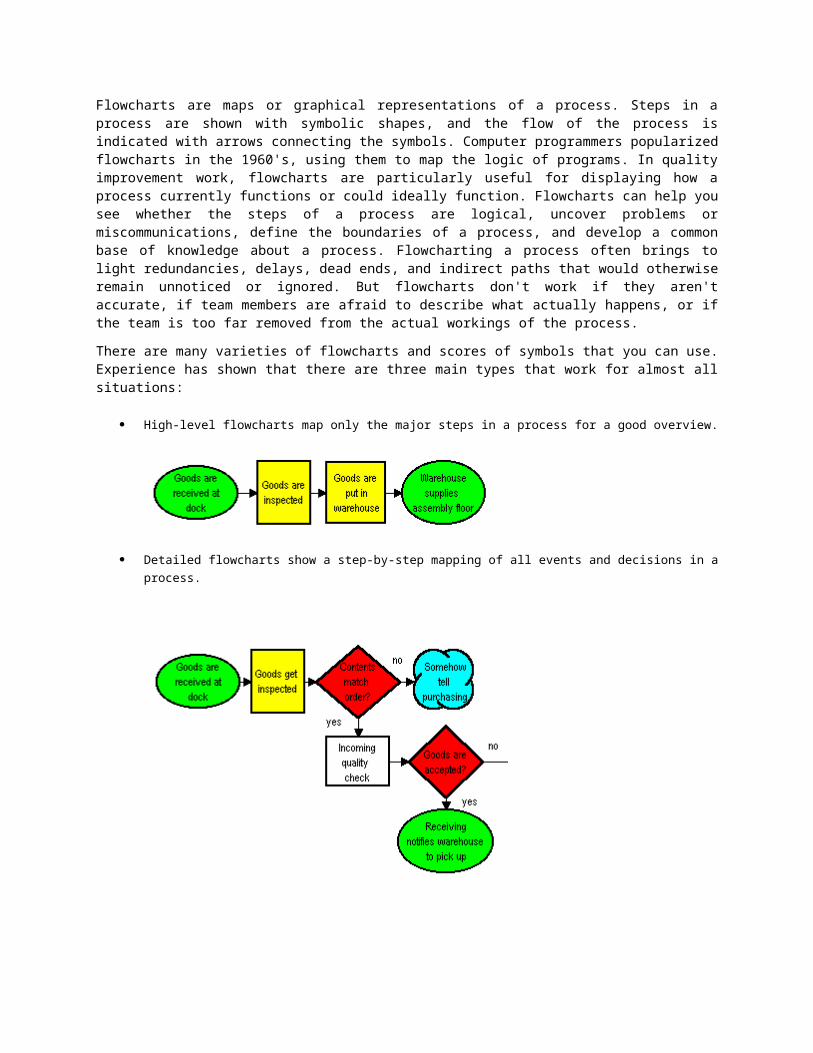
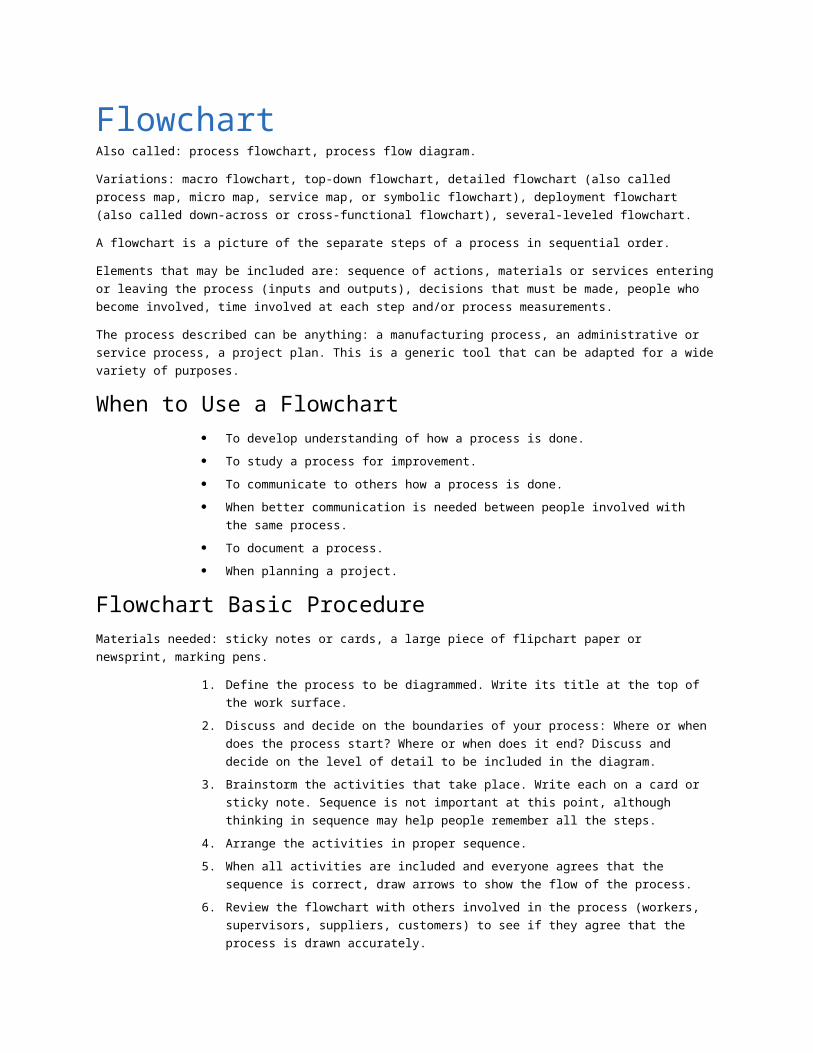
High-level flowcharts map only the major steps in a process for a good overview.
Detailed flowcharts show a step-by-step mapping of all events and decisions in a process.
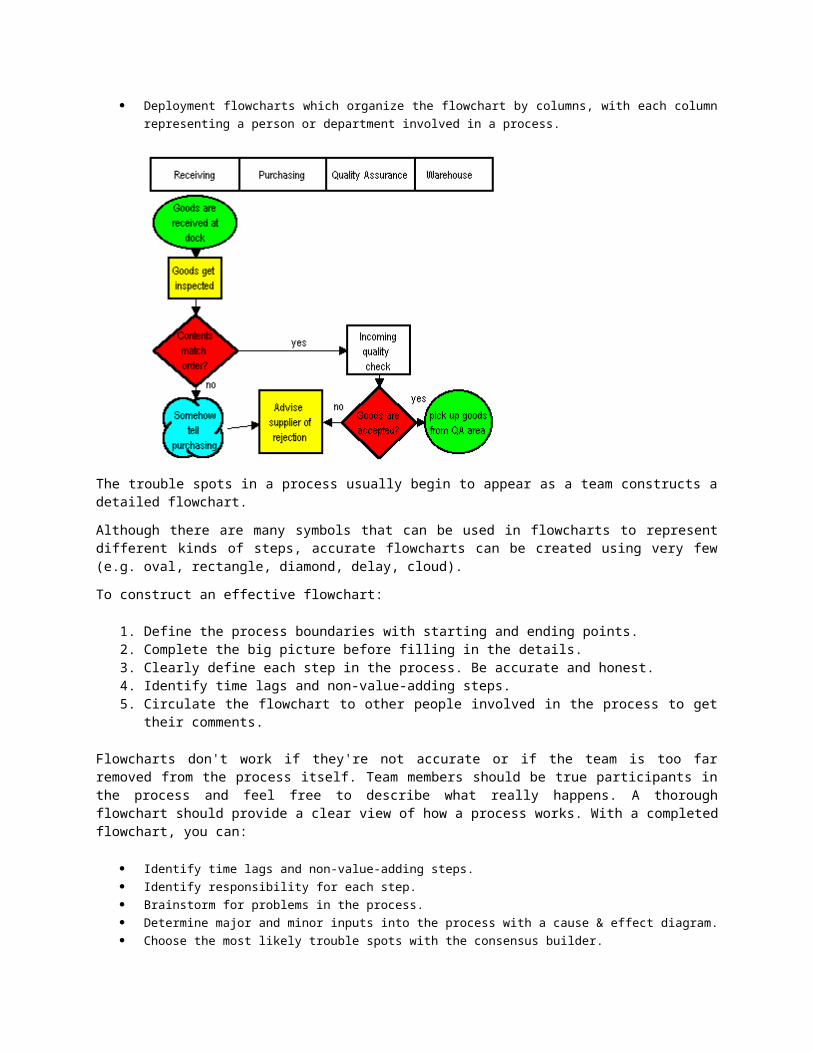
Deployment flowcharts which organize the flowchart by columns, with each column
representing a person or department involved in a process.
The trouble spots in a process usually begin to appear as a team constructs a detailed flowchart.
Although there are many symbols that can be used in flowcharts to represent different kinds of steps, accurate flowcharts can be created using very few (e.g. oval, rectangle, diamond, delay, cloud).
To construct an effective flowchart:
1. Define the process boundaries with starting and ending points.2. Complete the big picture before filling in the details.3. Clearly define each step in the process. Be accurate and honest.4. Identify time lags and non-value-adding steps.5. Circulate the flowchart to other people involved in the process to get their
comments.
Flowcharts don't work if they're not accurate or if the team is too far removed from the process itself. Team members should be true participants in the process and feel free to describe what really happens. A thorough flowchart should provide a clear view of how a process works. With a completed flowchart, you can:
Identify time lags and non-value-adding steps.
Identify responsibility for each step.
Brainstorm for problems in the process.
Determine major and minor inputs into the process with a cause & effect diagram.
Choose the most likely trouble spots with the consensus builder.
FlowchartAlso called: process flowchart, process flow diagram.
Variations: macro flowchart, top-down flowchart, detailed flowchart (also called process map, micro map, service
map, or symbolic flowchart), deployment flowchart (also called down-across or cross-functional flowchart), several-
leveled flowchart.
A flowchart is a picture of the separate steps of a process in sequential order.
Elements that may be included are: sequence of actions, materials or services entering or leaving the process (inputs
and outputs), decisions that must be made, people who become involved, time involved at each step and/or process
measurements.
The process described can be anything: a manufacturing process, an administrative or service process, a project
plan. This is a generic tool that can be adapted for a wide variety of purposes.
When to Use a Flowchart To develop understanding of how a process is done.
To study a process for improvement.
To communicate to others how a process is done.
When better communication is needed between people involved with the same process.
To document a process.
When planning a project.
Flowchart Basic ProcedureMaterials needed: sticky notes or cards, a large piece of flipchart paper or newsprint, marking pens.
1. Define the process to be diagrammed. Write its title at the top of the work surface.
2. Discuss and decide on the boundaries of your process: Where or when does the process
start? Where or when does it end? Discuss and decide on the level of detail to be included
in the diagram.
3. Brainstorm the activities that take place. Write each on a card or sticky note. Sequence is
not important at this point, although thinking in sequence may help people remember all
the steps.
4. Arrange the activities in proper sequence.
5. When all activities are included and everyone agrees that the sequence is correct, draw
arrows to show the flow of the process.
6. Review the flowchart with others involved in the process (workers, supervisors, suppliers,
customers) to see if they agree that the process is drawn accurately.
Flowchart Considerations Don’t worry too much about drawing the flowchart the “right way.” The right way is the way
that helps those involved understand the process.
Identify and involve in the flowcharting process all key people involved with the process.
This includes those who do the work in the process: suppliers, customers and supervisors.
Involve them in the actual flowcharting sessions by interviewing them before the sessions
and/or by showing them the developing flowchart between work sessions and obtaining
their feedback.
Do not assign a “technical expert” to draw the flowchart. People who actually perform the
process should do it.
Computer software is available for drawing flowcharts. Software is useful for drawing a
neat final diagram, but the method given here works better for the messy initial stages of
creating the flowchart.
Excerpted from Nancy R. Tague’s The Quality Toolbox, Second Edition, ASQ Quality Press, 2004, pages 255–257.
Flowchart Examples
High–Level Flowchart for an Order-Filling Process
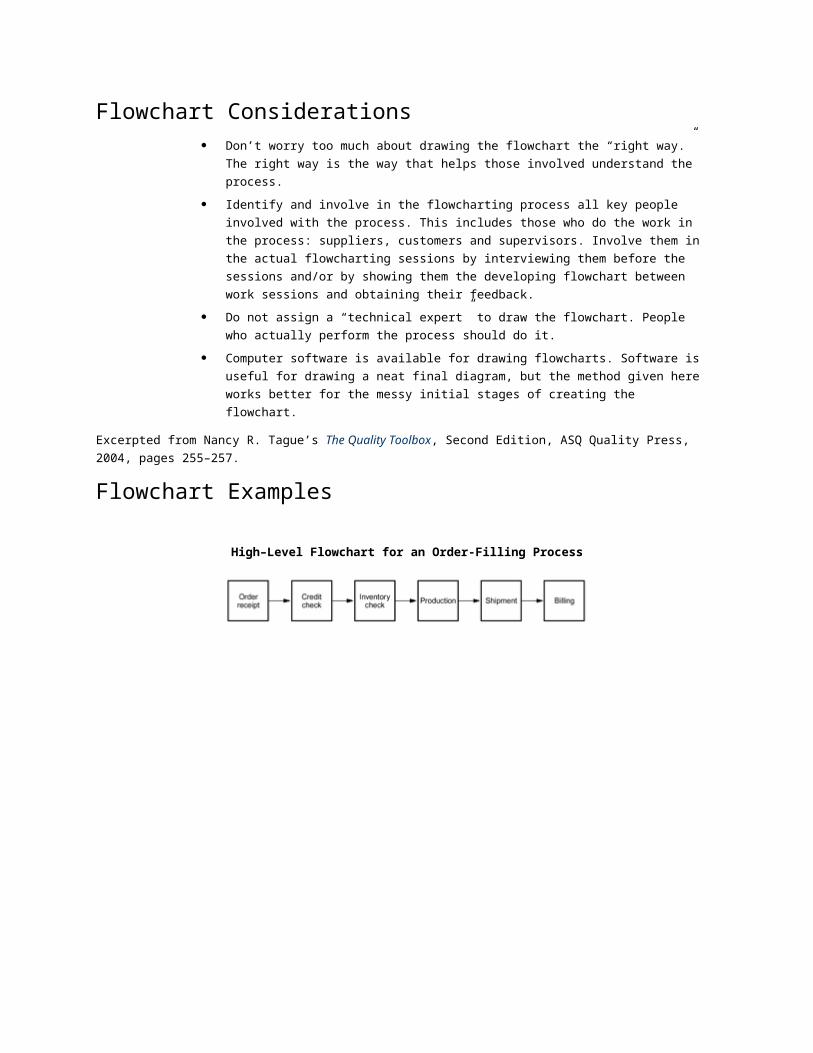
Detailed Flowchart
Commonly Used Symbols in Detailed Flowcharts
One step in the process; the step is written inside the box. Usually, only one arrow goes out of the box.
Direction of flow from one step or decision to another.
Decision based on a question. The question is written in the diamond. More than one arrow goes out of
the diamond, each one showing the direction the process takes for a given answer to the question. (Often the
answers are “ yes” and “ no.”)
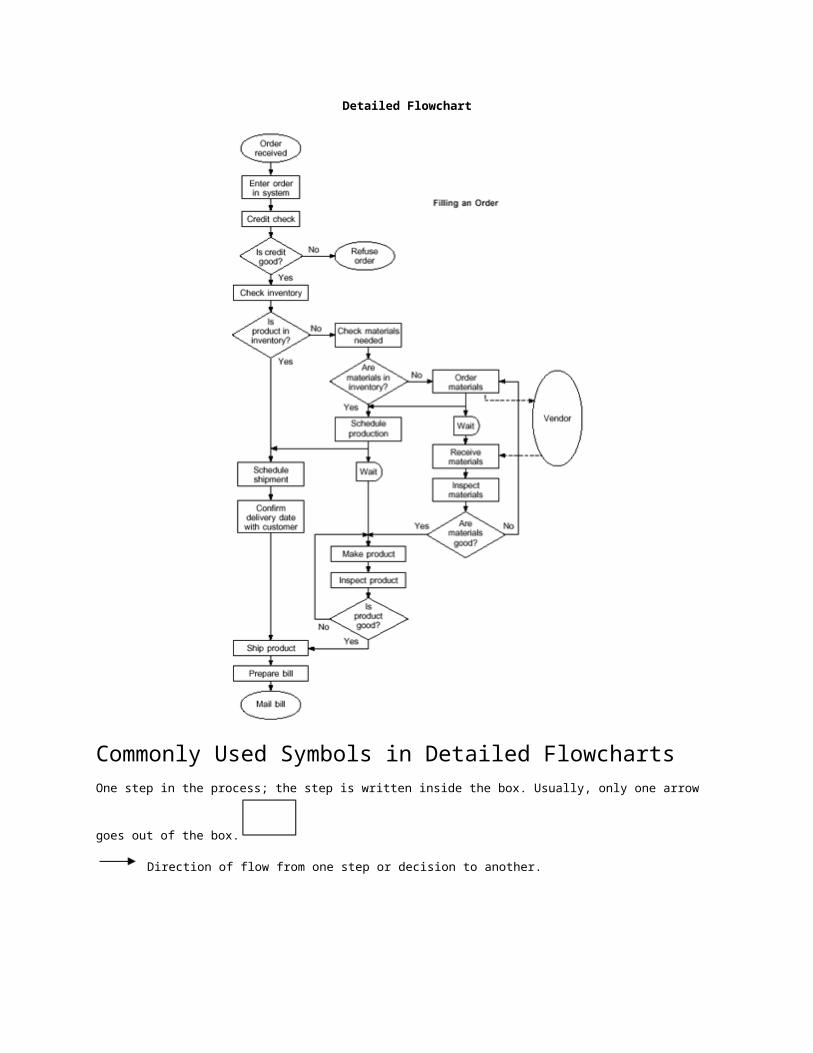
Delay or wait
Link to another page or another flowchart. The same symbol on the other page indicates that the flow
continues there.
Input or output
Document
Alternate symbols for start and end points
Basic Tools for Process Improvement
DECISION-MAKING TOOLS 17
NOMINAL GROUP
TECHNIQUEBasic Tools for Process Improvement
18 DECISION-MAKING TOOLS
What Is Nominal Group Technique?
Nominal Group Technique, or NGT, is a weighted ranking method that enables a
group to generate and prioritize a large number of issues within a structure that gives
everyone an equal voice (Viewgraph 12). The tool is called nominal because there is
limited interaction between members of the group during the NGT process.
When should a team use NGT?
When a team needs to create a list of options and rank them, using NGT effectively
neutralizes the domination of the loudest person, or the person with the most
authority, over the decision-making process. This tool can also help a team achieve
consensus about the relative importance of issues. The final result may not be
everyone's first priority, but they can live with it.
NGT is a good tool to use when dealing with controversial or emotional issues, or
when a group is stuck. It is particularly useful when you need to (Viewgraph 13)
! Reduce the number of issues for easier handling.
! Get input from all team members.
! Rank items in priority order.DECISION-MAKING TOOLS VIEWGRAPH 13
Benefits of Using NGT
• Reduces the number of issues
• All team members participate
• Rank orders items
DECISION-MAKING TOOLS VIEWGRAPH 12
What Is Nominal Group Technique?
A weighted ranking method that allows a
group to generate and prioritize a large
number of issues within a structure that
gives everyone an equal voice.
Basic Tools for Process Improvement
DECISION-MAKING TOOLS 19Basic Tools for Process Improvement
20 DECISION-MAKING TOOLS
What are the procedures for NGT?
NGT is a facilitated process that has two parts. The following description of how to
conduct an NGT session is adapted from The Team Handbook [Ref. 4]:
NGT PART I - The issue is defined and the team generates ideas (Viewgraph
14).
! Introduce and clarify the issue to be addressed by the team. Write the
issue on a chartpack where everybody can see it. Allow for clarification, but
do not let the group engage in a discussion of the issue itself. Remember to
define unclear terms.
! Generate ideas to address the issue at hand.
> Working in silence, each team member writes down his or her ideas on a
piece of paper. People should not confer with each other and should sit
quietly until everyone finishes writing.
> Depending on the complexity of the topic, 5 to 10 minutes should be
allowed for the silent process. People need to have enough time to get the
broad, general ideas down, but not enough to create long, detailed lists.
! Collect the team's ideas. Each team member in turn reads out one of his or
her ideas. Write each idea on the chartpack. This round robin should
continue until all of the ideas have been offered and recorded. There should
be no discussion or side conversations during this part of the session.
NOTE: If post-its are available, you may want to ask the participants to write TM
each of their ideas on a separate sheet and hand them in. You can display the
ideas randomly, rather than writing them down. These post-its can be used TM
later to create an Affinity Diagram.
! Clarify ideas. Read each idea out loud. If clarification is needed, the person
who provided the idea should explain it now. This is an opportunity to clean up
the wording of any unclear statements. Others may contribute if necessary.
! Combine ideas. Combine like ideas when feasible, but only if both
originators agree to it. If they cannot agree, leave the two ideas separate.DECISION-MAKING TOOLS VIEWGRAPH 14
NGT Part I - Define the Issue and
Generate Ideas
• Define the issue
• Generate ideas
• Collect ideas
• Clarify ideas
• Combine ideas
Basic Tools for Process Improvement
DECISION-MAKING TOOLS 21Basic Tools for Process Improvement
22 DECISION-MAKING TOOLS
NGT PART II - The team makes the selection (Viewgraph 15).
! Assign a letter designation to each separate idea. As with Multivoting,
the facilitator assigns a letter to avoid confusion with the vote tally.
! Rank the ideas independently. Each team member writes down the items
by their letter designations and assigns them a numeric value based on his or
her judgment of what is most important and what is least important. The
highest number is assigned to the most important idea and the lowest to the
least important idea. For example, if there are 8 items lettered A to H, the
most important receives an 8 and the least important, a 1.
NOTE: An alternative approach is to use the one-half-plus-one rule
described in The Memory Jogger [Ref. 1, p. 71]. When there is a list with
many items to rank, you may want to limit the number of items to consider.
Team members then rank one-half the number of items on the list plus one.
For example, if there were 20 items on the list, team members would rank 11
ideas. The most important item receives the highest value—in this case, 11.
! Collate the rankings. The facilitator transcribes the team members'
rankings onto a chartpack, writing each number next to the corresponding
idea.
! Add the rankings. The facilitator adds the numbers across. The idea with
the highest point total is the one of most importance to the whole team. It is
the highest priority item.
! Rewrite the list. The facilitator rewrites the list of ideas in the order of their
importance to the team.
! Perform a sanity check. Does the prioritization make sense?DECISION-MAKING TOOLS VIEWGRAPH 15
NGT Part II - Make the Selection
• Assign letters to ideas
• Rank ideas independently
• Collate the rankings
• Add the rankings
• Rewrite the list in priority order
• Perform a sanity check
Basic Tools for Process Improvement
DECISION-MAKING TOOLS 23Basic Tools for Process Improvement
24 DECISION-MAKING TOOLS
Can we see some examples of how NGT works?
Let's look at some examples to illustrate this process.
NGT EXAMPLE 1: A team is struggling with some problems in the workplace. The
members performed NGT Part I which identified the following issues:
A. Ineffective organizational structure
B. Poor communications outside the office
C. Lack of training
D. Poor communications within the office
E. Unclear mission and objectives

F. Poor distribution of office mail
G. Lack of feedback on reports to management
The team has some opinionated members who think they know the most important
problem. Several team members, however, are not vocalizing their position. You
decide to use NGT Part II to prioritize the issues.
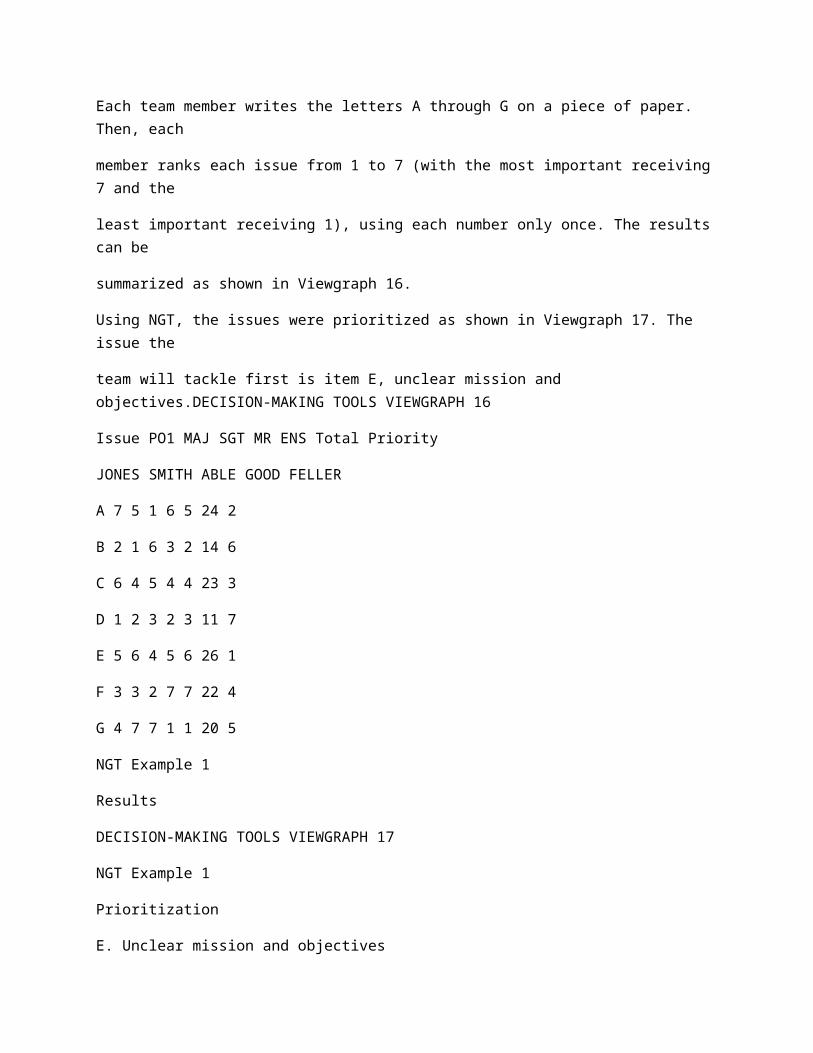
Each team member writes the letters A through G on a piece of paper. Then, each
member ranks each issue from 1 to 7 (with the most important receiving 7 and the
least important receiving 1), using each number only once. The results can be
summarized as shown in Viewgraph 16.
Using NGT, the issues were prioritized as shown in Viewgraph 17. The issue the
team will tackle first is item E, unclear mission and objectives.DECISION-MAKING TOOLS VIEWGRAPH 16
Issue PO1 MAJ SGT MR ENS Total Priority
JONES SMITH ABLE GOOD FELLER
A 7 5 1 6 5 24 2
B 2 1 6 3 2 14 6
C 6 4 5 4 4 23 3
D 1 2 3 2 3 11 7
E 5 6 4 5 6 26 1
F 3 3 2 7 7 22 4
G 4 7 7 1 1 20 5
NGT Example 1
Results
DECISION-MAKING TOOLS VIEWGRAPH 17
NGT Example 1
Prioritization
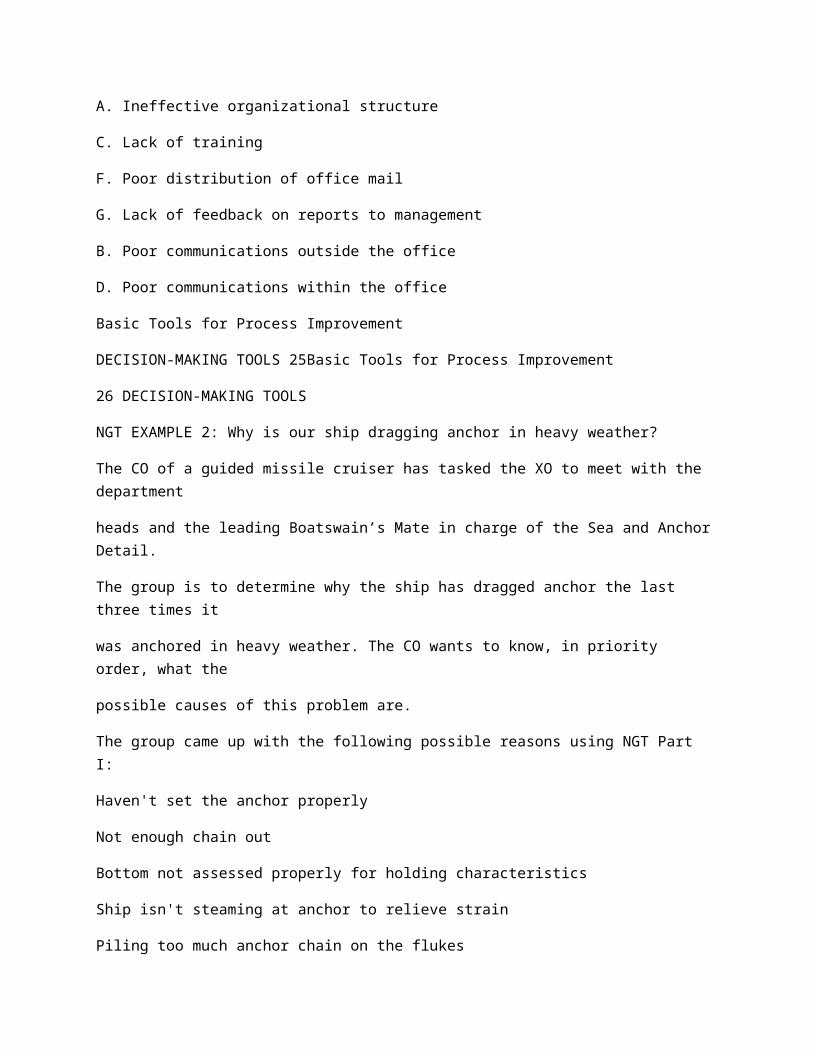
E. Unclear mission and objectives
A. Ineffective organizational structure
C. Lack of training
F. Poor distribution of office mail
G. Lack of feedback on reports to management
B. Poor communications outside the office
D. Poor communications within the office
Basic Tools for Process Improvement
DECISION-MAKING TOOLS 25Basic Tools for Process Improvement
26 DECISION-MAKING TOOLS
NGT EXAMPLE 2: Why is our ship dragging anchor in heavy weather?
The CO of a guided missile cruiser has tasked the XO to meet with the department
heads and the leading Boatswain’s Mate in charge of the Sea and Anchor Detail.
The group is to determine why the ship has dragged anchor the last three times it
was anchored in heavy weather. The CO wants to know, in priority order, what the
possible causes of this problem are.
The group came up with the following possible reasons using NGT Part I:
Haven't set the anchor properly
Not enough chain out
Bottom not assessed properly for holding characteristics
Ship isn't steaming at anchor to relieve strain
Piling too much anchor chain on the flukes
Inadequate navigational fixes to determine when dragging anchor
Quartermasters not notifying Command Duty Officer (CDO) of changes in the
weather (winds increasing) early enough
The Weapons Officer asserts very strongly that the primary cause is that there is not
enough chain out. However, the rest of the group continues to discuss some of the
other issues. The XO decides to use NGT Part II to prioritize the list for the CO.
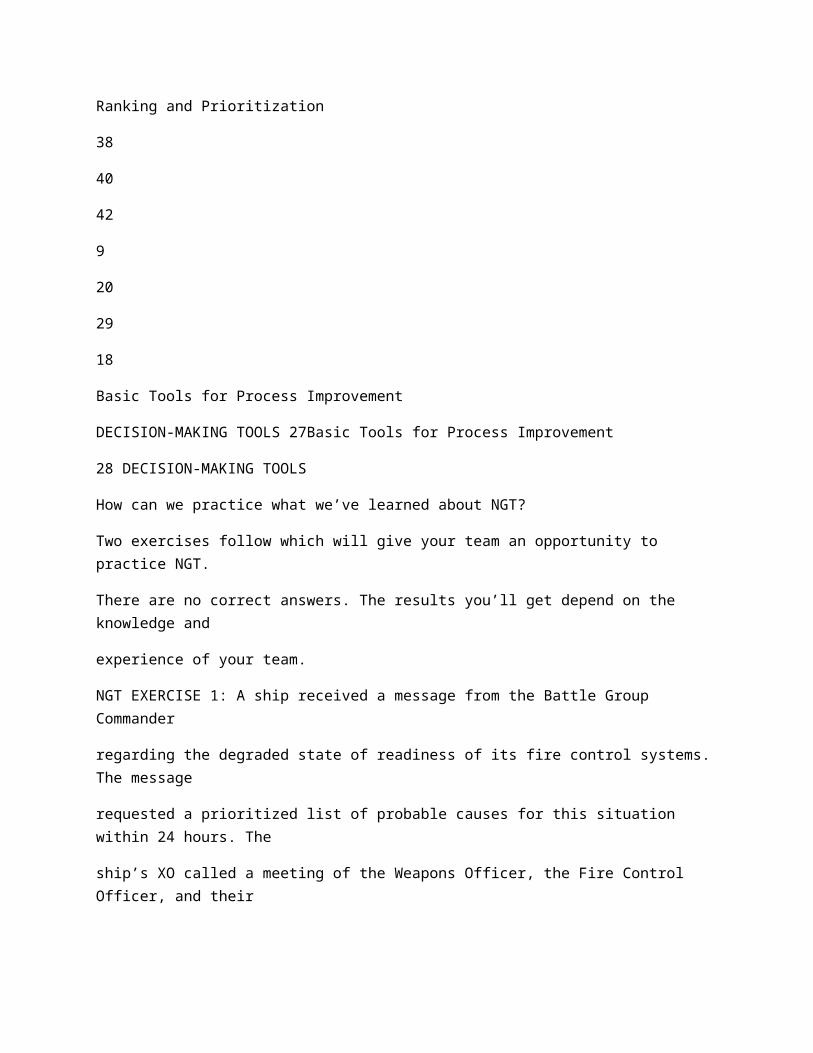
The XO assigns identifying letters to the possible reasons that were listed and
everyone in the meeting ranks them. The summary is shown in Viewgraph 18. The
XO reports the prioritized list to the CO.DECISION-MAKING TOOLS VIEWGRAPH 18
RANKING:
A. Haven't set the anchor properly 6, 7, 6, 4, 4, 7, 4 =
B. Not enough chain out 5, 5, 7, 5, 5, 6, 7 =
C. Bottom not assessed properly 7, 6, 5, 6, 7, 5, 6 =
D. Ship isn't steaming at anchor properly 1, 1, 1, 2, 1, 2, 1 =
E. Piling too much anchor chain on the flukes 2, 2, 4, 3, 3, 3, 3 =
F. Inadequate navigational fixes 3, 4, 3, 7, 6, 4, 2 =
G. QMs not notifying CDO of weather changes 4, 3, 2, 1, 2, 1, 5 =
PRIORITIZATION: C, B, A, F, E, G, D
NGT Example 2
Ranking and Prioritization
38
40
42
9
20
29
18
Basic Tools for Process Improvement
DECISION-MAKING TOOLS 27Basic Tools for Process Improvement
28 DECISION-MAKING TOOLS
How can we practice what we’ve learned about NGT?
Two exercises follow which will give your team an opportunity to practice NGT.
There are no correct answers. The results you’ll get depend on the knowledge and
experience of your team.
NGT EXERCISE 1: A ship received a message from the Battle Group Commander
regarding the degraded state of readiness of its fire control systems. The message
requested a prioritized list of probable causes for this situation within 24 hours. The
ship’s XO called a meeting of the Weapons Officer, the Fire Control Officer, and their
senior enlisted technicians to discuss the problem and develop the prioritized list.
The group defined the issue as:
Why are the fire control systems operating in
a progressively degraded state of readiness?
They generated the following list of possible reasons using NGT Part I:
Lack of key technicians
Deployed without critical test equipment
Deficiency of on-board critical spare parts
Inadequate overhaul funding precluded reliability upgrade modifications
Inadequate technical manual support
Inadequate engineering technical support
Scheduling of maintenance periods inadequate
Acting as the XO (team leader), lead an NGT session to prioritize these
ideas for presentation to the CO.
List these ideas on a chartpack.
Assign sequential letters to the list of ideas.
Distribute paper to the team members and ask them to rank the items in order
of importance giving the most important the highest number value (7) and the
least important the lowest value (1).
Collect the sheets and write each numerical ranking on the chartpack next to
the applicable item.
Add up the rankings for each item and use the totals to determine the highest
priority items.Basic Tools for Process Improvement
DECISION-MAKING TOOLS 29
NGT EXERCISE 2: A new Aviation Maintenance Officer (AMO) checked into a
squadron which had failed its last two corrosion control inspections. The AMO got
the squadron’s shop heads together to identify and prioritize the possible causes for
the inspection failures. They defined the issue as:
Why have we failed our last two corrosion control inspections?
They identified the following causes using NGT Part I:
Lack of painting facilities
Untrained junior personnel assigned to the corrosion control work center
Aircraft not removed from the flight schedule for sufficient periods for phased
maintenance
Incomplete documentation of work completed
Frequent rotation of personnel in corrosion control work center
Lack of personnel for assignment to work center
Too much salt in the air
Deployment of aircraft to ships
Lack of a MOS/NEC for corrosion control specialist

Overload of operational commitments precludes normal maintenance schedules
The AMO realized that the list of 10 causes might be too long and suggested that the
team reduce it. The authors of two of the ideas—"Too much salt in the air" and
"Deployment of aircraft to ships"—realized that these are issues which the team
could not change and withdrew them.
The AMO thought the remaining list of eight items was still too long and decided to
apply the one-half-plus-one rule to make it more manageable.
Acting as the AMO (team leader), conduct an NGT Part II session to
prioritize the remaining items on the list. Apply the one-half-plus-one rule to
determine how many items each team member should rank. Then follow the process
you have learned to identify the highest priority items before going to the see the
Operations Officer to discuss the removal of aircraft from the flight schedule for
phased maintenance.Basic Tools for Process Improvement
30 DECISION-MAKING TOOLS
REFERENCES:
1. Brassard, M. (1988). The Memory Jogger, A Pocket Guide of Tools for
Continuous Improvement, pp. 70 - 71. Methuen, MA: GOAL/QPC.
2. Department of the Navy (January 1993). Managing Fear in the Workplace.
Washington, DC: OUSN Total Quality Leadership Office.
3. Department of the Navy (November 1992). Team Skills and Concepts (Instructor
Guide) pp. 5-59 - 5-71. Pensacola, FL: Chief, Naval Education and Training.
4. Scholtes, P.R., et al (1988). The Team Handbook, pp. 2-40 - 2-45. Madison, WI:
Joiner Associates.
5. U.S. Air Force (Undated). Process Improvement Guide - Total Quality Tools for
Teams and Individuals, pp. 13 - 18. Air Force Electronic Systems Center, Air
Force Materiel Command.DECISION-MAKING TOOLS VIEWGRAPH 1
Tools for Making Decisions
•
>
Multivoting
Reduces long lists of ideas
> Identifies important items
•
>
Nominal Group Technique
Generates ideas
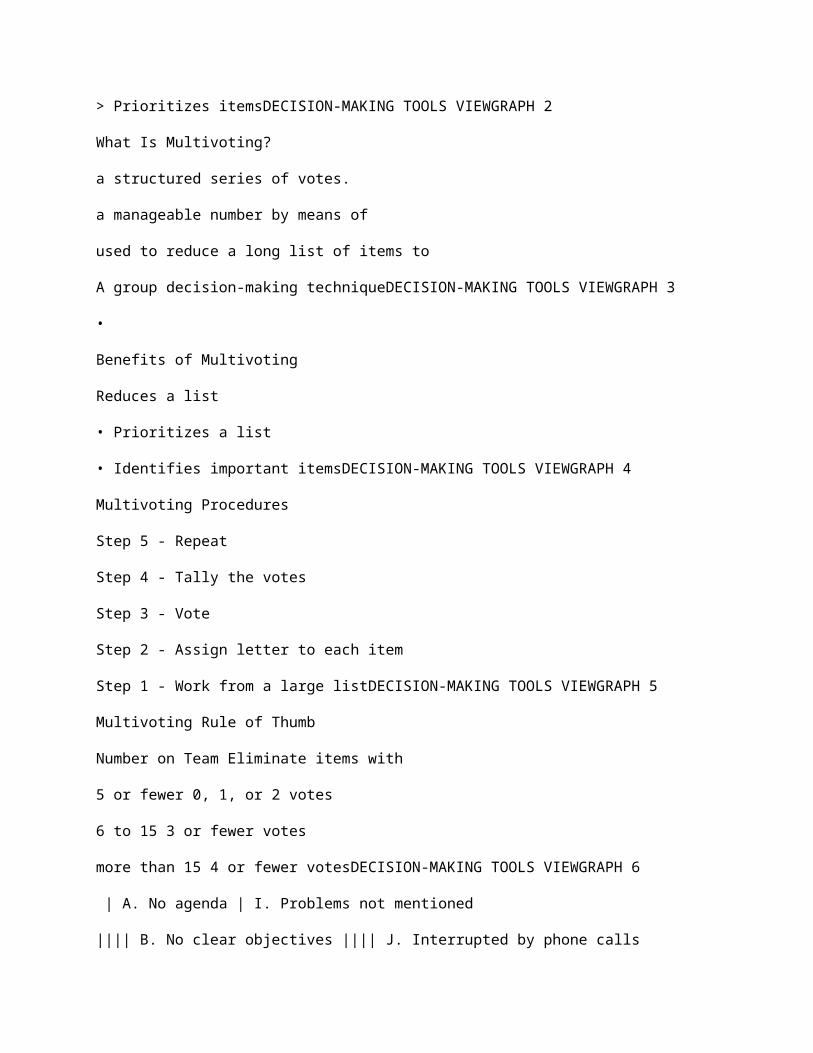
> Prioritizes itemsDECISION-MAKING TOOLS VIEWGRAPH 2
What Is Multivoting?
a structured series of votes.
a manageable number by means of
used to reduce a long list of items to
A group decision-making techniqueDECISION-MAKING TOOLS VIEWGRAPH 3
•
Benefits of Multivoting
Reduces a list
• Prioritizes a list
• Identifies important itemsDECISION-MAKING TOOLS VIEWGRAPH 4
Multivoting Procedures
Step 5 - Repeat
Step 4 - Tally the votes
Step 3 - Vote
Step 2 - Assign letter to each item
Step 1 - Work from a large listDECISION-MAKING TOOLS VIEWGRAPH 5
Multivoting Rule of Thumb
Number on Team Eliminate items with
5 or fewer 0, 1, or 2 votes
6 to 15 3 or fewer votes
more than 15 4 or fewer votesDECISION-MAKING TOOLS VIEWGRAPH 6
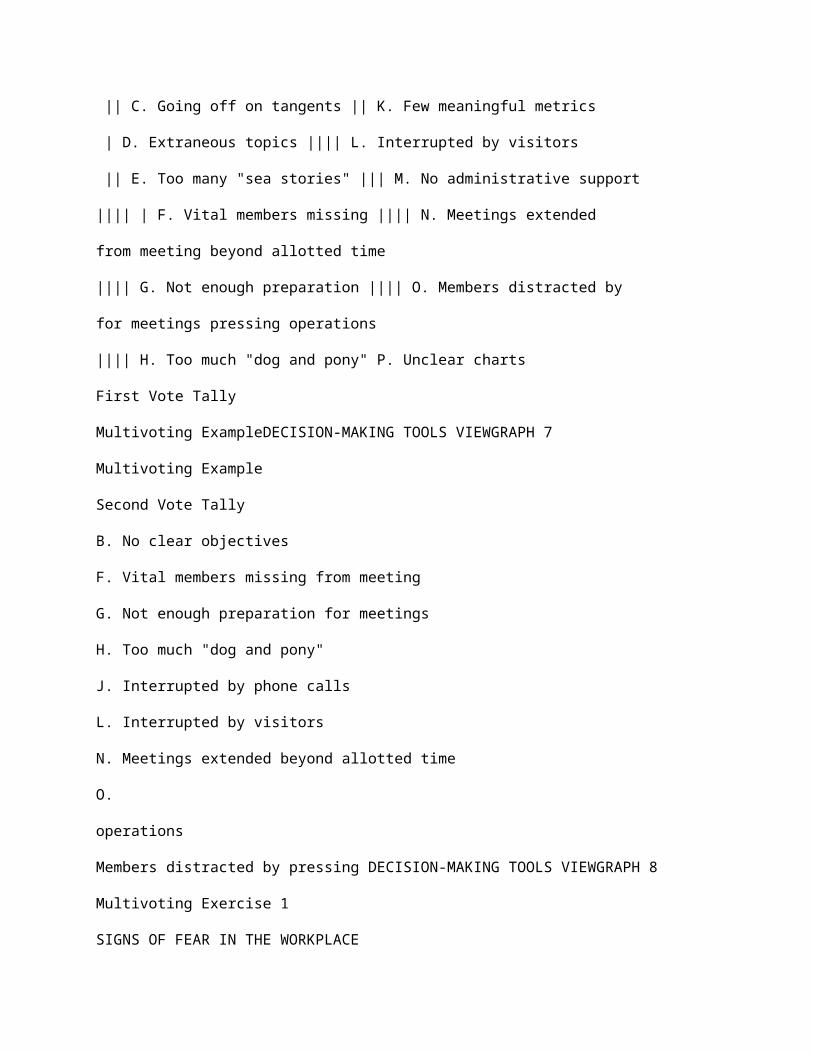
| A. No agenda | I. Problems not mentioned
|||| B. No clear objectives |||| J. Interrupted by phone calls
|| C. Going off on tangents || K. Few meaningful metrics
| D. Extraneous topics |||| L. Interrupted by visitors
|| E. Too many "sea stories" ||| M. No administrative support
|||| | F. Vital members missing |||| N. Meetings extended
from meeting beyond allotted time
|||| G. Not enough preparation |||| O. Members distracted by
for meetings pressing operations
|||| H. Too much "dog and pony" P. Unclear charts
First Vote Tally
Multivoting ExampleDECISION-MAKING TOOLS VIEWGRAPH 7
Multivoting Example
Second Vote Tally
B. No clear objectives
F. Vital members missing from meeting
G. Not enough preparation for meetings
H. Too much "dog and pony"
J. Interrupted by phone calls
L. Interrupted by visitors
N. Meetings extended beyond allotted time
O.
operations
Members distracted by pressing DECISION-MAKING TOOLS VIEWGRAPH 8
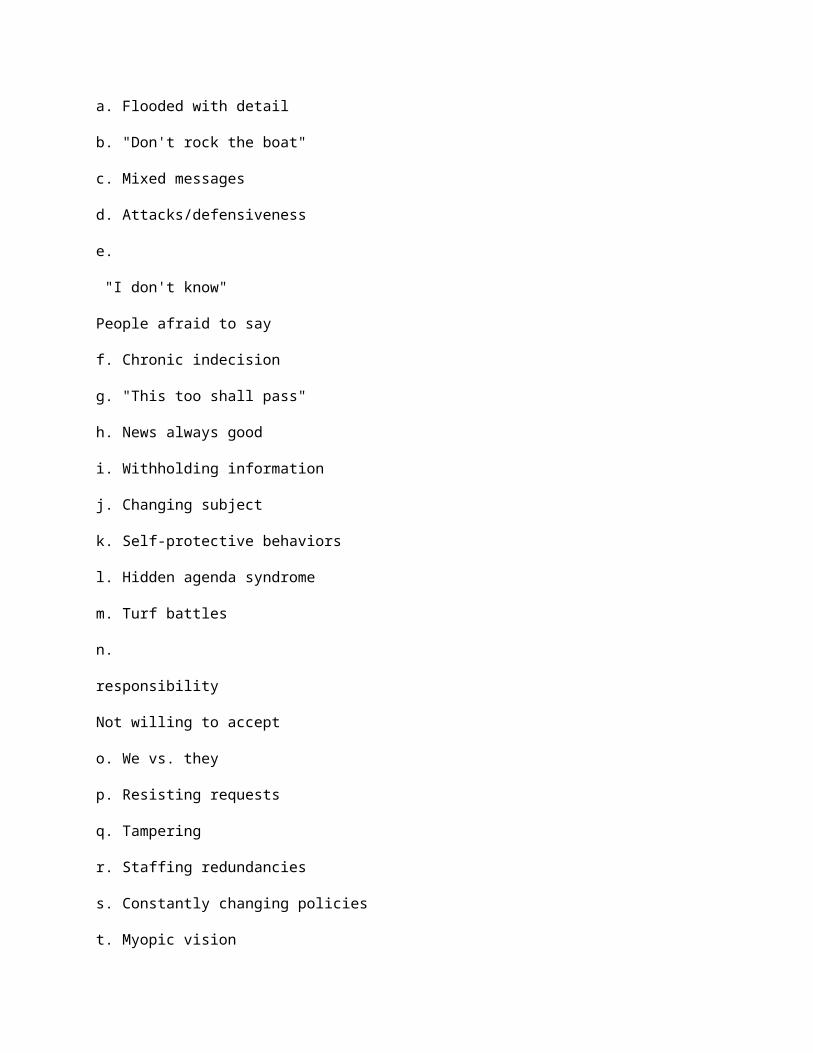
Multivoting Exercise 1
SIGNS OF FEAR IN THE WORKPLACE
a. Flooded with detail
b. "Don't rock the boat"
c. Mixed messages
d. Attacks/defensiveness
e.
"I don't know"
People afraid to say
f. Chronic indecision
g. "This too shall pass"
h. News always good
i. Withholding information
j. Changing subject
k. Self-protective behaviors
l. Hidden agenda syndrome
m. Turf battles
n.
responsibility
Not willing to accept
o. We vs. they
p. Resisting requests
q. Tampering
r. Staffing redundancies
s. Constantly changing policies
t. Myopic vision
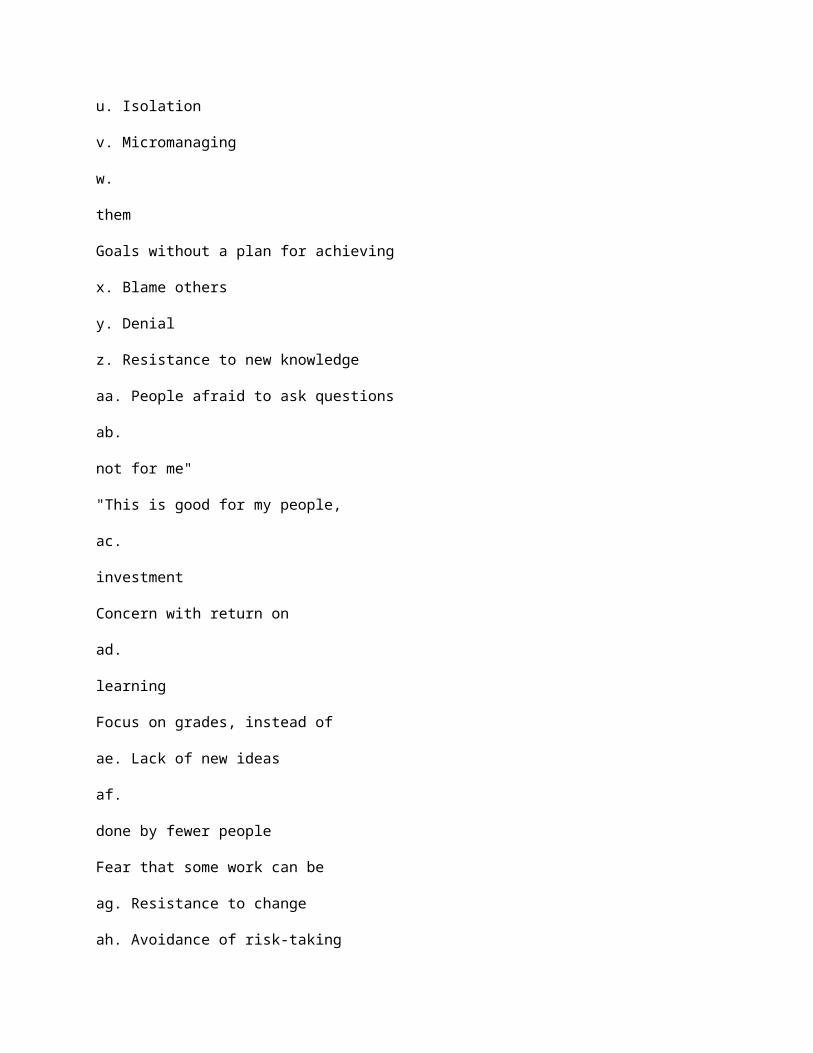
u. Isolation
v. Micromanaging
w.
them
Goals without a plan for achieving
x. Blame others
y. Denial
z. Resistance to new knowledge
aa. People afraid to ask questions
ab.
not for me"
"This is good for my people,
ac.
investment
Concern with return on
ad.
learning
Focus on grades, instead of
ae. Lack of new ideas
af.
done by fewer people
Fear that some work can be
ag. Resistance to change
ah. Avoidance of risk-taking
ai. "Just doing my job"
aj. Stress
ak. Recurrent absenteeism
al. Widespread dissatisfaction
am. Deadline anxiety
an. Enforcement approach to rules
ao. Turnover of creative thinkers
Source: Managing Fear in the Workplace, TQLO Publication No. 93-01DECISION-MAKING TOOLS VIEWGRAPH 9
Multivoting Exercise Tally Sheet
A __________ M __________ Y __________ AK _________
B __________ N __________ Z __________ AL _________
C __________ O __________ AA _________ AM _________
D __________ P __________ AB _________ AN _________
E __________ Q __________ AC _________ AO _________
F __________ R __________ AD _________ AP _________
G __________ S __________ AE _________ AQ _________
H __________ T __________ AF _________ AR _________
I __________ U __________ AG _________ AS _________
J __________ V __________ AH _________ AT _________
K __________ W __________ AI _________ AU _________
L __________ X __________ AJ _________ AV _________DECISION-MAKING TOOLS VIEWGRAPH 10
Voting Information
Multivoting Exercise 2
Petty Officer Smith A, B, D, I, N, R
Mr. Avery C, D, I, N, Q, R
Lt. Tam B, J, L, N, R, Q
Ms. Matsumoto A, C, D, I, N, R
Sgt. Bedsole E, G, L, N, P, Q
Petty Officer Browne C, E, H, K, M, ODECISION-MAKING TOOLS VIEWGRAPH 11
Multivoting Exercise 2
Tally Sheet
F =
E =
D =
C =
B =
A =
L =
K =
J =
I =
H =
G =
R =
Q =
P =
O =
N =
M =
0DECISION-MAKING TOOLS VIEWGRAPH 12
gives everyone an equal voice.
number of issues within a structure that
group to generate and prioritize a large
A weighted ranking method that allows a
What Is Nominal Group Technique?DECISION-MAKING TOOLS VIEWGRAPH 13
Benefits of Using NGT
• Reduces the number of issues
• All team members participate
• Rank orders itemsDECISION-MAKING TOOLS VIEWGRAPH 14
NGT Part I - Define the Issue and
•
Generate Ideas
Define the issue
• Generate ideas
• Collect ideas
• Clarify ideas
• Combine ideasDECISION-MAKING TOOLS VIEWGRAPH 15
NGT Part II - Make the Selection
• Assign letters to ideas
• Rank ideas independently
• Collate the rankings
• Add the rankings
• Rewrite the list in priority order
• Perform a sanity checkDECISION-MAKING TOOLS VIEWGRAPH 16
Issue PO1 MAJ SGT MR ENS Total Priority
JONES SMITH ABLE GOOD FELLER
A 7 5 1 6 5 24 2
B 2 1 6 3 2 14 6
C 6 4 5 4 4 23 3
D 1 2 3 2 3 11 7
E 5 6 4 5 6 26 1
F 3 3 2 7 7 22 4
G 4 7 7 1 1 20 5
NGT Example 1
ResultsDECISION-MAKING TOOLS VIEWGRAPH 17
NGT Example 1
Prioritization
D. Poor communications within the office
B. Poor communications outside the office
G. Lack of feedback on reports to management
F. Poor distribution of office mail
C. Lack of training
A. Ineffective organizational structure
E. Unclear mission and objectivesDECISION-MAKING TOOLS VIEWGRAPH 18
RANKING:
A. Haven't set the anchor properly 6, 7, 6, 4, 4, 7, 4 =
B. Not enough chain out 5, 5, 7, 5, 5, 6, 7 =
C. Bottom not assessed properly 7, 6, 5, 6, 7, 5, 6 =
D. Ship isn't steaming at anchor properly 1, 1, 1, 2, 1, 2, 1 =
E. Piling too much anchor chain on the flukes 2, 2, 4, 3, 3, 3, 3 =
F. Inadequate navigational fixes 3, 4, 3, 7, 6, 4, 2 =
G. QMs not notifying CDO of weather changes 4, 3, 2, 1, 2, 1, 5 =
PRIORITIZATION: C, B, A, F, E, G, D
NGT Example 2
Ranking and Prioritization
18
29
20
9
42
40
38
Top Related