


Languages
Pages
Legal


AEP Company Overview
Robert P. PowersExecutive Vice President - Generation

5 millionCustomers
202,000 milesDistribution
39,000 milesTransmission
36,000 MW capacityGeneration
AEP – Summary Statistics
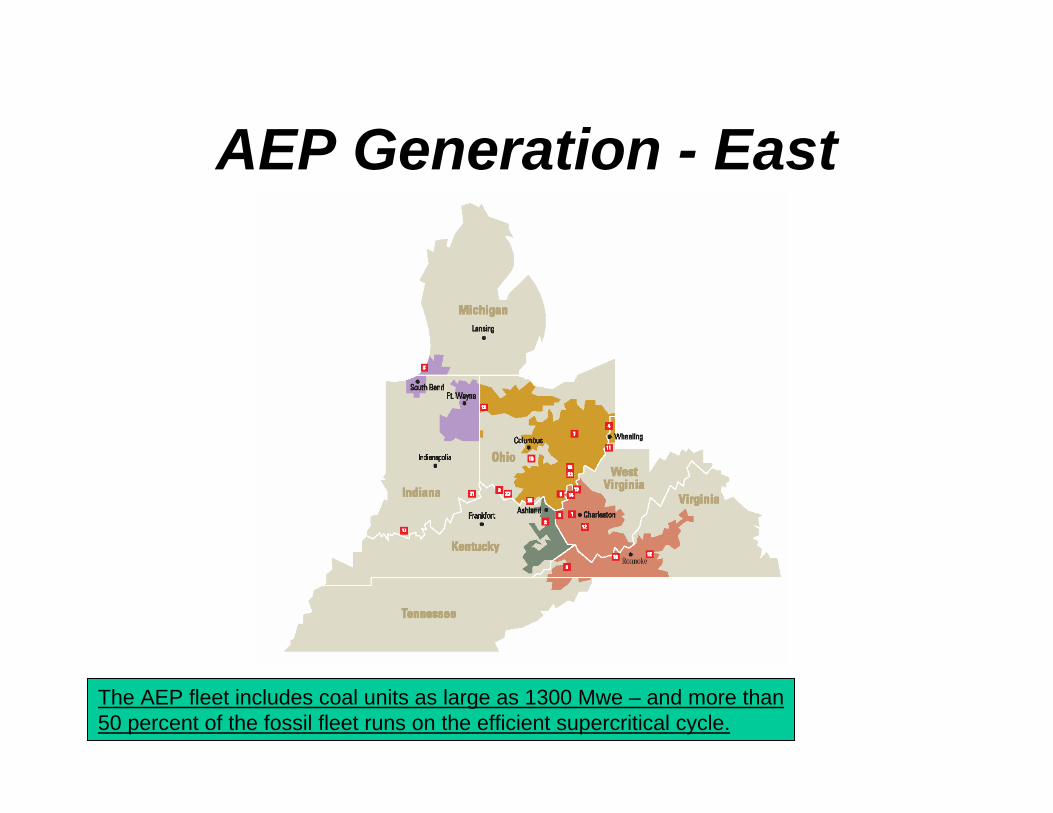
AEP Generation - East
The AEP fleet includes coal units as large as 1300 Mwe – and more than50 percent of the fossil fleet runs on the efficient supercritical cycle.
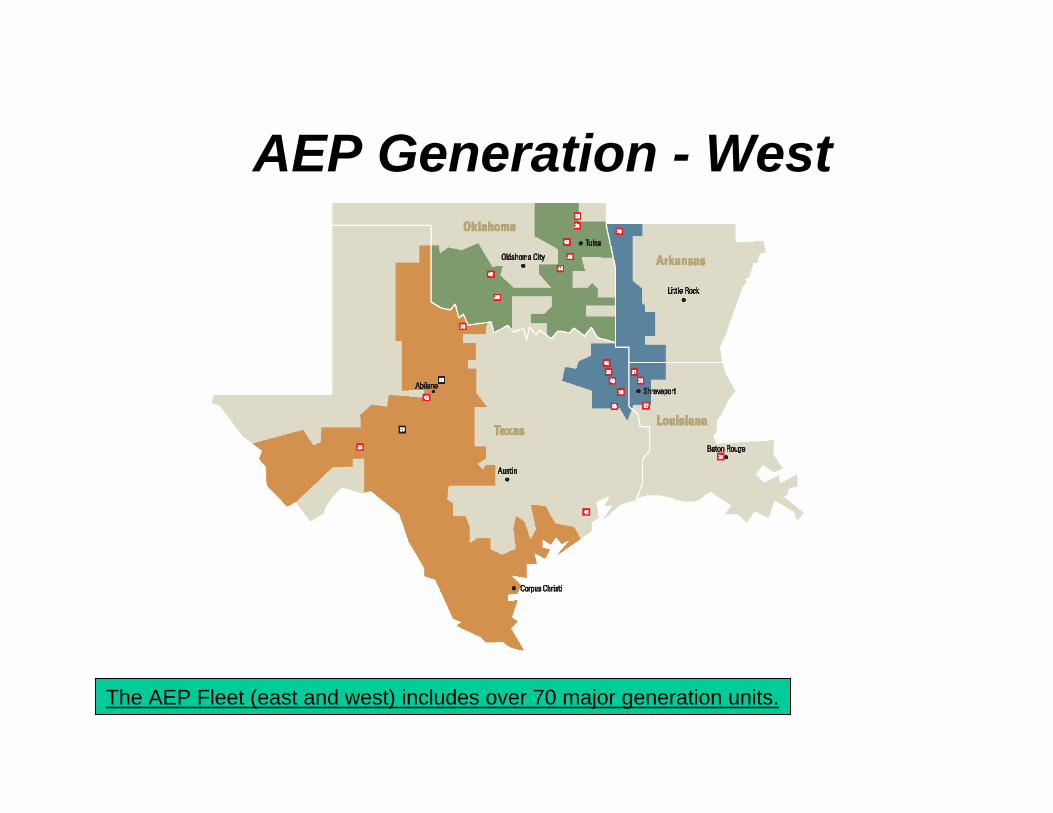
AEP Generation - West
The AEP Fleet (east and west) includes over 70 major generation units.

GENERATION FLEET IS SUBSTANTIAL AND LOW COST
Coal/Lignite
72%
Natural Gas/Oil
19%
PumpedStorage, Wind
Hydro 3%Nuclear6%
Capacity by Fuel Mix
35,600 MW Domestic Capacity
85% System Availability Factor YE 2005
63% System Capacity Factor YE 2005
Load-Following Peaking
Texas 1,089 0
3,516
0
AEP Generation Fleet
TotalWestern US
TexasEaston US
PeakingLoad-FollowingBaseload23,985
1,0894,82829,902
0
0
3,516
3,516
1,954
0
1882,142

2005 Operating Statistics
Coal Units Provide the Majority of AEP’s GenerationCoal Units Provide the Majority of AEP’s Generation
6
Net Generation 2005 % Of TotalAEP PJM 153,861,250 79.37% Coal 135,406,451 69.85% Gas 139,525 0.07% Net Hydro* 841,761 0.43% Nuclear 17,473,513 9.01%AEP SPP 35,548,497 18.34% Coal 24,832,551 12.81% Gas 10,715,946 5.53%AEP ERCOT 4,440,216 2.29% Coal*** 2,678,060 1.38% Nuclear **** 1,762,156 0.91%Totals** 193,849,963 100.00%Notes: *Includes run of the river and pump storage. **Includes AEP owned generation and Cardinal 2&3. ***Actual includes AEP Texas' [TCC & TNC] portion. ****Actual includes generation thru 5/19/05, when sale for STP was completed.
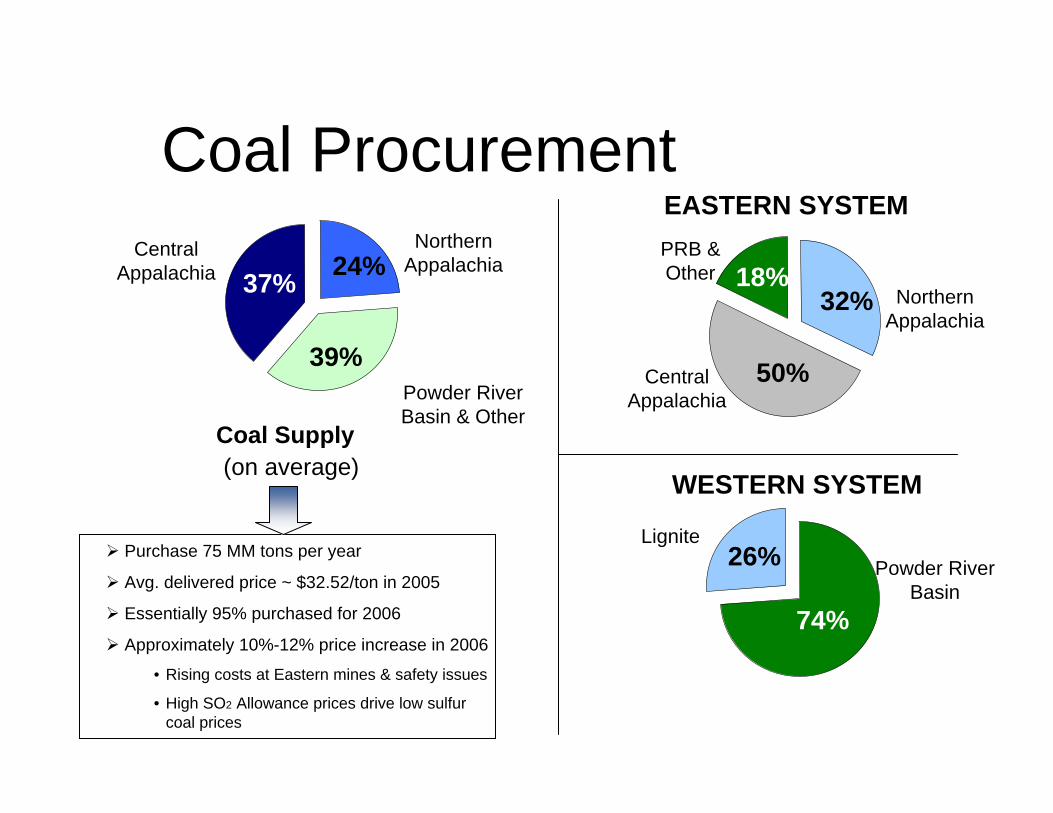
Northern Appalachia
32%
50%
18%PRB & Other
Central Appalachia
74%
26%Lignite
Powder River Basin
EASTERN SYSTEM
WESTERN SYSTEM
Northern Appalachia
Coal Supply
24%
39%
37%
Powder River Basin & Other
Central Appalachia
(on average)
AEP SYSTEM
Purchase 75 MM tons per year
Avg. delivered price ~ $32.52/ton in 2005
Essentially 95% purchased for 2006
Approximately 10%-12% price increase in 2006
• Rising costs at Eastern mines & safety issues
• High SO2 Allowance prices drive low sulfur coal prices
Coal ProcurementNorthern
Appalachia
Powder River Basin & Other
Central Appalachia

Coal Transportation to AEP PlantsJan-June 2005 Actual
AEP’s substantial coal transportation assets include:
7,065 railcars
2,230 barges
53 towboats
1 active coal handling terminal (20 million tons of annual capacity)
AEP’S TRANSPORTATION ASSETS PROVIDE FLEXIBILITY IN A CONSTRAINED DELIVERY ENVIRONMENT
AEP-Owned Assets External Carrier
20%
80%
AEP’s Coal Transportation Assets
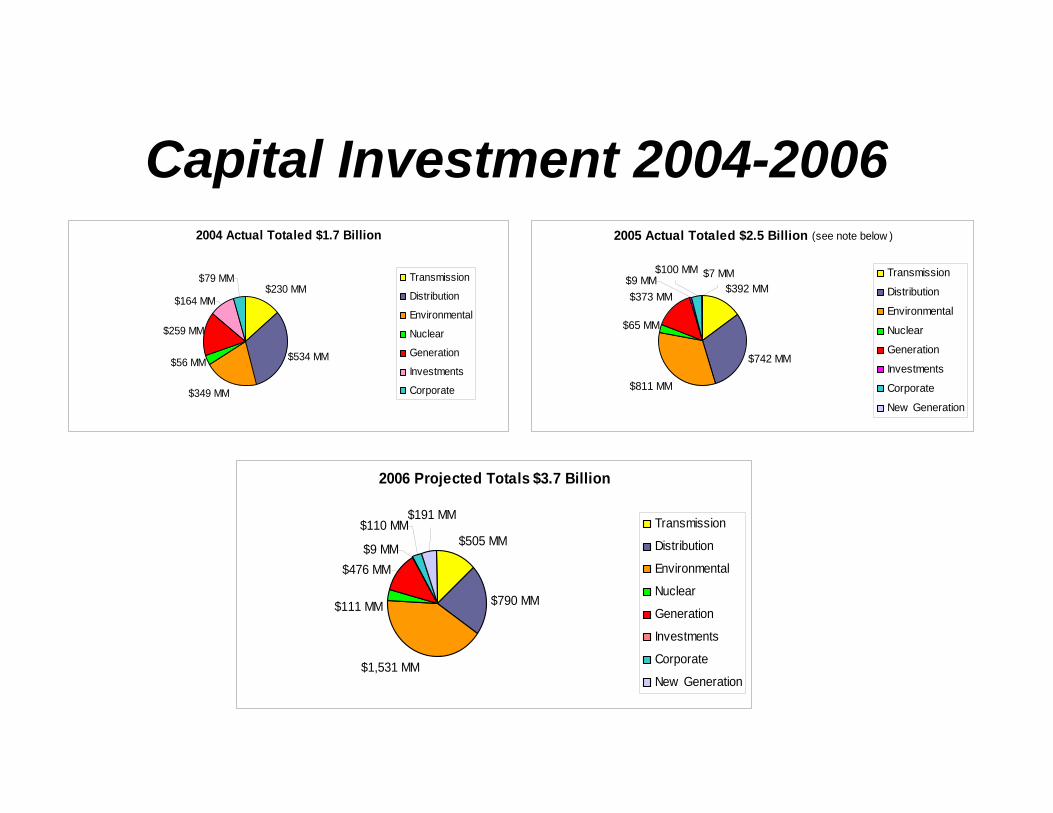
Capital Investment 2004-20062004 Actual Totaled $1.7 Billion
$230 MM
$534 MM
$349 MM
$56 MM
$259 MM
$164 MM
$79 MM Transmission
Distribution
Environmental
Nuclear
Generation
Investments
Corporate
2005 Actual Totaled $2.5 Billion (see note below )
$392 MM
$742 MM
$811 MM
$65 MM
$373 MM$9 MM
$100 MM $7 MM Transmission
Distribution
Environmental
Nuclear
Generation
Investments
Corporate
New Generation
2006 Projected Totals $3.7 Billion
$505 MM
$790 MM
$1,531 MM
$111 MM
$191 MM
$9 MM
$110 MM
$476 MM
Transmission
Distribution
Environmental
Nuclear
Generation
Investments
Corporate
New Generation
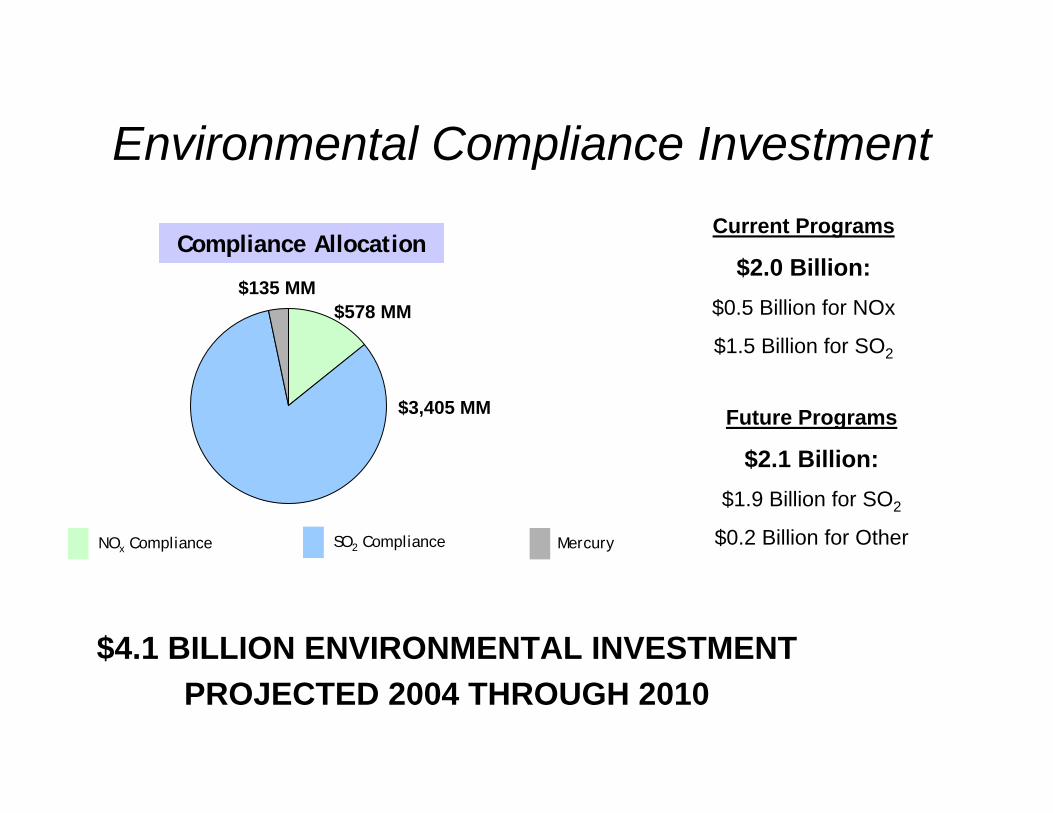
MercuryNOx Compliance SO2 Compliance
$3,405 MM
$135 MM$578 MM
Compliance Allocation
Environmental Compliance InvestmentCurrent Programs
$2.0 Billion:$0.5 Billion for NOx
$1.5 Billion for SO2
Future Programs
$2.1 Billion:$1.9 Billion for SO2
$0.2 Billion for Other
$4.1 BILLION ENVIRONMENTAL INVESTMENT PROJECTED 2004 THROUGH 2010

162110 - GJS/CE-01/1-23-02
Coal
Syngas
Quench Gasifier
Slag/Fines
Steam
Sulfur Removal
Cryogenic Oxygen
Particulate Removal
MercuryRemoval Steam
7FA Combustion Turbine
Steam Turbine
HRSGAir
Electricity
StackWater
Solids
Pure Sulfur
AEP HAS ANNOUNCED ITS INTENTION TO CONSTRUCT A COMMERCIAL-SCALE INTEGRATED GASIFICATION COMBINED CYCLE (IGCC) PLANT BY
THE END OF THE DECADE
Looking to the Future - IGCC

• Source: Results of AEP analysis based on EPRI studies. • Total Plant Cost (2005$’s) includes the cost to Engineer, Procure and Construct plant; includes owner’s costs; does not include transmission upgrades, or AFUDC. • Assumes Northern Appalachian Coal price of $1.60 /mmBtu for PC and IGCC, and natural gas price of $7.50/mmBtu for NGCC.• Assumes 85% capacity factor for PC and IGCC, 25% for NGCC. • Variable Production Cost includes Fuel Cost and Variable Operations & Maintenance (VOM) cost.• Cost of Electricity does not include the cost of Emission Credits; Cost of Electricity with CO2 capture does not include sequestration.
Generation Technology Comparative Statistics
Investing in IGCC
976964 Cost of Electricity, without CO2 Capture ($/MWh)
571617Production Cost ($/MWh)
14883104Estimated Cost of Electricity, with CO2 Capture ($/MWh)
60020001800Total Plant Cost (EPC) ($/kW)720086008700Heat Rate (Btu/kWh)600600600Nominal Capacity (MW)
NGCCIGCCPC
AEP Ohio OverviewAEP Ohio OverviewKevin E. Walker, President and COO
Ghana DelegationFebruary 7, 2006
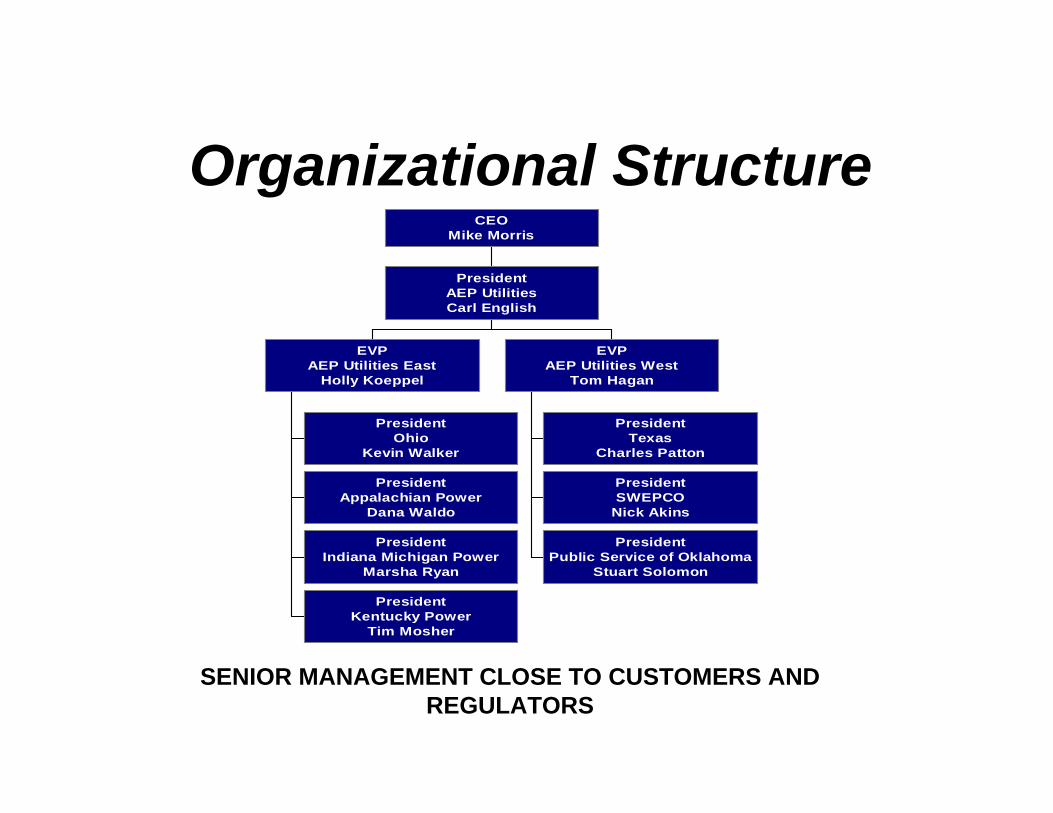
Organizational Structure
SENIOR MANAGEMENT CLOSE TO CUSTOMERS AND REGULATORS
PresidentOhio
Kevin Walker
PresidentAppalachian Power
Dana Waldo
PresidentIndiana Michigan Power
Marsha Ryan
PresidentKentucky Power
Tim Mosher
EVPAEP Utilities East
Holly Koeppel
PresidentTexas
Charles Patton
PresidentSWEPCO
Nick Akins
PresidentPublic Service of Oklahoma
Stuart Solomon
EVPAEP Utilities West
Tom Hagan
PresidentAEP UtilitiesCarl English
CEOMike Morris

Business StrategyAEP’s strategy is to focus on domestic utility operations in the U.S. Our objective is to be an economical, reliable and safe provider of electric energy to the markets that we serve. We will achieve economic advantage by designing, building, improving and operating low-cost, environmentally compliant, efficient sources of power and maximizing the volumes of power delivered from these facilities. We will maintain and enhance our position as a safe and reliable provider of electric energy by making significant investments in environmental and reliability upgrades. We will seek to recover the cost of our new utility investments in a manner that results in reasonable rates for our customers while providing a fair return for our shareholders through a stable stream of cash flows, enabling us to pay dependable, competitive dividends. We will operate our competitive generating assets to maximize our productivity and profitability after meeting our native-load requirements.
In summary, our business strategy calls for us to:
Operations• Invest in technology that improves the environment of the communities in which we operate
• Maximize the value of our transmission assets through membership in PJM, ERCOT and SPP
• Continue maintaining and improving the quality of distribution service
• Optimize generation assets by increasing availability and consequently increasing sales
Regulation• Focus on the regulatory process to fully recover our costs and earn a fair return while providing fair and reasonable rates to our
customers while fulfilling our commitment to invest in environmental projects at our generating plants and
• Recover stranded costs associated with our Texas generation assets in compliance with the law
Financial• Operate only those unregulated investments that are consistent with our energy expertise and risk tolerance and that provide
reasonable prospects for a fair return and moderate growth
• Continue to improve credit quality and maintain acceptable levels of liquidity
• Achieve moderate but steady growth
AEP System Overview
OH
TXOKIN
VA
WV
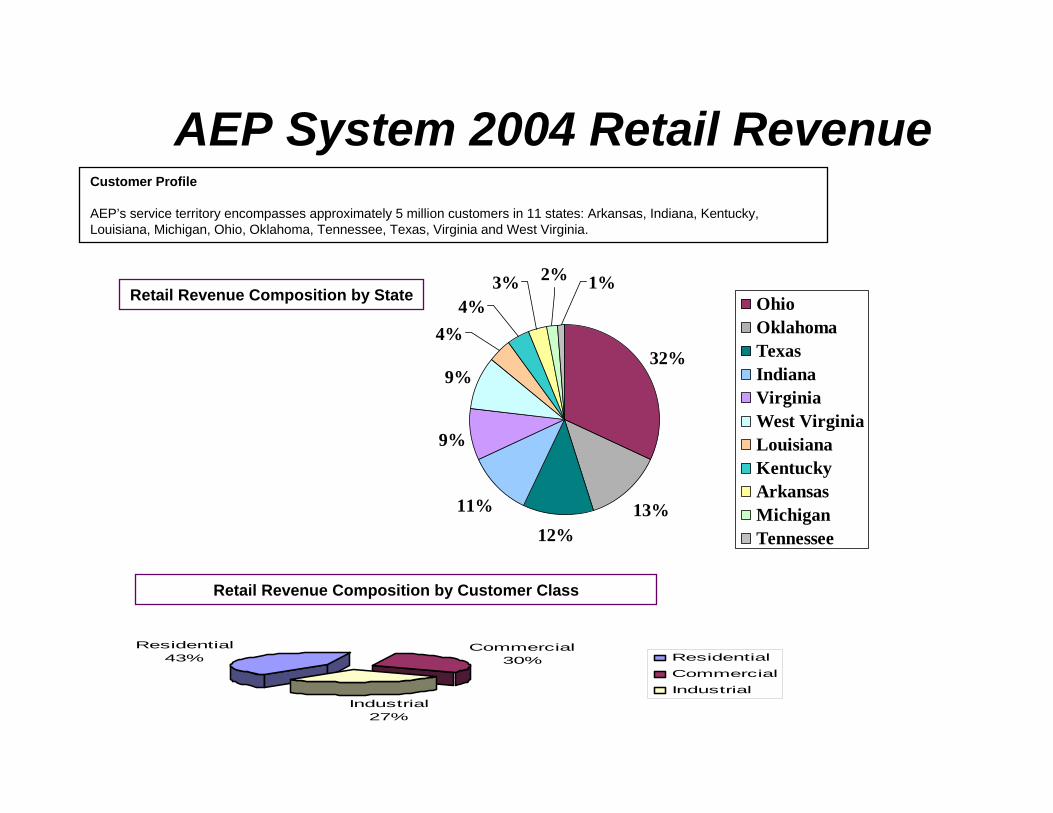
AEP System 2004 Retail RevenueCustomer Profile
AEP’s service territory encompasses approximately 5 million customers in 11 states: Arkansas, Indiana, Kentucky, Louisiana, Michigan, Ohio, Oklahoma, Tennessee, Texas, Virginia and West Virginia.
32%
13%12%
11%
9%
9%
4%4%
3% 2% 1%OhioOklahomaTexasIndianaVirginiaWest VirginiaLouisianaKentuckyArkansasMichiganTennessee
Industrial27%
Commercial30%
Residential43% Residential
CommercialIndustrial
Retail Revenue Composition by State
Retail Revenue Composition by Customer Class
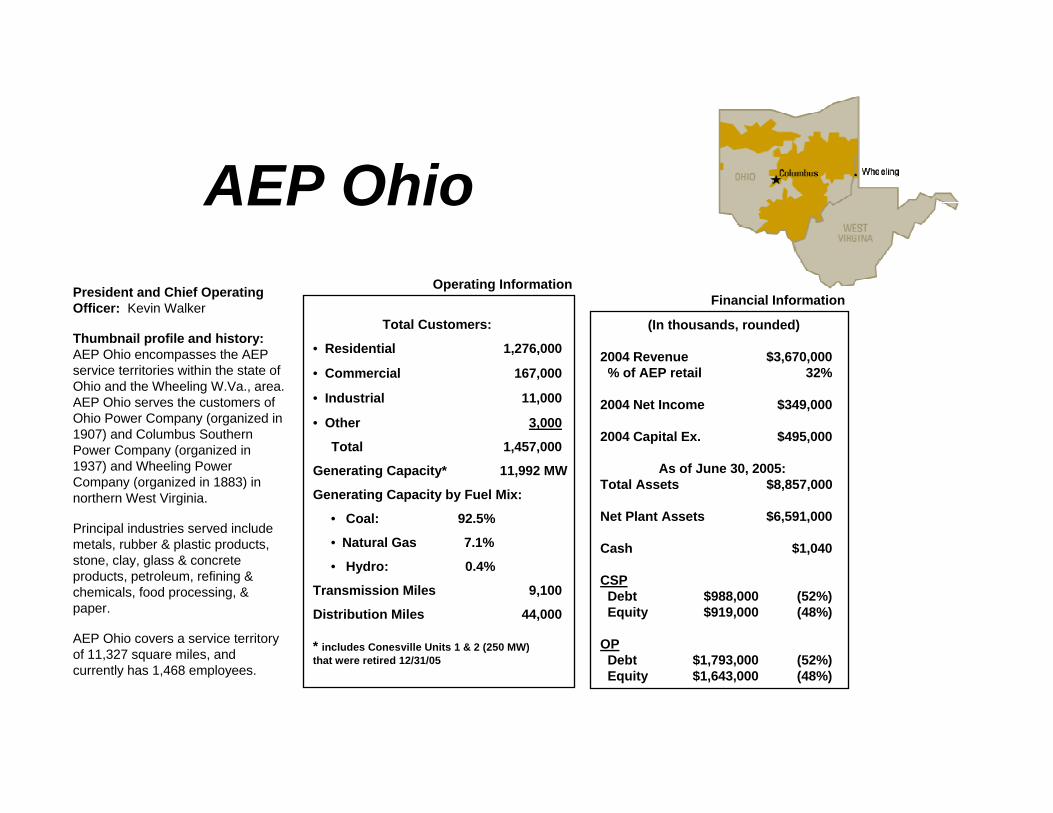
President and Chief Operating Officer: Kevin Walker
Thumbnail profile and history:AEP Ohio encompasses the AEP service territories within the state of Ohio and the Wheeling W.Va., area. AEP Ohio serves the customers of Ohio Power Company (organized in 1907) and Columbus Southern Power Company (organized in 1937) and Wheeling Power Company (organized in 1883) in northern West Virginia.
Principal industries served include metals, rubber & plastic products, stone, clay, glass & concrete products, petroleum, refining & chemicals, food processing, & paper.
AEP Ohio covers a service territory of 11,327 square miles, and currently has 1,468 employees.
Financial InformationOperating Information
(In thousands, rounded)
2004 Revenue $3,670,000% of AEP retail 32%
2004 Net Income $349,000
2004 Capital Ex. $495,000
As of June 30, 2005:Total Assets $8,857,000
Net Plant Assets $6,591,000
Cash $1,040
CSPDebt $988,000 (52%)Equity $919,000 (48%)
OPDebt $1,793,000 (52%)Equity $1,643,000 (48%)
Total Customers:
• Residential 1,276,000
• Commercial 167,000
• Industrial 11,000
• Other 3,000
Total 1,457,000
Generating Capacity* 11,992 MW
Generating Capacity by Fuel Mix:
• Coal: 92.5%
• Natural Gas 7.1%
• Hydro: 0.4%
Transmission Miles 9,100
Distribution Miles 44,000
* includes Conesville Units 1 & 2 (250 MW)that were retired 12/31/05
AEP Ohio

AEP Ohio - Who we are
• Largest of AEP’s regional utility divisions• Comprised of Columbus Southern Power and Ohio Power• Approximately 1,450 employees• Nearly 1.5 million customers in Ohio and West Virginia
– In Ohio• We provide power to more than 900 communities• Serve customers in 61 of 88 counties
– In West Virginia• Serve approximately 40,000 customers in Ohio and Marshall counties
• AEP Ohio headquarters in Gahanna, OH, with state offices in downtown Columbus
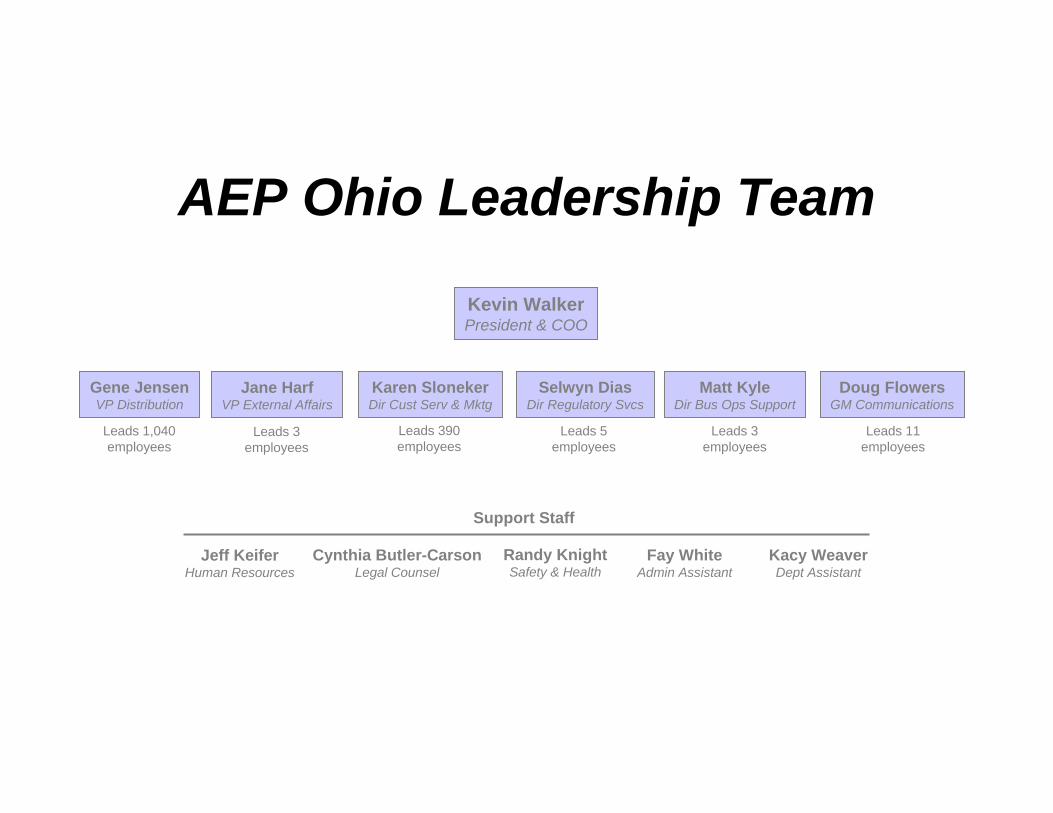
AEP Ohio Leadership Team
Kevin WalkerPresident & COO
Gene JensenVP Distribution
Jane HarfVP External Affairs
Karen SlonekerDir Cust Serv & Mktg
Selwyn DiasDir Regulatory Svcs
Matt KyleDir Bus Ops Support
Doug FlowersGM Communications
Jeff KeiferHuman Resources
Cynthia Butler-CarsonLegal Counsel
Fay WhiteAdmin Assistant
Kacy WeaverDept Assistant
Support Staff
Leads 1,040employees
Leads 3employees
Leads 390employees
Leads 5employees
Leads 3employees
Leads 11employees
Randy KnightSafety & Health
Recent Accomplishments
• Approval of rate stabilization plan• Acquisition of Monongahela Power
service territory• Continued planning for IGCC plant in
southeastern Ohio• Significant mutual assistance effort to
storm ravaged areas of the U.S.

Our Focus
• Safety• Reliability• Customer satisfaction• Financial performance

Regulatory Affairs and Economic Development
Selwyn J. Dias, Director

Regulatory Affairs and Economic Development
Two Primary Areas Of Focus:Regulatory Services
Public Utilities Commission of Ohio Ohio Consumers’ Counsel Customers (Industrial, Commercial and Residential)
Economic DevelopmentOhio Department of Development Chambers of Commerce
Regulatory Affairs and Economic DevelopmentRegulatory ServicesPublic Utilities Commission of Ohio
• Rates and RegulationsPublic Policy AdvocacyElectric Service ReliabilityElectric Service Safety StandardsCommission Customer ComplaintsRevenue Requirements
Regulatory Affairs and Economic DevelopmentRegulatory ServicesPublic Utilities Commission of Ohio
• Commissioner and Staff RelationshipsStaff Education on Electric OperationsOperating Best Practices
Regulatory Affairs and Economic Development
Regulatory ServicesOhio Consumers’ Counsel
Residential Customer AdvocateUnique Needs (i.e. demand side management, low income programs, etc.)
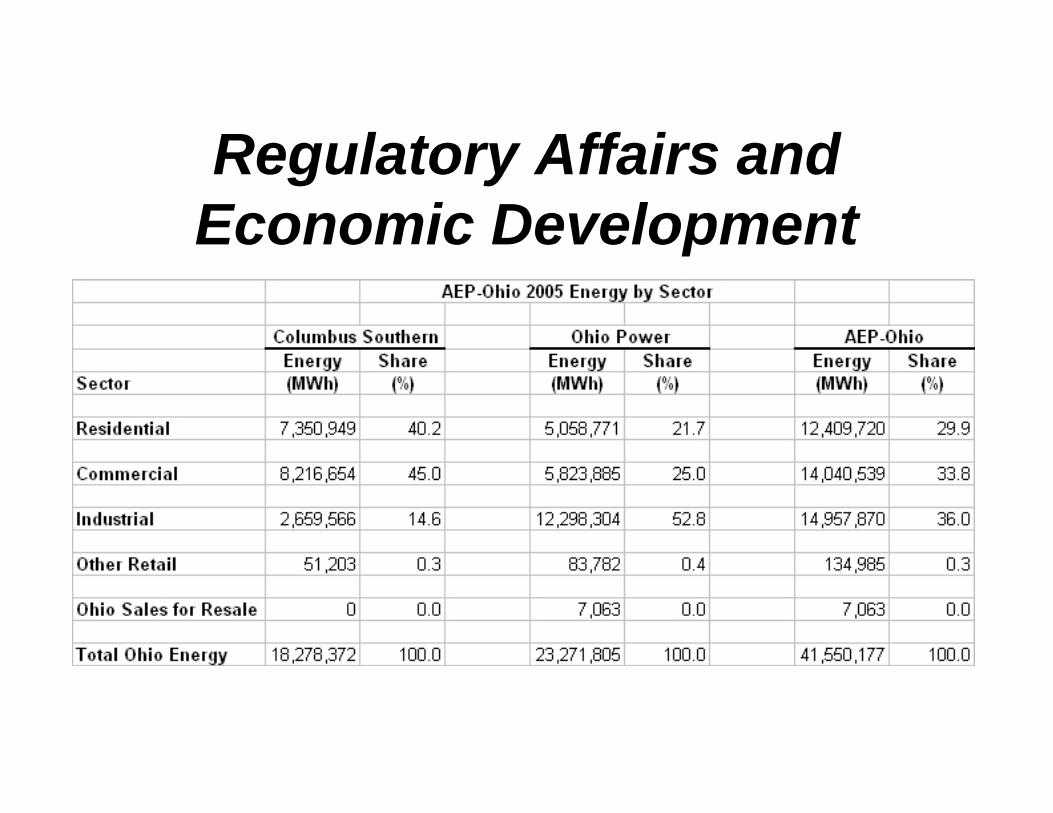
CustomersTariff Administration (Terms and Conditions; Appropriate Tariff)Load and Energy Consumption (see next slide)
Regulatory Affairs and Economic Development
Regulatory Affairs and Economic DevelopmentEconomic Development$11.2M Funding for Economic Development (Three Years)Ohio Department of Development
Prospect Solicitation PartnershipCriteria for Qualifying Prospects (Jobs, Investment, Tax Revenue, KWh)$100K Grant
Regulatory Affairs and Economic Development
Economic DevelopmentChambers of Commerce
Economic Development Seminars

Regulatory Affairs and Economic Development
AdministrativeAssistant
Sherry HillCommission LiaisonRegulatory Services
Pat LawrenceRegulatory ConsultantRegulatory Services
Marty WalshManager
Economic Development
Chuck CorbittManager
Economic Development
Selwyn J. DiasDirector
Regulatory Affairs &Economic Dev.

Community Affairs and Communications
Doug Flowers, General Manager
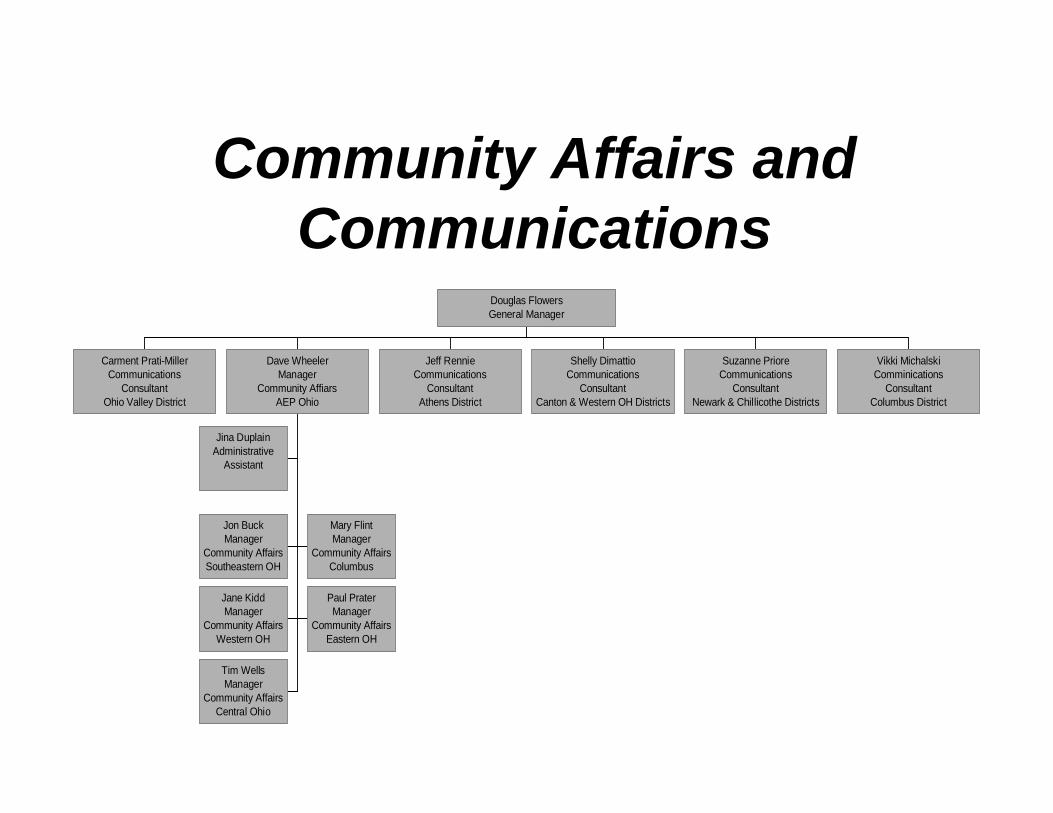
Community Affairs and Communications
Carment Prati-MillerCommunications
ConsultantOhio Valley District
Jina DuplainAdministrative
Assistant
Jon BuckManager
Community AffairsSoutheastern OH
Mary FlintManager
Community AffairsColumbus
Jane KiddManager
Community AffairsWestern OH
Paul PraterManager
Community AffairsEastern OH
Tim WellsManager
Community AffairsCentral Ohio
Dave WheelerManager
Community AffiarsAEP Ohio
Jeff RennieCommunications
ConsultantAthens District
Shelly DimattioCommunications
ConsultantCanton & Western OH Districts
Suzanne PrioreCommunications
ConsultantNewark & Chillicothe Districts
Vikki MichalskiComminications
ConsultantColumbus District
Douglas FlowersGeneral Manager
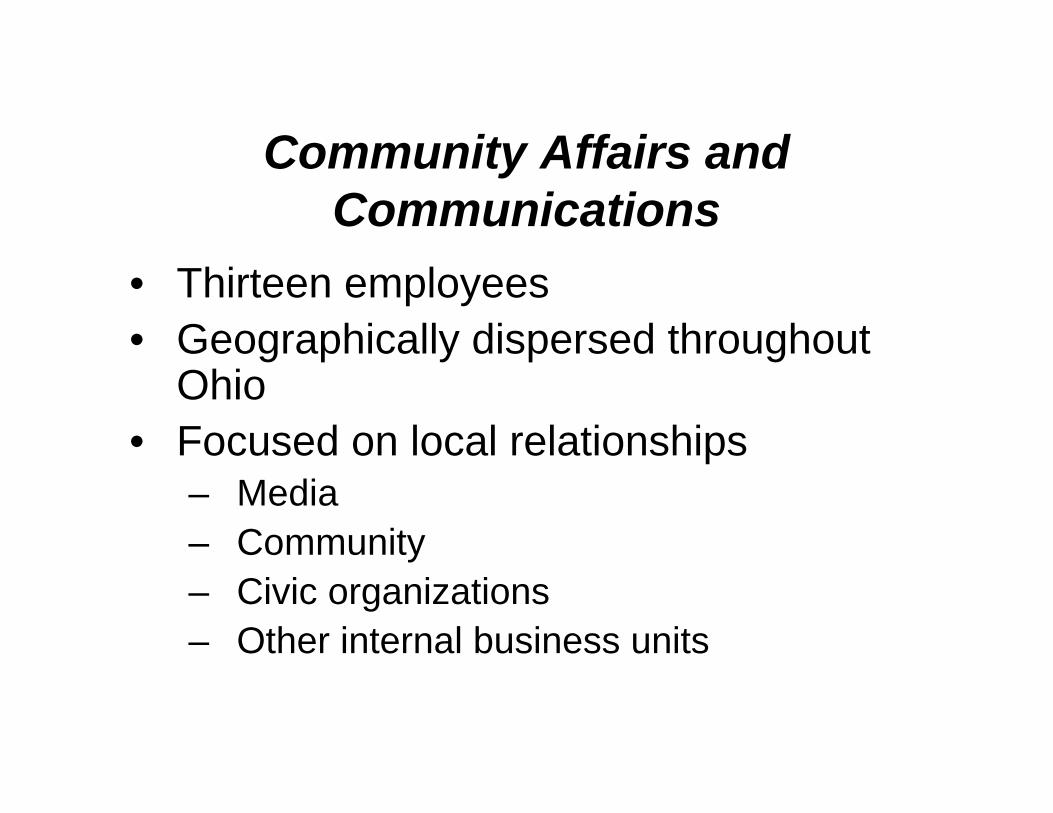
Community Affairs and Communications
• Thirteen employees• Geographically dispersed throughout
Ohio• Focused on local relationships
– Media– Community– Civic organizations– Other internal business units
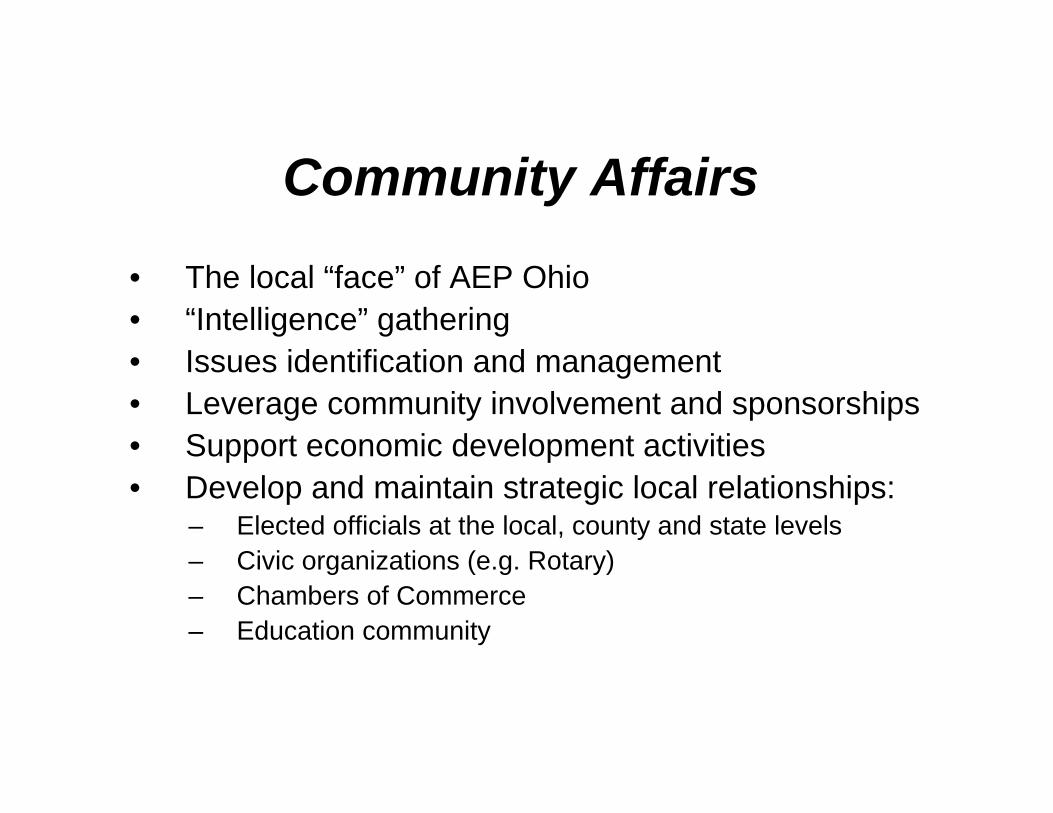
Community Affairs
• The local “face” of AEP Ohio• “Intelligence” gathering• Issues identification and management• Leverage community involvement and sponsorships• Support economic development activities• Develop and maintain strategic local relationships:
– Elected officials at the local, county and state levels– Civic organizations (e.g. Rotary)– Chambers of Commerce– Education community
Corporate Communications• Develop and maintain key relationships with the
media• Identify opportunities to positively position AEP
Ohio in our markets• Leverage sponsorships and advertising to
strengthen company image and reputation• Issues identification and management• Crisis management• Strong relationships with internal business units
AEP Ohio External AffairsGovernmental and
Environmental AffairsJane Harf, Vice President

Areas of Focus• The Ohio General Assembly• The Office of the Governor• The Executive Agencies• Electoral Activity• Policy Development• Coalitions and Associations• Contributions and Sponsorships
The General Assembly: House of Representatives & Senate• Leadership• Committees of Jurisdiction
– Public Utilities– Environment– Natural Resources– Economic Development– Ways & Means [Taxes]– Finance [Budget]
• Service Territory Members

The Office of The Governor
• Governor • Chief of Staff• Executive Assistants for
Substantive Areas
The Executive Agencies
• Ohio EPA• Department of Natural Resources• Department of Development• Public Utilities Commission• Department of Taxation• Office of Budget and Management

Electoral Activity
• AEP PAC: Committee for Responsible Government– Solicitations– Member Events– Budget – Strategic Planning
Policy Development
• Coordinate the development of positions on issues of concern to the company and the industry– Between various organizations within AEP– Among the Investor Owned Utilities– Within the Broader Governmental
Community
Coalitions and Organizations
• Participation in coalitions of mutual interest:– Ohio Coal Association– Ohio Chemistry Technology Council
Coalitions and Organizations
• Membership in organizations that represent our public policy interests– Ohio Electric Utility Institute– Ohio Chamber of Commerce– Ohio Public Expenditure Council– Ohio Manufacturers’ Association

Contributions and Sponsorships
• Support the activities of charitable organizations– Children’s Hunger Alliance– Foundation for Appalachian Ohio– Habitat for Humanity

Contributions and Sponsorships
• Support Academic Public Policy Programs – OSU: John Glenn Institute – Ohio University: Voinovich Center
Contributions and Sponsorships
• Support Environmental Stewardship– Franklin Park Conservatory– The Nature Conservancy– Environmental Education Association
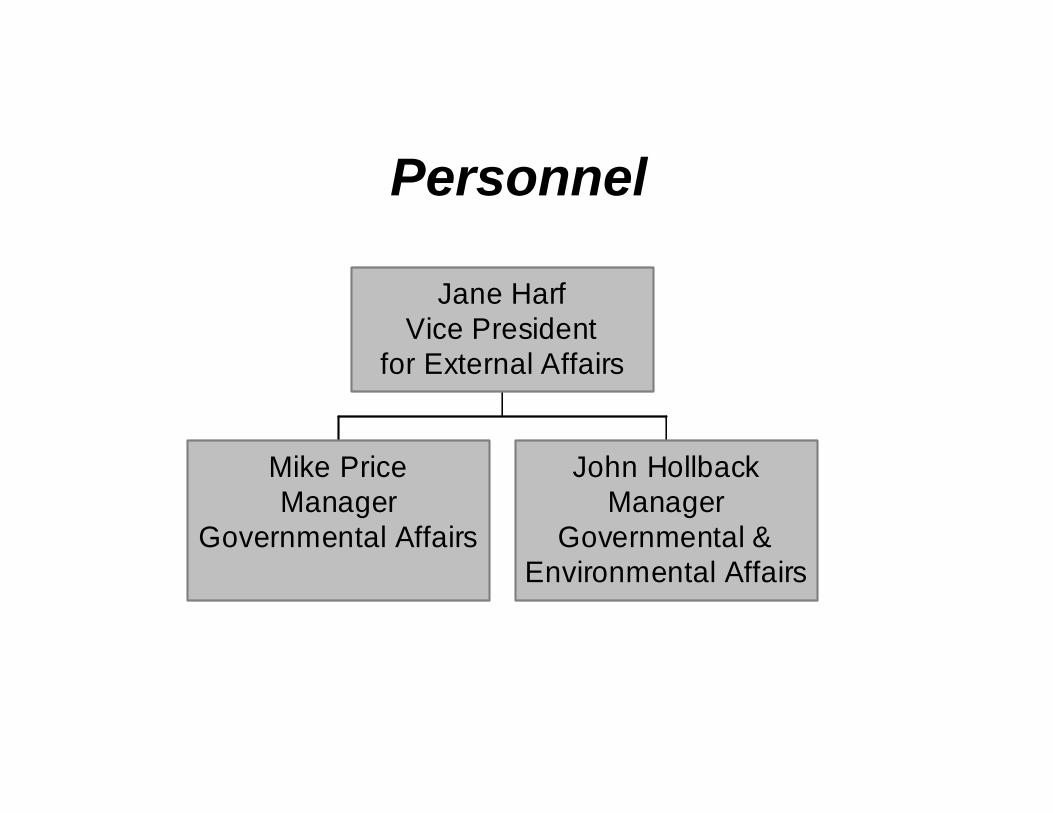
Personnel
Mike PriceManager
Governmental Affairs
John HollbackManager
Governmental &Environmental Affairs
Jane HarfVice President
for External Affairs
Distribution OperationsGene Jensen, Vice President
Our Mission – Bringing comfort to our customers, supporting businessand commerce, and building strong communities.

Who are we?• Gene Jensen- Vice President of Distribution Operations
– Reporting to Gene-• Tim Seyfang- Manager of Athens District• Ed Mowrer- Manager of Canton District• John White- Manager of Chillicothe District• Don Schaal- Manager of Columbus District• Gary McGhee- Manager of Newark District• Phil Lewis- Manager of Ohio Valley District• Rick Gard- Manager of Western Ohio District• Ken Hamilton- Region Support Manager• Bob Ivinskas- Region Support Manager• Tom Lukowski- Region Support Manager• Terry Deskins- DDC Manager• Joel Trad- Reliability/Forestry Manager• Lynette Carozza- Senior Administrative Associate
DISTRIBUTION OPERATIONS
• PRIMARY AREAS OF FOCUS
– Safety– Customer Satisfaction/Reliability– Employee Development– Major Outage Restoration
Safety• Safety is our main focus with the
community and our employees• How we promote safety
– Safety stand-down days– Job briefings/safety huddles– Safety councils and meetings– Promote world class safety standards
DISTRIBUTION OPERATIONS

Customer Satisfaction/Reliability
• What are our goals in customer satisfaction and reliability?– To deliver the best service in a timely manner to
our customers in ways that improve their quality of life
- To meet or exceed our customers’ expectations
DISTRIBUTION OPERATIONS

Employee Development• Respect our people and give them the
opportunity to be as successful as they can be
• Promote diversity (everyone counts)• Promote trust, teamwork and work/life
balance• Provide the best work environment for all of
our employees
DISTRIBUTION OPERATIONS
Major Outage Restoration• To restore the power to all of our customers
in a safe and timely manner (incident command system)
• To assist our fellow utilities with outages due to hurricanes or other weather related events
• To improve our reliability and utilize employee ideas for continuous improvement
DISTRIBUTION OPERATIONS
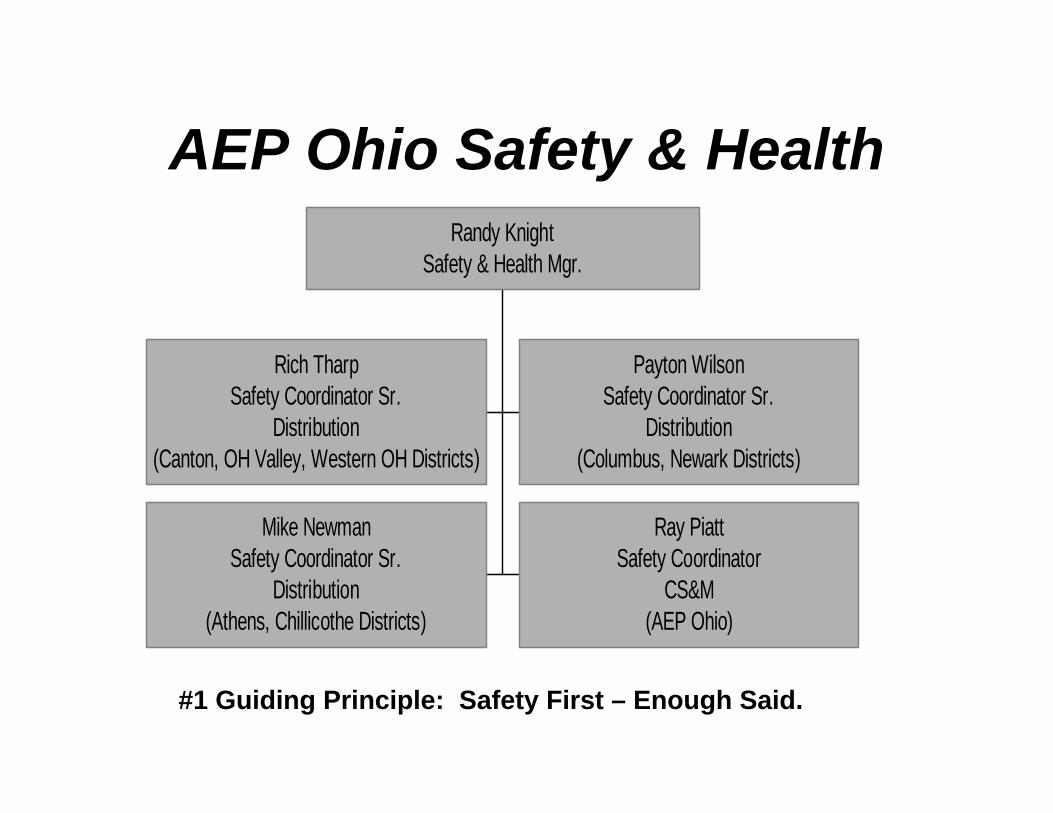
AEP Ohio Safety & Health
Rich TharpSafety Coordinator Sr.
Distribution(Canton, OH Valley, Western OH Districts)
Payton WilsonSafety Coordinator Sr.
Distribution(Columbus, Newark Districts)
Mike NewmanSafety Coordinator Sr.
Distribution(Athens, Chillicothe Districts)
Ray PiattSafety Coordinator
CS&M(AEP Ohio)
Randy KnightSafety & Health Mgr.
#1 Guiding Principle: Safety First – Enough Said.
AEP Ohio Safety & Health
• Safety consultants• Record, track & analyze safety incidents• Coach investigation teams• Safety observations/crew visits/inspections• Develop & implement safety training• Rules & procedures/compliance issues• Share best practices
Safety Team Responsibilities
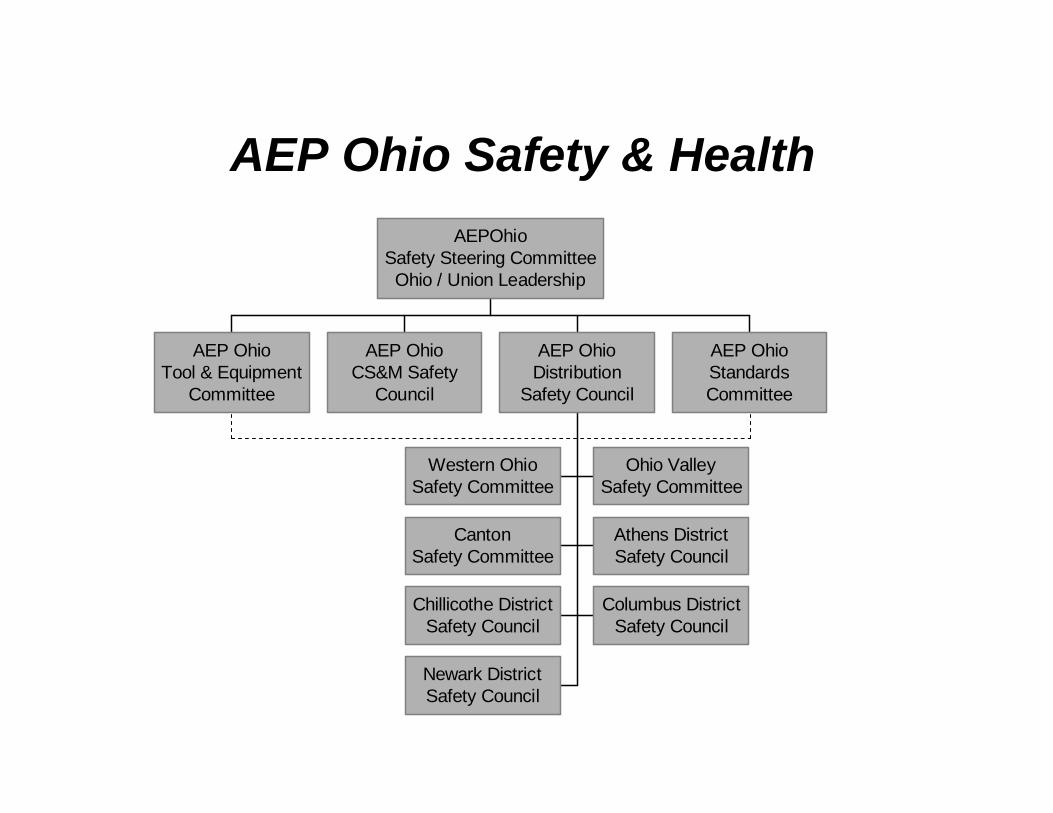
AEP OhioTool & Equipment
Committee
AEP OhioCS&M Safety
Council
Western OhioSafety Committee
Ohio ValleySafety Committee
CantonSafety Committee
Athens DistrictSafety Council
Chillicothe DistrictSafety Council
Columbus DistrictSafety Council
Newark DistrictSafety Council
AEP OhioDistribution
Safety Council
AEP OhioStandardsCommittee
AEPOhioSafety Steering Committee
Ohio / Union Leadership
AEP Ohio Safety & Health

AEP Ohio Safety & Health
• Daily safety huddles• Near miss / hazard recognition reporting• Stretch & flex• Circle for safety• Daily safety messages, radios,
handhelds, laptops• Safety stand down days• Behind the wheel driver training
Safety Activities

AEP Ohio Injury Performance
0
10
20
30
40
50
60
70
Jan Feb Mar Apr May June July Aug Sept Oct Nov Dec
Num
ber o
f Inj
urie
s Ye
ar T
o Dat
e
2004
2003
2006
Target << 37 in 2006 Effective: February 1, 2006
2006 Goal
JANUARY THEME: Rebrief if scope of work or employees change during the
job.
4
2
7
9
0123456789
10
2006 YTDRecordable
Injuries
2005 YTDRecordable
Injuries
2004 YTDRecordable
Injuries
2003 YTDRecordable
Injuries
2005
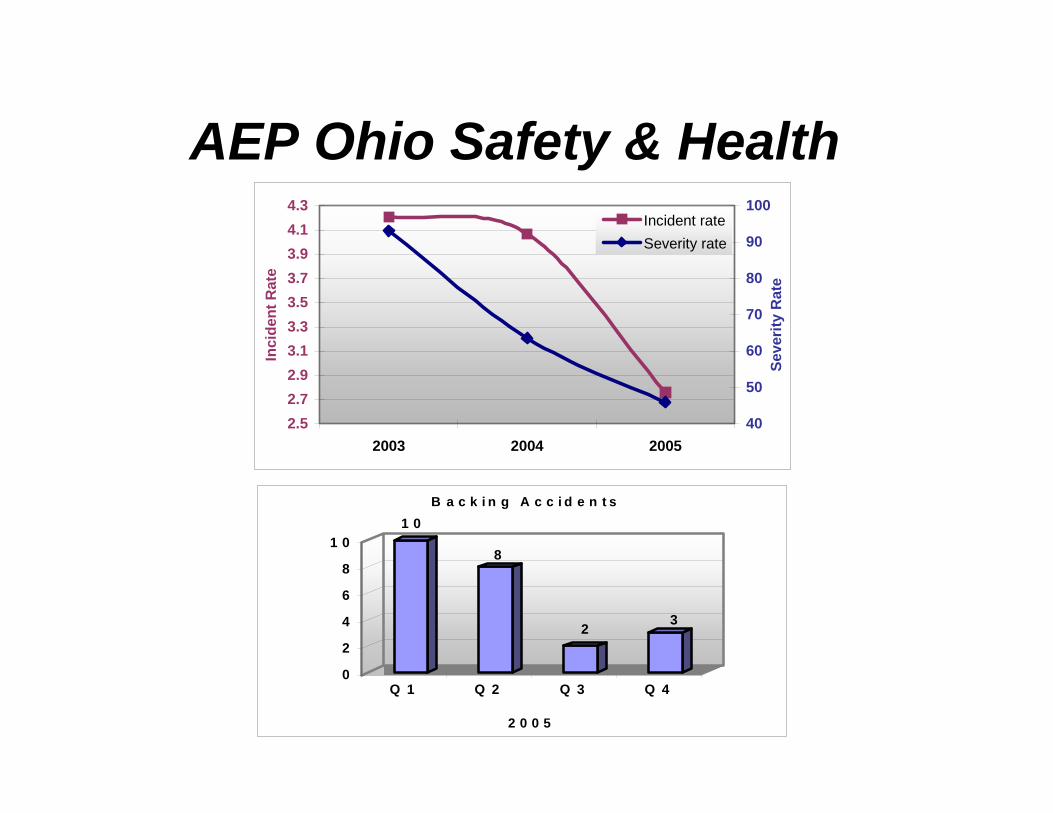
AEP Ohio Safety & Health
2.52.72.93.13.33.53.73.94.14.3
2003 2004 2005
Inci
dent
Rat
e
40
50
60
70
80
90
100
Seve
rity
Rat
e
Incident rateSeverity rate
1 0
8
2 3
0
2
4
6
8
1 0
Q 1 Q 2 Q 3 Q 4
2 0 0 5
B a c k i n g A c c i d e n t s
Business OperationsSupport Matt Kyle, Director
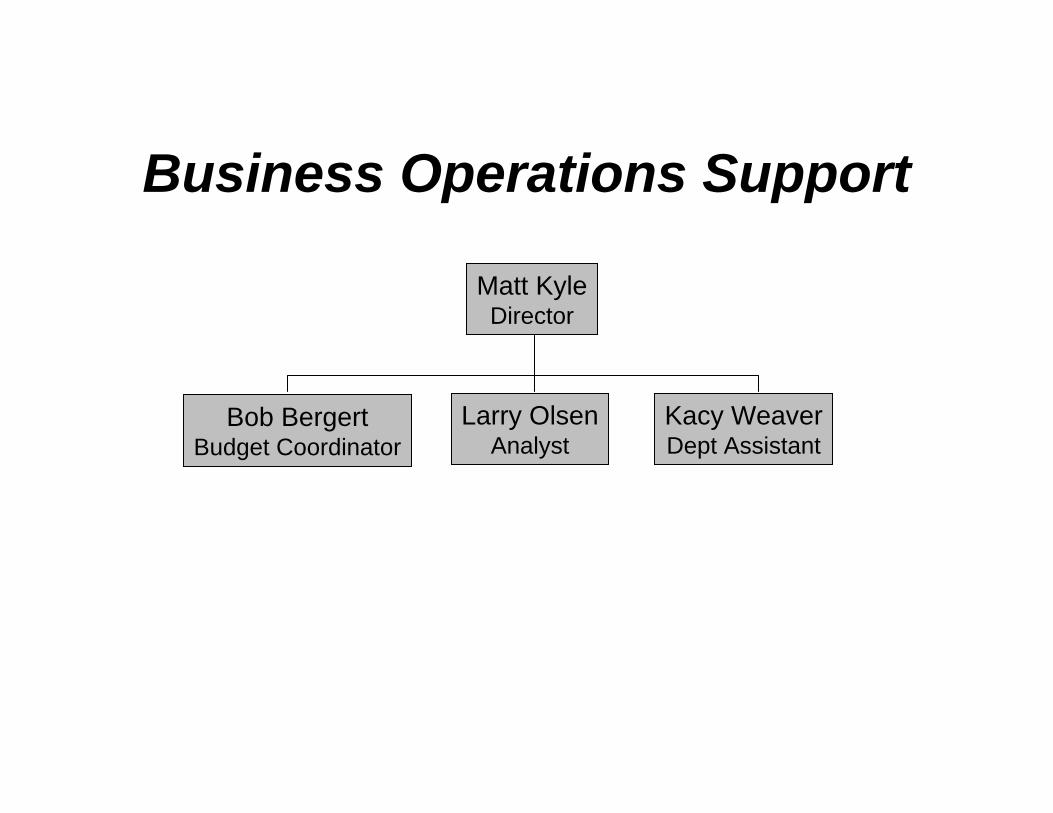
Business Operations Support
Matt KyleDirector
Bob BergertBudget Coordinator
Larry OlsenAnalyst
Kacy WeaverDept Assistant
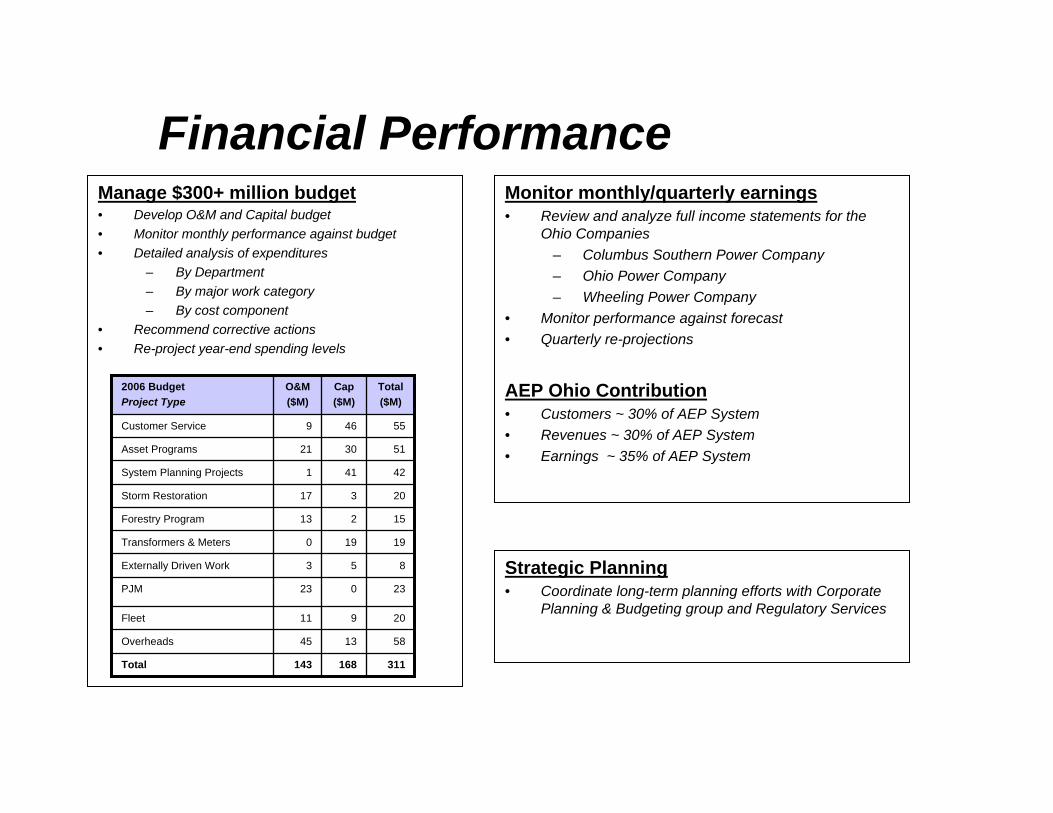
Financial PerformanceManage $300+ million budget• Develop O&M and Capital budget• Monitor monthly performance against budget• Detailed analysis of expenditures
– By Department– By major work category– By cost component
• Recommend corrective actions• Re-project year-end spending levels
Monitor monthly/quarterly earnings• Review and analyze full income statements for the
Ohio Companies– Columbus Southern Power Company– Ohio Power Company– Wheeling Power Company
• Monitor performance against forecast• Quarterly re-projections
AEP Ohio Contribution• Customers ~ 30% of AEP System• Revenues ~ 30% of AEP System• Earnings ~ 35% of AEP System
23023PJM
20911Fleet
20317Storm Restoration
42411System Planning Projects
513021Asset Programs
55469Customer Service
853Externally Driven Work
19190Transformers & Meters
581345Overheads
311168143Total
15213Forestry Program
Total($M)
Cap($M)
O&M($M)
2006 BudgetProject Type
Strategic Planning• Coordinate long-term planning efforts with Corporate
Planning & Budgeting group and Regulatory Services

Performance Targets
Monitor performance against targets
Net Income
O&M Budget
Capital Budget
SAIFI
CAIDI
SAIDI
Commission Complaints
Customer Satisfaction
Accident Rate
Severity Rate
Vehicle Accidents
Financial Targets Reliability Targets Customer Targets Safety Targets
Report quarterly performance to Chairman
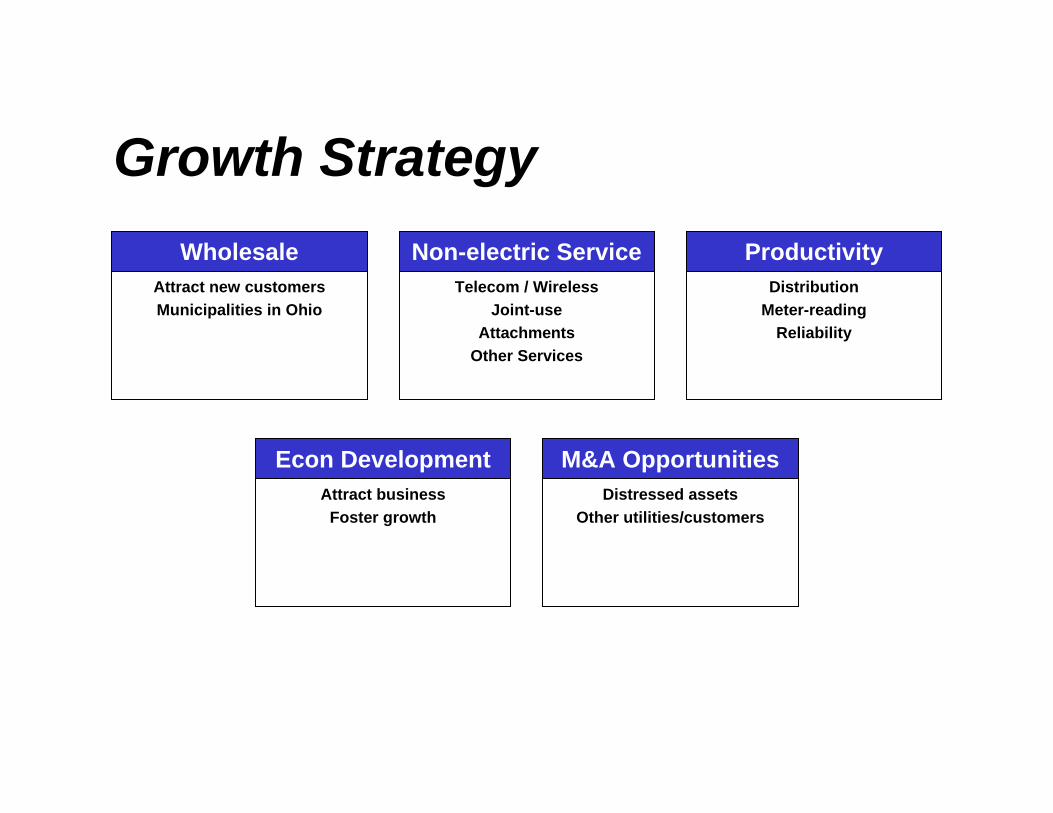
Growth Strategy
Attract new customersMunicipalities in Ohio
WholesaleTelecom / Wireless
Joint-useAttachments
Other Services
Non-electric Service
Attract businessFoster growth
Econ DevelopmentDistressed assets
Other utilities/customers
M&A Opportunities
DistributionMeter-reading
Reliability
Productivity
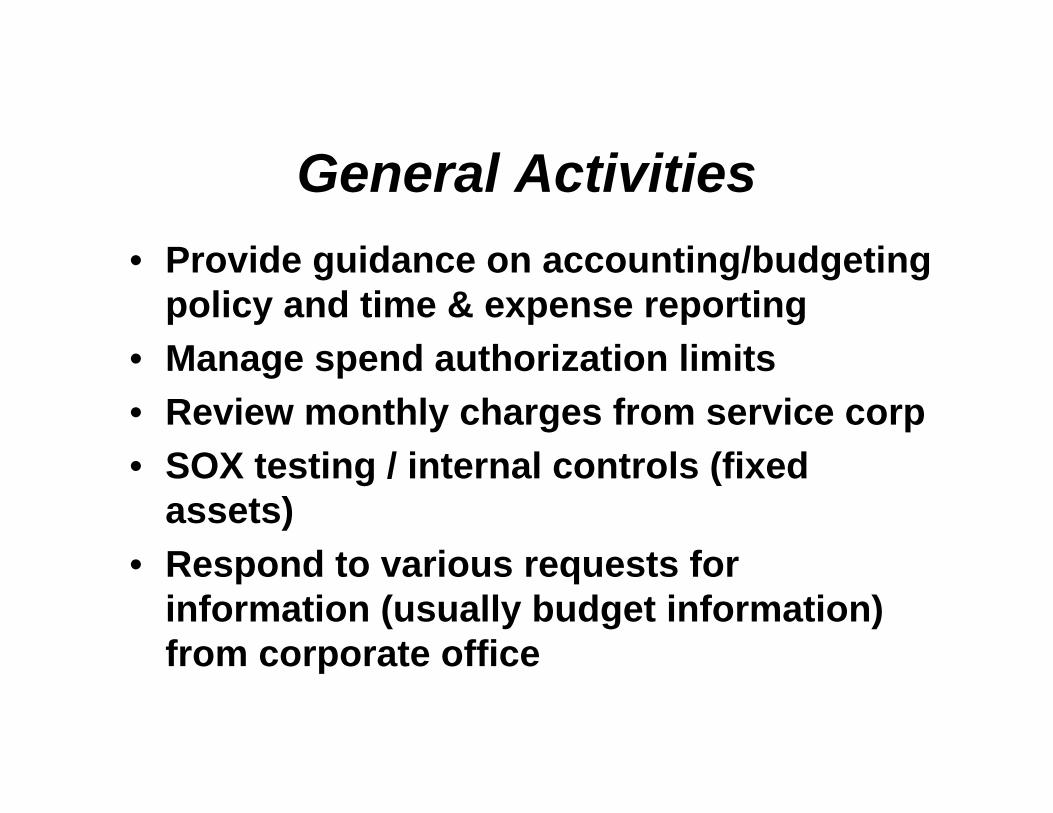
General Activities• Provide guidance on accounting/budgeting
policy and time & expense reporting• Manage spend authorization limits• Review monthly charges from service corp• SOX testing / internal controls (fixed
assets)• Respond to various requests for
information (usually budget information) from corporate office

Customer Services and MarketingKaren Sloneker, Director

Customer Services and Marketing
• Customer Service and Marketing– Managed accounts– Small commercial and industrial– Residential
• Meter Revenue Operations– Meter reading– Field specialists (Collections)– Meter services– Revenue protection

What are Managed Accounts?
• Large Commercial, Industrial or Municipal customers• Account demands are typically greater than 750 kW• Technically complex or politically sensitive accounts• Largest industrial customers managed by engineers;
other accounts managed by engineers or other technically experienced personnel with excellent interpersonal skills
• Account managers provide a single point of contact for those customers and handle service, reliability and account maintenance needs.

AEP Ohio Revenue
35%
24%
41% ResidentialOther C&I AcctsMgd C&I Accts
AEP Ohio Customers
1,279,155
179,221 1,044
Residential
Other C&I Accts
Mgd C&I Accts
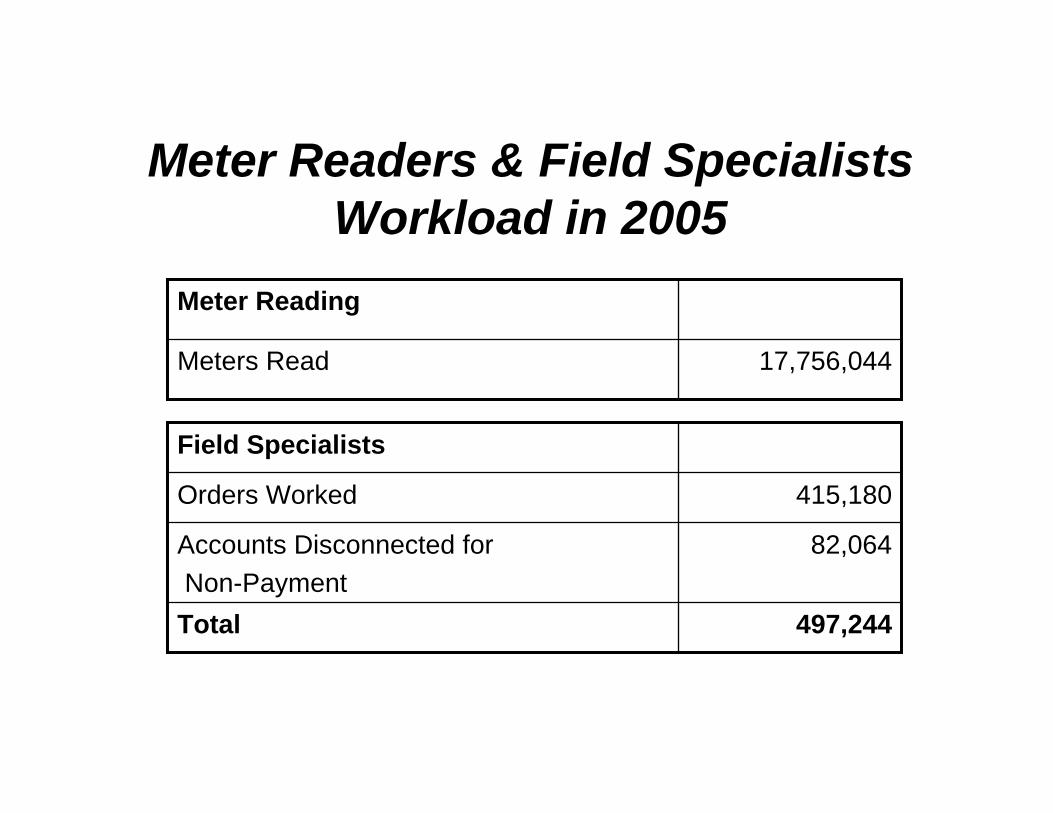
Meter Readers & Field Specialists Workload in 2005
82,064Accounts Disconnected forNon-Payment
Field Specialists
497,244Total
415,180Orders Worked
17,756,044Meters Read
Meter Reading
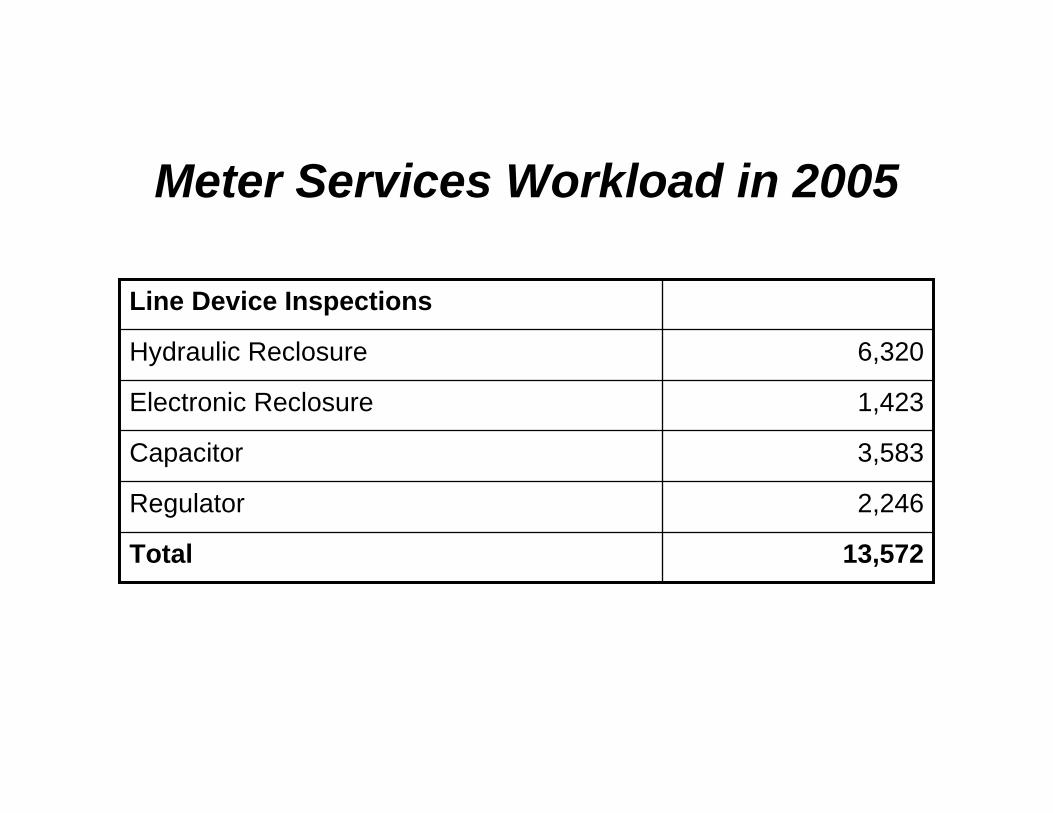
Meter Services Workload in 2005
Line Device Inspections
13,572Total
2,246Regulator
3,583Capacitor
1,423Electronic Reclosure
6,320Hydraulic Reclosure

Meter Services Workload in 2005
11,358Total155CT Inspections
6,047Maintenance967Samples
4,189PeriodicMeter Maintenance
166,692Total28,222Device Testing and Investigation Orders3,955Open/Close/New Install Orders1,119Disconnect/Reconnect/Credit Orders
133,396Change OrdersMiscellaneous Meter Work

Organizational Overview
11 Supervisors173 Non-Exempt14 Administrative
Douglas IckesManager MRO East
13 Supervisors139 Non-Exempt
Steve DeskinsManager MRO West
Chuck JenningsCS&M Supervisor
16 CSR's
Greg EarlManager CS&M Columbus
7 CSE's
Susanne HagansCS&M Supervisor
14 CSR's
Jon WilliamsManager CS&M Canton
10 CSE's
Mark GundelfingerManager CS&M Chillicothe
2 CSE's10 CSR's
Karen SlonekerDirector CS&M
American Electric PowerTransmission Overview
Delegation From GhanaFebruary 7, 2006
Delegation From GhanaDelegation From GhanaFebruary 7, 2006February 7, 2006
Max ChauManager
East Transmission PlanningTransmission Asset Management
American Electric Power
Max ChauMax ChauManagerManager
East Transmission PlanningEast Transmission PlanningTransmission Asset ManagementTransmission Asset Management
American Electric PowerAmerican Electric Power
=
ERCOTERCOT
ECARECAR
SPPSPP
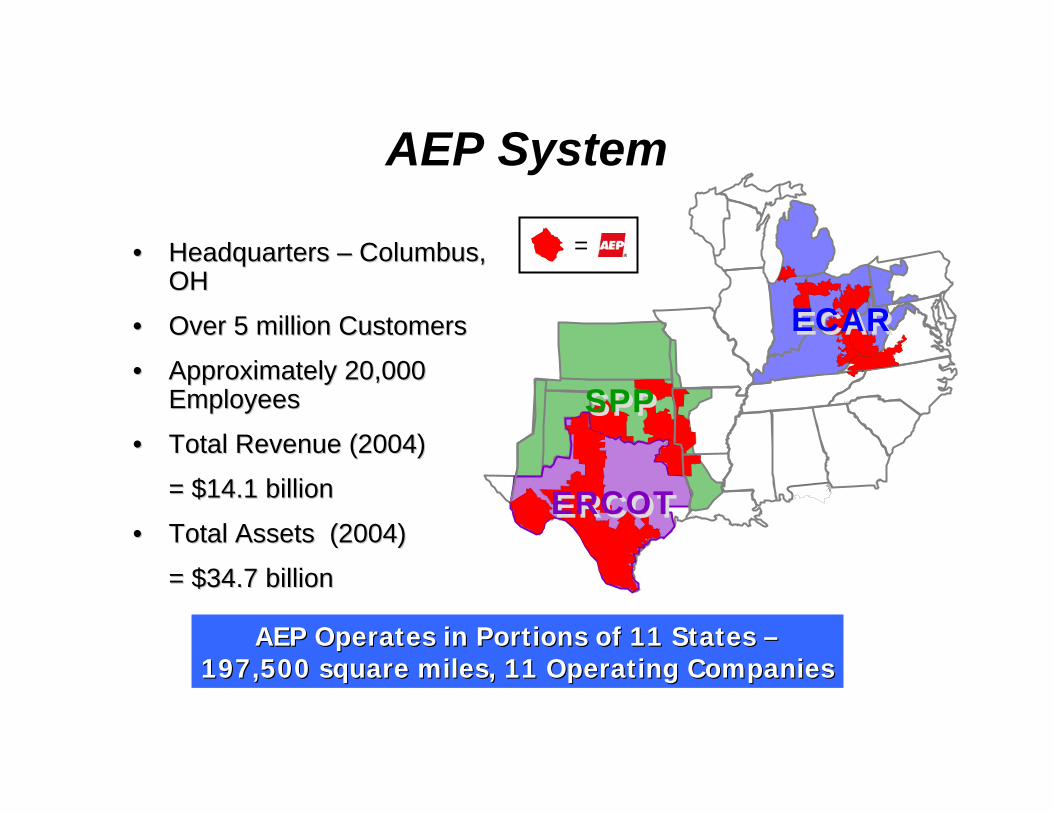
AEP System
• Headquarters – Columbus, OH
• Over 5 million Customers
• Approximately 20,000 Employees
• Total Revenue (2004)
= $14.1 billion
• Total Assets (2004)
= $34.7 billion
•• Headquarters Headquarters –– Columbus, Columbus, OHOH
•• Over 5 million CustomersOver 5 million Customers
•• Approximately 20,000 Approximately 20,000 EmployeesEmployees
•• Total Revenue (2004)Total Revenue (2004)
= $14.1 billion= $14.1 billion
•• Total Assets (2004)Total Assets (2004)
= $34.7 billion= $34.7 billion
AEP Operates in Portions of 11 States –197,500 square miles, 11 Operating Companies
AEP Operates in Portions of 11 States AEP Operates in Portions of 11 States ––197,500 square miles, 11 Operating Companies197,500 square miles, 11 Operating Companies
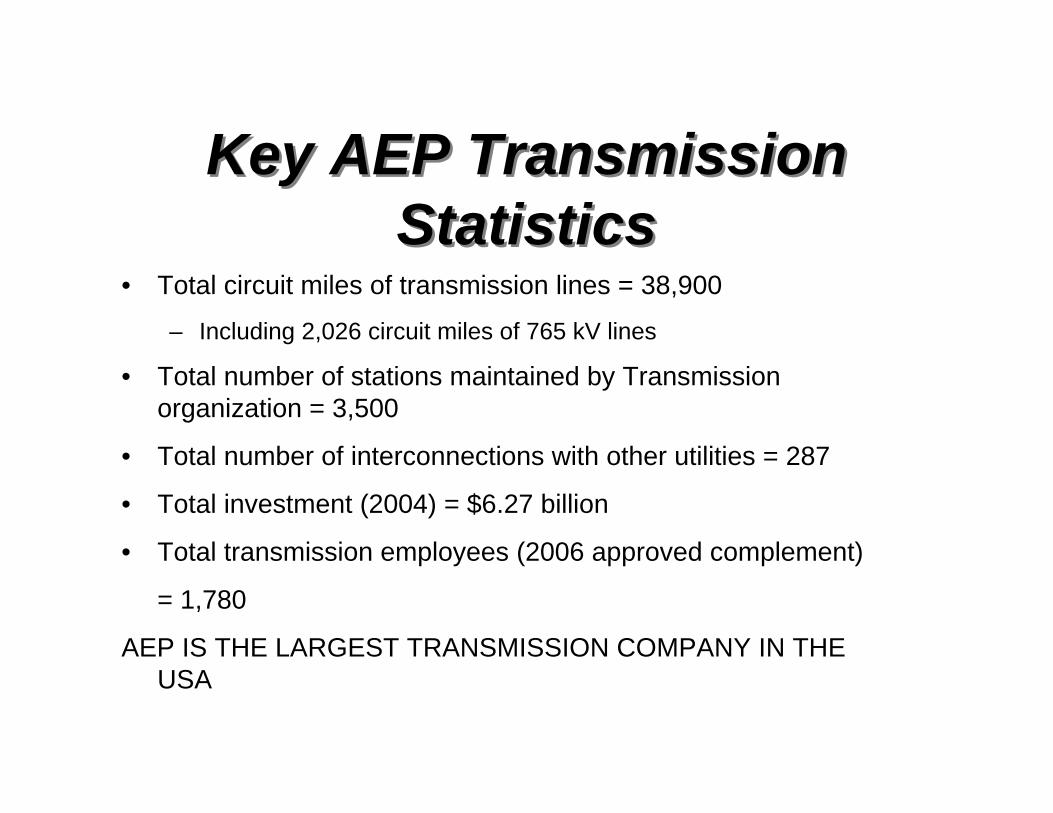
Key AEP Transmission Statistics
Key AEP Transmission Statistics
• Total circuit miles of transmission lines = 38,900
– Including 2,026 circuit miles of 765 kV lines
• Total number of stations maintained by Transmission organization = 3,500
• Total number of interconnections with other utilities = 287
• Total investment (2004) = $6.27 billion
• Total transmission employees (2006 approved complement)
= 1,780
AEP IS THE LARGEST TRANSMISSION COMPANY IN THE USA
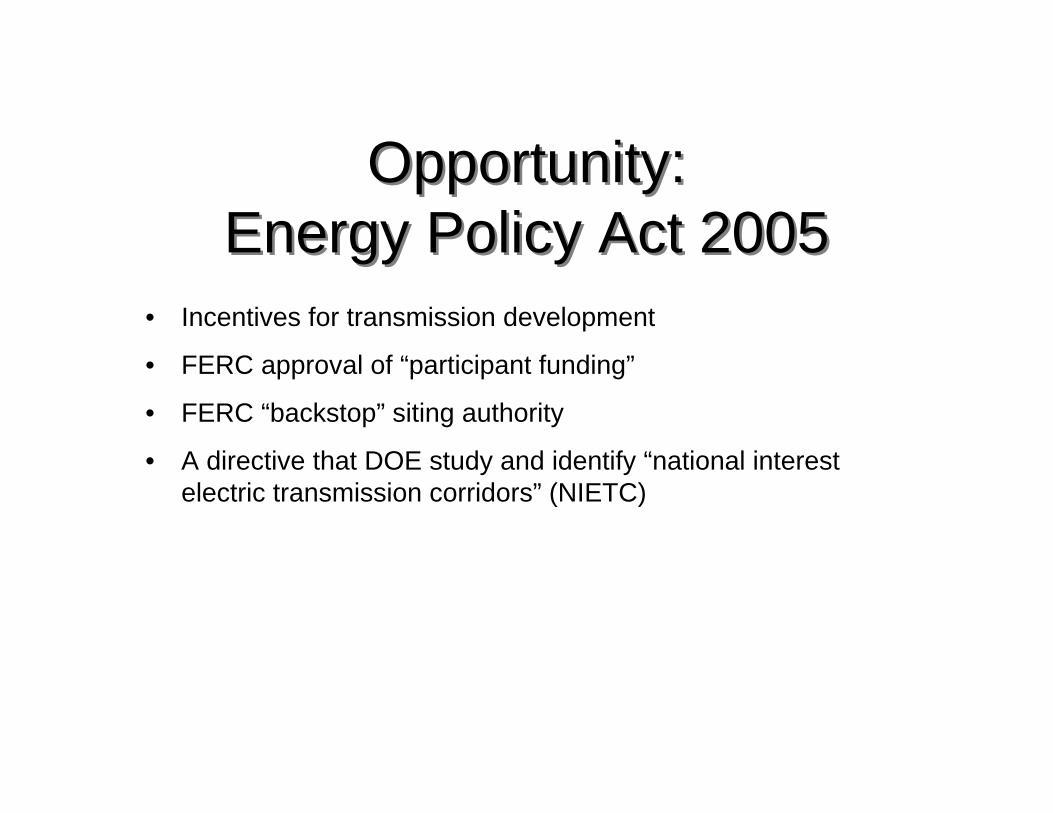
Opportunity:Energy Policy Act 2005
Opportunity:Energy Policy Act 2005
• Incentives for transmission development
• FERC approval of “participant funding”
• FERC “backstop” siting authority
• A directive that DOE study and identify “national interest electric transmission corridors” (NIETC)
Transmission OpportunitiesTransmission Opportunities• Incentives for transmission development
to achieve:
–Economic opportunity (i.e., market efficiency)
–Environmental optimization
–National security

Benefit of 765 kVOver Lower Voltage Lines
Benefit of 765 kVOver Lower Voltage Lines
Note: Approximate relationship based on Surge Impedance Loading (i.e., reactive power balance point) of 138 kV lines with single conductor per phase (double circuit) compared to 765 kV single circuit lines with four conductors per phase.
200 ft. 1500 ft.
For long distance transmission (longer than 100 miles), one 765 kV line on a 200-foot-wide right-of-way can carry the same amount of energy as 138 kV double circuit tower lines on fifteen 100-foot-wide rights-of-way, having a combined width of 1,500 feet.

Benefit of 765 kVOver Lower Voltage Lines
Benefit of 765 kVOver Lower Voltage Lines
For long distance transmission (longer than 100 miles), one 765 kV line on a 200-foot-wide right-of-way can carry the same amount of energy as 345 kV lines on five 150-foot-wide rights-of-way, having a combined width of 750 feet.
Note: Approximate relationship based on Surge Impedance Loading (i.e., reactive power balance point) of 345 kV single circuit tower lines with two conductors per phase compared to 765 kV single circuit lines with four conductors per phase.
200 ft. 750 ft.

Asset Management
Integrated capital planning, system engineering Integrated capital planning, system engineering and maintenance management processes that and maintenance management processes that support a singular reliability performancesupport a singular reliability performance--drivendrivenstrategic approach to managing transmission assetstrategic approach to managing transmission asset
Reliability Must be Maintained and Optimized
The Concept• Each component of the power system must be capable to
perform to expectations.• Life-cycle – from concept to planning, design, engineering,
construction, operation, maintenance and replacement – of each component must be carefully optimized for its entire life-cycle.
• Local area reinforcement must be considered in the optimization.
• Performance Management is key to optimization.• R&D effort is needed to meet new requirements.
The ConceptThe Concept• Each component of the power system must be capable to
perform to expectations.• Life-cycle – from concept to planning, design, engineering,
construction, operation, maintenance and replacement – of each component must be carefully optimized for its entire life-cycle.
• Local area reinforcement must be considered in the optimization.
• Performance Management is key to optimization.• R&D effort is needed to meet new requirements.
Always keeping Reliability as the focusAlways keeping Reliability as the focusAlways keeping Reliability as the focus
Reliability Must be Maintained and Optimized
The ProcessThe Process• Establish databases to determine critical component data,
including:– Types of equipment– Age and condition– Failure history– O&M and replacement records
• Analyze and monitor asset conditions and actual performance data to optimize system improvements, equipment replacement, rehabilitation, and O&M strategies.
• Conduct root-cause analysis to address the causes – not the symptoms.
• Evaluate actual performance to assure focus on reliability.
• Develop standards to adopt “best practices.”• Eliminate process bottlenecks from planning
to operation.• Develop information tools for feedback into
process improvement.• Replace obsolete or high maintenance
equipment with new technology.• Develop a long-term view to capture
economies of scale and procurement savings.
Optimize by Identifying OpportunitiesOptimize by Identifying Opportunities
Summary• AEP’s large transmission infrastructure and
potential growth give rise to unprecedented asset management challenges
• A reliability-focused Transmission Asset Management Optimization approach has helped AEP effectively deal with unprecedented changes in the industry.
• A reliability-focused Transmission Asset Management Optimization approach is expected to continue to be used effectively to deal with new emerging issues.
• AEP’s large transmission infrastructure and potential growth give rise to unprecedented asset management challenges
• A reliability-focused Transmission Asset Management Optimization approach has helped AEP effectively deal with unprecedented changes in the industry.
• A reliability-focused Transmission Asset Management Optimization approach is expected to continue to be used effectively to deal with new emerging issues.
IGCC: A Coal-Based Generation Option for the Future
Presentation to Ghana Delegation & GuestsColumbus, OH
February 7, 2006
Dale E. HeydlauffVice President-New Generation
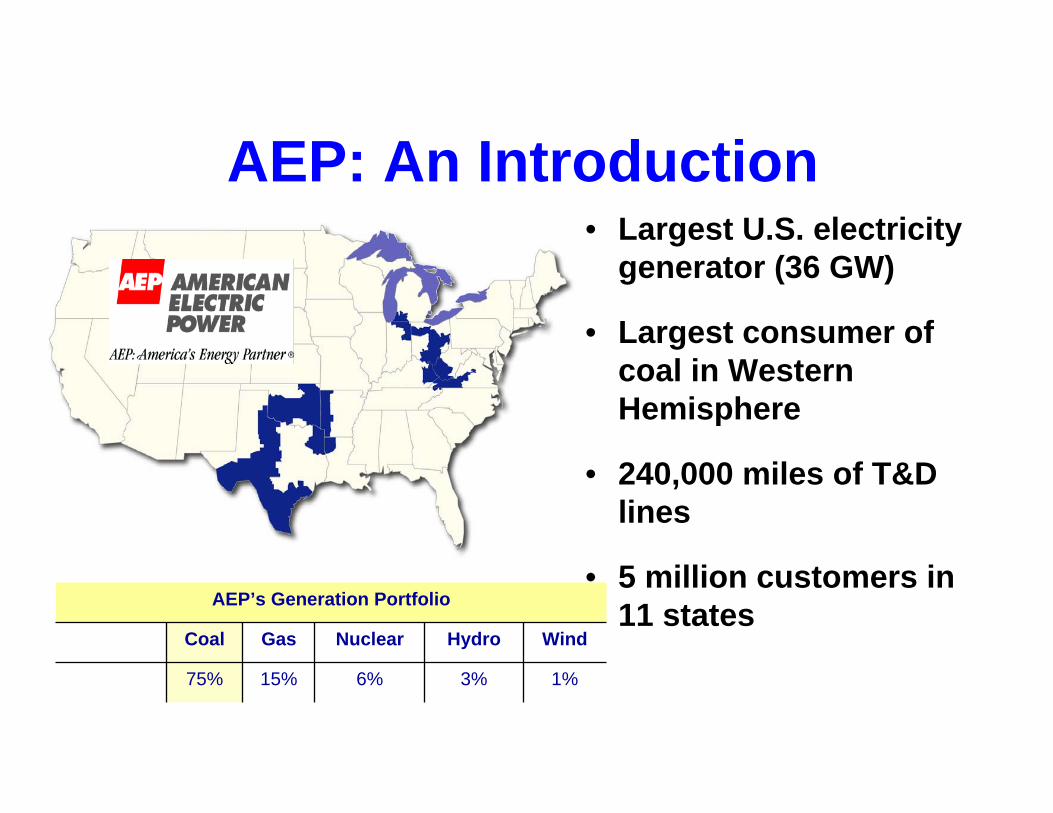
AEP: An Introduction• Largest U.S. electricity
generator (36 GW)
• Largest consumer of coal in Western Hemisphere
• 240,000 miles of T&D lines
• 5 million customers in11 states
WindHydroNuclearGasCoal
1%3%6%15%75%
AEP’s Generation Portfolio
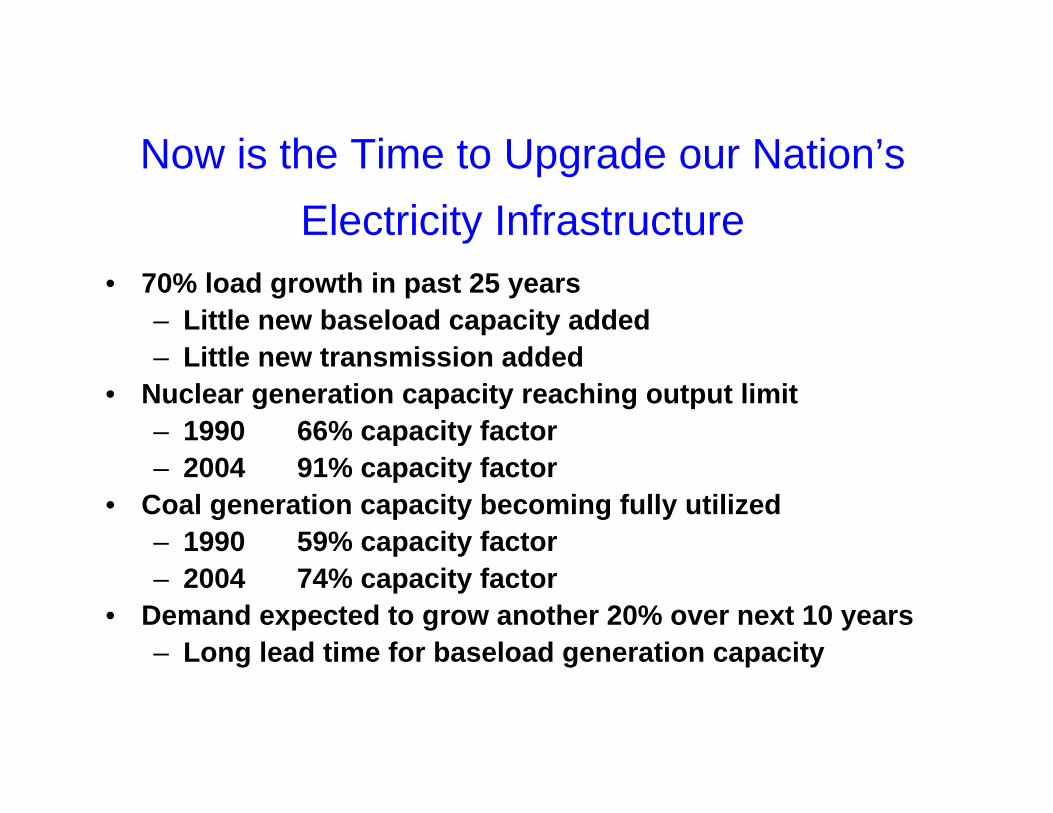
Now is the Time to Upgrade our Nation’s Electricity Infrastructure
• 70% load growth in past 25 years– Little new baseload capacity added– Little new transmission added
• Nuclear generation capacity reaching output limit– 1990 66% capacity factor – 2004 91% capacity factor
• Coal generation capacity becoming fully utilized– 1990 59% capacity factor– 2004 74% capacity factor
• Demand expected to grow another 20% over next 10 years– Long lead time for baseload generation capacity
Electric Power’s Future• Population growth and increased electrification
requires about 250-300 GW of baseload generating capacity over next 25 years
• No silver bullet … Need a portfolio• Future demand probably met largely by coal:
– Gas supply issues and price volatility in North America
– LNG imports will exacerbate U.S. trade imbalance
– Nuclear could be revived, but probably decades away from a major resurgence
– Renewables (particularly wind) promising, but infrastructure/intermittency limits penetration
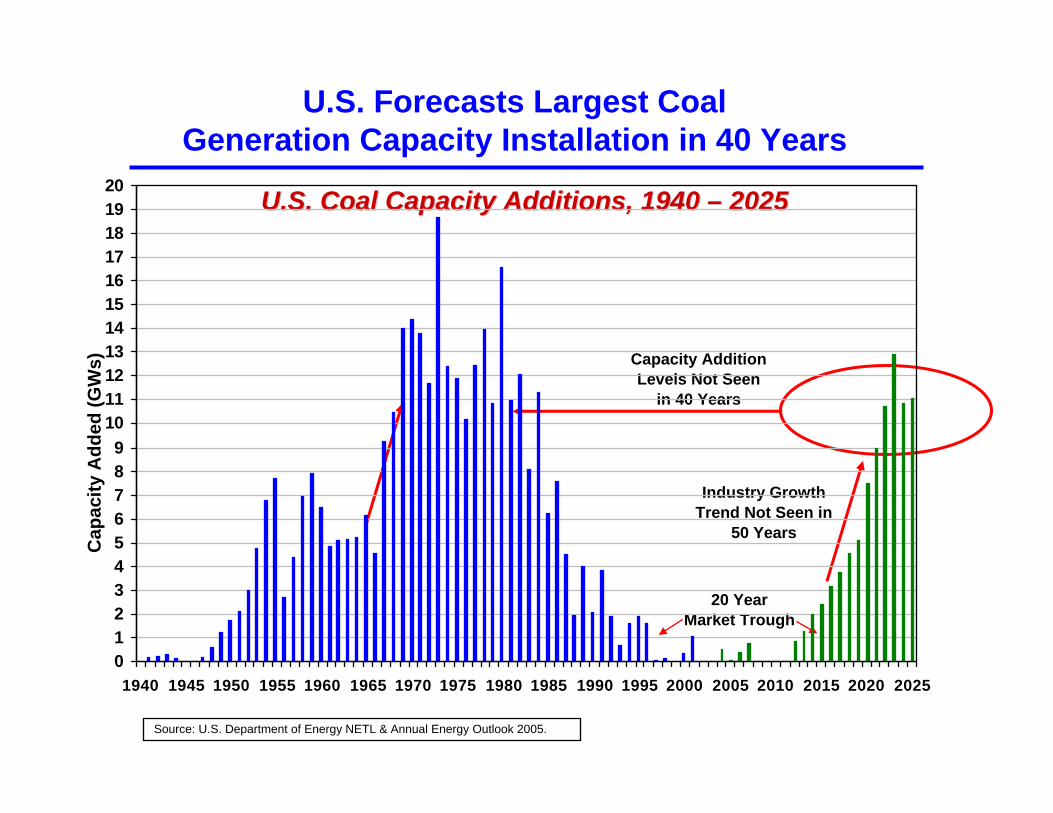
U.S. Forecasts Largest Coal Generation Capacity Installation in 40 Years
Source: U.S. Department of Energy NETL & Annual Energy Outlook 2005.
Cap
acity
Add
ed (G
Ws) Capacity Addition
Levels Not Seen in 40 Years
Industry Growth Trend Not Seen in
50 Years
20 YearMarket Trough
U.S. Coal Capacity Additions, 1940 U.S. Coal Capacity Additions, 1940 –– 20252025
0123456789
1011121314151617181920
1940 1945 1950 1955 1960 1965 1970 1975 1980 1985 1990 1995 2000 2005 2010 2015 2020 2025

Emissions from CoalEmissions from Coal--Fueled Generating PlantsFueled Generating Plants
* EstimateSource: EPA’s Clean Air Markets database; EIA 2004 Annual Energy Outlook; GE Energy; SFA Pacific.
0
0.1
0.2
0.3
0.4
0.5
0.6
0.7
0.8
0.9
1
Poun
ds P
er M
illio
n B
tu
Sulfur DioxideNitrogen Oxide
U.S.Average
2004*
Clean AirInterstate
Rule2010
New Midwest
Mine-mouth
Clean AirInterstate
Rule2015
0.10
0.340.39
0.16
0.26
0.120.182
0.07 0.06
0.94
New PRB Plant
Near-Zero
FutureGenGoals
0.030.06
New IGCCProjection
ExistingIGCC
(PermitLevel)
0.17
0.08
The Path Toward Near-Zero Emissionsfrom Coal-Fueled Generating Plants

Sulfur
CO2Low Temp Gas Cooling
Shift Rx(option)
HgRemoval
ParticulateScrubber
GE"Quench"Gasifier
Slag/Frit
Coal
H2O
+
Air Separation Unit (ASU)
O2
Slurry
Acid Gas Removal
CO/H2
Fines/Char
Flexibility for CO2 Sequestration
(Concentrated Stream)
Sulfur RecoveryClaus/Scot
PRE-COMBUSTIONTreatment of Pollutants
•High pressure•Low Volume•Concentrated stream(easier to treat)
Air
Sulfur RecoveryClaus/Scot
Combustion Turbine
Compressed Air to ASU
HRSG
Steam Turbine
Electricity
Electricity
90+%Removal
98+%Removal
Courtesy Eastman Gasification Services
IGCC Overview

Integrated Gasification Combined Cycle’s Promise
• Lowest capital cost (when mature) coal-based technology
• Feedstock & product flexibility (with added cost)– Coal, petcoke, or biomass feedstocks– Electricity, steam, syngas, liquid fuels, or chemical products
• Most efficient coal-based technology (when mature)• Best emission characteristics among coal-based
technologies• Most carbon-friendly coal technology• The technology of choice to KEEP COAL IN THE MIX
– Strategically important to the energy security and economies of many states and the U.S.

Costs of Electricity from New Fossil Fuel Power Plants with & without CO2 Capture
0102030405060708090
NGCC F525 MW($3.50NG)
NGCC 525 MW($5 NG)
IGCC F520 MW
USC PC600 MW
COE $MWh with Capture& Sequestration
COE $/MWh with CO2Capture
COE $/MWh w/outCapture
$/M
Wh
Source: EPRI

AEP’s Strategy• Asset diversification and optimization
– Multi-fuels (coal, gas, renewables)
• Coal has important long-run role– Substantial air emissions compliance:
~$5 billion in retrofit controls thru 2020– AEP Board Report (August 2004) “An
Assessment of AEP’s Actions to Mitigate the Economic Impacts of Emissions Policies” committed AEP to being an industry leader in development of IGCC technology
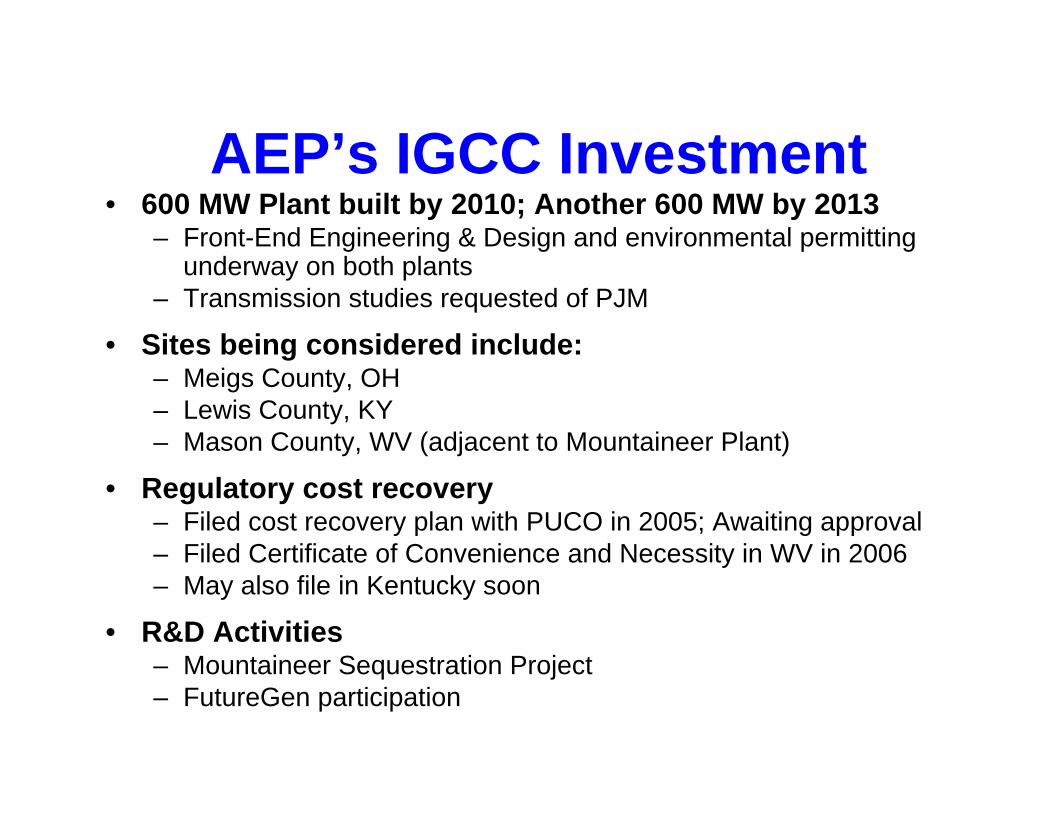
AEP’s IGCC Investment• 600 MW Plant built by 2010; Another 600 MW by 2013
– Front-End Engineering & Design and environmental permitting underway on both plants
– Transmission studies requested of PJM
• Sites being considered include: – Meigs County, OH– Lewis County, KY– Mason County, WV (adjacent to Mountaineer Plant)
• Regulatory cost recovery– Filed cost recovery plan with PUCO in 2005; Awaiting approval– Filed Certificate of Convenience and Necessity in WV in 2006– May also file in Kentucky soon
• R&D Activities– Mountaineer Sequestration Project– FutureGen participation
Leadership• Choosing IGCC is not just a technology
decision; it’s a leadership decision– If not AEP, then who?– If not coal, then what?
• Being a leader has its perils and risks– Partnerships and cooperation are necessary for
success
• Federal and State Governments have a critical role– Provide incentives and remove roadblocks
Top Related