


Languages
Pages
Legal


Novel Methane, Ethane, and Propane Oxidizing Bacteria at Marine Hydrocarbon Seeps
Identified by Stable Isotope Probing
Running Title: Novel Methane, Ethane, and Propane Oxidizing Bacteria
Section: Microbial Ecology
Molly C. Redmond 1, 2, David L. Valentine 2, 3 *, Alex L. Sessions 4
1 Graduate Program in Marine Science, University of California, Santa Barbara
2 Department of Earth Science, University of California, Santa Barbara, CA 93106
3 Marine Science Institute, University of California, Santa Barbara, CA 93106
4 Division of Geological and Planetary Sciences, California Institute of Technology, Pasadena,
CA, 91125
*Corresponding author
Department of Earth Science, University of California, Santa Barbara, CA 93106
phone: (805)893-2973
fax: (805)893-2314
e-mail: [email protected].
Copyright © 2010, American Society for Microbiology and/or the Listed Authors/Institutions. All Rights Reserved.Appl. Environ. Microbiol. doi:10.1128/AEM.00271-10 AEM Accepts, published online ahead of print on 30 July 2010

1
Abstract 1
Marine hydrocarbon seeps supply oil and gas to microorganisms in sediments and 2
overlying water. We used stable isotope probing (SIP) to identify aerobic bacteria oxidizing 3
gaseous hydrocarbons in surface sediment from the Coal Oil Point seep field, offshore Santa 4
Barbara, California. After incubating sediment with 13C-labeled methane, ethane, or propane, we 5
confirmed the incorporation of 13C into fatty acids and DNA. Terminal restriction fragment 6
length polymorphism (T-RFLP) analysis and sequencing of the 16S rRNA and particulate 7
methane monooxygenase (pmoA) genes in 13C-DNA revealed groups of microbes not previously 8
thought to contribute to methane, ethane, or propane oxidation. First, 13C methane was primarily 9
assimilated by Gammaproteobacteria from the family Methylococcaceae, Gammaproteobacteria 10
related to Methylophaga, and Betaproteobacteria from the family Methylophilaceae The latter 11
two have not been previously shown to oxidize methane and may have been cross-feeding on 12
methanol, but both were heavily labeled after just three days. pmoA sequences were affiliated 13
with the Methylococcaceae, but most were not closely related to cultured methanotrophs. 14
Second, 13C ethane was consumed by a novel group of Methylococcaceae. Growth with ethane 15
as the major carbon source has not previously been observed in the Methylococcaceae; a highly 16
divergent pmoA-like gene detected in the 13C-labeled DNA may encode an ethane 17
monooxygenase. Third, 13C propane was consumed by a group of unclassified 18
Gammaproteobacteria not previously linked to propane oxidation. This study identifies several 19
bacterial lineages as participants in the oxidation of gaseous hydrocarbons in marine seeps and 20
supports an alternate function for some pmoA-like genes. 21

2
Introduction 22
Hydrocarbon seeps are widespread along continental margins and emit large amounts of 23
oil and gas into the surrounding environment. This gas is primarily composed of methane, a 24
powerful greenhouse gas, of which marine hydrocarbon seeps are estimated to contribute 20 Tg 25
yr-1 to the atmosphere, about 5% of the total atmospheric flux (21, 39). Seeps of thermogenic 26
gas also release an estimated 0.45 Tg yr-1 ethane and 0.09 Tg yr-1 propane to the atmosphere 27
(20). Each of these three fluxes would be substantially larger if not for microbial oxidation in the 28
sediments and water column (68). Methane, ethane, and propane are subject to anaerobic 29
oxidation in anoxic sediments and water columns (44, 53, 68) , or to aerobic oxidation in the oxic 30
and suboxic water column and oxygenated surface sediment (10, 47, 53, 80). We focus here on 31
aerobic oxidation. 32
The majority of known aerobic methane-oxidizing bacteria are either 33
Gammaproteobacteria (type I) or Alphaproteobacteria (type II)(29), though several strains of 34
highly acidophilic methanotrophic Verrucomicrobia have also been recently isolated (63). Most 35
methanotrophs are capable of growth only on methane or other one-carbon compounds (17, 29), 36
using a methane monooxygenase enzyme to oxidize methane to methanol. There are two known 37
forms of this enzyme: soluble methane monooxygenase (sMMO) and particulate methane 38
monooxygenase (pMMO). sMMO is a soluble, di-iron-containing monooxygenase found only in 39
certain methanotrophs, and typically expressed only under low copper conditions (57). In 40
contrast, pMMO is a membrane-bound enzyme believed to contain copper and iron (26). It is 41
found in all known methanotrophs, with the exception of the genus Methylocella (16). pmoA, the 42
gene encoding the α subunit of pMMO, is often used to identify methanotrophic bacteria (54). 43
Very few methanotrophs have been cultured from marine environments (22, 49, 72, 74), but 44

3
several studies of marine methanotrophs (35, 62, 77, 82, 85) have been performed with culture-45
independent methods and have detected type I methanotrophs almost exclusively. Many of the 46
pmoA sequences from methane seep sites are quite different from those of cultured organisms, 47
suggesting that these environments may contain many novel methanotrophs (77, 82, 85). 48
Even less is known about the organisms that oxidize ethane or propane in marine 49
environments. There are a limited number of isolates, which are primarily high G+C Gram 50
positive bacteria (Nocardia, Pseudonocardia, Gordonia, Mycobacterium, and Rhodococcus) or 51
Pseudomonas species (70). Nearly all of these strains were isolated from soil and selected for 52
their ability to grow on propane or n-butane as the sole carbon source. Most propane-oxidizing 53
strains can oxidize butane, as well as a range of longer chain n-alkanes, but vary in their ability 54
to oxidize ethane. These strains show little, if any, ability to oxidize methane, and none have 55
been shown to grow with methane as the sole carbon source (13, 27, 38, 45, 65). Like methane 56
metabolism, the first step in aerobic ethane and propane metabolism is the oxidation of the 57
alkane to an alcohol (70). Several different enzymes are known to catalyze this step. Thauera 58
butanivorans uses a soluble di-iron butane monooxygenase related to sMMO to oxidize C2-C9 n-59
alkanes (18, 73). Gordonia sp. TY-5, Mycobacterium sp. TY-6 and Pseudonocardia sp. TY-7 60
contain soluble di-iron propane monooxygenases which are capable of both terminal and 61
subterminal propane oxidation and vary in their substrate range (45-46). Nocardioides sp. strain 62
CF8 is believed to have a copper-containing monooxygenase similar to pMMO and ammonia 63
monooxygenase (27-28). An alkane hydroxylase typically used to oxidize longer-chain n-alkanes 64
has also shown some ability to oxidize propane and butane, but not ethane (38). The variety of 65
enzymes and their substrate ranges makes it difficult to identify ethane or propane oxidizers with 66
a single functional gene. 67

4
In order to identify the organisms responsible for methane, ethane, and propane oxidation 68
at hydrocarbon seeps, we used stable isotope probing (SIP). SIP allows the identification of 69
organisms actively consuming a 13C-labeled substrate of interest, based on the incorporation of 70
13C into biomass, including DNA and lipids (67). We collected sediment from the Coal Oil Point 71
seep field and incubated sediment-seawater slurries with 13C methane, ethane, or propane. 72
Samples were removed at three time points, chosen to ensure sufficient 13C incorporation into 73
DNA while minimizing the spread of 13C through the community by cross-feeding on metabolic 74
byproducts. 13C-DNA was separated from 12C-DNA by CsCl density gradient ultracentrifugation, 75
and we used the fractionated DNA for T-RFLP and clone library analysis. We also measured 13C 76
incorporation into fatty acids in order to confirm significant 13C enrichment in membrane lipids, 77
to determine the carbon labeling pattern for each substrate and lipid, and to further inform the 78
composition of the microbial community. 79
80
Materials and Methods 81
Study Site and Sample Collection 82
Sediment for SIP incubations was collected from Shane Seep in the Coal Oil Point seep 83
field, offshore Santa Barbara, California (34° 24.370’ N; 119° 53.428’W; 21 m depth). Coal Oil 84
Point is one of the world’s most prolific areas of hydrocarbon seepage, emitting 2 × 10¹⁰ g yr−1 85
methane, 1.9 × 10⁹ g yr−1 ethane, 1.4 × 10⁹ g yr−1 propane, and 5.8 × 10⁶ L yr−1 of oil (9, 31). The 86
shallow, nearshore seeps are highly dynamic environments, with variable gas flux and seasonal 87
changes in sediment deposition (43). A neighboring seep, Brian Seep, has been described in 88
detail by Kinnaman et al. (43) and Treude and Ziebis (78); Shane Seep is very similar, though 89
the sediment contains more oil than at Brian Seep. At Brian Seep, convective pore water 90

5
transport allows oxygen penetration through the top centimeter of sediment and the high methane 91
oxidation rates observed in this layer are have been attributed to aerobic methane oxidation (78). 92
The distribution of chemicals in sediment pore fluids at Shane Seep suggests such convective 93
processes are also active (42). For this study, divers collected sediment from the top 1-2 cm in 94
areas of active bubbling at Shane Seep; this sediment had no detectable sulfide odor. Sediment 95
and overlying seawater were collected in sterile polypropylene tubes, and samples were kept on 96
ice until return to the laboratory. SIP incubations were prepared immediately. 97
98
SIP Incubations 99
SIP incubations were carried out with 13C-labeled methane, ethane, or propane (99% 13C, 100
Isotec). Parallel incubations used natural abundance levels of 13C for each hydrocarbon substrate 101
(referred to as 12C controls). No hydrocarbon was added to an additional control sample. 102
Sediment and overlying seawater from six 50 ml collection tubes were pooled and mixed to form 103
a slurry, of which ~25 g was added to each 125 ml serum bottle. Bottles were sealed with butyl 104
rubber stoppers and aluminum crimp caps. 5 ml hydrocarbon gas was injected into each bottle 105
and air was added as an overpressure, to allow for removal of samples for gas analysis. Samples 106
were incubated at room temperature, in the dark, with shaking at 75 rpm. Every 24-72 hours, 107
headspace concentrations of hydrocarbons, oxygen, and carbon dioxide were measured with a 108
3000A MicroGC (Agilent) equipped with a thermal conductivity detector. When the 109
hydrocarbon gas had been nearly consumed, the headspace was purged with air and an additional 110
5 ml of hydrocarbon gas was added. Oxygen concentrations in the headspace remained above 111
10% at all times. 3 ml sediment samples were removed at 3 days, 6 days, and after the second 5 112

6
ml aliquot of hydrocarbon had been consumed (9 days for methane and ethane, 14 days for 113
propane). Sediment was stored frozen until analysis. 114
115
Phospholipid fatty acid extraction, quantification, and isotopic analysis 116
Samples were lyophilized, then extracted in dichloromethane (DCM)/methanol (9:1) 117
using a microwave-assisted extraction system (CEM Mars5) at 100oC for 20 minutes with 118
stirring. The total lipid extract was collected and filtered over a GFF-A filter, and the solvent 119
removed under dry N2. The lipid extract was resuspended in 0.5ml hexane, and fatty acid 120
fractions were purified by solid-phase extraction (Phenomenex Sepra NH2, 0.5 g) with elution in 121
8.0 ml of 2% formic acid in DCM. Fatty acids were converted to their methyl esters by reaction 122
with BF3/methanol at 70°C for 20 minutes, and were extracted into 3x 10mL hexane. 123
Fatty acid structure and abundance were quantified by gas chromatography/mass 124
spectrometry/flame ionization detection (GC/MS/FID) using a Thermo Finnigan Trace/DSQ at 125
Caltech. GC separation employed a ZB-5ms column (Phenomenex; 30m × 0.25mm × 0.25µm) 126
with a programmable-temperature vaporization (PTV) injector. The effluent from the GC column 127
was split 80/20 between the MS and FID, allowing for simultaneous structure identification by 128
MS and quantitation using the FID signal by comparison to an internal standard (palmitic acid 129
isopropyl ester). No correction for relative response factors in the FID was made. 130
Stable carbon isotope ratios (δ13C values) were measured using a Thermo Finnigan GC-131
Isotope Ratio Mass Spectrometer (IRMS) at the Marine Science Institute Analytical Lab, 132
University of California, Santa Barbara. This system used a Trace GC with an Omegawax 250 133
capillary column (Supelco; 30m × 0.25mm x 0.25µm) and splitless injector, a GC combustion III 134
interface, and a Delta Plus XP mass spectrometer. The GC combustion III unit catalyzed the 135

7
oxidation of organic analytes to CO2 over Cu/Ni/Pt wire heated to 950°C, and water was 136
removed through a selectively permeable membrane. The carrier gas was helium with a flow rate 137
of 2.4 ml min-1. Peaks eluted from the GC column were converted into CO2 and analyzed by 138
IRMS. Carbon isotope ratios for each compound were measured relative to a CO2 working 139
standard with a nominal δ13C of -32.6‰. All δ13C values were normalized to a decanoic acid 140
methyl ester (C10:0) isotope standard obtained from Arndt Shimmelmann at Indiana University 141
and then corrected for the addition of the methyl group from methanol, assuming δ13Cmethanol = -142
25‰. Each sample was analyzed twice; in all cases, the atom %13C was within +/- 0.5% 13C 143
between duplicates for 13C labeled samples and within +/- 0.01% 13C for 12C controls. 144
145
CsCl Gradient Fractionation 146
Sediment DNA was extracted with the FastDNA spin kit for soil (MP Biomedicals). 12C- 147
and 13C-DNA were separated by ultracentrifugation and density gradient fractionation as 148
described by Neufeld et al. (60). Briefly, ~ 5 to 7 µg DNA were added to a CsCl solution and 149
centrifuged in a VTi 65.2 rotor (Beckman) at 177,000g for 48 to 60 hours at 20°C. Gradients 150
were separated into twelve 425 µL fractions, where fraction 1 was the heaviest and fraction 12 151
was the lightest. Density of selected fractions was checked with a refractometer (Reichert). DNA 152
was precipitated with polyethylene glycol and glycogen, washed with 70% ethanol, and eluted in 153
30 µl TRIS-EDTA buffer. The amount of DNA in each fraction was quantified with the 154
PicoGreen dsDNA assay kit (Invitrogen). 155
156
T-RFLP 157

8
T-RFLP analysis was used for initial characterization of the gradient DNA. For fractions 158
2, 4, 6, 8, 10, and 12 of each sample, the 16S rRNA gene was PCR amplified using primers 27F 159
(5’-AGAGTTTGATCCTGGCTC AG-3’, labeled with 6-carboxyfluorescein) and 1392R (5′-160
ACGGGCGGTGTGTAC-3′). Each 50-µl reaction contained 1x buffer, 1.5 mM MgCl2, 200 µM 161
each dNTP, 0.5 µM each primer, 0.2 mg/ml BSA, 1.25 U Taq (Qiagen), and 2 or 4 µl DNA (2 µl 162
for the three ‘light’ fractions, 4 µl for the three ‘heavy’ fractions). Thermal cycling conditions 163
were as follows: initial denaturation at 95°C for 2 minutes; 30 cycles of 95°C for 45 seconds, 164
55°C for 45 seconds, and 72°C for 90 seconds; and a final extension at 72°C for 5 minutes. 165
Duplicate PCR reactions were pooled and cleaned with the Wizard SV DNA purification kit 166
(Promega). 100 ng DNA was digested with MspI or HhaI for 3 hours at 37°C, followed by heat 167
inactivation for 20 minutes at 65°C. Digests were purified with the Montage PCR Centrifugal 168
Filter Device Kit (Millipore) and analyzed at the UC Berkeley DNA Sequencing Facility. T-REX 169
(10) was used for data processing, using a clustering threshold of 1 bp. Relative abundances were 170
calculated using peak areas. Preliminary samples were run in duplicate. The relative abundances 171
of all peaks >1% of total peak area were within +/- 2 % of total peal area of their duplicate. 172
173
16S rRNA and pmoA gene clone libraries 174
16S rRNA gene clone libraries were constructed from the initial sediment and at least one 175
fraction of ‘heavy’ DNA (fraction 4 or 6; 1.73 or 1.75 g ml-1) from each substrate at each time 176
point. Clone libraries were also created from selected controls: ‘light’ DNA (fraction 10; 1.68 g 177
ml-1) from 13C incubations and ‘heavy’ DNA from 12C control incubations. PCR conditions were 178
the same as those for T-RFLP, except with an unlabeled forward primer. 179

9
pmoA clone libraries were constructed from the initial sediment and ‘heavy’ DNA from 180
day 3 of the methane incubation using the primers pmoA189f and mb661r (14). For the ethane 181
incubations, we used additional degenerate primers designed to amplify the highly divergent 182
pmoA sequences listed in GenBank for Methylococcaceae ET-HIRO and ET-SHO (AB453960- 183
AB453963), as well as other Methylococcaceae. ‘Heavy’ DNA from day 6 of the ethane 184
incubation was amplified with the following pairs of primers: pmoA189f and mb661r, 185
ethmo189f (5’-GGYGAYTGGGAYTTYTGG-3’) and ethmo661r (5’-186
CTGGAGCMACGTCTTTAC-3’), and ethmo189f and ethmo649r (5’-187
GTWCCMCGCTCNAYCATBC). Reaction concentrations were the same as above, and thermal 188
cycling conditions were initial denaturation at 94°C for 3 minutes; 30 cycles of 94°C for 60 189
seconds, 54°C for 90 seconds, and 72°C for 60 seconds; and a final extension at 72°C for 5 190
minutes. For the ethane sample, template was limited and yields were low in all three reactions, 191
so the PCR products were pooled. 192
For both 16S rRNA and pmoA, PCR products were cleaned with the Wizard SV DNA 193
purification kit (Promega) and cloned with the PCR cloning kit (Qiagen). Plasmid DNA was 194
isolated from randomly selected clones with the UltraClean 6 Minute Mini Plasmid Prep Kit (Mo 195
Bio) and sequenced at the UC Berkeley DNA Sequencing Facility. 196
197
Phylogenetic analysis and assignment of T-RFs 198
Sequences were edited and assembled with Sequencher (Gene Codes Corp.). 16S rRNA 199
sequences were screened for potential chimeras with Bellerophon (32), CHIMERA CHECK 200
(12), and Pintail (1); suspected chimeras were not considered in further analysis. Phylogenetic 201
affiliations of 16S rRNA genes and their relative abundances were determined with the RDP 202

10
Classifier tool (81). Representative 16S rRNA and pmoA sequences and related reference 203
sequences were aligned with CLUSTALW and neighbor-joining phylogenetic trees were 204
constructed with MEGA (76). 205
Sequences were further classified by in silico digests with MspI and HhaI to predict 206
terminal restriction fragment (T-RF) lengths. These were used to assign identities to T-RFs from 207
the T-RFLP analysis. 16S rRNA gene sequences from both 13C-DNA and controls were used to 208
create a list of sequences with each predicted T-RF length. Predicted and observed T-RFs 209
correlated closely, provided that each observed T-RF length was corrected by 4 bp. Differences 210
between observed and predicted T-RF lengths have often been observed in T-RFLP studies (64, 211
69), and can vary based on purine content or fragment length (41), but in this case appeared to be 212
a constant 4 bp offset. T-RF lengths shown are the observed T-RF length plus 4. T-RFs were 213
then combined to form six major groups, based on the clone library sequences with these 214
predicted T-RF lengths. 215
216
Nucleotide sequence accession numbers 217
These sequence data have been submitted to the GenBank database under accession 218
numbers GU584298 - GU584873 (16S rRNA) and GU584229 - GU584297 (pmoA). 219
220
Results 221
13C enrichment in Fatty Acids 222
Fatty acids were extracted from the initial sediment used for inoculation, and from the 223
sediment remaining after the final time point of each SIP incubation. In all cases, the most 224
abundant fatty acids were the 16- and 18-carbon saturated (16:0, and 18:0) and monounsaturated 225

11
fatty acids (16:1 and 18:1; multiple positional isomers were present for each, but were not 226
differentiated) (data not shown). In all cases, the 13C incubations showed very high levels of 13C 227
incorporation into individual fatty acids (up to 63%), while the 12C controls showed no 228
significant 13C enrichment (<1.25% 13C) (Figure 1A). 16:1, 16:0, and 18:1 fatty acids were 229
heavily enriched with 13C in all samples, while 18:0 and 14:0 showed much less 13C 230
incorporation. In all samples, >50% of the 13C incorporated into fatty acids was found in 16:1, 231
~20% in 16:0, and <3% in 18:0. 18:1 accounted for ~20% of the 13C in the ethane and propane 232
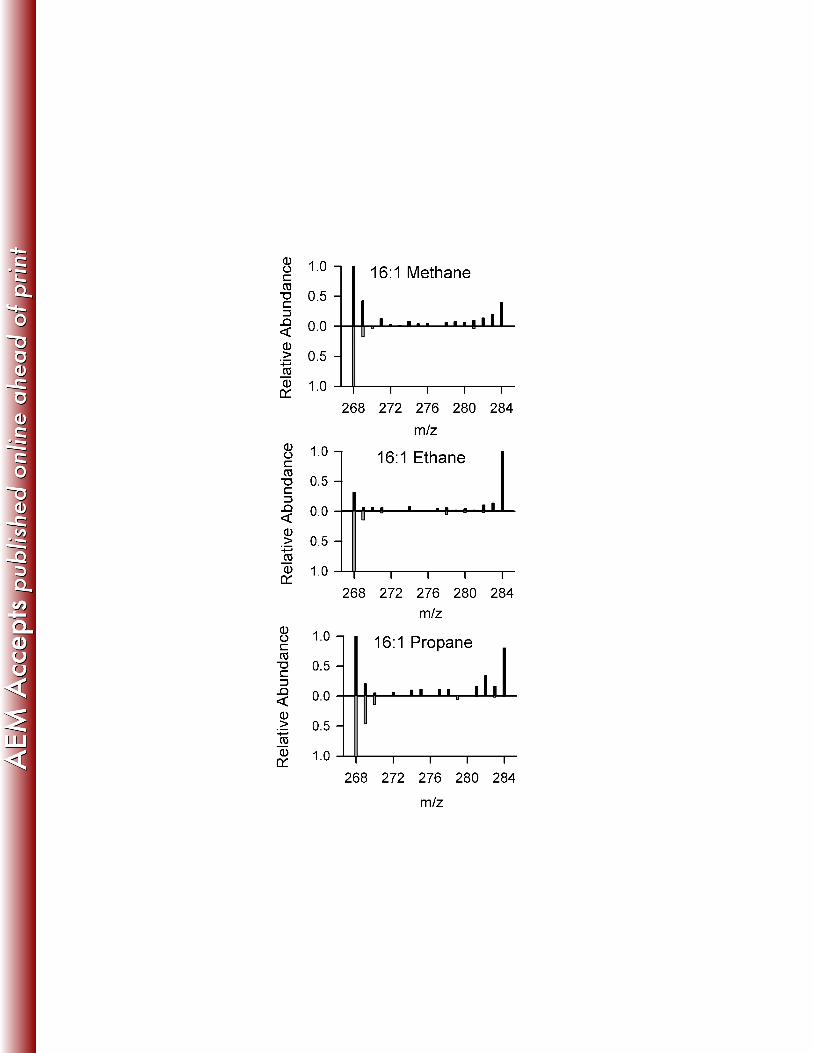
incubations, but only 4% in the methane incubation (Figure 1B). Mass spectra for the highly 233
labeled fatty acids, particularly 16:1, indicate a bimodal pattern of isotopic distribution, where 234
most molecules either contained a natural abundance of 13C (zero or one 13C per molecule) or 235
were fully labeled with 13C (Figure 2). Mass spectra from unlabeled (12C) controls showed no 236
appreciable incorporation of 13C, in agreement with the δ13C values measured by GC/IRMS. 237
238
16S rRNA gene clone libraries 239
DNA from each 13C sample and its 12C control was separated by density gradient 240
ultracentrifugation into 12 fractions, with buoyant densities ranging from 1.66 g ml-1 to 1.78 g 241
ml-1). 16S rRNA gene clone libraries were constructed from at least one ‘heavy’ DNA fraction 242
(1.73 or 1.75 g ml-1) from each gas at each time point, as well as from a ‘heavy’ DNA fraction 243
from selected 12C controls and a ‘light’ DNA fraction (1.69 g ml-1) from selected 13C samples. 244
Because we were primarily interested in the most abundant phylotypes, we sequenced 24–48 245
clones from most fractions, for a total of 595 sequences. The phylogenetic affiliations of these 246
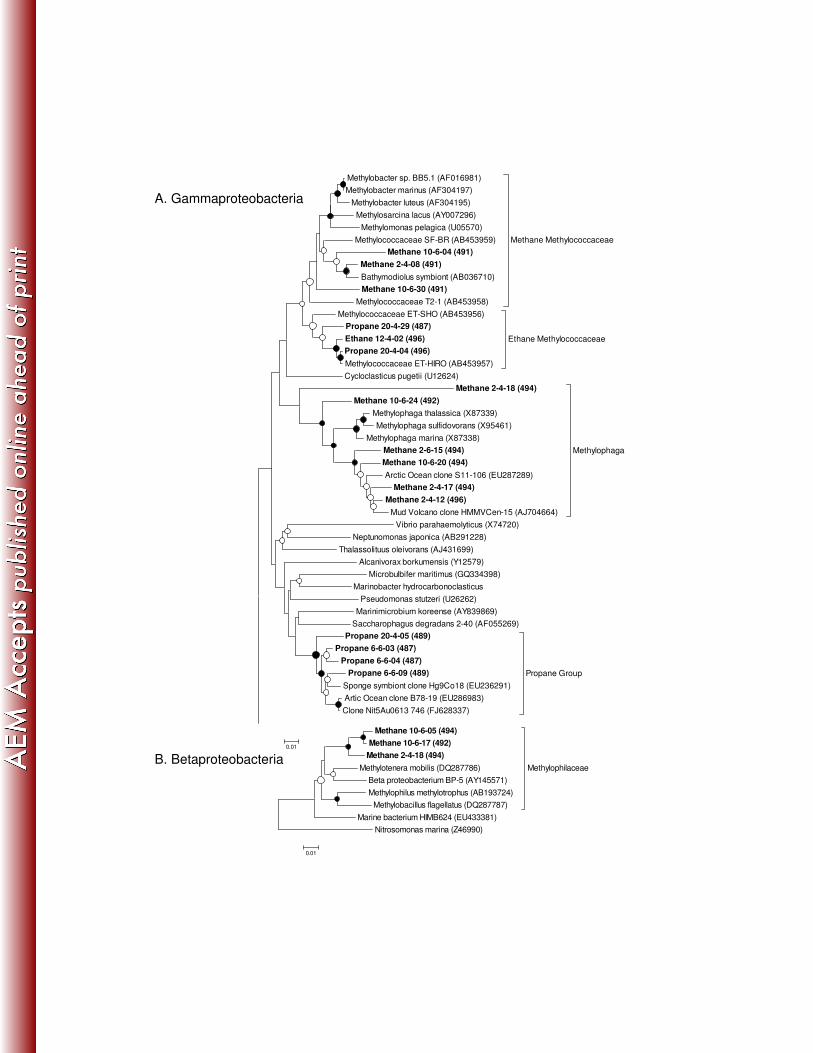
sequences are shown in Figures 3 and 4. 247
248

12
Methane 249
The most abundant sequences in the ‘heavy’ DNA from all three time points of the 250
methane incubation were from a group of Gammaproteobacteria related to Methylophaga and a 251
group of Betaproteobacteria in the family Methylophilaceae, followed by a group of 252
Gammaproteobacteria in the family Methylococcaceae. These three groups accounted for 81% 253
of sequences in the ‘heavy’ fraction 6 from day 3, 91% in the ‘heavy’ fraction from day 6, and 254
45% in the ‘heavy’ fraction from day 9, with Methylophaga and the Methylophilaceae making 255
up the majority of these sequences at all time points. By day 9, two additional groups comprised 256
at least 10% of the ‘heavy’ DNA sequences: Alphaproteobacteria in the order Rhizobiales and 257
Gammaproteobacteria in the order Chromatiales. In comparison, the most common sequences in 258
the ‘light’ DNA clone library were Flavobacteriales (45%), followed by Thiotrichales, 259
Vibrionales, and Chromatiales; amongst the 31 clones, there were no sequences affiliated with 260
the Methylococcaceae, Methylophilaceae, or Methylophaga. 261
262
Ethane 263
At day 3, the ‘heavy’ DNA sequences from the 13C ethane incubations were similar to the 264
12C control ‘heavy’ DNA and the ‘light’ DNA from the 13C sample, predominately 265
Rhodobacterales, Oceanospirillales, Thiotrichales, and Flavobacteriales. By days 6 and 9, 266
though, the majority of ‘heavy’ DNA sequences were from a group of Gammaproteobacteria in 267
the family Methylococcaceae. Like the methane Methylococcaceae sequences, their closest 268
cultured relatives were Methylobacter sp. BB5.1, Methylobacter luteus NCIMB 11914, and 269
Methylobacter marinus strain A45. However, the ethane Methylococcaceae sequences all 270
clustered separately from the methane Methylococcaceae and could be distinguished by their 271

13
predicted MspI T-RF (496 bp for ethane, 491 bp for methane). The most similar sequences in 272
GenBank were from “Methylococcaceae bacterium ET-HIRO” (AB453957.1) and 273
“Methylococcaceae bacterium ET-SHO” (AB453956.1). 274
275
Propane 276
The majority of sequences in the ‘heavy’ DNA clone libraries from days 3 and 6 of the 277
propane incubation belonged to a group of unclassified Gammaproteobacteria most closely 278
related to the genera Marinimicrobium, Microbulbifer, and Saccharophagus. This group 279
accounted for 61% and 56% of ‘heavy’ DNA sequences at days 3 and 6, respectively, but only 280
6% of ‘heavy’ DNA from the 12C control. By day 14, however, they made up less than 10% of 281
sequences in fractions 4 and 6, and Rhodobacterales were most abundant instead (43% and 282
65%). Rhodobacterales made up only 5% of the ‘light’ DNA sequences from the last time point. 283
284
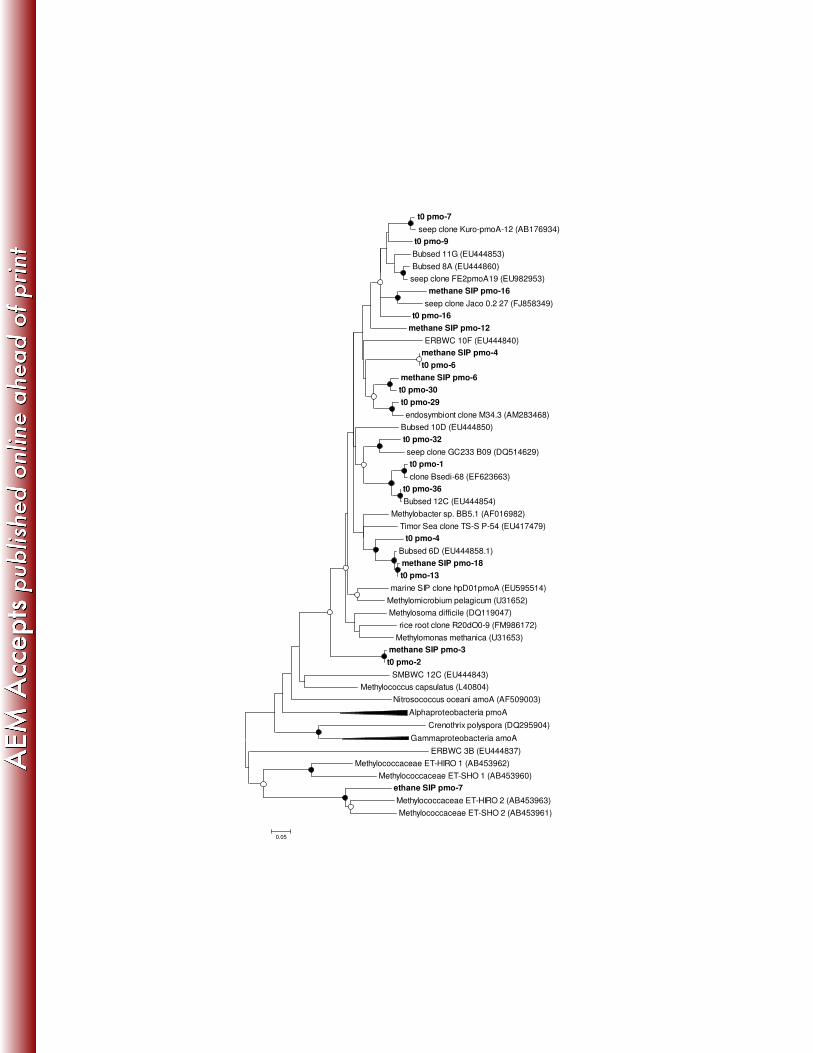
pmoA and pmoA-like gene clone libraries 285
In order to further characterize the Methylococcaceae in the ethane incubations, we 286
created small pmoA clone libraries, using degenerate primers designed to amplify highly 287
divergent pmoA sequences. The clone library with ‘heavy’ DNA from the ethane incubation 288
contained several highly divergent pmoA sequences, which grouped with the ET-HIRO and ET-289
SHO sequences (Figure 5). We also created small pmoA clone libraries from the initial sediment 290
(46 clones) and ‘heavy’ DNA from the methane incubations (10 clones), with the commonly 291
used primers pmoA189f and mb661r. Representative sequences are also shown in Figure 5. 292
These sequences all grouped with the Gammaproteobacterial pmoA sequences, being most 293
closely related to those from other uncultured marine methanotrophs. 294

14
295
T-RFLP fingerprinting of density gradient fractions and correlation with clone libraries 296
Though clone libraries provide a more detailed representation of the 16S rRNA genes 297
present in each fraction, T-RFLP is useful for characterizing a broader range of gradient fractions 298
from both 13C incubations and 12C controls. From six fractions of each sample, 16S rRNA genes 299
were amplified and digested with the restriction enzymes MspI and HhaI. The two restriction 300
enzymes produced similar results; only those from MspI are shown here (Figure 6). It was 301
possible to amplify the 16S rRNA gene from nearly every fraction, but the amount of PCR 302
product was insufficient for further analysis in some of the ‘heavy’ fractions. 303
In order to correlate T-RFLP and clone library data, we performed in silico digestions of 304
all suitable 16S rRNA sequences from the clone libraries and grouped them by T-RF length. 305
MspI TR-F length clearly distinguished the Rhodobacterales and other Alphaproteobacteria (439 306
or 441 bp) and the Flavobacteriales and other Bacteroidetes (91, 93, or 95 bp). All members of 307
the “Propane Group” of unclassified Gammaproteobacteria had a predicted T-RF of 485, 487, or 308
489 bp, though other low abundance Gammproteobacteria (Oceanospirillales) shared these T-309
RF lengths. All of the Methylococcaceae sequences from the methane incubation had a predicted 310
T-RF of 491 bp, while all of the Methylococcaceae from the ethane incubation had a T-RF of 311
496 bp. The 496 bp T-RF was also predicted for some Methylophaga, though the rest of the 312
Methylophaga sequences had T-RFs of 492 or 494 bp. It was not possible to differentiate 313
Methylophaga from Methylophilaceae; these sequences also all had predicted T-RFs of 492 or 314
494 bp. Several other groups of Gammaproteobacteria (predominately Thiotrichales and 315
Chromatiales) also had predicted T-RFs of 492, 494, or 496, but these sequences were never 316
more than 10% of the sequences in the ‘heavy’ DNA clone libraries (Figure 3). They were, 317

15
however, more abundant in the clone libraries from the control samples, so the presence of these 318
fragment lengths in T-RFLP samples from the ‘light’ fractions is also expected, and these groups 319
of Gammaproteobacteria and the Methylophilaceae can not be clearly differentiated. Digesting 320
with HhaI led to better differentiation between a few groups of Gammaproteobacteria, but more 321
poorly resolved others and still did not differentiate between the methylotrophic 322
Piscirickettsiaceae (Gammaproteobacteria) and Methylophilaceae (Betaproteobacteria). 323
Based on these observations, we combined our T-RFs into six main groups. All 324
remaining T-RFs were combined and shown as “other”; the relative abundances of the individual 325
T-RFs in this group were never more than 5% in the 13C-labeled ‘heavy’ fractions. Figure 6 326
shows T-RFLP profiles from one time point each of the methane, ethane, and propane 327
incubations. The other two time points for each substrate are shown in the Supplemental 328
Information. In all cases, the T-RFs corresponding to the most abundant sequences in the ‘heavy’ 329
DNA clone libraries are also most abundant in the ‘heavy’ fractions of the T-RFLP profiles. 330
331
Discussion 332
Considerations with the SIP technique 333
Though SIP can be useful in linking metabolic function to identity, there are challenges 334
in designing these experiments and correctly interpreting the results. A successful SIP study 335
requires sufficient incorporation of 13C into biomass, such that 13C-labeled DNA can be 336
differentiated from the background of unlabeled DNA distributed across all fractions (51, 58). 337
Longer incubations, which increase the extent of labeling, also lead to the spread of 13C 338
throughout the community by cross-feeding on metabolic byproducts or dead cells (52). Longer 339

16
incubations and higher substrate concentrations also increase the possibility of selecting for 340
organisms adapted for higher substrate concentrations than those active in situ (58). 341
We attempted to minimize these problems in two ways. First, we sampled each 342
incubation at three points in time, increasing the odds of catching them at a point where there 343
was sufficient 13C incorporation, but minimal cross-feeding. Second, we ran parallel incubations 344
with 12C methane, ethane, and propane. Though there was DNA present in most of the ‘heavy’ 345
fractions of the 12C controls, the amount recovered from fractions 6 and 7 was generally lower 346
than from the 13C samples (Supplemental Figure 4). T-RFLP analysis of 12C samples typically 347
showed similar communities in the 'heavy' and 'light' fractions, while 13C samples showed 348
distinct communities in the two. A distinctive 'heavy' community was also observed in the clone 349
libraries, though accompanied by a smaller number of sequences from most abundant 'light' 350
groups, such as Rhodobacterales, Flavobacteriales, Thiotrichales, Vibrionales, and 351
Chromatiales. While it is possible that these organisms actually incorporated 13C, it is more 352
likely that most of these sequences were from contaminating 12C-DNA. Only groups that were 353
much more abundant in the ‘heavy' fractions of the 13C incubations than in the ‘heavy’ fractions 354
of the 12C incubations and ‘light’ fractions of the 13C incubations, based on both T-RFLP and 355
clone libraries, were considered 13C-labeled. The bimodal distribution of 13C content in fatty 356
acids (Figure 2) provides additional confirmation of 13C uptake by a subset of the microbial 357
community and supported the results of the clone library and T-RFLP data. 358
359
Methane 360
From both the T-RFLP data and the clone libraries, it appears that the major consumers 361
of 13C in the methane incubations were affiliated with the Methylophilaceae or Methylophaga, 362

17
with a smaller contribution from the Methylococcaceae. The Methylophilaceae and 363
Methylophaga are both groups of non-methane-oxidizing methylotrophs, consuming other C1 364
compounds such as methanol and methylamine (2); previous SIP studies have shown 365
Methylophaga was the primary consumer of methanol and methylamine in marine environments 366
(56, 59, 61). Most methane SIP studies have observed some 13C uptake by organisms more 367
closely related to non-methanotrophic methylotrophs than to known methanotrophs, which has 368
been attributed to cross-feeding (8, 33, 50). However, methylotroph sequences in two marine 369
studies were much less abundant than sequences related to known methanotrophs (37, 56), in 370
contrast to the pattern of relative abundance we observe. In a study of rice roots, Qiu et al (66) 371
found that most of the sequences in a 13C-DNA clone library were affiliated with 372
Methylophilales, but their long (20 d) incubations make cross-feeding the likely explanation. In 373
our study, the sequences affiliated with Methylophaga and Methylophilales were far more 374
abundant than the Methylococcaceae sequences after just three days and remained more 375
abundant over the nine-day incubation period. The early and sustained representation of 376
methylotrophs in the 'heavy' fractions suggests that these Methylophaga and Methylophilales are 377
either directly incorporating methane or are involved in a closely coupled relationship with 378
methanotrophic Methylococcaceae. In all three of these groups, the most abundant fatty acids are 379
16:1 and 16:0 (3, 36, 40, 79), consistent with the heavy labeling of these fatty acids observed at 380
the end of the incubation. 381
The pmoA data, though limited, show a number of sequences not closely related to 382
cultured methanotrophs. The most common phylotype in both the initial sediment and the 383
‘heavy’ DNA from the methane incubation was only 81% similar to any other sequence in 384
GenBank. The most closely related sequences came from several uncultured bacteria and two 385

18
cultured, but unclassified Methylococcaceae. The other pmoA sequences in our methane clone 386
library also clustered with the Methylococcaceae, particularly with representatives from methane 387
seep environments like the Eel River Basin (77). We found no sequences affiliated with type II 388
methanotrophs, and very few sequences closely related to cultured type I methanotrophs. Based 389
on these sequences’ affiliation with the Gammaproteobacterial pmoA sequences, they likely 390
belong to the Methylococcaceae observed in the 16S rRNA clone libraries, though it is also 391
possible that they belong to the Methylophaga-like bacteria, representing a novel group of 392
methanotrophs. 393
394
Ethane 395
13C ethane was primarily consumed by a group of organisms from the family 396
Methylococcaceae. These organisms have previously been thought to be obligate methanotrophs 397
(3), only capable of growing on methane or a few other C1 compounds. Without pure cultures, 398
we cannot determine whether these ethane-oxidizing Methylococcaceae are also capable of 399
growth on methane. However, the ethane Methylococcaceae sequences were not detected in any 400
of the ‘heavy’ DNA clone libraries from the methane incubations, indicating that they were not a 401
major contributor to methane oxidation under the conditions of the SIP incubation. Interestingly, 402
five similar sequences were found in the ‘heavy’ DNA clone library from the last time point of 403
the propane incubation, raising the possibility that these bacteria also have the ability to consume 404
propane or one of its metabolic byproducts. 405
Based on the co-occurrence of 16S rRNA genes from the family Methylococcaceae and a 406
highly divergent pmoA-like gene in the ‘heavy’ DNA, we hypothesize that this gene encodes part 407
of a novel ethane monooxygenase enzyme active in some Methylococcaceae. While molecular 408

19
genetic and biochemical studies are needed to test this hypothesis, there is some corroboration in 409
existing GenBank sequence entries (AB453956-65). These GenBank entries include 16S rRNA 410
and pmoA gene sequences reported to be from the isolated cultures “Methylococcaceae 411
bacterium” ET-HIRO, ET-SHO, T2-1, and SF-BR. They have the title “Discovery of ethane 412
monooxygenase in marine bacteria belongs to Methylococcaceae that could grow on ethane, but 413
not methane,” but additional information has yet to be published in the peer reviewed literature. 414
These pmoA-like sequences group outside of all known pmoA genes from the 415
Alphaproteobacteria and Gammaproteobacteria and amoA genes from the Betaproteobacteria 416
and Gammaproteobacteria. They are also distantly related to the highly divergent sequence 417
observed by Tavormina et al (77) in the water column above methane seeps in the Eel River 418
Basin. The prevalence and function of both these enzymes is currently unknown, but they may 419
also play a role in the oxidation of other common biogenic molecules such as methane, 420
ammonia, or ethene. 421
It is difficult to determine the environmental importance of these putative ethane-422
oxidizers. Both methane- and ammonia-oxidizing bacteria have long been known to oxidize 423
small amounts of ethane (11, 34), but this has only been observed during methane- or ammonia-424
supported growth. High concentrations of ethane are typically accompanied by propane and even 425
higher concentrations of methane (20, 83), making it unlikely for bacteria to ever be exposed to 426
an environment with ethane as the most abundant carbon source. However, ethane oxidation was 427
detectable in our incubations within 24 hours, suggesting that these bacteria required little 428
adaptation to use ethane as the major carbon source. By the final time point, all four of the major 429
fatty acids in the incubations were more enriched in 13C than those in the methane and propane 430
incubations. The ethane incubations also showed the highest levels of 100% 13C labeled fatty 431

20
acids- 50% of the 16:1 fatty acids were 100% 13C labeled. As mentioned above, the 432
Methylococcaceae typically contain high levels of 16:1 and 16:0 fatty acids (3), which could 433
account for much of the 13C ethane incorporation into fatty acids. In contrast to the methane 434
incubations, though, ~20% of the 13C was incorporated into 18:1 fatty acids, which are not 435
commonly found in high levels in the Methylococcaceae (4). This may be due to different fatty 436
acid content in these Methylococcaceae or to cross-feeding bacteria. By the final time point, the 437
second most abundant group of T-RFs in the heavy fractions was that assigned to the 438
Rhodobacterales, many of which contain predominately 18:1 fatty acids (25, 71, 75). Thus, the 439
most parsimonious explanation for the lipid distributions is that 16:0 and 16:1 were primarily 440
produced by ethane-fed Methylococcaceae throughout the incubation, whereas the 18:1 was 441
produced primarily by cross-feeding Rhodobacterales near the end of the incubation. Elevated 442
levels of intermediate 13C labeling in 18:1 compared to 16:0 and 16:1 further support this 443
explanation. 444
445
Propane 446
Propane was primarily consumed by a group of unclassified Gammaproteobacteria 447
whose closest cultured relatives are found in the genera Marinimicrobium, Microbulbifer, and 448
Saccharophagus (16S rRNA genes ~92% similar). These bacteria are typically known for 449
degradation of complex polysaccharides such as cellulose, chitin, and agar (19, 24), and no 450
members of these genera have previously been linked to propane oxidation or hydrocarbon 451
oxidation in general. However, this group also showed ~90% 16S rRNA gene similarity to some 452
Pseudomonas, which have been shown to oxidize propane (70), and to obligate hydrocarbon 453
degraders such Alcanivorax and Marinobacter (84). 454

21
At the last time point, the clone libraries and the T-RFLP data both show the 455
Gammaproteobacteria giving way to Rhodobacterales in the ‘heavy’ fractions. The 456
Rhodobacterales are not very abundant in the ‘light’ fractions, so this appears to be due to 13C 457
uptake, not contaminating 12C-DNA. This could have been due to a change in community 458
composition over time or, more likely, due to cross-feeding. As with ethane, 13C uptake by this 459
group is supported by the fact that 18:1 fatty acids contained ~20% of all 13C incorporated into 460
fatty acids; 18:1 fatty acids are abundant in the Rhodobacterales (25, 71, 75). An increase in the 461
abundance of certain members of the Rhodobacterales has often been observed in oil-462
contaminated environments or oil-amended mesocosm experiments (6, 15, 55). Whether these 463
organisms are actually able to degrade hydrocarbons is unclear (7, 48), though at least one 464
member of this group has been shown to degrade C10-C13 n-alkanes (30). The Rhodobacterales 465
have not been linked to ethane or propane oxidation, but some species are able to consume 466
ethanol or propanol (23), likely sources of 13C through cross-feeding. It may be that many of the 467
oil-associated Rhodobacterales are not capable of direct consumption of alkanes, but are feeding 468
off the byproducts of alkane metabolism, as appears to be the case in our incubations. 469
As in the ethane incubations, the majority of 13C propane was incorporated into 16:1 and 470
16:0, presumably belonging to the primary propane oxidizers, but the lack of cultured bacteria 471
closely related to these unclassified Gammaproteobacteria make comparison impossible. The 472
‘heavy’ DNA from the last time point also included several Methylococcaceae sequences similar 473
to those in the ethane incubations, which may account for some of the heavily labeled 16:1 or 474
16:0. These sequences only appeared in the final samples, suggesting that the ethane oxidizers 475
required an adaptation period before beginning propane oxidation or that they were incorporating 476
a byproduct of propane oxidation. Most previously described ethane oxidizers can oxidize 477

22
propane, and some propane oxidizers can oxidize ethane (70), so some overlap between the two 478
is not surprising, but ethane and propane oxidation appear to primarily be performed by different 479
communities. 480
481
Lipids 482
One common and striking feature of the newly produced fatty acids in each experiment is 483
the dominance of monounsaturates, specifically 16:1 and 18:1. High percentages of these fatty 484
acids in membrane lipids are typical of methanotrophs and thought to be associated with the 485
extensive network of stacked membranes common in these organisms (5). The 486
Gammaproteobacterial (Type I) methanotrophs typically contain mostly 16:1 fatty acids, while 487
the Alphaproteobacterial (Type II) methanotrophs typically contain mostly 18:1 fatty acids (2, 488
5). The predominant incorporation of 13C-methane into 16:1 fatty acids provides additional 489
evidence that methane was consumed by Gammaproteobacterial methanotrophs. The high level 490
of incorporation into 16:1 observed in the ethane incubation also supports our interpretation from 491
16S rRNA and pmoA clone libraries that the responsible organisms share numerous similarities 492
with methanotrophs, potentially including stacked membranes. A second striking feature from 493
these results is the high extent of fully 13C-labeled lipids and low levels of any specific 494
intermediately-labeled lipid. These results suggest a high degree of metabolic specificity for all 495
three substrates, though this may include cross-feeding relationships. 496
497
Conclusions 498
This study demonstrates the ability of SIP to identify previously unknown groups of 499
methane-, ethane- and propane-oxidizing bacteria at a marine hydrocarbon seep, with distinct 500

23
groups of bacteria found responsible for each process. These results may have implications for 501
our understanding of methane oxidation in marine environments. Novel groups of marine 502
bacteria may contain monooxygenases related to those of terrestrial bacteria but with different 503
substrate affinities, affecting our ability to detect them with common primer sets and to predict 504
biogeochemical function based on the presence or absence of these genes. The multitude of 505
hydrocarbon compounds present in seep environments could support a range of hydrocarbon-506
oxidizing bacteria, and relatively little is known about which organisms consume which 507
compounds and under what conditions. Further work, with both culturing and culture-508
independent techniques like SIP, is important to better understand these processes and their role 509
in biogeochemical cycling. 510

24
Acknowledgments 511
We thank Michael Friedrich and Bianca Pommerenke for early assistance with the SIP 512
technique. Heather Coleman, Blair Paul, and Cristoph Pierre collected samples, and Lichun 513
Zhang performed the fatty acid extractions and GC/MS analyses. This work was funded by a 514
National Science Foundation award OCE-0447395 and DOE award DE-NT0005667 to DLV and 515
National Science Foundation award EAR-0645502 to ALS. 516
517
518
References 519
1. Ashelford, K., N. Chuzhanova, J. Fry, A. Jones, and A. Weightman. 2005. At least 1 520 in 20 16S rRNA sequence records currently held in public repositories is estimated to 521 contain substantial anomalies. Appl. Environ. Microbiol. 71:7724-7736. 522
2. Bodelier, P., M. Gillisen, K. Hordijk, J. Damsté, W. Rijpstra, J. Geenevasen, and P. 523 Dunfield. 2009. A reanalysis of phospholipid fatty acids as ecological biomarkers for 524 methanotrophic bacteria. ISME J. 3:606-617. 525
3. Bowman, J. 2000. The methanotrophs–the families Methylococcaceae and 526 Methylocystaceae, p. 266-289. In M. Dworkin (ed.), The prokaryotes: an evolving 527 electronic resource for the microbiological community. [Online] Springer, New York. 528
4. Bowman, J. 2005. Order VII. Methylococcales ord. nov., p. 248-270. In G. Garrity, D. J. 529 Brenner, N. R. Krieg, and J. R. Staley (ed.), Bergey's Manual of Systematic Bacteriology, 530 2nd ed, vol. 2: The Proteobacteria Part B The Gammaproteobacteria. Springer, New 531 York. 532
5. Bowman, J., J. Skerratt, P. Nichols, and L. Sly. 1991. Phospholipid fatty acid and 533 lipopolysaccharide fatty acid signature lipids in methane-utilizing bacteria. FEMS 534 Microbiol. Lett. 85:15-22. 535
6. Brakstad, O., and A. Lødeng. 2005. Microbial diversity during biodegradation of crude 536 oil in seawater from the North Sea. Microb. Ecol. 49:94-103. 537
7. Buchan, A., and J. González. 2010. Roseobacter, p. 1335-1344. In K. N. Timmis (ed.), 538 Handbook of Hydrocarbon and Lipid Microbiology, vol. 14. Springer, Berlin. 539
8. Cebron, A., L. Bodrossy, N. Stralis-Pavese, A. Singer, I. Thompson, J. Prosser, and 540 J. Murrell. 2007. Nutrient amendments in soil DNA stable isotope probing experiments 541 reduce the observed methanotroph diversity. Appl. Environ. Microbiol. 73:798-807. 542
9. Clark, J., L. Washburn, J. Hornafius, and B. Luyendyk. 2000. Dissolved hydrocarbon 543 flux from natural marine seeps to the southern California Bight. J. Geophys. Res. Oceans 544 105:11509- 11522. 545
10. Clayton, C., S. Hay, and S. Baylis. 1997. Alteration of natural gas during leakage from 546 a North Sea salt diapir field. Mar. Geol. 137:69-80. 547

25
11. Colby, J., D. I. Stirling, and H. Dalton. 1977. The soluble methane mono-oxygenase of 548 Methylococcus capsulatus (Bath). Its ability to oxygenate n-alkanes, n-alkenes, ethers, 549 and alicyclic, aromatic and heterocyclic compounds. Biochem. J. 165:395-402. 550
12. Cole, J., B. Chai, T. Marsh, R. Farris, Q. Wang, S. Kulam, S. Chandra, D. 551 McGarrell, T. Schmidt, and G. Garrity. 2003. The Ribosomal Database Project (RDP-552 II): previewing a new autoaligner that allows regular updates and the new prokaryotic 553 taxonomy. Nucleic Acids Res. 31:442-443. 554
13. Cooley, R., B. Dubbels, L. Sayavedra-Soto, P. Bottomley, and D. Arp. 2009. Kinetic 555 characterization of the soluble butane monooxygenase from Thauera butanivorans, 556 formerly 'Pseudomonas butanovora'. Microbiology 155:2086-2096. 557
14. Costello, A. M., and M. E. Lidstrom. 1999. Molecular Characterization of Functional 558 and Phylogenetic Genes from Natural Populations of Methanotrophs in Lake Sediments. 559 Appl. Environ. Microbiol. 65:5066-5074. 560
15. Coulon, F., B. McKew, A. Osborn, T. McGenity, and K. Timmis. 2007. Effects of 561 temperature and biostimulation on oil-degrading microbial communities in temperate 562 estuarine waters. Environ. Microbiol. 9:177. 563
16. Dedysh, S., W. Liesack, V. Khmelenina, N. Suzina, Y. Trotsenko, J. Semrau, A. 564 Bares, N. Panikov, and J. Tiedje. 2000. Methylocella palustris gen. nov., sp. nov., a 565 new methane-oxidizing acidophilic bacterium from peat bogs, representing a novel 566 subtype of serine-pathway methanotrophs. Int. J. Syst. Evol. Microbiol. 50:955-969. 567
17. Dedysh, S. N., C. Knief, and P. F. Dunfield. 2005. Methylocella species are 568 facultatively methanotrophic. J. Bacteriol. 187:4665-4670. 569
18. Dubbels, B., L. Sayavedra-Soto, and D. Arp. 2007. Butane monooxygenase of 570 'Pseudomonas butanovora': purification and biochemical characterization of a terminal-571 alkane hydroxylating diiron monooxygenase. Microbiology 153:1808-1816. 572
19. Ekborg, N. A., J. M. Gonzalez, M. B. Howard, L. E. Taylor, S. W. Hutcheson, and 573 R. M. Weiner. 2005. Saccharophagus degradans gen. nov., sp. nov., a versatile marine 574 degrader of complex polysaccharides. Int. J. Syst. Evol. Microbiol. 55:1545-1549. 575
20. Etiope, G., and P. Ciccioli. 2009. Earth's Degassing: A Missing Ethane and Propane 576 Source. Science 323:478. 577
21. Fung, I., M. Prather, J. John, J. Lerner, and E. Matthews. 1991. Three-dimensional 578 model synthesis of the global methane cycle. Journal of Geophysical Research 96:13033-579 13065. 580
22. Fuse, H., M. Ohta, O. Takimura, K. Murakami, H. Inoue, Y. Yamaoka, J. Oclarit, 581 and T. Omori. 1998. Oxidation of trichloroethylene and dimethyl sulfide by a marine 582 Methylomicrobium strain containing soluble methane monooxygenase. Biosci. 583 Biotechnol. Biochem. 62:1925-1931. 584
23. Garrity, G., J. Bell, and T. Lilburn. 2005. Order III. Rhodobacterales ord. nov., p. 161-585 167. In G. Garrity, D. J. Brenner, N. R. Krieg, and J. R. Staley (ed.), Bergey's Manual of 586 Systematic Bacteriology, vol. 2: The Proteobacteria Part C The Alpha-, Beta-, Delta-, and 587 Epsilonproteobacteria Springer, New York. 588
24. Gonzalez, J., F. Mayer, M. Moran, R. Hodson, and W. Whitman. 1997. 589 Microbulbifer hydrolyticus gen. nov., sp. nov., and Marinobacterium georgiense gen. 590 nov., sp. nov., two marine bacteria from a lignin-rich pulp mill waste enrichment 591 community. Int. J. Syst. Evol. Microbiol. 47:369-376. 592
26
25. Gosnik, J. J. 2005. Genus XI. Octadecabacter, p. 194-197. In G. Garrity, D. J. Brenner, 593 N. R. Krieg, and J. R. Staley (ed.), Bergey's Manual of Systematic Bacteriology, 2nd ed, 594 vol. 2: The Proteobacteria Part C The Alpha-, Beta-, Delta-, and Epsilonproteobacteria 595 Springer, New York. 596
26. Hakemian, A., and A. Rosenzweig. 2007. The biochemistry of methane oxidation. 597 Annu. Rev. Biochem. 76:223-241 598
27. Hamamura, N., and D. J. Arp. 2000. Isolation and characterization of alkane-utilizing 599 Nocardioides sp. strain CF8. FEMS Microbiol. Lett. 186:21-26. 600
28. Hamamura, N., C. Yeager, and D. Arp. 2001. Two Distinct Monooxygenases for 601 Alkane Oxidation in Nocardioides sp. Strain CF8. Appl. Environ. Microbiol. 67:4992-602 4998. 603
29. Hanson, R. S., and T. E. Hanson. 1996. Methanotrophic bacteria. Microbiol. Mol. Biol. 604 Rev. 60:439-471. 605
30. Harwati, T., Y. Kasai, Y. Kodama, D. Susilaningsih, and K. Watanabe. 2008. 606 Tranquillimonas alkanivorans gen. nov., sp. nov., an alkane-degrading bacterium isolated 607 from Semarang Port in Indonesia. Int. J. Syst. Evol. Microbiol. 58:2118-2121. 608
31. Hornafius, J., D. Quigley, and B. Luyendyk. 1999. The world's most spectacular 609 marine hydrocarbon seeps (Coal Oil Point, Santa Barbara Channel, California): 610 Quantification of emissions. J. Geophys. Res. Oceans 104:20703-20711. 611
32. Huber, T., G. Faulkner, and P. Hugenholtz. 2004. Bellerophon: a program to detect 612 chimeric sequences in multiple sequence alignments. Bioinformatics 20:2317-2319. 613
33. Hutchens, E., S. Radajewski, M. G. Dumont, I. R. McDonald, and J. C. Murrell. 614 2004. Analysis of methanotrophic bacteria in Movile Cave by stable isotope probing. 615 Environ. Microbiol. 6:111-120. 616
34. Hyman, M. R., I. B. Murton, and D. J. Arp. 1988. Interaction of ammonia 617 monooxygenase from Nitrosomonas europaea with alkanes, alkenes, and alkynes. Appl. 618 Environ. Microbiol. 54:3187-3190. 619
35. Inagaki, F., U. Tsunogai, M. Suzuki, A. Kosaka, H. Machiyama, K. Takai, T. 620 Nunoura, K. Nealson, and K. Horikoshi. 2004. Characterization of C1-metabolizing 621 prokaryotic communities in methane seep habitats at the Kuroshima Knoll, southern 622 Ryukyu Arc, by analyzing pmoA, mmoX, mxaF, mcrA, and 16S rRNA genes. Appl. 623 Environ. Microbiol. 70:7445-7455. 624
36. Jenkins, O., D. Byrom, and D. Jones. 1987. Methylophilus: a new genus of methanol-625 utilizing bacteria. Int. J. Syst. Evol. Microbiol. 37:446. 626
37. Jensen, S., J. Neufeld, N. Birkeland, M. Hovland, and J. Murrell. 2008. Methane 627 assimilation and trophic interactions with marine Methylomicrobium in deep-water coral 628 reef sediment off the coast of Norway. FEMS Microbiol. Ecol. 66:320-330. 629
38. Johnson, E. L., and M. R. Hyman. 2006. Propane and n-butane oxidation by 630 Pseudomonas putida GPo1. Appl. Environ. Microbiol. 72:950-952. 631
39. Judd, A. 2004. Natural seabed gas seeps as sources of atmospheric methane. Environ. 632 Geol. 46:988-996. 633
40. Kalyuzhnaya, M., S. Bowerman, J. Lara, M. Lidstrom, and L. Chistoserdova. 2006. 634 Methylotenera mobilis gen. nov., sp. nov., an obligately methylamine-utilizing bacterium 635 within the family Methylophilaceae. Int. J. Syst. Evol. Microbiol. 56:2819-2823. 636

27
41. Kaplan, C., and C. Kitts. 2003. Variation between observed and true terminal restriction 637 fragment length is dependent on true TRF length and purine content. J. Microbiol. 638 Methods 54:121-125. 639
42. Kinnaman, F. 2008. Ph.D. Thesis. Microbial Consumption of Natural Gas in Marine 640 Sediments: Rates, Distributions and Isotope Effects. University of California, Santa 641 Barbara. 642
43. Kinnaman, F., J. Kimball, L. Busso, D. Birgel, H. Ding, K. Hinrichs, and D. 643 Valentine. 2010. Gas flux and carbonate occurrence at a shallow seep of thermogenic 644 natural gas. Geo-Marine Letters 30:355-365. 645
44. Kniemeyer, O., F. Musat, S. Sievert, K. Knittel, H. Wilkes, M. Blumenberg, W. 646 Michaelis, A. Classen, C. Bolm, S. Joye, and F. Widdel. 2007. Anaerobic oxidation of 647 short-chain hydrocarbons by marine sulphate-reducing bacteria. Nature 449:898-901. 648
45. Kotani, T., Y. Kawashima, H. Yurimoto, N. Kato, and Y. Sakai. 2006. Gene structure 649 and regulation of alkane monooxygenases in propane-utilizing Mycobacterium sp. TY-6 650 and Pseudonocardia sp. TY-7. J. Biosci. Bioeng. 102:184-192. 651
46. Kotani, T., T. Yamamoto, H. Yurimoto, Y. Sakai, and N. Kato. 2003. Propane 652 monooxygenase and NAD+-dependent secondary alcohol dehydrogenase in propane 653 metabolism by Gordonia sp. strain TY-5. J. Bacteriol. 185:7120-7128. 654
47. Krüger, M., T. Treude, H. Wolters, K. Nauhaus, and A. Boetius. 2005. Microbial 655 methane turnover in different marine habitats. Palaeogeog. Palaeoclim. Palaeoecol. 656 227:6-17. 657
48. Kwon, K. K., and S.-J. Kim. 2010. Marine, Hydrocarbon-Degrading 658 Alphaproteobacteria p. 1707-1714. In K. N. Timmis (ed.), Handbook of Hydrocarbon and 659 Lipid Microbiology, vol. 19. Springer, Berlin. 660
49. Lidstrom, M. 1988. Isolation and characterization of marine methanotrophs. Antonie van 661 Leeuwenhoek 54:189-199. 662
50. Lin, J.-L., S. Radajewski, B. Eshinimaev, Y. Trotsenko, I. McDonald, and J. 663 Murrell. 2004. Molecular diversity of methanotrophs in Transbaikal soda lake sediments 664 and identification of potentially active populations by stable isotope probing. Environ. 665 Microbiol. 6:1049-1060. 666
51. Lueders, T., M. Manefield, and M. Friedrich. 2004. Enhanced sensitivity of DNA-and 667 rRNA-based stable isotope probing by fractionation and quantitative analysis of 668 isopycnic centrifugation gradients. Environ. Microbiol. 6:73-78. 669
52. Lueders, T., B. Wagner, P. Claus, and M. Friedrich. 2004. Stable isotope probing of 670 rRNA and DNA reveals a dynamic methylotroph community and trophic interactions 671 with fungi and protozoa in oxic rice field soil. Environ. Microbiol. 6:60-72. 672
53. Mastalerz, V., G. J. de Langea, and A. Dählmann. 2009. Differential aerobic and 673 anaerobic oxidation of hydrocarbon gases discharged at mud volcanoes in the Nile deep-674 sea fan. Geochim. Cosmochim. Acta 73:3849-3863. 675
54. McDonald, I., L. Bodrossy, Y. Chen, and J. Murrell. 2008. Molecular ecology 676 techniques for the study of aerobic methanotrophs. Appl. Environ. Microbiol. 74:1305-677 1315. 678
55. McKew, B., F. Coulon, A. Osborn, K. Timmis, and T. McGenity. 2007. Determining 679 the identity and roles of oil-metabolizing marine bacteria from the Thames estuary, UK. 680 Environ. Microbiol. 9:165-176. 681

28
56. Moussard, H., N. Stralis-Pavese, L. Bodrossy, J. D. Neufeld, and C. J. Murrell. 2009. 682 Identification of active methylotrophic bacteria inhabiting surface sediment of a marine 683 estuary. Environ. Microbiol. Rep. 1:424-433. 684
57. Murrell, J., I. McDonald, and B. Gilbert. 2000. Regulation of expression of methane 685 monooxygenases by copper ions. Trends Microbiol. 8:221-225. 686
58. Neufeld, J., M. Dumont, J. Vohra, and J. Murrell. 2007. Methodological 687 considerations for the use of stable isotope probing in microbial ecology. Microb. Ecol. 688 53:435-442. 689
59. Neufeld, J., H. Schäfer, M. Cox, R. Boden, I. McDonald, and J. Murrell. 2007. 690 Stable-isotope probing implicates Methylophaga spp and novel Gammaproteobacteria in 691 marine methanol and methylamine metabolism. ISME J. 1:480-491. 692
60. Neufeld, J., J. Vohra, M. Dumont, T. Lueders, M. Manefield, M. Friedrich, and J. 693 Murrell. 2007. DNA stable-isotope probing. Nat. Protoc. 2:860-866. 694
61. Neufeld, J. D., R. Boden, H. Moussard, H. Schafer, and J. C. Murrell. 2008. 695 Substrate-specific clades of active marine methylotrophs associated with a phytoplankton 696 bloom in a temperate coastal environment. Appl. Environ. Microbiol. 74:7321-7328. 697
62. Niemann, H., T. Losekann, D. de Beer, M. Elvert, T. Nadalig, K. Knittel, R. Amann, 698 E. Sauter, M. Schluter, M. Klages, J. P. Foucher, and A. Boetius. 2006. Novel 699 microbial communities of the Haakon Mosby mud volcano and their role as a methane 700 sink. Nature 443:854-858. 701
63. Op den Camp, H. J. M., T. Islam, M. B. Stott, H. R. Harhangi, A. Hynes, S. 702 Schouten, M. S. M. Jetten, N.-K. Birkeland, A. Pol, and P. F. Dunfield. 2009. 703 Environmental, genomic and taxonomic perspectives on methanotrophic 704 Verrucomicrobia. Environ. Microbiol. Rep. 1:293-306. 705
64. Osborn, M., E. R. B. Moore, and K. N. Timmis. 2000. An evaluation of terminal-706 restriction fragment length polymorphism (T-RFLP) analysis for the study of microbial 707 community structure and dynamics. Environ. Microbiol. 2:39-50. 708
65. Padda, R. S., K. K. Pandey, S. Kaul, V. D. Nair, R. K. Jain, S. K. Basu, and T. 709 Chakrabarti. 2001. A novel gene encoding a 54 kDa polypeptide is essential for butane 710 utilization by Pseudomonas sp. IMT37. Microbiology 147:2479-2491. 711
66. Qiu, Q., R. Conrad, and Y. Lu. 2009. Cross-feeding of methane carbon among bacteria 712 on rice roots revealed by DNA-stable isotope probing. Environ. Microbiol. Rep. 1:355-713 361. 714
67. Radajewski, S., P. Ineson, N. Parekh, and J. Murrell. 2000. Stable-isotope probing as 715 a tool in microbial ecology. Nature 403:646-649. 716
68. Reeburgh, W. 2007. Oceanic methane biogeochemistry. Chem. Rev. 107:486-513. 717 69. Schütte, U., Z. Abdo, S. Bent, C. Shyu, C. Williams, J. Pierson, and L. Forney. 2008. 718
Advances in the use of terminal restriction fragment length polymorphism (T-RFLP) 719 analysis of 16S rRNA genes to characterize microbial communities. Appl. Microbiol. 720 Biotechnol. 80:365-380. 721
70. Shennan, J. 2006. Utilisation of C2-C4 gaseous hydrocarbons and isoprene by 722 microorganisms. J. Chem. Technol. Biotechnol. 81: 237 - 256. 723
71. Shibe, T., and J. F. Imhoff. 2005. Genus XVIII. Roseobacter, p. 212-215. In G. Garrity, 724 D. J. Brenner, N. R. Krieg, and J. R. Staley (ed.), Bergey's Manual of Systematic 725 Bacteriology, 2nd ed, vol. 2: The Proteobacteria Part C The Alpha-, Beta-, Delta-, and 726 Epsilonproteobacteria Springer, New York. 727
29
72. Sieburth, J., P. Johnson, M. Eberhardt, M. Sieracki, M. Lidstrom, and D. Laux. 728 1987. The first methane-oxidizing bacterium from the upper mixing layer of the deep 729 ocean: Methylomonas pelagica sp. nov. Curr. Microbiol. 14:285-293. 730
73. Sluis, M., L. Sayavedra-Soto, and D. Arp. 2002. Molecular analysis of the soluble 731 butane monooxygenase from 'Pseudomonas butanovora'. Microbiology 148:3617-3629. 732
74. Smith, K., A. Costello, and M. Lidstrom. 1997. Methane and trichloroethylene 733 oxidation by an estuarine methanotroph, Methylobacter sp. strain BB5. 1. Appl. Environ. 734 Microbiol. 63:4617-4620. 735
75. Sorokin, D. Y., F. A. Rainey, R. I. Webb, and J. A. Fuerst. 2005. Genus XXV. 736 Sulfitobacter, p. 224-228. In G. Garrity, D. J. Brenner, N. R. Krieg, and J. R. Staley (ed.), 737 Bergey's Manual of Systematic Bacteriology, 2nd ed, vol. 2: The Proteobacteria Part C 738 The Alpha-, Beta-, Delta-, and Epsilonproteobacteria Springer, New York. 739
76. Tamura, K., J. Dudley, M. Nei, and S. Kumar. 2007. MEGA4: molecular evolutionary 740 genetics analysis (MEGA) software version 4.0. Mol. Biol. Evol. 24:1596-1599. 741
77. Tavormina, P., W. Ussler III, and V. Orphan. 2008. Planktonic and sediment-742 associated aerobic methanotrophs in two seep systems along the North American margin. 743 Appl. Environ. Microbiol. 74:3985-3995. 744
78. Treude, T., and W. Ziebis. in press. Methane oxidation in permeable sediments at 745 hydrocarbon seeps in the Santa Barbara Channel, California. Biogeosciences. 746
79. Urakami, T., and K. Komagata. 1987. Characterization of species of marine 747 methylotrophs of the genus Methylophaga. Int. J. Syst. Evol. Microbiol. 37:402-406. 748
80. Valentine, D., D. Blanton, W. Reeburgh, and M. Kastner. 2001. Water column 749 methane oxidation adjacent to an area of active hydrate dissociation, Eel River Basin. 750 Geochim. Cosmochim. Acta 65:2633-2640. 751
81. Wang, Q., G. Garrity, J. Tiedje, and J. Cole. 2007. Naive Bayesian classifier for rapid 752 assignment of rRNA sequences into the new bacterial taxonomy. Appl. Environ. 753 Microbiol. 73:5261-5267. 754
82. Wasmund, K., D. Kurtboke, K. Burns, and D. Bourne. 2009. Microbial diversity in 755 sediments associated with a shallow methane seep in the tropical Timor Sea of Australia 756 reveals a novel aerobic methanotroph diversity. FEMS Microbiol. Ecol. 68:142-151. 757
83. Xiao, Y., J. Logan, D. Jacob, R. Hudman, R. Yantosca, and D. Blake. 2008. Global 758 budget of ethane and regional constraints on US sources. Journal of Geophysical 759 Research-Atmospheres 113:D21306. 760
84. Yakimov, M., K. Timmis, and P. Golyshin. 2007. Obligate oil-degrading marine 761 bacteria. Curr. Opin. Biotechnol. 18:257-266. 762
85. Yan, T., Q. Ye, J. Zhou, and C. Zhang. 2006. Diversity of functional genes for 763 methanotrophs in sediments associated with gas hydrates and hydrocarbon seeps in the 764 Gulf of Mexico. FEMS Microbiol. Ecol. 57:251-259. 765
766 767

Figure 1
A. 13
C enrichment of phospholipid fatty acids in initial sediment (t0) and at final time points of 13
C methane (M), ethane (E), and propane (P) incubations and 12
C controls. 16:1 and 18:1
isomers were not differentiated. Dashed line indicates natural abundance levels of 13
C.
B. Proportion of 13
C incorporated into each fatty acid.
Figure 2
Mass spectra for the 16:1 fatty acid molecular ion peak, showing the extent of 13
C- labeling at the
final time point of the methane, ethane and propane incubations. The m/z range of the spectra
span the full range from no 13
C incorporation (m/z = 268) to fully 13
C- labeled (m/z = 268+16 =
284). The spectra oriented upward correspond to incubations with 13
C label, whereas the
inverted spectra correspond with control incubations with substrate lacking 13
C label. Each
spectrum is normalized to the height of its tallest peak.
Figure 3
Relative abundances of 16S rRNA sequences in clone libraries from ‘heavy’ DNA (fraction 4 or
6 or both, noted as A and B) from the three time points of the 13
C methane, ethane, and propane
incubations, selected controls (‘light’ DNA from the 13C incubations and ‘heavy’ DNA from the 12
C controls), and the initial sediment. Sequences were grouped using the RDP Classifier tool;
“other” combines sequences that, classified at the order level, represented less than 5% of the
clones in any individual clone library. Representative sequences from each of the groups
indicated in methane, ethane, or propane oxidation are included in the phylogenetic tree in Figure
4.
Figure 4
Neighbor-joining phylogenetic trees of the 16S rRNA gene sequences from groups indicated in
methane, ethane, or propane oxidation, based on their abundance in both the ‘heavy’ DNA clone
libraries and the ‘heavy’ T-RFLP fractions, relative to ‘light’ DNA and 12
C controls.
Gammaproteobacteria are shown in A and Betaproteobacteria in B. Sequences from this study
are shown in bold, with predicted MspI T-RF length in parentheses. Reference sequences from
GenBank are shown with accession numbers in parentheses. Filled circles indicate bootstrap
values above 90% and open circles bootstrap values above 50% (2000 replicates).
Figure 5
Neighbor-joining phylogenetic tree of pmoA gene sequences from seep sediment (t0) and
methane and ethane ‘heavy’ DNA sequences, plus reference sequences from GenBank
(accession numbers in parentheses). Only the divergent sequences from the ethane SIP sample
are shown; others were identical to those in the t0 and methane SIP samples. Filled circles
indicate bootstrap values above 90% and open circles bootstrap values above 50% (2000
replicates). Alphaproteobacterial pmoA and Gammaproteobacterial amoA sequences are
condensed for clarity.
Figure 6
T-RFLP fingerprinting of the 16S rRNA gene in density gradient fractions from Day 3 of the 13
C
(A) and 12
C (B) methane, Day 6 of the 13
C (C) and 12
C (D) ethane, and Day 6 of the 13
C (E) and 12
C (F) propane incubations. Major T-RFs were identified by in silico digestions of clone library

sequences with MspI. Less abundant T-RFs (<5% of total peak area in any of the ‘heavy’
fractions) were combined and are shown as “other.” Fractions with insufficient DNA for analysis
are left blank.
Supplementary Information Figure 1
T-RFLP fingerprinting of the 16S rRNA gene in density gradient fractions from Day 6 (A and B)
and Day 9 (C and D) of the methane incubations. Major T-RFs were identified by in silico
digestions of clone library sequences with MspI. Less abundant T-RFs (<5% of total peak area in
any of the ‘heavy’ fractions) were combined and are shown as “other.” Fractions with
insufficient DNA for analysis are left blank.
Supplementary Information Figure 2
T-RFLP fingerprinting of the 16S rRNA gene in density gradient fractions from Day 3 (A and B)
and Day 9 (C and D) of the ethane incubations. Major T-RFs were identified by in silico
digestions of clone library sequences with MspI. Less abundant T-RFs (<5% of total peak area in
any of the ‘heavy’ fractions) were combined and are shown as “other.” Fractions with
insufficient DNA for analysis are left blank.
Supplementary Information Figure 3
T-RFLP fingerprinting of the 16S rRNA gene in density gradient fractions from Day 3 (A and B)
and Day 14 (C and D) of the propane incubations. Major T-RFs were identified by in silico
digestions of clone library sequences with MspI. Less abundant T-RFs (<5% of total peak area in
any of the ‘heavy’ fractions) were combined and are shown as “other.” Fractions with
insufficient DNA for analysis are left blank.
Supplementary Information Figure 4
Quantification of DNA recovered from SIP gradient fractions at day 3 and the final time point
(Day 9 or 14), determined using the PicoGreen dsDNA assay kit. Concentrations are normalized
to the maximum value observed in each sample.


Methane 10-6-05 (494)
Methane 10-6-17 (492)
Methane 2-4-18 (494)
Methylotenera mobilis (DQ287786)
Beta proteobacterium BP-5 (AY145571)
Methylophilus methylotrophus (AB193724)
Methylobacillus flagellatus (DQ287787)
Methylophilaceae
Marine bacterium HIMB624 (EU433381)
Nitrosomonas marina (Z46990)
0.01
A. Gammaproteobacteria
B. Betaproteobacteria
Methylobacter sp. BB5.1 (AF016981)
Methylobacter marinus (AF304197)
Methylobacter luteus (AF304195)
Methylosarcina lacus (AY007296)
Methylomonas pelagica (U05570)
Methylococcaceae SF-BR (AB453959)
Methane 10-6-04 (491)
Methane 2-4-08 (491)
Bathymodiolus symbiont (AB036710)
Methane 10-6-30 (491)
Methylococcaceae T2-1 (AB453958)
Methane Methylococcaceae
Methylococcaceae ET-SHO (AB453956)
Propane 20-4-29 (487)
Ethane 12-4-02 (496)
Propane 20-4-04 (496)
Methylococcaceae ET-HIRO (AB453957)
Ethane Methylococcaceae
Cycloclasticus pugetii (U12624)
Methane 2-4-18 (494)
Methane 10-6-24 (492)
Methylophaga thalassica (X87339)
Methylophaga sulfidovorans (X95461)
Methylophaga marina (X87338)
Methane 2-6-15 (494)
Methane 10-6-20 (494)
Arctic Ocean clone S11-106 (EU287289)
Methane 2-4-17 (494)
Methane 2-4-12 (496)
Mud Volcano clone HMMVCen-15 (AJ704664)
Methylophaga
Vibrio parahaemolyticus (X74720)
Neptunomonas japonica (AB291228)
Thalassolituus oleivorans (AJ431699)
Alcanivorax borkumensis (Y12579)
Microbulbifer maritimus (GQ334398)
Marinobacter hydrocarbonoclasticus
Pseudomonas stutzeri (U26262)
Marinimicrobium koreense (AY839869)
Saccharophagus degradans 2-40 (AF055269)
Propane 20-4-05 (489)
Propane 6-6-03 (487)
Propane 6-6-04 (487)
Propane 6-6-09 (489)
Sponge symbiont clone Hg9Co18 (EU236291)
Artic Ocean clone B78-19 (EU286983)
Clone Nit5Au0613 746 (FJ628337)
Propane Group
0.01
t0 pmo-7
seep clone Kuro-pmoA-12 (AB176934)
t0 pmo-9
Bubsed 11G (EU444853)
Bubsed 8A (EU444860)
seep clone FE2pmoA19 (EU982953)
methane SIP pmo-16
seep clone Jaco 0.2 27 (FJ858349)
t0 pmo-16
methane SIP pmo-12
ERBWC 10F (EU444840)
methane SIP pmo-4
t0 pmo-6
methane SIP pmo-6
t0 pmo-30
t0 pmo-29
endosymbiont clone M34.3 (AM283468)
Bubsed 10D (EU444850)
t0 pmo-32
seep clone GC233 B09 (DQ514629)
t0 pmo-1
clone Bsedi-68 (EF623663)
t0 pmo-36
Bubsed 12C (EU444854)
Methylobacter sp. BB5.1 (AF016982)
Timor Sea clone TS-S P-54 (EU417479)
t0 pmo-4
Bubsed 6D (EU444858.1)
methane SIP pmo-18
t0 pmo-13
marine SIP clone hpD01pmoA (EU595514)
Methylomicrobium pelagicum (U31652)
Methylosoma difficile (DQ119047)
rice root clone R20dO0-9 (FM986172)
Methylomonas methanica (U31653)
methane SIP pmo-3
t0 pmo-2
SMBWC 12C (EU444843)
Methylococcus capsulatus (L40804)
Nitrosococcus oceani amoA (AF509003)
Alphaproteobacteria pmoA
Crenothrix polyspora (DQ295904)
Gammaproteobacteria amoA
ERBWC 3B (EU444837)
Methylococcaceae ET-HIRO 1 (AB453962)
Methylococcaceae ET-SHO 1 (AB453960)
ethane SIP pmo-7
Methylococcaceae ET-HIRO 2 (AB453963)
Methylococcaceae ET-SHO 2 (AB453961)
0.05

Top Related