


Languages
Pages
Legal


ADVANCE SYNERGY BERHAD
(Company No: 1225-D)
COMPANY ANNOUNCEMENT
UNAUDITED INTERIM FINANCIAL REPORT FOR THE QUARTER AND PERIOD ENDED
30 JUNE 2017
UNAUDITED CONDENSED CONSOLIDATED INCOME STATEMENTS
30.06.2017 30.06.2016 30.06.2017 30.06.2016
RM’000 RM’000 RM’000 RM’000
Revenue 56,589 63,283 117,638 124,046
Cost of sales (37,769) (41,216) (77,104) (80,002)
Gross profit 18,820 22,067 40,534 44,044
Other operating income 4,201 2,324 6,675 5,339
Operating expenses (22,814) (21,639) (45,780) (48,218)
Profit/(Loss) from operations 207 2,752 1,429 1,165
Finance costs (1,487) (1,188) (2,574) (2,235)
Share of results of associates and joint venture (273) 565 (508) 994
Profit/(Loss) before tax (1,553) 2,129 (1,653) (76)
Income tax expense (1,052) (1,723) (2,424) (2,872)
Net profit/(loss) for the financial period (2,605) 406 (4,077) (2,948)
Attributable to:
Owners of the parent (3,397) (948) (5,682) (4,599)
Non-controlling interests 792 1,354 1,605 1,651
(2,605) 406 (4,077) (2,948)
Loss per share attributable to owners of the parent:
Basic (sen) (0.51) (0.14) (0.85) (0.69)
Diluted (sen) (0.51) (0.14) (0.85) (0.69)
6 months ended
Year-to-date
The Board of Directors of Advance Synergy Berhad wishes to announce the unaudited financial results of the Group for the
quarter and period ended 30 June 2017.
This interim report is prepared in accordance with Malaysian Financial Reporting Standard (“MFRS”) 134 “Interim
Financial Reporting” and paragraph 9.22 of the Main Market Listing Requirements of Bursa Malaysia Securities Berhad,
and should be read in conjunction with the Group’s audited financial statements for the year ended 31 December 2016.
3 months ended
1

UNAUDITED CONDENSED CONSOLIDATED STATEMENTS OF COMPREHENSIVE INCOME
30.06.2017 30.06.2016 30.06.2017 30.06.2016
RM’000 RM’000 RM’000 RM’000
Net profit/(loss) for the financial period (2,605) 406 (4,077) (2,948)
Other comprehensive income/(expenses):
Items that are or may be reclassified
subsequently to profit or loss:
Share of other comprehensive income
of associates, net of tax - - - 1
Foreign currency translation
differences for foreign operations (1,232) 271 (2,987) (3,225)
Total items that are or may be reclassified
subsequently to profit or loss (1,232) 271 (2,987) (3,224)
Other comprehensive income/(loss) for
the financial period (1,232) 271 (2,987) (3,224)
Total comprehensive income/(loss) for
the financial period (3,837) 677 (7,064) (6,172)
Attributable to:
Owners of the parent (5,294) (478) (9,014) (7,179)
Non-controlling interests 1,457 1,155 1,950 1,007
Total comprehensive income/(loss) for
the financial period (3,837) 677 (7,064) (6,172)
3 months ended 6 months ended
Year-to-date
2
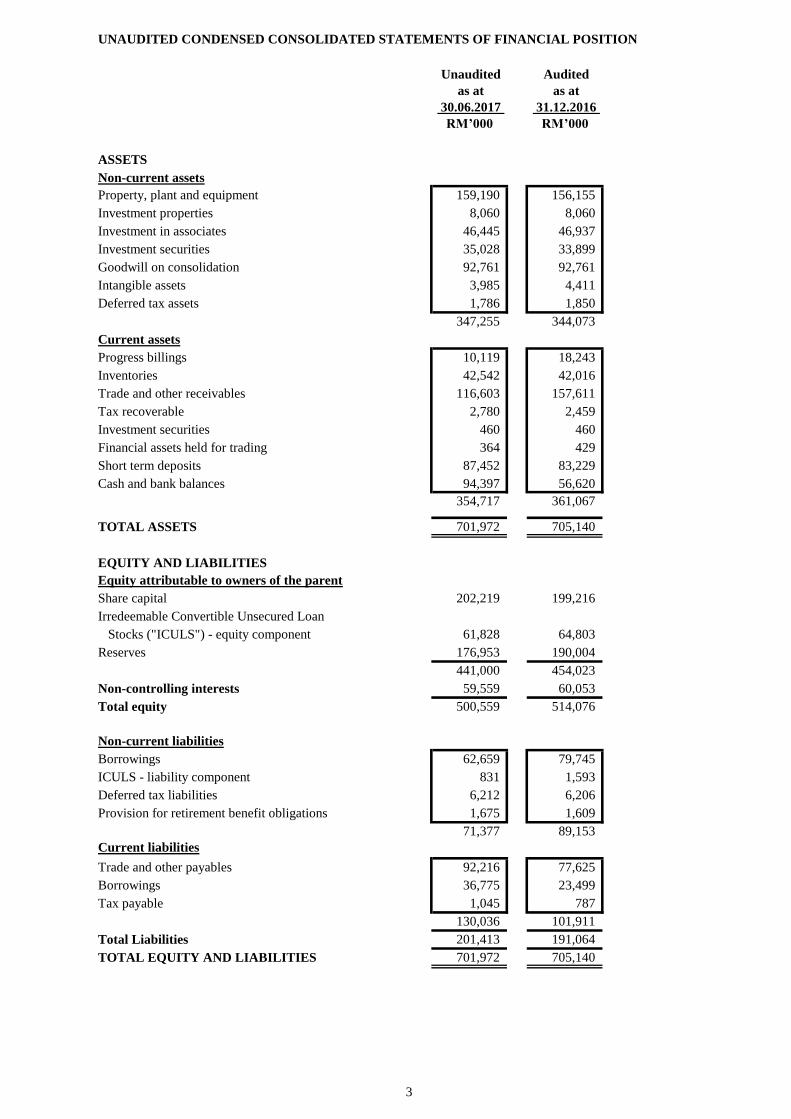
UNAUDITED CONDENSED CONSOLIDATED STATEMENTS OF FINANCIAL POSITION
Audited
Unaudited Audited
as at as at
30.06.2017 31.12.2016
RM’000 RM’000
ASSETS
Non-current assets
Property, plant and equipment 159,190 156,155
Investment properties 8,060 8,060
Investment in associates 46,445 46,937
Investment securities 35,028 33,899
Goodwill on consolidation 92,761 92,761
Intangible assets 3,985 4,411
Deferred tax assets 1,786 1,850
347,255 344,073
Current assets
Progress billings 10,119 18,243
Inventories 42,542 42,016
Trade and other receivables 116,603 157,611
Tax recoverable 2,780 2,459
Investment securities 460 460
Financial assets held for trading 364 429
Short term deposits 87,452 83,229
Cash and bank balances 94,397 56,620
354,717 361,067
TOTAL ASSETS 701,972 705,140
EQUITY AND LIABILITIES
Equity attributable to owners of the parent
Share capital 202,219 199,216
Irredeemable Convertible Unsecured Loan
Stocks ("ICULS") - equity component 61,828 64,803
Reserves 176,953 190,004
441,000 454,023
Non-controlling interests 59,559 60,053
Total equity 500,559 514,076
Non-current liabilities
Borrowings 62,659 79,745
ICULS - liability component 831 1,593
Deferred tax liabilities 6,212 6,206
Provision for retirement benefit obligations 1,675 1,609
71,377 89,153
Current liabilities
Trade and other payables 92,216 77,625
Borrowings 36,775 23,499
Tax payable 1,045 787
130,036 101,911
Total Liabilities 201,413 191,064
TOTAL EQUITY AND LIABILITIES 701,972 705,140
3
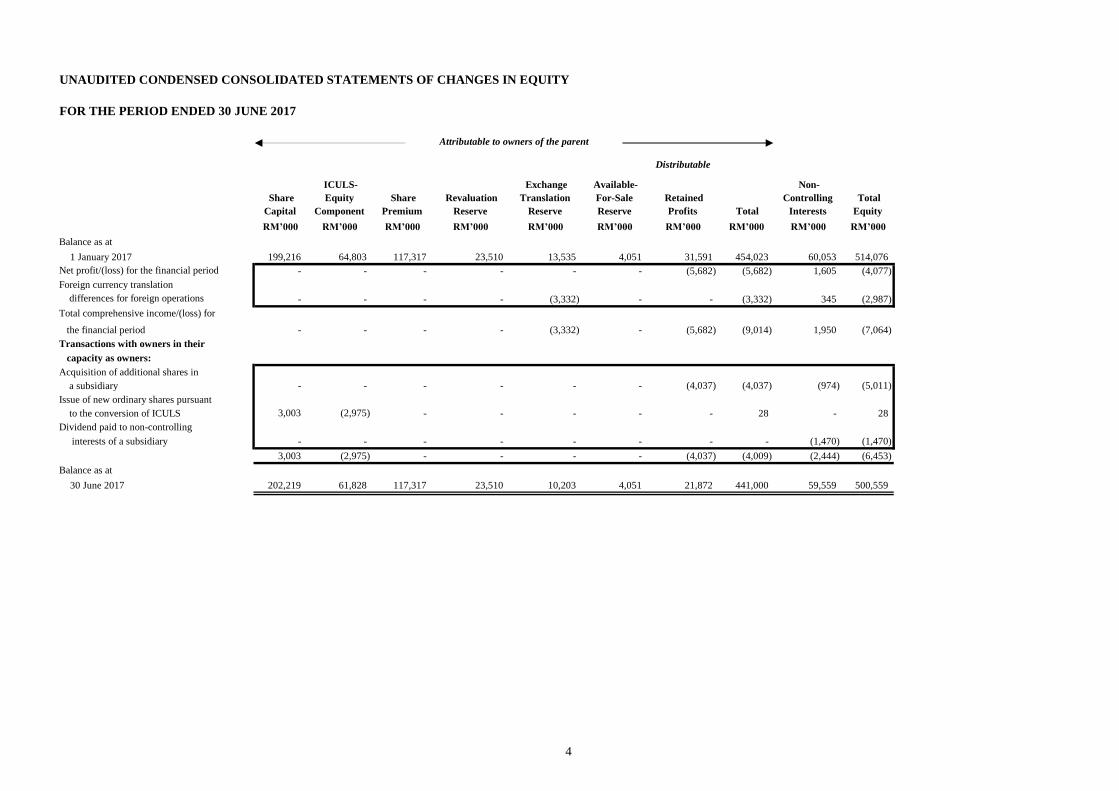
UNAUDITED CONDENSED CONSOLIDATED STATEMENTS OF CHANGES IN EQUITY
FOR THE PERIOD ENDED 30 JUNE 2017
Distributable
RM’000 RM’000 RM’000 RM’000 RM’000 RM’000 RM’000 RM’000 RM’000 RM’000
Balance as at
1 January 2017 199,216 64,803 117,317 23,510 13,535 4,051 31,591 454,023 60,053 514,076
Net profit/(loss) for the financial period - - - - - - (5,682) (5,682) 1,605 (4,077)
Foreign currency translation
differences for foreign operations - - - - (3,332) - - (3,332) 345 (2,987)
Total comprehensive income/(loss) for
the financial period - - - - (3,332) - (5,682) (9,014) 1,950 (7,064)
Transactions with owners in their
capacity as owners:
Acquisition of additional shares in
a subsidiary - - - - - - (4,037) (4,037) (974) (5,011)
Issue of new ordinary shares pursuant
to the conversion of ICULS 3,003 (2,975) - - - - - 28 - 28
Dividend paid to non-controlling
interests of a subsidiary - - - - - - - - (1,470) (1,470)
3,003 (2,975) - - - - (4,037) (4,009) (2,444) (6,453)
Balance as at
30 June 2017 202,219 61,828 117,317 23,510 10,203 4,051 21,872 441,000 59,559 500,559
Attributable to owners of the parent
Retained
Profits Total
Non-
Controlling
Interests
ICULS-
Equity
Component
Total
Equity
Share
Capital
Share
Premium
Revaluation
Reserve
Exchange
Translation
Reserve
Available-
For-Sale
Reserve
4

UNAUDITED CONDENSED CONSOLIDATED STATEMENTS OF CHANGES IN EQUITY
FOR THE PERIOD ENDED 30 JUNE 2017 (Continued)
Distributable
RM’000 RM’000 RM’000 RM’000 RM’000 RM’000 RM’000 RM’000 RM’000 RM’000
Balance as at
1 January 2016 199,216 64,861 117,317 15,998 8,699 4,987 28,921 439,999 39,155 479,154
Net profit/(loss) for the financial period - - - - - - (4,599) (4,599) 1,651 (2,948)
Share of other comprehensive income
of associates, net of tax - - - - - 1 - 1 - 1
Foreign currency translation
differences for foreign operations - - - - (2,581) - - (2,581) (644) (3,225)
Total comprehensive income/(loss) for
the financial period - - - - (2,581) 1 (4,599) (7,179) 1,007 (6,172)
Transactions with owners in their
capacity as owners:
Disposal of interest in a
subsidiary - - - (183) 43 - 280 140 - 140
Disposal of partial interest in
a subsidiary - - - - - - - - 443 443
Acquisition of additional shares in
a subsidiary - - - - - - 192 192 (192) -
Changes in income tax rate - (58) - - - - - (58) - (58)
- (58) - (183) 43 - 472 274 251 525
Balance as at
30 June 2016 199,216 64,803 117,317 15,815 6,161 4,988 24,794 433,094 40,413 473,507
Revaluation
Reserve
Exchange
Translation
Reserve
Retained
Profits Total
Non-
Controlling
Interests
Total
Equity
Attributable to owners of the parent
Share
Capital
Share
Premium
ICULS-
Equity
Component
Available-
For-Sale
Reserve
5
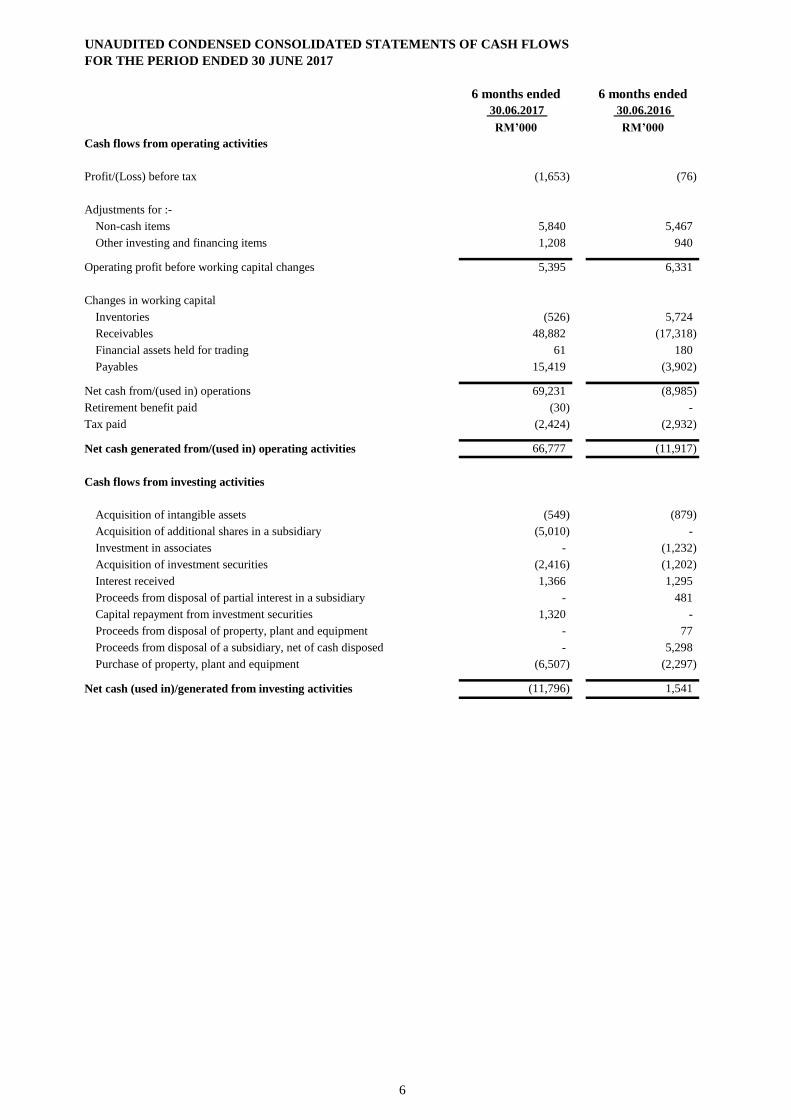
UNAUDITED CONDENSED CONSOLIDATED STATEMENTS OF CASH FLOWS
FOR THE PERIOD ENDED 30 JUNE 2017
Unaudited Audited
6 months ended 6 months ended
30.06.2017 30.06.2016
RM’000 RM’000
Cash flows from operating activities
Profit/(Loss) before tax (1,653) (76)
Adjustments for :-
Non-cash items 5,840 5,467
Other investing and financing items 1,208 940
Operating profit before working capital changes 5,395 6,331
Changes in working capital
Inventories (526) 5,724
Receivables 48,882 (17,318)
Financial assets held for trading 61 180
Payables 15,419 (3,902)
Net cash from/(used in) operations 69,231 (8,985)
Retirement benefit paid (30) -
Tax paid (2,424) (2,932)
Net cash generated from/(used in) operating activities 66,777 (11,917)
Cash flows from investing activities
Acquisition of intangible assets (549) (879)
Acquisition of additional shares in a subsidiary (5,010) -
Investment in associates - (1,232)
Acquisition of investment securities (2,416) (1,202)
Interest received 1,366 1,295
Proceeds from disposal of partial interest in a subsidiary - 481
Capital repayment from investment securities 1,320 -
Proceeds from disposal of property, plant and equipment - 77
Proceeds from disposal of a subsidiary, net of cash disposed - 5,298
Purchase of property, plant and equipment (6,507) (2,297)
Net cash (used in)/generated from investing activities (11,796) 1,541
6
Unaudited Audited
6 months ended 6 months ended
30.06.2017 30.06.2016
RM’000 RM’000
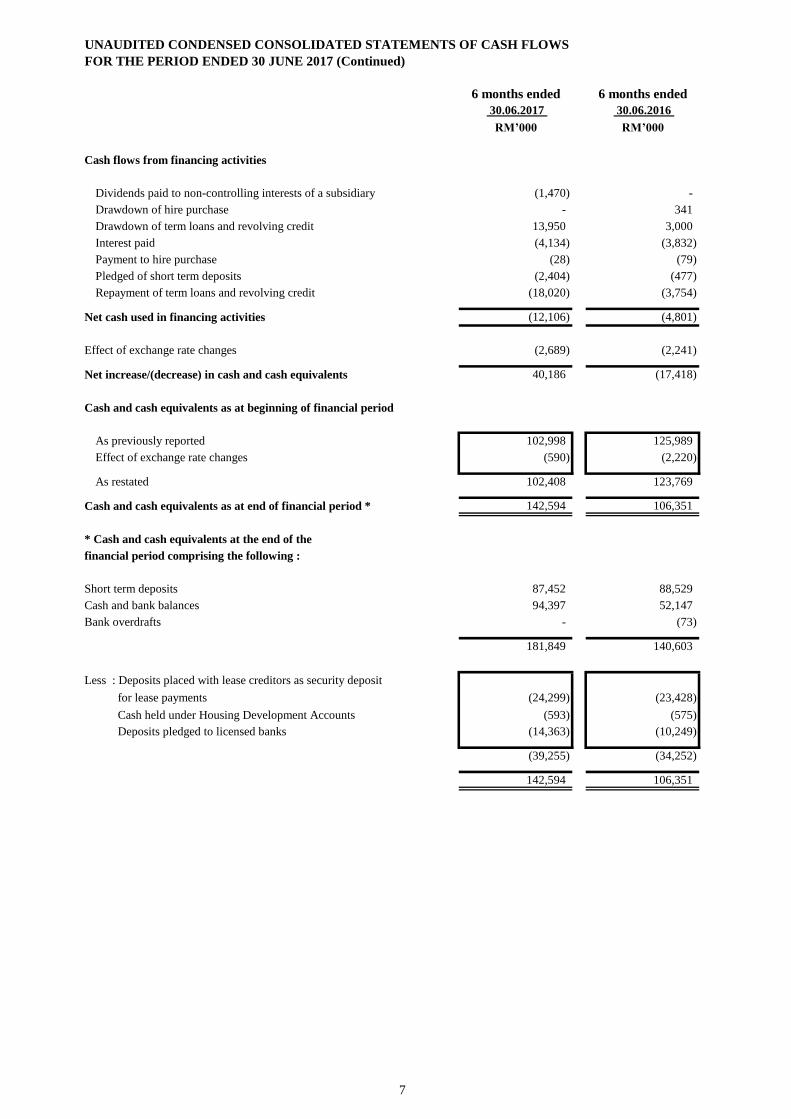
Cash flows from financing activities
Dividends paid to non-controlling interests of a subsidiary (1,470) -
Drawdown of hire purchase - 341
Drawdown of term loans and revolving credit 13,950 3,000
Interest paid (4,134) (3,832)
Payment to hire purchase (28) (79)
Pledged of short term deposits (2,404) (477)
Repayment of term loans and revolving credit (18,020) (3,754)
Net cash used in financing activities (12,106) (4,801)
Effect of exchange rate changes (2,689) (2,241)
Net increase/(decrease) in cash and cash equivalents 40,186 (17,418)
Cash and cash equivalents as at beginning of financial period
As previously reported 102,998 125,989
Effect of exchange rate changes (590) (2,220)
As restated 102,408 123,769
Cash and cash equivalents as at end of financial period * 142,594 106,351
* Cash and cash equivalents at the end of the
financial period comprising the following :
Short term deposits 87,452 88,529
Cash and bank balances 94,397 52,147
Bank overdrafts - (73)
181,849 140,603
Less : Deposits placed with lease creditors as security deposit
for lease payments (24,299) (23,428)
Cash held under Housing Development Accounts (593) (575)
Deposits pledged to licensed banks (14,363) (10,249)
(39,255) (34,252)
142,594 106,351
UNAUDITED CONDENSED CONSOLIDATED STATEMENTS OF CASH FLOWS
FOR THE PERIOD ENDED 30 JUNE 2017 (Continued)
7

NOTES TO THE INTERIM FINANCIAL REPORT
1. Basis of preparation
2. Significant accounting policies
Amendments/Improvements to MFRSs
MFRS 12 Disclosures of Interests in Other Entities
MFRS 107 Statements of Cash Flows
MFRS 112 Income Taxes
New MFRSs and IC Int and Amendments/Improvements to MFRSs issued but not yet effective
New MFRSs
MFRS 9 Financial Instruments
MFRS 15 Revenue from Contracts with Customers
MFRS 16 Leases
Amendments/Improvements to MFRSs
MFRS 1 First-time adoption of MFRSs
MFRS 2 Share-based Payment
MFRS 4 Insurance Contracts
MFRS 10 Consolidated Financial Statements
MFRS 128 Investments in Associates and Joint Ventures
MFRS 140 Investment Property
New IC Int
IC Int 22 Foreign Currency Transactions and Advance Consideration
3 Audit report
4 Seasonal or cyclical factors
5. Unusual items
1 January 2018/
Deferred
There were no unusual significant items during the quarter under review.
The auditors’ report on the financial statements for the year ended 31 December 2016 was not subject to any
qualification.
The operations of the Group for the quarter ended 30 June 2017 were not materially affected by any seasonal or
cyclical factors.
1 January 2018
1 January 2018
Deferred
1 January 2019
1 January 2018
1 January 2018
1 January 2018
1 January 2018
1 January 2018
The unaudited interim financial report has been prepared in compliance with MFRS 134 - “Interim Financial
Reporting” and paragraph 9.22 of the Main Market Listing Requirements of Bursa Malaysia Securities Berhad
(“Bursa Securities”). The unaudited interim financial report should be read in conjunction with the audited financial
statements of the Group for the financial year ended 31 December 2016.
The accounting policies and methods of computation adopted by the Group in this interim financial report are
consistent with those adopted in the audited financial statements for the financial year ended 31 December 2016,
except for the adoption of the following new and revised Malaysian Financial Reporting Standards (“MFRS”),
amendments/improvements to MFRSs, IC Interpretations (“IC Int”) and amendment to IC Int:
The adoption of the above amendments/improvements to MFRSs will have no significant impact on the financial
statements of the Group upon their initial application.
The following new MFRSs, Amendments/Improvements to MFRSs and IC Int that are issued but are not yet effective,
have yet to be adopted by the Group:
Effective for
financial periods
beginning on or
after
8
6. Changes in estimates
7 Debt and equity securities
8 Dividends paid
There was no payment of any dividend during the financial period ended 30 June 2017.
For the financial period ended 30 June 2017, a total of 20,019,600 2% 10-Year Irredeemable Convertible Unsecured
Loan Stocks at 100% of the nominal value of RM0.15 each (“ICULS”) have been converted into 10,009,800 new
ordinary shares at RM0.30 each in the Company by surrendering for cancellation two ICULS for every one new
ordinary share of the Company.
Apart from the above, there were no issuances, cancellations, repurchases, resale and/or repayments of debt and equity
securities during the financial period ended 30 June 2017.
There were no changes in estimates of amounts reported in prior financial years that have a material effect in the
quarter under review.
9

9. Segmental Information
For the financial period ended 30 June 2017
RM’000 RM’000 RM’000 RM’000 RM’000 RM’000 RM’000 RM’000
Revenue
External 305 29,588 29,409 819 50,943 6,574 - 117,638
Inter-segment 843 - - - 190 - (1,033) -
Total revenue 1,148 29,588 29,409 819 51,133 6,574 (1,033) 117,638
Results
Segment results (3,915) 3,220 3,866 66 718 (5,100) - (1,145)
Share of results of associates
and joint venture (456) (38) - - (14) - - (508)
Profit/(Loss) before tax (4,371) 3,182 3,866 66 704 (5,100) - (1,653)
Income tax expense (2,424)
Net profit/(loss) for the
financial period (4,077)
Non-controlling interests (1,605)
Net profit/(loss) for the financial
period attributable to owners of
the parent (5,682)
Travel &
Tours
Property
Development Total
Investment
Holding
Hotels &
Resorts Eliminations
Information &
Communications
Technology Others
10
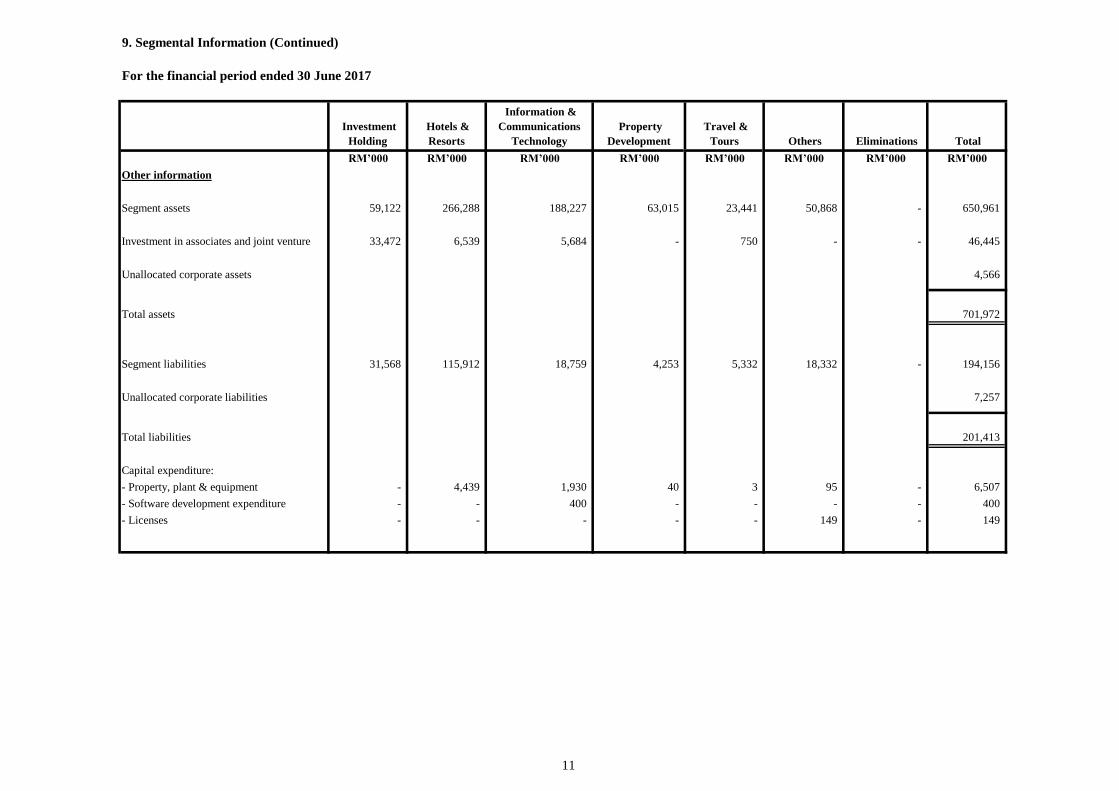
9. Segmental Information (Continued)
For the financial period ended 30 June 2017
RM’000 RM’000 RM’000 RM’000 RM’000 RM’000 RM’000 RM’000
Other information
Segment assets 59,122 266,288 188,227 63,015 23,441 50,868 - 650,961
Investment in associates and joint venture 33,472 6,539 5,684 - 750 - - 46,445
Unallocated corporate assets 4,566
Total assets 701,972
Segment liabilities 31,568 115,912 18,759 4,253 5,332 18,332 - 194,156
Unallocated corporate liabilities 7,257
Total liabilities 201,413
Capital expenditure:
- Property, plant & equipment - 4,439 1,930 40 3 95 - 6,507
- Software development expenditure - - 400 - - - - 400
- Licenses - - - - - 149 - 149
Travel &
Tours
Investment
Holding Total Eliminations Others
Property
Development
Hotels &
Resorts
Information &
Communications
Technology
11
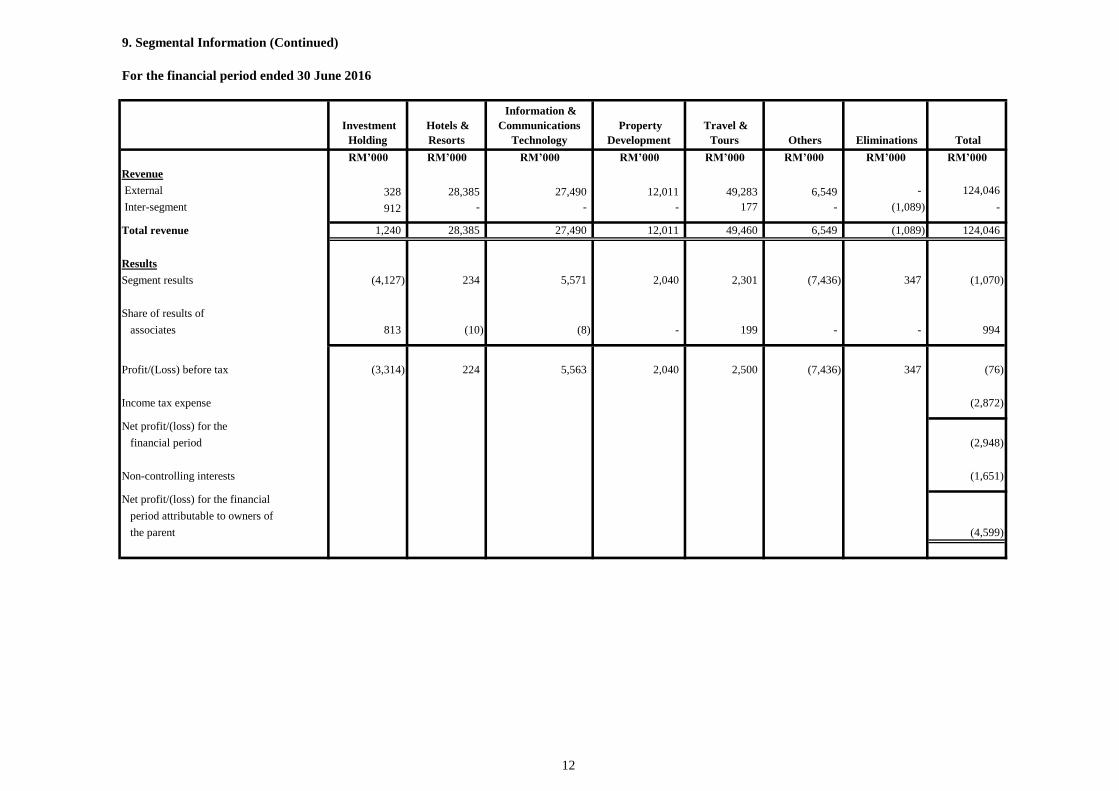
9. Segmental Information (Continued)
For the financial period ended 30 June 2016
RM’000 RM’000 RM’000 RM’000 RM’000 RM’000 RM’000 RM’000
Revenue
External 328 28,385 27,490 12,011 49,283 6,549 - 124,046
Inter-segment 912 - - - 177 - (1,089) -
Total revenue 1,240 28,385 27,490 12,011 49,460 6,549 (1,089) 124,046
Results
Segment results (4,127) 234 5,571 2,040 2,301 (7,436) 347 (1,070)
Share of results of
associates 813 (10) (8) - 199 - - 994
Profit/(Loss) before tax (3,314) 224 5,563 2,040 2,500 (7,436) 347 (76)
Income tax expense (2,872)
Net profit/(loss) for the
financial period (2,948)
Non-controlling interests (1,651)
Net profit/(loss) for the financial
period attributable to owners of
the parent (4,599)
Travel &
Tours
Investment
Holding
Property
Development Eliminations Total
Hotels &
Resorts
Information &
Communications
Technology Others
12
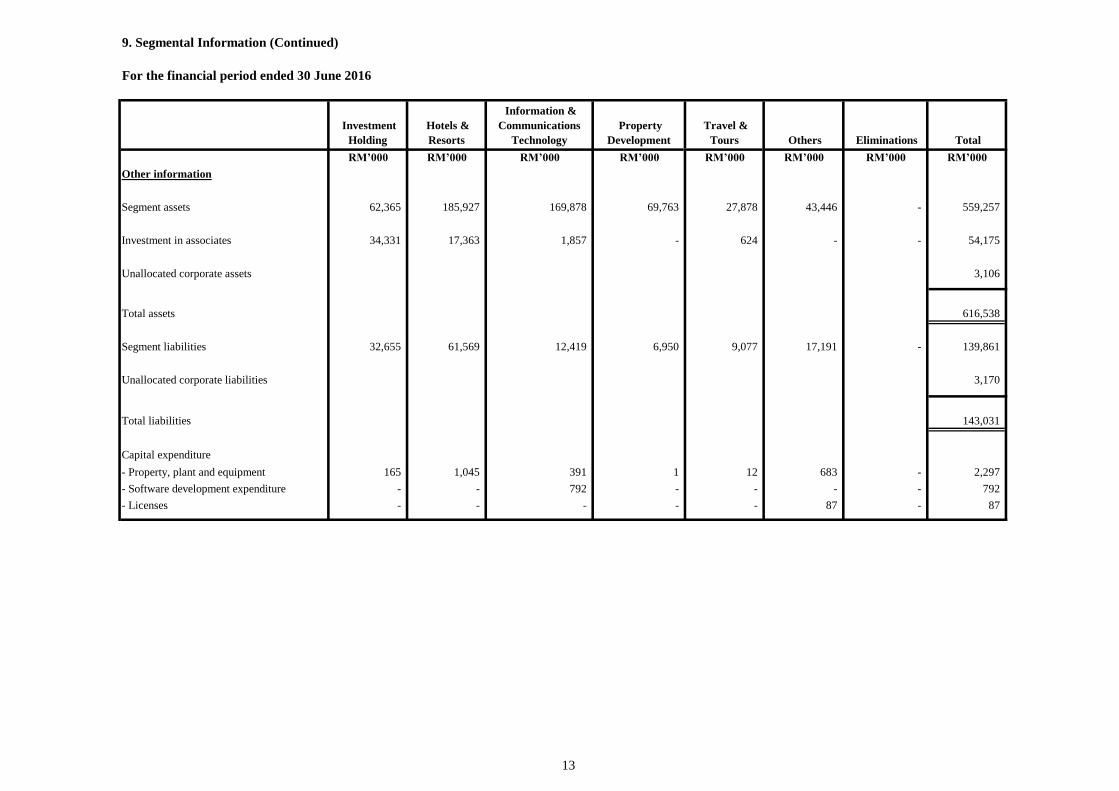
9. Segmental Information (Continued)
For the financial period ended 30 June 2016
RM’000 RM’000 RM’000 RM’000 RM’000 RM’000 RM’000 RM’000
Other information
Segment assets 62,365 185,927 169,878 69,763 27,878 43,446 - 559,257
Investment in associates 34,331 17,363 1,857 - 624 - - 54,175
Unallocated corporate assets 3,106
Total assets 616,538
Segment liabilities 32,655 61,569 12,419 6,950 9,077 17,191 - 139,861
Unallocated corporate liabilities 3,170
Total liabilities 143,031
Capital expenditure
- Property, plant and equipment 165 1,045 391 1 12 683 - 2,297
- Software development expenditure - - 792 - - - - 792
- Licenses - - - - - 87 - 87
Travel &
Tours Eliminations Total Others
Property
Development
Investment
Holding
Hotels &
Resorts
Information &
Communications
Technology
13

10. Property, plant and equipment
11. Significant events after the reporting period
12. Changes in the composition of the Group
13. Changes in contingent liabilities
14. Review of performance
30.06.2017 30.06.2016 Changes
RM’000 RM’000 %
Revenue 117,638 124,046 -5.2%
Profit/(Loss) from operations 1,429 1,165 22.7%
Profit/(Loss) before tax (1,653) (76) -2075.0%
Net profit/(loss) for the financial period (4,077) (2,948) -38.3%
Net profit/(loss) for the financial period
attributable to the Owners of the Parent (5,682) (4,599) -23.5%
Overall performance
Investment Holding
Hotels & Resorts
Information & Communications Technology
The division recorded a higher loss before tax of RM4.4 million for 6M 2017 compared to a loss before tax of RM3.3
million for 6M 2016. This was mainly attributable to the lower results of the associated companies.
For the current 6-month period ended 30 June 2017 (“6M 2017”), the Group recorded a lower revenue of RM117.6
million compared to a revenue of RM124.0 million for the corresponding period last year (“6M 2016”). The revenue of
Property Development division showed a decrease of RM11.2 million for 6M 2017 compared to 6M 2016 offset by
increase in revenue for Information & Communications Technology (“ICT”), Travel & Tours and Hotels & Resorts
divisions by RM1.9 million, RM1.7 million and RM1.2 million respectively. The Group recorded a higher loss before tax
of RM1.7 million for 6M 2017 as compared to a loss before tax of RM0.1 million for 6M 2016 mainly due to the
flowdown effect of lower revenue coupled with higher finance cost and lower results of the associated companies but
mitigated by higher other operating income and lower operating expenses.
The division recorded a flat revenue, in Singapore dollars (S$), for the 6M 2017 compared to the revenue in 6M 2016
with higher system sale contract revenue recorded by GlobeOSS business unit (“BU”) and higher revenue share contract
revenue recorded by Unifiedcomms BU, offset by lower system sale contract revenue recorded by Unifiedcomms BU.
However, upon translation of the revenue in S$ to RM, the revenue from ICT division for the period under review of
RM29.4 million was higher compared to the revenue in 6M 2016 of RM27.5 million, an increase of RM1.9 million,
attributable mainly to the higher foreign currency exchange rate for 6M 2017 compared to 6M 2016.
The division recorded a lower profit before tax of RM3.9 million for 6M 2017 compared to RM5.6 million for 6M 2016
mainly attributable to an overall reduction in its gross profit margin primarily due to higher proportionate contribution of
system sale contract revenue by GlobeOSS BU which generally delivers lower gross profit margin coupled with lower
gross profit margin on certain managed service contracts due to higher third-party costs and lower revenue contribution
of certain mature, higher-margin managed service contracts.
The Hotels & Resorts division registered a higher revenue for 6M 2017 of RM29.6 million compared to RM28.4 million
for 6M 2016 and a higher profit before tax of RM3.2 million in 6M 2017 compared to RM0.2 million for 6M 2016. For
the period under review, overall, the Hotels & Resorts division achieved a higher average occupancy rate and average
room rate for 6M 2017 compared to 6M 2016.
The valuation of land and buildings have been brought forward without amendment from the financial statements for the
year ended 31 December 2016.
There were no changes in contingent liabilities since the last annual statements of financial position as at 31 December
2016.
Other than the above, there were no changes in the composition of the Group for the current financial period.
On 5 July 2017, 13 July 2017, 20 July 2017 and 25 July 2017, a total of 5,908,600 ICULS have been converted into
2,954,300 new ordinary shares at RM0.30 each in the Company by surrendering for cancellation two ICULS for every
one new ordinary share of the Company.
Apart from the above, there are no significant events after the reporting period.
On 23 January 2017, Holiday Villa Assets Sdn Bhd (“HVA”), an indirect wholly-owned subsidiary of the Company
(held via Alangka-Suka Hotels & Resorts Sdn Bhd, a wholly-owned subsidiary of the Company), completed its
acquisition of the remaining 226 shares in Posthotel Arosa AG (“Arosa”) held by Jacques Rüdisser and Verena Maria
Rüdisser for a cash consideration of CHF1,095,715 (equivalent to RM5.0 million) and thus increased its equity interest
from 62.49% to 65.00%. Consequently, Arosa became a 65.00%-owned subsidiary of HVA.
Year-to-date
6 months ended
14

14. Review of performance (Continued)
Property Development
14. Review of performance (Continued)Travel & Tours
Others
15. Comparison of results with preceding quarter
30.06.2017 31.03.2017 Changes
RM’000 RM’000 %
Revenue 56,589 61,049 -7.3%
Profit/(Loss) from operations 207 1,222 -83.1%
Profit/(Loss) before tax (1,553) (100) -1453.0%
Net profit/(loss) for the financial period (2,605) (1,472) -77.0%
Net profit/(loss) for the financial period
attributable to the Owners of the Parent (3,397) (2,285) -48.7%
Overall performance
Investment Holding
Hotels & Resorts
Information & Communications Technology
Property Development
Travel & Tours
The Travel & Tours division recorded a slightly higher revenue of RM26.3 million in the quarter under review compared
to RM24.9 million in the previous quarter, an increase of RM1.4 million or 5.7%. All inbound and outbound travel and
ticketing businesses recorded higher revenue in the quarter under review. Despite the higher revenue, the division
recorded a slightly lower profit before tax of RM0.2 million in Q2 2017 compared to RM0.5 million in Q1 2017 mainly
attributable to lower gross profit margin.
The Property Development division recorded a lower revenue of RM0.1 million for Q2 2017 compared to RM0.8 million
in Q1 2017. With the lower revenue, this division recorded loss before tax of RM0.1 million for Q2 2017 compared to
profit before tax of RM0.1 million for Q1 2017.
The Investment Holding division recorded a higher loss before tax of RM2.5 million for Q2 2017 compared to loss
before tax of RM1.9 million for Q1 2017 mainly due to higher finance cost inccured in the current quarter under review.
The Hotels & Resorts division's revenue for Q2 2017 was slightly lower at RM13.9 million compared to a revenue of
RM15.7 million in the preceding quarter. Despite the lower revenue for Q2 2017 compared to Q1 2017, the division
recorded a higher profit before tax of RM2.0 million compared to RM1.2 million in Q1 2017. This is mainly attributable
to the additional income in Q2 2017 from the insurance claim of RM2.6 million arising from a fire incident in Arosa.
The ICT division registered a slightly lower revenue for Q2 2017 of RM13.5 million compared to a revenue of RM15.9
million for the preceding quarter mainly due to lower system sale contracts revenue from both GlobeOSS BU and
Unifiedcomms BU. With the lower revenue in Q2 2017, the division reported a lower profit before tax of RM1.3 million
for Q2 2017 compared to RM2.6 million for Q1 2017.
3 months ended
For the current period under review, our Travel & Tours division achieved a higher revenue of RM51.1 million as
compared to a revenue of RM49.5 million for the corresponding period last year, an increase of RM1.7 million mainly
from ticketing and outbound travel sales offset by the lower revenue in the inbound tours division. Despite the higher
revenue, this division recorded a lower profit before tax of RM0.7 million for 6M 2017 compared to RM2.5 million for
6M 2016 mainly due to lower gross profit margin and a higher loss from the inbound tours division due to the flowdown
effect of a reduction in revenue.
The Property Development division registered a lower revenue for 6M 2017 of RM0.8 million compared to RM12.0
million for 6M 2016 mainly due to delay in Federal Park Phase 2 launching. With the lower revenue, this division made a
profit before tax of RM0.1 million for 6M 2017 compared to a profit before tax of RM2.0 million for 6M 2016.
The Others division registered a similar revenue of RM6.6 million for both 6M 2017 and 6M 2016. This division
recorded a lower loss before tax of RM5.1 million for 6M 2017 as compared to a loss of RM7.4 million for 6M 2016
mainly due to lower operating expenses for 6M 2017 and that the operating expenses in 6M 2016 included a loss on
disposal of the loss making manufacturing subsidiary of RM1.6 million.
The Group achieved a revenue of RM56.6 million for the current quarter ended 30 June 2017 (“Q2 2017”) which was
lower compared to the revenue in the previous quarter ended 31 March 2017 (“Q1 2017”) of RM61.0 million, a decrease
of RM4.5 million or 7.3%. However, during the quarter under review, the Group posted a higher other operating income
of RM4.2 million compared to RM2.5 million in Q1 2017. The higher other operating income in Q2 2017 was mainly
contributed by additional income from insurance claim arising from a fire incident in Arosa in Q4 2016. With the
flowdown effect of lower revenue and higher finance cost partly offset by the higher other operating income and lower
operating expenses, the Group recorded a loss before tax of RM1.6 million in the current quarter under review compared
to a loss before tax of RM0.1 million in the preceding quarter.
15

15. Comparison of results with preceding quarter (Continued)
Others
16. Prospects
17. Board of Directors’ opinion on revenue or profit estimate, forecast, projection or internal targets
18. Profit variance and shortfall in profit guarantee
The Others division will remain focused on its key strategies to drive the revenue growth plan although the continued
challenges in 2017 may cause significant uncertainty in the achievement of such revenue growth plan this year. In
addition, the division will focus on improving the execution process and implementing cost saving measures to address
the challenge of rising cost pressure. Further restructuring plans to turnaround non-performing businesses (which may
include ceasation of such business and/or divestment if the restructuring is not successful within a targeted period) will
be implemented to improve the performance of this division.
Our travel and tours division is cautiously optimistic of their performance for the remaining period of 2017 as they
continue to remain focused on building its corporate client base for the ticketing business and in developing and adapting
its products to sustain growth in the leisure and corporate group markets for both inbound and outbound travel and tours.
Our Property Development division expects to face continued challenges in the remaining period of 2017 due to the
softening of the property market in Kuching and the cooling measures on the property market. The division will focus on
developing and launching Phase 2 of its Federal Park project, to drive the earnings of the division for 2017.
The Others division recorded a lower revenue for Q2 2017 of RM2.8 million compared to RM3.7 million in the
preceding quarter. The decrease in revenue was attributable mainly to lower sales in the Coach Building unit. Despite the
lower revenue in the current quarter under review, a lower loss before tax was recorded in Q2 2017 of RM2.4 million
compared to loss before tax of RM2.7 million in the preceding quarter mainly attributable to lower operating costs.
The Group did not previously announce or disclose any revenue or profit estimate, forecast, projection or internal targets
in a public document.
Not Applicable.
Our Board expects the remaining period of 2017 to be challenging for the Group with expected volatility in the global
economy and increasing inflationary pressures in our domestic market.
The Information & Communications Technology (“ICT”) division expects the remainder of financial year 2017 to be
challenging but remain optimistic about growth prospect. Although 2016 proved to be another unexpectedly good year
for business generated from system sale contracts, the division does not expect this to be a trend that can be readily
extended into 2017. Significant uncertainty and hence lumpiness is still to be expected in the contribution of system sale
contracts to the performance of both Unifiedcomms and GlobeOSS businesses. This has been made apparent in the
current quarter's result where system sale contracts revenue for both businesses have shown a sizeable decline against the
prior quarter this year and the corresponding quarter last year. The division will need to continue to strengthen its
managed service contract portfolio to deliver steady and sustainable growth.
With the expected challenging environment, our Board is cautiously optimistic on the implementation of our business
plans. Our Group will continue its focus on measures to improve operational efficiencies and productivity coupled with
cost reduction efforts. To deliver substainable growth in revenues and profits of our major divisions, the Group will
pursue its strategic plans which are already in place to grow our established core businesses and explore attractive
opportunities to expand operations. For the non-core loss-making businesses, we will focus on turnaround restructuring
plans failing which the business unit will cease operations and/or be divested.
Although the Hotels & Resorts division views the business outlook for 2017 to be challenging, the division is cautiously
optimistic taking into consideration our focus on certain encouraging trends in the industry and the anticipated increased
online sales from direct online bookings on our recently launched upgraded website. The division will also focus on
developing business from the Asia region by working with tour operators, local corporate businesses, and be innovative
in securing more residential meetings. Our focus to grow the hotels and resorts businesses regionally will partly mitigate
the anticipated weak local meetings, incentives, conferences and exhibitions (MICE) market for 2017 and the recent
political events in Qatar which have an adverse impact on our hotel performance in Doha, Qatar.
The ICT division will continue to work on improving execution in respect of strategies and tactics to grow its managed
service contract revenues and profit and further build on the improvement achieved for this year. The growing interest
and opportunity in internet-driven application services, new media and applications delivered on an advertisement-
supported or advertisement-funded model continues to be recognised by its management. The ICT division’s strategic
and venture investment plans in the year ahead will continue to focus primarily on these growth businesses in the South
East Asia and South Asia regions and will complement the growth initiatives of existing businesses.
16
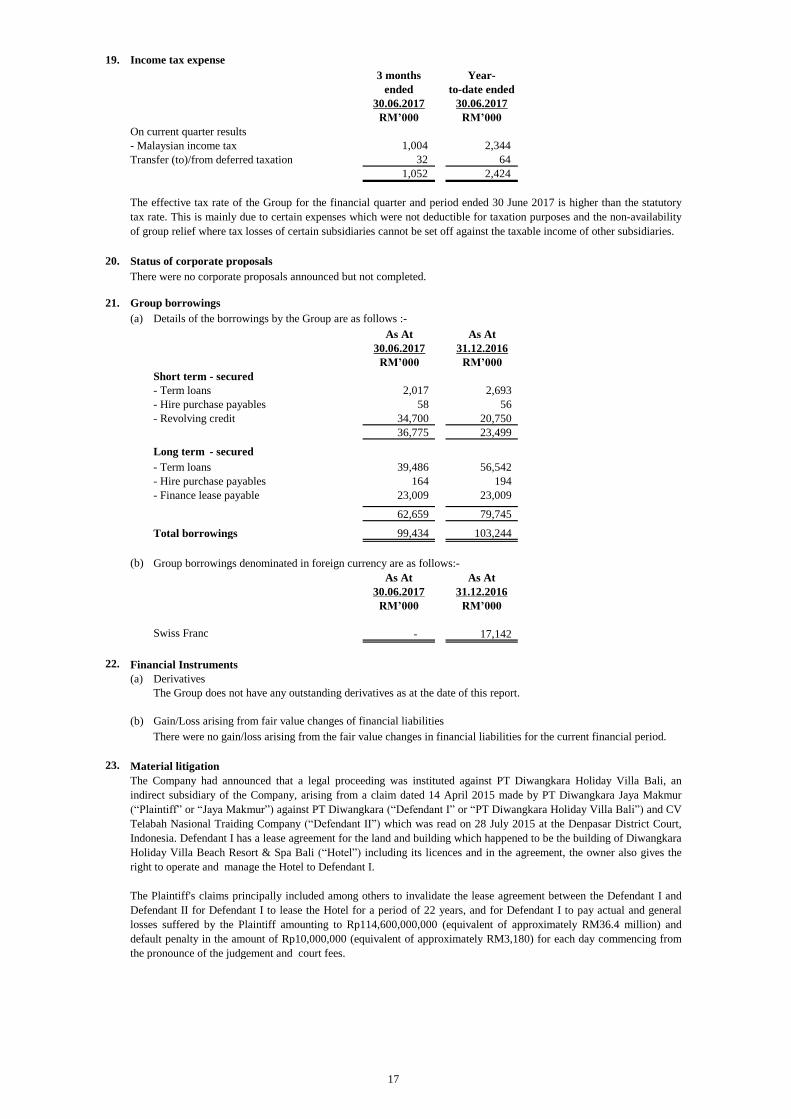
19. Income tax expense
3 months Year-
ended to-date ended
30.06.2017 30.06.2017
RM’000 RM’000
On current quarter results
- Malaysian income tax 1,004 2,344
Transfer (to)/from deferred taxation 32 64
1,052 2,424
20. Status of corporate proposals
21. Group borrowings
(a)
As At As At
30.06.2017 31.12.2016
RM’000 RM’000
Short term - secured
- Term loans 2,017 2,693
- Hire purchase payables 58 56
- Revolving credit 34,700 20,750
36,775 23,499
Long term - secured
- Term loans 39,486 56,542
- Hire purchase payables 164 194
- Finance lease payable 23,009 23,009
62,659 79,745
Total borrowings 99,434 103,244
(b) Group borrowings denominated in foreign currency are as follows:-
As At As At
30.06.2017 31.12.2016
RM’000 RM’000
Swiss Franc - 17,142
22. Financial Instruments
(a) Derivatives
The Group does not have any outstanding derivatives as at the date of this report.
(b) Gain/Loss arising from fair value changes of financial liabilities
23. Material litigation
There were no corporate proposals announced but not completed.
The Company had announced that a legal proceeding was instituted against PT Diwangkara Holiday Villa Bali, an
indirect subsidiary of the Company, arising from a claim dated 14 April 2015 made by PT Diwangkara Jaya Makmur
(“Plaintiff” or “Jaya Makmur”) against PT Diwangkara (“Defendant I” or “PT Diwangkara Holiday Villa Bali”) and CV
Telabah Nasional Traiding Company (“Defendant II”) which was read on 28 July 2015 at the Denpasar District Court,
Indonesia. Defendant I has a lease agreement for the land and building which happened to be the building of Diwangkara
Holiday Villa Beach Resort & Spa Bali (“Hotel”) including its licences and in the agreement, the owner also gives the
right to operate and manage the Hotel to Defendant I.
The Plaintiff's claims principally included among others to invalidate the lease agreement between the Defendant I and
Defendant II for Defendant I to lease the Hotel for a period of 22 years, and for Defendant I to pay actual and general
losses suffered by the Plaintiff amounting to Rp114,600,000,000 (equivalent of approximately RM36.4 million) and
default penalty in the amount of Rp10,000,000 (equivalent of approximately RM3,180) for each day commencing from
the pronounce of the judgement and court fees.
Details of the borrowings by the Group are as follows :-
There were no gain/loss arising from the fair value changes in financial liabilities for the current financial period.
The effective tax rate of the Group for the financial quarter and period ended 30 June 2017 is higher than the statutory
tax rate. This is mainly due to certain expenses which were not deductible for taxation purposes and the non-availability
of group relief where tax losses of certain subsidiaries cannot be set off against the taxable income of other subsidiaries.
17
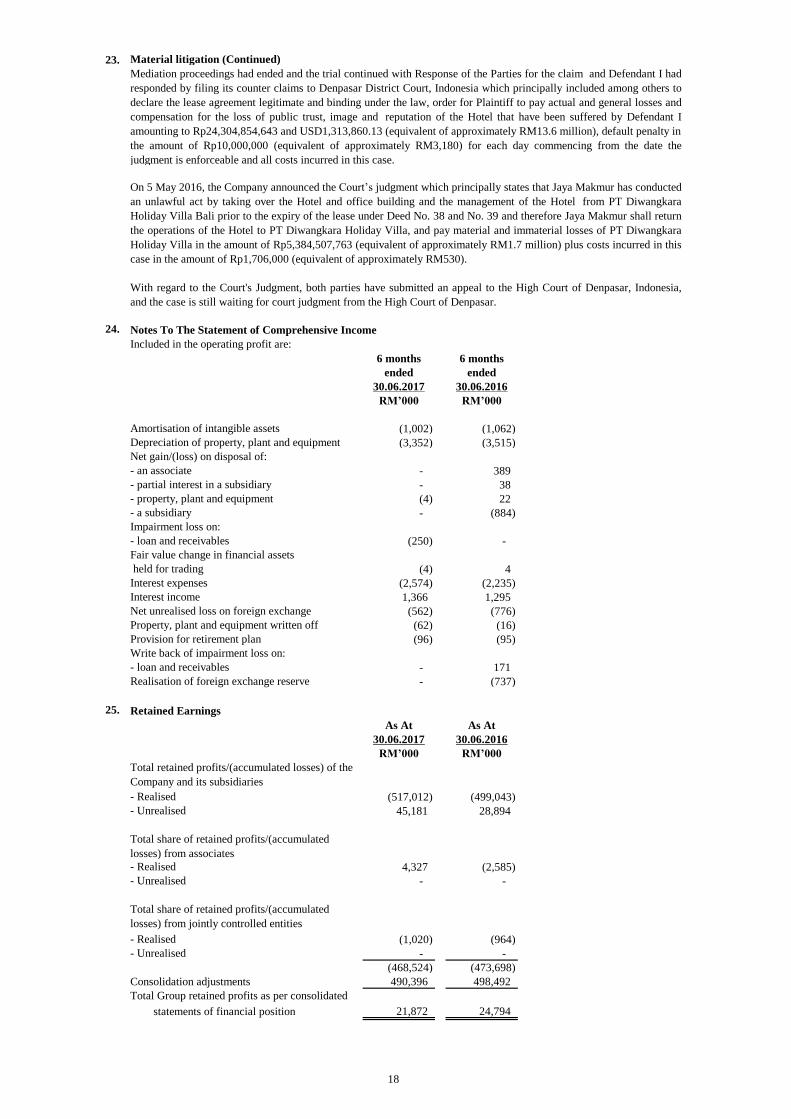
23. Material litigation (Continued)
24. Notes To The Statement of Comprehensive Income
Included in the operating profit are:
6 months 6 months
ended ended
30.06.2017 30.06.2016
RM’000 RM’000
Amortisation of intangible assets (1,002) (1,062)
Depreciation of property, plant and equipment (3,352) (3,515)
Net gain/(loss) on disposal of:
- an associate - 389
- partial interest in a subsidiary - 38
- property, plant and equipment (4) 22
- a subsidiary - (884)
Impairment loss on:
- loan and receivables (250) -
Fair value change in financial assets
held for trading (4) 4
Interest expenses (2,574) (2,235)
Interest income 1,366 1,295
Net unrealised loss on foreign exchange (562) (776)
Property, plant and equipment written off (62) (16)
Provision for retirement plan (96) (95)
Write back of impairment loss on:
- loan and receivables - 171
Realisation of foreign exchange reserve - (737)
25. Retained Earnings
As At As At
30.06.2017 30.06.2016
RM’000 RM’000
- Realised (517,012) (499,043)
- Unrealised 45,181 28,894
- Realised 4,327 (2,585)
- Unrealised - -
- Realised (1,020) (964)
- Unrealised - -
(468,524) (473,698)
490,396 498,492
21,872 24,794
On 5 May 2016, the Company announced the Court’s judgment which principally states that Jaya Makmur has conducted
an unlawful act by taking over the Hotel and office building and the management of the Hotel from PT Diwangkara
Holiday Villa Bali prior to the expiry of the lease under Deed No. 38 and No. 39 and therefore Jaya Makmur shall return
the operations of the Hotel to PT Diwangkara Holiday Villa, and pay material and immaterial losses of PT Diwangkara
Holiday Villa in the amount of Rp5,384,507,763 (equivalent of approximately RM1.7 million) plus costs incurred in this
case in the amount of Rp1,706,000 (equivalent of approximately RM530).
With regard to the Court's Judgment, both parties have submitted an appeal to the High Court of Denpasar, Indonesia,
and the case is still waiting for court judgment from the High Court of Denpasar.
Mediation proceedings had ended and the trial continued with Response of the Parties for the claim and Defendant I had
responded by filing its counter claims to Denpasar District Court, Indonesia which principally included among others to
declare the lease agreement legitimate and binding under the law, order for Plaintiff to pay actual and general losses and
compensation for the loss of public trust, image and reputation of the Hotel that have been suffered by Defendant I
amounting to Rp24,304,854,643 and USD1,313,860.13 (equivalent of approximately RM13.6 million), default penalty in
the amount of Rp10,000,000 (equivalent of approximately RM3,180) for each day commencing from the date the
judgment is enforceable and all costs incurred in this case.
Total share of retained profits/(accumulated
losses) from jointly controlled entities
Consolidation adjustments
Total Group retained profits as per consolidated
statements of financial position
Total share of retained profits/(accumulated
losses) from associates
Total retained profits/(accumulated losses) of the
Company and its subsidiaries
18

26. Dividend
27. Loss per share
Basic loss per share
30.06.2017 30.06.2016 30.06.2017 30.06.2016
Issued ordinary shares at beginning of the
period 664,052,332 664,052,332 664,052,332 664,052,332
Weighted average number of new ordinary shares
arising from ICULS converted todate 7,011,732 - 3,525,236 -
Weighted average number of ordinary shares 671,064,064 664,052,332 667,577,568 664,052,332
30.06.2017 30.06.2016 30.06.2017 30.06.2016
Basic loss per share (sen) (0.51) (0.14) (0.85) (0.69)
Diluted loss per share
30.06.2017 30.06.2016 30.06.2017 30.06.2016
Net loss attributable to equity holders (3,397) (948) (5,682) (4,599)
Profit impact of assumed conversion-
interest on ICULS 73 83 95 119
(3,324) (865) (5,587) (4,480)
Weighted average number of ordinary shares (diluted)
30.06.2017 30.06.2016 30.06.2017 30.06.2016
Issued ordinary shares at beginning of the
period 664,052,332 664,052,332 664,052,332 664,052,332
Weighted average number of new ordinary shares
arising from ICULS converted todate 7,011,732 - 3,525,236 -
Weighted average number of new ordinary shares
assuming conversion of the remaining ICULS 258,130,889 265,142,621 261,617,385 265,142,621
Weighted average number of ordinary shares 929,194,953 929,194,953 929,194,953 929,194,953
30.06.2017 30.06.2016 30.06.2017 30.06.2016
Diluted loss per share (sen) (0.51) (0.14) (0.85) (0.69)
No. of shares
ended to-date ended
to-date ended
ended to-date ended
No. of shares
3 months Year-
3 months
A single tier dividend in respect of the financial year ended 31 December 2016 was paid on 18 August 2017 as approved
by the shareholders of the Company at the Annual General Meeting held on 24 May 2017.
No. of shares No. of shares
3 months Year-
RM’000
Year-
ended to-date ended
ended to-date ended
The diluted loss per share for the current quarter and current year-to-date are computed based on the Group’s net loss
attributable to equity holders of the Company of RM3,324,000 and RM5,587,000, after adjusting for interest saving on
ICULS, divided by the weighted average number of ordinary shares of 929,194,953 and 929,194,953 for the current
quarter and current year-to-date respectively assuming conversion of the remaining ICULS as follows:
3 months Year-
ended
The diluted loss per share and basic loss per share for the current quarter, current year-to-date, corresponding quarter last
year and corresponding year-to-date last year are reported to be the same as the effect arising from the deemed
conversion of ICULS is anti-dilutive.
3 months
RM’000
The basic loss per share for the current quarter and current year-to-date are computed based on the Group’s net loss
attributable to equity holders of the Company of RM3,397,000 and RM5,682,000 respectively, divided by the weighted
average number of ordinary shares of 671,064,064 and 667,577,568 for the current quarter and current year-to-date
respectively as follows:
Year-
19

28. Status of E-commerce activities
Not applicable.
BY ORDER OF THE BOARD
ADVANCE SYNERGY BERHAD
HO TSAE FENG
Company Secretary
28 August 2017
20
Top Related