


Languages
Pages
Legal


on the Pension Plans for the
CANADIANFORCESRegular Force and Reserve Forceas at 31 March 2016
ACTUARIAL REPORT
CF-cover-print.qxd:Layout 1 1/13/11 10:46 AM Page 1

To obtain a copy of this report, please contact:
Office of the Chief ActuaryOffice of the Superintendent of Financial Institutions Canada12th Floor, Kent Square Building255 Albert StreetOttawa, OntarioK1A 0H2Facsimile: 613-990-9900E-mail: [email protected]
An electronic version of this report is availableon our Web site, at www.osfi-bsif.gc.ca
© Her Majesty the Queen in Right of Canada, 2017
Cat. No. IN3-16/8E - PDFISSN 1701-820X
CF-cover-print.qxd:Layout 1 1/13/11 10:46 AM Page 2

ACTUARIAL REPORT
Pension Plans for the CANADIAN FORCES as at 31 March 2016
21 September 2017
The Honourable Scott Brison, P.C., M.P.
President of Treasury Board
Ottawa, Canada
K1A 0R5
Dear Minister:
Pursuant to section 6 of the Public Pensions Reporting Act, I am pleased to submit the report on
the actuarial review as at 31 March 2016 of the Canadian Forces Pension Plans. This is the first
report that shows the combined results of both the Regular Force Pension Plan and the Reserve
Force Pension Plan. The Regular Force Pension Plan is established by Parts I, III and IV of the
Canadian Forces Superannuation Act, includes the Canadian Forces-related benefits provided
under the Special Retirement Arrangements Act, and is subject to the Pension Benefits Division
Act. The Reserve Force Pension Plan is established by Part I.1 of the Canadian Forces
Superannuation Act and subject to the Pension Benefits Division Act.
Yours sincerely,
Jean-Claude Ménard, F.S.A., F.C.I.A.
Chief Actuary

4
ACTUARIAL REPORT
Pension Plans for the CANADIAN FORCES as at 31 March 2016
TABLE OF CONTENTS
Page
I. Executive Summary ...............................................................................................................................9
A. Purpose of the Report .......................................................................................................................9
B. Valuation Basis.................................................................................................................................9
C. Main Findings.................................................................................................................................10
II. Valuation Results .................................................................................................................................14
A. Financial Position ...........................................................................................................................14
B. CFSA - Reconciliation of the Changes in Financial Position ........................................................16
C. CFSA - Cost Certificate .................................................................................................................25
D. Sensitivity of Valuation Results to Variations in Longevity Improvement Factors ......................28
E. Sensitivity to Variations in Key Economic Assumptions ..............................................................29
F. RCA - Financial Position ...............................................................................................................31
G. RCA - Current Service Cost ...........................................................................................................31
H. Summary of Estimated Government Cost ......................................................................................32
III. Actuarial Opinion .................................................................................................................................33
APPENDICES
Appendix 1 - Summary of Pension Benefit Provisions ...............................................................................34
Appendix 2 - RCA Benefit Provisions under the Regular Force Plan .........................................................51
Appendix 3 - Assets, Accounts and Rates of Return ...................................................................................52
Appendix 4 - Membership Data ...................................................................................................................57
Appendix 5 - CFSA Valuation Methodology ..............................................................................................61
Appendix 6 - CFSA Economic Assumptions ..............................................................................................66
Appendix 7 - CFSA Demographic and Other Assumptions ........................................................................76
Appendix 8 - RCA Valuation Methodology and Assumptions ...................................................................90
Appendix 9 - Canadian Forces Superannuation Account Projection ...........................................................92
Appendix 10 - Canadian Forces Pension Fund Projection ..........................................................................93
Appendix 11 - Reserve Force Pension Fund Projection ..............................................................................94
Appendix 12 - Uncertainty of Results..........................................................................................................95
Appendix 13 - Detailed Information on Membership Data .......................................................................101
Appendix 14 - Acknowledgements ............................................................................................................117

5
ACTUARIAL REPORT
Pension Plans for the CANADIAN FORCES as at 31 March 2016
TABLES
Page
Table 1 Ultimate Best-Estimate Economic Assumptions........................................................................ 10
Table 2 Canadian Forces Pension Fund Current Service Cost on a Calendar Year Basis ...................... 11 Table 3 Reserve Force Pension Fund Current Service Cost on a Calendar Year Basis .......................... 12 Table 4 RCA Current Service Cost on a Calendar Year Basis ................................................................ 13 Table 5 State of the Canadian Forces Superannuation Account ............................................................. 14 Table 6 Balance Sheet - Canadian Forces Pension Fund ........................................................................ 15
Table 7 Balance Sheet - Reserve Force Pension Fund ............................................................................ 16 Table 8 Reconciliation of CFSA Financial Position ............................................................................... 17 Table 9 Experience Gains and Losses ..................................................................................................... 19 Table 10 Revision of Actuarial Assumptions ............................................................................................ 22 Table 11 Current Service Cost for Plan Year 2017 ................................................................................... 25
Table 12 Reconciliation of CFSA Current Service Cost ........................................................................... 26
Table 13 Projection of Current Service Cost on a Plan Year Basis - CFPF .............................................. 27 Table 14 Projection of Current Service Cost on a Plan Year Basis- RFPF ............................................... 27
Table 15 Administrative Expenses ............................................................................................................ 28 Table 16 Estimated Contributions for Prior Service ................................................................................ 28 Table 17 Sensitivity of Results to Variation in Longevity Improvement Factors ..................................... 29
Table 18 Sensitivity of Results to Variations in Key Economic Assumptions- Regular Force ................ 30 Table 19 Sensitivity of Results to Variations in Key Economic Assumptions - Reserve Force ............... 30
Table 20 State of the RCA Account .......................................................................................................... 31 Table 21 RCA - Current Service Cost ....................................................................................................... 31 Table 22 Summary of Estimated Government Cost .................................................................................. 32
Table 23 Reconciliation of Balances in Superannuation Account ............................................................ 53
Table 24 Reconciliation of Balances in Canadian Forces Pension Fund .................................................. 54 Table 25 Reconciliation of Balances in RCA Account ............................................................................. 55 Table 26 Reconciliation of Balances in Reserve Force Pension Fund ...................................................... 56
Table 27 Reconciliation of Regular Force Contributors ........................................................................... 58 Table 28 Reconciliation of Reserve Force Contributors ........................................................................... 59
Table 29 Reconciliation of Regular Force Pensioners .............................................................................. 59 Table 30 Reconciliation of Reserve Force Pensioners .............................................................................. 60
Table 31 Reconciliation of Spouse Survivors ........................................................................................... 60 Table 32 Reconciliation of Survivors - Children/Students ........................................................................ 60 Table 33 Actuarial Value of Canadian Forces Pension Fund Assets ........................................................ 62 Table 34 Actuarial Value of Reserve Force Pension Fund Assets ............................................................ 62 Table 35 Asset Mix.................................................................................................................................... 69
Table 36 Real Rate of Return by Asset Type ............................................................................................ 72
Table 37 Overall Rate of Return on Assets of the CFPF and RFPF ......................................................... 73
Table 38 Rates of Return on Assets in Respect of the CFPF and the RFPF ............................................. 73 Table 39 Transfer Value ............................................................................................................................ 74 Table 40 Economic Assumptions .............................................................................................................. 75 Table 41 Sample of Assumed Seniority and Promotional Salary Increases .............................................. 76 Table 42 Sample of Assumed Rates of Any Occupation Disability Retirement (3A) .............................. 77 Table 43 Sample of Assumed 3B Disability Incidence Rates (Own Occupation) - Regular Force Plan .. 78 Table 44 Sample of Assumed Rates of Retirement - Regular Force Plan - Old Terms of Service ........... 79

6
ACTUARIAL REPORT
Pension Plans for the CANADIAN FORCES as at 31 March 2016
Table 45 Sample of Assumed Rates of Retirement - Regular Force Plan - New Terms of Service ......... 79 Table 46 Sample of Assumed Rates of Retirement - Reserve Force members ......................................... 80 Table 47 Sample of Assumed Withdrawal Rates - Regular Force Plan - Old Terms of Service .............. 80 Table 48 Sample of Assumed Withdrawal Rates - Regular Force Plan - New Terms of Service ............ 81
Table 49 Sample of Assumed Withdrawal Rates for Reserve Force Members - Male Officer ................ 81 Table 50 Sample of Assumed Withdrawal Rates for Reserve Force Members - Male Other Rank ......... 82 Table 51 Sample of Assumed Withdrawal Rates for Reserve Force Members - Female Officer ............. 82 Table 52 Sample of Assumed Withdrawal Rates for Reserve Force Members - Female Other Rank ...... 82 Table 53 Sample of Assumed Proportions of Members Electing a Deferred Annuity ............................. 83
Table 54 Sample of Assumed Rates of Mortality...................................................................................... 84 Table 55 Sample of Assumed Longevity Improvement Factors ............................................................... 85 Table 56 Life Expectancy of Contributors and Healthy Pensioners ......................................................... 85 Table 57 Sensitivity of Life Expectancy to Variation in Longevity Improvement Factors ...................... 85
Table 58 Assumptions for Survivor Spouse Allowances .......................................................................... 86 Table 59 Assumptions for Survivor Children Allowances ........................................................................ 86
Table 60 Wage Measure - RFPF ............................................................................................................... 88 Table 61 Canadian Forces Superannuation Account Projection ............................................................... 92
Table 62 Canadian Forces Pension Fund Projection ................................................................................. 93 Table 63 Reserve Force Pension Fund Projection ..................................................................................... 94 Table 64 Impact of Various Investment Policies - CFPF .......................................................................... 96
Table 65 Median and 10% Downside Returns, Funding Ratio and Contributions for Various Portfolios -
CFPF ........................................................................................................................................... 98
Table 66 Tail Event Portfolio Returns - CFPF .......................................................................................... 99 Table 67 Sensitivity of the Projected CFPF Surplus/(Deficit) as at 31 March 2019................................. 99 Table 68 Impact on the Superannuation Account / CFPF of Prolonged Low Bond Yields .................... 100
Table 69 Regular Force Male Officers .................................................................................................... 101
Table 70 Regular Force Male Other Ranks ............................................................................................. 102 Table 71 Regular Force Female Officers ................................................................................................ 103 Table 72 Regular Force Female Other Ranks ......................................................................................... 104
Table 73 Reserve Force - Male Officers ................................................................................................ 105 Table 74 Reserve Force - Male Other Ranks .......................................................................................... 106
Table 75 Reserve Force - Female Officers .............................................................................................. 107 Table 76 Reserve Force - Female Other Ranks ....................................................................................... 108
Table 77 Regular Force - Officer Male - Retirement Pensioners ............................................................ 109 Table 78 Regular Force - Officer Female - Retirement Pensioners ........................................................ 109 Table 79 Regular Force - Other Rank Male - Retirement Pensioners ..................................................... 110 Table 80 Regular Force - Other Rank Female - Retirement Pensioners ................................................. 110 Table 81 Regular Force - Officer Male - 3B Pensioners ......................................................................... 111
Table 82 Regular Force - Officer Female - 3B Pensioners ..................................................................... 111 Table 83 Regular Force - Other Rank Male - 3B Pensioners .................................................................. 112
Table 84 Regular Force - Other Rank Female - 3B Pensioners .............................................................. 112 Table 85 Reserve Force Officer Male - Retirement Pensioners .............................................................. 113 Table 86 Reserve Force Officer Female - Retirement Pensioners .......................................................... 113 Table 87 Reserve Force Other Rank Male - Retirement Pensioners ....................................................... 114 Table 88 Reserve Force Other Rank Female - Retirement Pensioners ................................................... 114 Table 89 Reserve Force Officer - Disability Pensioners ......................................................................... 115

7
ACTUARIAL REPORT
Pension Plans for the CANADIAN FORCES as at 31 March 2016
Table 90 Reserve Force Other Rank - Disability Pensioners .................................................................. 115 Table 91 Regular Force Surviving Spouses ............................................................................................ 116 Table 92 Reserve Force Surviving Spouses ............................................................................................ 116


9
ACTUARIAL REPORT
Pension Plans for the CANADIAN FORCES as at 31 March 2016
I. Executive Summary
This actuarial report on the pension plans for the Canadian Forces – Regular Force Pension
Plan (Regular Force Plan) and the Reserve Force Pension Plan (Reserve Force Plan) was
made pursuant to the Public Pensions Reporting Act (PPRA).
This actuarial valuation is as at 31 March 2016 and is in respect of the pension benefits and
contributions defined by Parts I, III and IV of the Canadian Forces Superannuation Act
(CFSA), the Special Retirement Arrangements Act (SRAA), which covers the Retirement
Compensation Arrangements (RCA), and the Pension Benefits Division Act (PBDA) for
members of the Regular Force Plan. This valuation is also in respect of the pension benefits
and contributions defined by Part I.1 of the CFSA and the PBDA for members of the
Reserve Force Plan.
The previous actuarial reports for the Regular Force Plan and the Reserve Force Plan were
made as at 31 March 2013 and as at 31 March 2015 respectively. However, this report will
reconcile the results to the previous 31 March 2013 Reserve Force Plan actuarial report for
consistency between the Regular and Reserve Force Plans. The date of the next periodic
review is scheduled to occur no later than 31 March 2019.
A. Purpose of the Report
The purposes of this actuarial valuation are to determine the state of the Regular Force
Plan composed of the Canadian Forces Superannuation Account (Superannuation
Account), the Canadian Forces Pension Fund (CFPF) and the Retirement Compensation
Arrangements (RCA) Account, to determine the state of the Reserve Force Plan
composed of the Reserve Force Pension Fund (RFPF) as well as to assist the President
of the Treasury Board in making informed decisions regarding the financing of the
government’s pension benefit obligation.
B. Valuation Basis
Contribution rates for Regular Force members for calendar years 2016 and 2017 (as
approved by the Treasury Board) and for calendar year 2018 and beyond (estimated)
have been updated since the last valuation and are assumed to be equal to the
contribution rates of Group 1 contributors under the pension plan for the Public Service
of Canada (PS pension plan).
Contribution rates for Reserve Force members are set by regulation. There have been no
other changes to the plan provisions of either report since the previous valuation. This
report is based on pension benefit provisions enacted by legislation, summarized in
Appendices 1 and 2.
For the Regular Force Plan, the financial data on which this valuation is based are
composed of CFPF tangible assets that the government has earmarked for the payment
of benefits for service since 1 April 2000; the Superannuation Account established to
track the government’s pension benefit obligations for service prior to 1 April 2000; and
the RCA Account for benefits in excess of those that can be provided under the Income
Tax Act limits for registered pension plans. For the Reserve Force Plan, the financial
data on which this valuation is based are composed of RFPF tangible assets that the
government has earmarked for the payment of benefits for Reserve Force service.

10
ACTUARIAL REPORT
Pension Plans for the CANADIAN FORCES as at 31 March 2016
These pension assets and accounts balances are summarized in Appendix 3. The
membership data provided by the Department of National Defence (DND) and the
Department of Public Services and Procurement Canada (PSPC) are summarized in
Appendix 4.
The valuation was prepared using accepted actuarial practices, methods and
assumptions, which are summarized in Appendices 5 to 8.
All actuarial assumptions used in this report are best-estimate assumptions. They are,
individually and in aggregate, reasonable for the purposes of the valuation at the date of
this report.
Actuarial assumptions used in the previous report were revised based on economic
trends and demographic experience. A complete description of the assumptions is given
in Appendices 6 and 7. Table 1 represents a summary of the ultimate economic
assumptions used in this report and a comparison with those used in the previous report.
Table 1 Ultimate Best-Estimate Economic Assumptions
31 March 2016 31 March 2013
Assumed level of inflation 2.00% 2.00%
Real increase in pensionable earnings 0.80% 1.00%
Real rate of return on the Pension Fund 4.00% 4.10%
Real rate of return on the Superannuation Account 2.70% 2.80%
Real rate of return on the RCA Account 2.70% 1.40%
C. Main Findings
The proposed amounts to be credited to (or debited from) the Superannuation Account,
the CFPF, the RFPF and the RCA Account are shown on calendar year basis in this
section, beginning with calendar year 2018, which is the first calendar year that follows
the expected tabling of this report. Valuation results on a plan year1 basis are shown in
Section II.
1) Superannuation Account (Service prior to 1 April 2000)
As at 31 March 2016, the recorded balance of the Superannuation Account is
$45,718 million and the actuarial liability for service prior to 1 April 20002 is
$47,385 million. The resulting shortfall is $1,667 million.
In accordance with the CFSA, the actuarial shortfall could be amortized over a
maximum period of 15 years beginning on 31 March 2018. If the shortfall is
amortized over the maximum period, 15 equal annual credits of $148 million could
be made to the Superannuation Account. The time, manner and amount of such
credits are to be determined by the President of the Treasury Board.
1 Any reference to a given plan year in this report refers to the 12-month period ending 31 March of the given year. 2 The actuarial liability for service prior to 1 April 2000 refers to the actuarial liability for service accrued prior to that date
except for service elections since 1 April 2000 that are deemed to be service accrued since that date.
11
ACTUARIAL REPORT
Pension Plans for the CANADIAN FORCES as at 31 March 2016
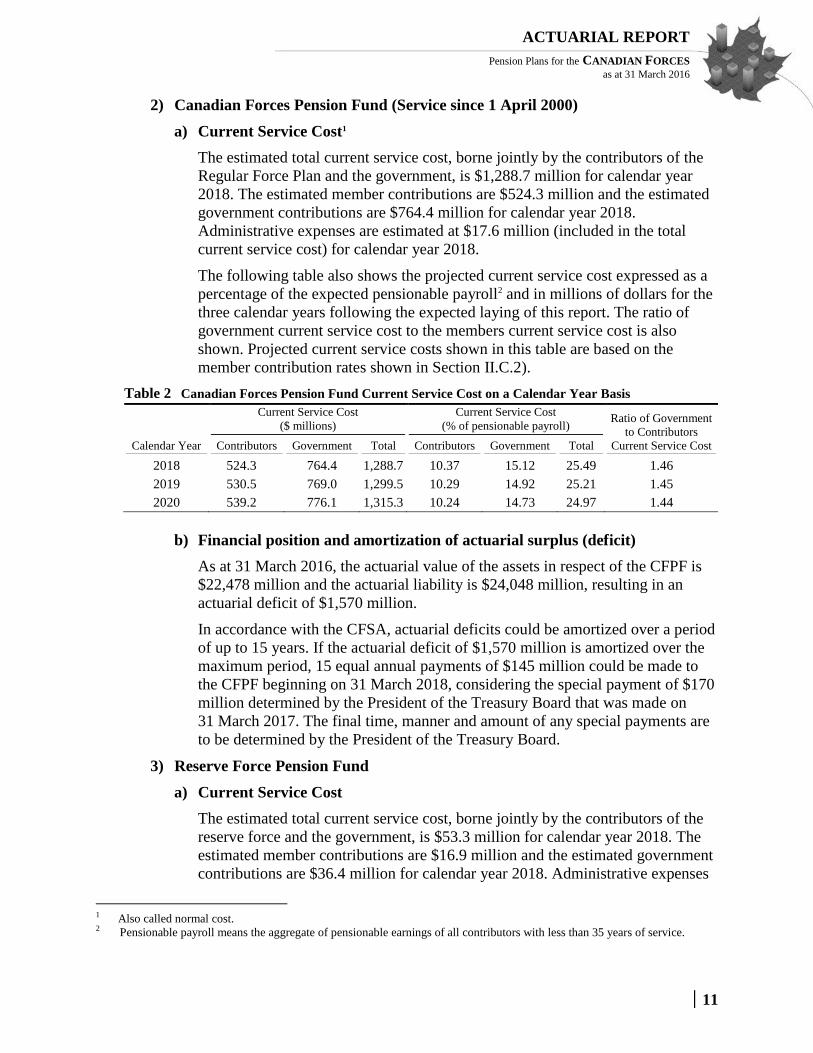
2) Canadian Forces Pension Fund (Service since 1 April 2000)
a) Current Service Cost1
The estimated total current service cost, borne jointly by the contributors of the
Regular Force Plan and the government, is $1,288.7 million for calendar year
2018. The estimated member contributions are $524.3 million and the estimated
government contributions are $764.4 million for calendar year 2018.
Administrative expenses are estimated at $17.6 million (included in the total
current service cost) for calendar year 2018.
The following table also shows the projected current service cost expressed as a
percentage of the expected pensionable payroll2 and in millions of dollars for the
three calendar years following the expected laying of this report. The ratio of
government current service cost to the members current service cost is also
shown. Projected current service costs shown in this table are based on the
member contribution rates shown in Section II.C.2).
Table 2 Canadian Forces Pension Fund Current Service Cost on a Calendar Year Basis
Current Service Cost
($ millions) Current Service Cost
(% of pensionable payroll) Ratio of Government
to Contributors
Current Service Cost Calendar Year Contributors Government Total Contributors Government Total
2018 524.3 764.4 1,288.7 10.37 15.12 25.49 1.46
2019 530.5 769.0 1,299.5 10.29 14.92 25.21 1.45
2020 539.2 776.1 1,315.3 10.24 14.73 24.97 1.44
b) Financial position and amortization of actuarial surplus (deficit)
As at 31 March 2016, the actuarial value of the assets in respect of the CFPF is
$22,478 million and the actuarial liability is $24,048 million, resulting in an
actuarial deficit of $1,570 million.
In accordance with the CFSA, actuarial deficits could be amortized over a period
of up to 15 years. If the actuarial deficit of $1,570 million is amortized over the
maximum period, 15 equal annual payments of $145 million could be made to
the CFPF beginning on 31 March 2018, considering the special payment of $170
million determined by the President of the Treasury Board that was made on
31 March 2017. The final time, manner and amount of any special payments are
to be determined by the President of the Treasury Board.
3) Reserve Force Pension Fund
a) Current Service Cost
The estimated total current service cost, borne jointly by the contributors of the
reserve force and the government, is $53.3 million for calendar year 2018. The
estimated member contributions are $16.9 million and the estimated government
contributions are $36.4 million for calendar year 2018. Administrative expenses
1 Also called normal cost. 2 Pensionable payroll means the aggregate of pensionable earnings of all contributors with less than 35 years of service.
12
ACTUARIAL REPORT
Pension Plans for the CANADIAN FORCES as at 31 March 2016
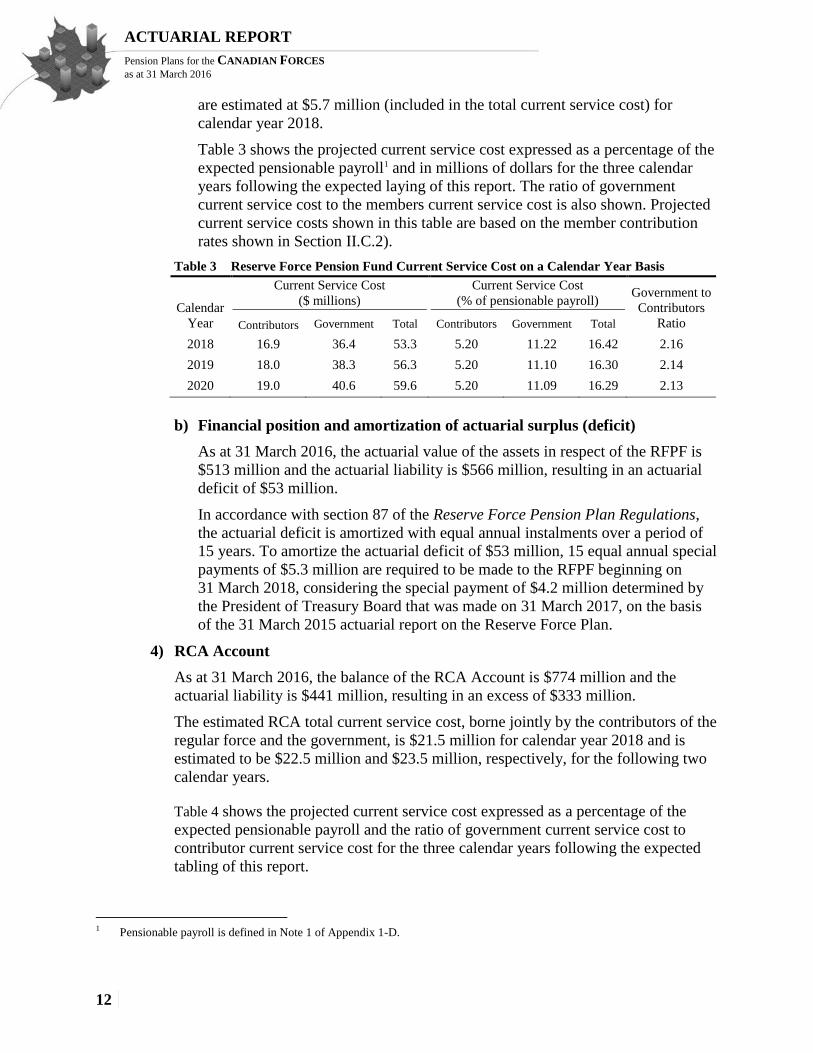
are estimated at $5.7 million (included in the total current service cost) for
calendar year 2018.
Table 3 shows the projected current service cost expressed as a percentage of the
expected pensionable payroll1 and in millions of dollars for the three calendar
years following the expected laying of this report. The ratio of government
current service cost to the members current service cost is also shown. Projected
current service costs shown in this table are based on the member contribution
rates shown in Section II.C.2).
Table 3 Reserve Force Pension Fund Current Service Cost on a Calendar Year Basis
Calendar
Year
Current Service Cost
($ millions)
Current Service Cost
(% of pensionable payroll) Government to
Contributors
Ratio Contributors Government Total Contributors Government Total
2018 16.9 36.4 53.3 5.20 11.22 16.42 2.16
2019 18.0 38.3 56.3 5.20 11.10 16.30 2.14
2020 19.0 40.6 59.6 5.20 11.09 16.29 2.13
b) Financial position and amortization of actuarial surplus (deficit)
As at 31 March 2016, the actuarial value of the assets in respect of the RFPF is
$513 million and the actuarial liability is $566 million, resulting in an actuarial
deficit of $53 million.
In accordance with section 87 of the Reserve Force Pension Plan Regulations,
the actuarial deficit is amortized with equal annual instalments over a period of
15 years. To amortize the actuarial deficit of $53 million, 15 equal annual special
payments of $5.3 million are required to be made to the RFPF beginning on
31 March 2018, considering the special payment of $4.2 million determined by
the President of Treasury Board that was made on 31 March 2017, on the basis
of the 31 March 2015 actuarial report on the Reserve Force Plan.
4) RCA Account
As at 31 March 2016, the balance of the RCA Account is $774 million and the
actuarial liability is $441 million, resulting in an excess of $333 million.
The estimated RCA total current service cost, borne jointly by the contributors of the
regular force and the government, is $21.5 million for calendar year 2018 and is
estimated to be $22.5 million and $23.5 million, respectively, for the following two
calendar years.
Table 4 shows the projected current service cost expressed as a percentage of the
expected pensionable payroll and the ratio of government current service cost to
contributor current service cost for the three calendar years following the expected
tabling of this report.
1 Pensionable payroll is defined in Note 1 of Appendix 1-D.

13
ACTUARIAL REPORT
Pension Plans for the CANADIAN FORCES as at 31 March 2016
Table 4 RCA Current Service Cost on a Calendar Year Basis
Current Service Cost
($ millions) Current Service Cost
(% of pensionable payroll) Ratio of Government
to Contributors
Current Service Cost Calendar Year Contributors Government Total Contributors Government Total
2018 3.47 18.04 21.51 0.07 0.36 0.43 5.20
2019 3.64 18.84 22.48 0.07 0.37 0.44 5.18
2020 3.86 19.66 23.52 0.07 0.38 0.45 5.09

14
ACTUARIAL REPORT
Pension Plans for the CANADIAN FORCES as at 31 March 2016
II. Valuation Results
This report is based on pension benefit provisions enacted by legislation, summarized in
Appendices 1 and 2, and the financial and membership data summarized in Appendices 3
and 4. The valuation was prepared using accepted actuarial practices, methods and
assumptions summarized in Appendices 5 to 8. Emerging experience that differs from the
corresponding assumptions will result in gains or losses to be revealed in subsequent
reports.
Projections of the financial positions of the Superannuation Account, CFPF and the RFPF
are shown in Appendices 9, 10 and 11, respectively.
A. Financial Position
1) Canadian Forces Superannuation Account
Prior to 1 April 2000, contributions by members of the regular force and the
government to the Regular Force Plan were credited to the Superannuation Account.
The valuation results of this section show the financial position of the
Superannuation Account as at 31 March 2016. The results of the previous valuation
are also shown for comparison purposes.
Table 5 State of the Canadian Forces Superannuation Account
($ millions)
31 March 2016 31 March 2013
Recorded Account balance 45,695 46,357
Present value of prior service contributions 23 33
Total 45,718 46,390
Actuarial Liability
Active contributors 6,045 7,534
Retirement pensioners 37,804 34,362
Disability pensioners 154 197
Surviving dependents 3,138 2,917
Administrative expenses 232 149
Pension Modernization cost 12 74
Total Actuarial Liability 47,385 45,233
Actuarial Excess/(Shortfall) (1,667) 1,157
In accordance with the CFSA, the actuarial shortfall of $1,667 million could be
amortized over a maximum period of 15 years beginning on 31 March 2018. If the
shortfall is amortized over the maximum period, 15 equal annual credits of $148
million could be made to the Superannuation Account. The time, manner and
amount of such credits are to be determined by the President of the Treasury Board.
It is expected that the government will amortize the actuarial shortfall through a one-
time special credit to the Superannuation Account of $1,813 million as at
31 March 2018 to take into account the interest on the shortfall accumulated from
31 March 2016 to 31 March 2018.
15
ACTUARIAL REPORT
Pension Plans for the CANADIAN FORCES as at 31 March 2016
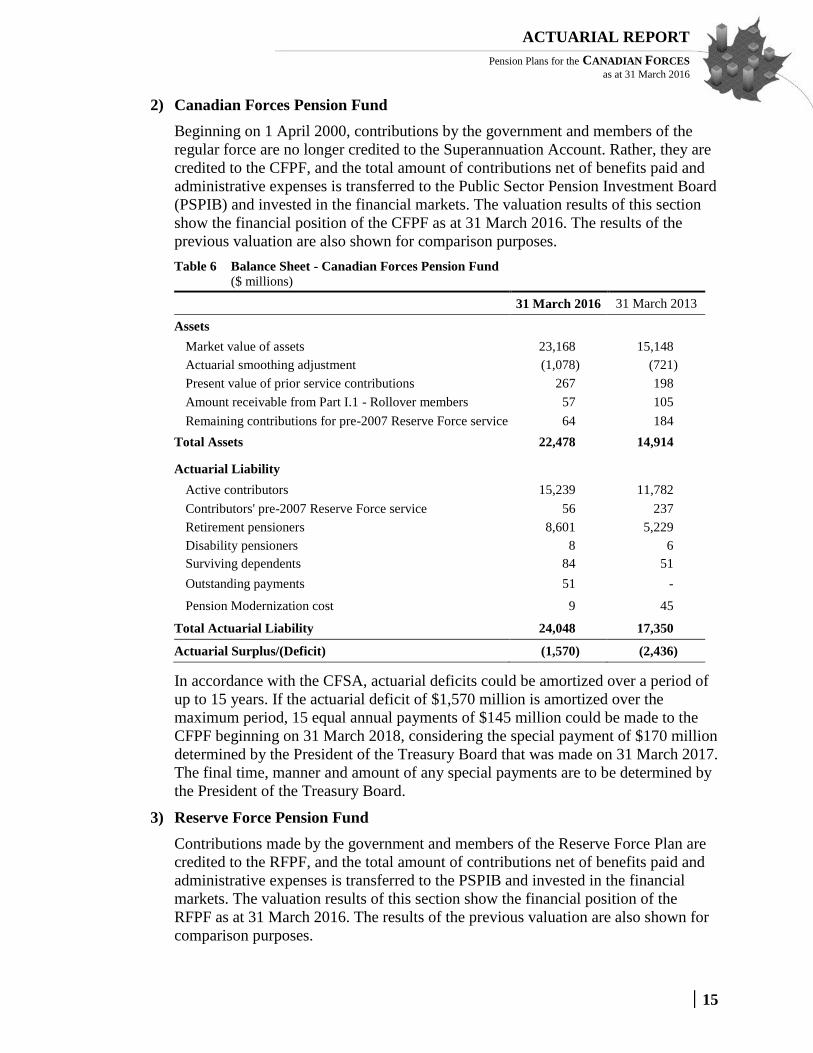
2) Canadian Forces Pension Fund
Beginning on 1 April 2000, contributions by the government and members of the
regular force are no longer credited to the Superannuation Account. Rather, they are
credited to the CFPF, and the total amount of contributions net of benefits paid and
administrative expenses is transferred to the Public Sector Pension Investment Board
(PSPIB) and invested in the financial markets. The valuation results of this section
show the financial position of the CFPF as at 31 March 2016. The results of the
previous valuation are also shown for comparison purposes.
Table 6 Balance Sheet - Canadian Forces Pension Fund
($ millions)
31 March 2016 31 March 2013
Assets
Market value of assets 23,168 15,148
Actuarial smoothing adjustment (1,078) (721)
Present value of prior service contributions 267 198
Amount receivable from Part I.1 - Rollover members 57 105
Remaining contributions for pre-2007 Reserve Force service 64 184
Total Assets 22,478 14,914
Actuarial Liability
Active contributors 15,239 11,782
Contributors' pre-2007 Reserve Force service 56 237
Retirement pensioners 8,601 5,229
Disability pensioners 8 6
Surviving dependents 84 51
Outstanding payments 51 -
Pension Modernization cost 9 45
Total Actuarial Liability 24,048 17,350
Actuarial Surplus/(Deficit) (1,570) (2,436)
In accordance with the CFSA, actuarial deficits could be amortized over a period of
up to 15 years. If the actuarial deficit of $1,570 million is amortized over the
maximum period, 15 equal annual payments of $145 million could be made to the
CFPF beginning on 31 March 2018, considering the special payment of $170 million
determined by the President of the Treasury Board that was made on 31 March 2017.
The final time, manner and amount of any special payments are to be determined by
the President of the Treasury Board.
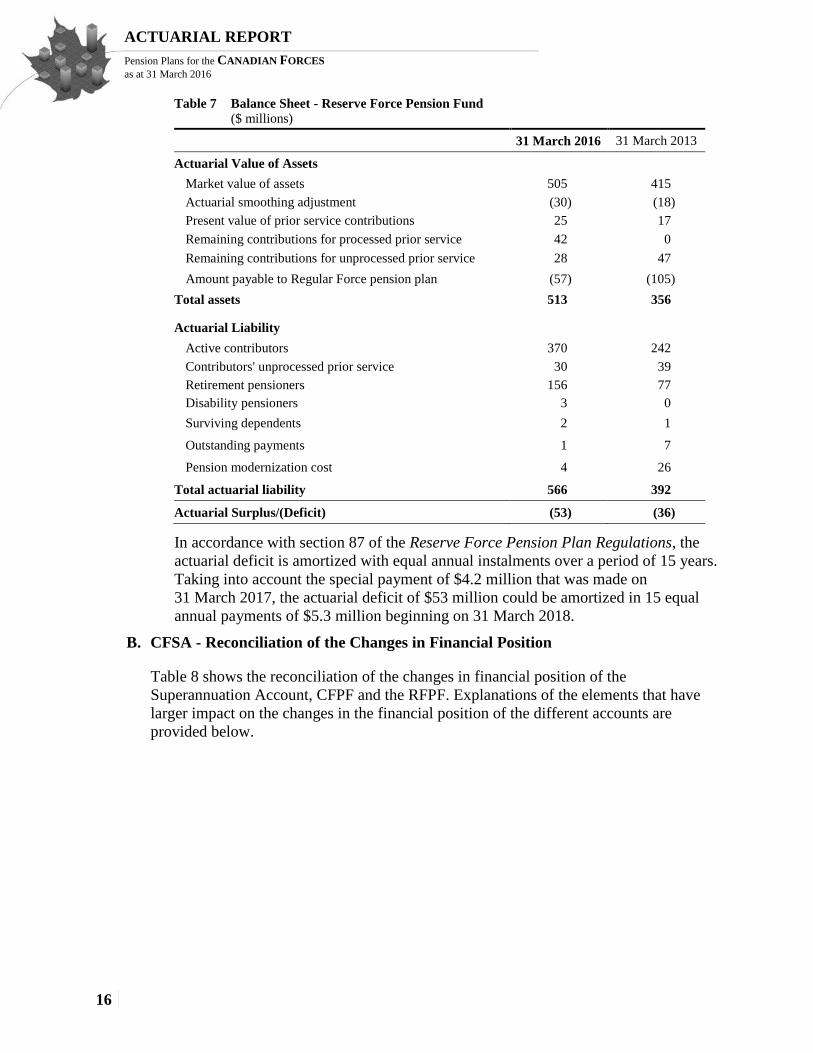
3) Reserve Force Pension Fund
Contributions made by the government and members of the Reserve Force Plan are
credited to the RFPF, and the total amount of contributions net of benefits paid and
administrative expenses is transferred to the PSPIB and invested in the financial
markets. The valuation results of this section show the financial position of the
RFPF as at 31 March 2016. The results of the previous valuation are also shown for
comparison purposes.
16
ACTUARIAL REPORT
Pension Plans for the CANADIAN FORCES as at 31 March 2016
Table 7 Balance Sheet - Reserve Force Pension Fund
($ millions)
31 March 2016 31 March 2013
Actuarial Value of Assets
Market value of assets 505 415
Actuarial smoothing adjustment (30) (18)
Present value of prior service contributions 25 17
Remaining contributions for processed prior service 42 0
Remaining contributions for unprocessed prior service 28 47
Amount payable to Regular Force pension plan (57) (105)
Total assets 513 356
Actuarial Liability
Active contributors 370 242
Contributors' unprocessed prior service 30 39
Retirement pensioners 156 77
Disability pensioners 3 0
Surviving dependents 2 1
Outstanding payments 1 7
Pension modernization cost 4 26
Total actuarial liability 566 392
Actuarial Surplus/(Deficit) (53) (36)
In accordance with section 87 of the Reserve Force Pension Plan Regulations, the
actuarial deficit is amortized with equal annual instalments over a period of 15 years.
Taking into account the special payment of $4.2 million that was made on
31 March 2017, the actuarial deficit of $53 million could be amortized in 15 equal
annual payments of $5.3 million beginning on 31 March 2018.
B. CFSA - Reconciliation of the Changes in Financial Position
Table 8 shows the reconciliation of the changes in financial position of the
Superannuation Account, CFPF and the RFPF. Explanations of the elements that have
larger impact on the changes in the financial position of the different accounts are
provided below.

17
ACTUARIAL REPORT
Pension Plans for the CANADIAN FORCES as at 31 March 2016
Table 8 Reconciliation of CFSA Financial Position
($ millions)
Superannuation
Account
Actuarial
Excess/
(Shortfall)
CFPF
Actuarial
Surplus/
(Deficit)
RFPF
Actuarial
Surplus/
(Deficit)
As at 31 March 2013 1,157 (2,436) (36)
Recognized investment gains as at 31 March 2013 - 721 18
Retroactive changes to the population data 104 (245) (104)
Methodology changes 3 49 19
Expected interest on revised initial financial position 203 (289) (16)
Special credits/payments - 624 4
Net experience gains and losses 95 2,849 32
Revision of actuarial assumptions (3,120) (1,794) (37)
Valuation methodology change - Reservists under Part I 4 38 -
Change in the present value of prior service contributions 1 86 5
Change in the present value of administrative expenses (108) - -
Recognition of remaining contributions for processed prior service - - 42
Recognition of unprocessed prior service - 8 (2)
Change in the amount transferred between Plans - Rollover members (48) 48
Change in outstanding payments - (51) 6
Change in capitalized value of pension modernization cost (6) (4) (2)
Unrecognized investment gains as at 31 March 2016 - (1,078) (30)
As at 31 March 2016 (1,667) (1,570) (53)
1) Recognized Investment Gains as at 31 March 2013
An actuarial asset valuation method that minimizes the impact of short-term
fluctuations in the market value of assets was used in the previous valuation report
(see Appendix 6). This caused the actuarial value of the CFPF assets to be $721
million less than their market value. The same actuarial asset valuation method is
used for RFPF and this caused the actuarial value of the RFPF assets to be $18
million less than their market value.
2) Retroactive Changes to the Population Data
The net impact of the retroactive changes to the population data received from both
DND and PSPC has resulted in a decrease of $104 million in the Superannuation
Account actuarial liabilities, an increase of $245 million in the CFPF actuarial
liabilities, and an increase of $104 million in the RFPF actuarial liabilities.
The increase in the RFPF actuarial liabilities is unusually large in relative terms.
This is due to population data changes associated with the processing of a large
number of past earnings elections during the intervaluation period.

18
ACTUARIAL REPORT
Pension Plans for the CANADIAN FORCES as at 31 March 2016
3) Change in Methodology
The net impact of methodology changes was a decrease of $3 million in the
Superannuation Account actuarial liabilities, a decrease of $49 million in the CFPF
actuarial liabilities, and a decrease of $19 million in the RFPF actuarial liabilities.
The change in the RFPF actuarial liabilities due to methodology is unusually large in
relative terms. This is due to a variety of improvements which were made to the
process that compiles the valuation population files from the raw data extracts
received from DND and PSPC.
4) Expected Interest on Initial Financial Position
After factoring in the change in methodology and the retroactive changes to the
population data, the expected interest to 31 March 2016 on the Superannuation
Account actuarial excess of $1,264 million as at 31 March 2013 amounted to
$203 million. For the CFPF, the expected interest rate on the revised deficit position
of $1,911 million amounted to $289 million. For the RFPF, the expected interest rate
on the revised deficit position of $103 million amounted to $16 million.
These amounts of interest were based on the Superannuation Account yields, the
CFPF returns and the RFPF returns projected in the previous report for the three-
year intervaluation period.
5) Special Payments Made in the Intervaluation Period
A deficit of $2,436 million was reported in the CFPF as at 31 March 2013, and the
government took the position to amortize this deficit over the 13 years expected
average remaining service lifetime of participating members of the regular force
starting on 31 March 2015. A total of $589 million of special payment was made to
the CFPF during the intervaluation period that resulted in an increase of $624
million in asset after factoring the expected interest.
A deficit of $36 million was reported in the RFPF as at 31 March 2013 which was to
be amortized over a period of 15 years in accordance with the Reserve Force
Pension Plan Regulations. A total of $3.8 million of special payment was made to
the RFPF during the intervaluation period that resulted in an increase of $4 million
in asset after factoring the expected interest.
6) Experience Gains and Losses
Since the previous valuation, experience gains and losses have increased the
Superannuation Account actuarial excess by $95 million. The CFPF actuarial deficit
has decreased by $2,849 million due to the experience gains and losses over the
three-year intervaluation period. The RFPF actuarial deficit has decreased by
$32 million due to the experience gains and losses. The main experience gain and
loss items are described in Table 9.

19
ACTUARIAL REPORT
Pension Plans for the CANADIAN FORCES as at 31 March 2016
Table 9 Experience Gains and Losses
($ millions)
Superannuation
Account
Canadian Forces
Pension Fund
Reserve Force
Pension Fund
Demographic experience (i)
Terminations with a deferred annuity (3) (250) 9
Transfer Values 3 23 (129)1
Disabilities 3B with an annuity2 (22) (159)
Disability Retirements - - 1
Rollover from Part I.1 - (4) -
Rehired pensioner members 17 (2) -
Retirements 137 37 2
Disabilities 3A with an annuity2 - - -
Return of contributions 6 12 -
Non-disabled pensioner deaths (68) (6) (1)
Contributor deaths with survivors (3) (1) -
Widow(er) deaths (8) - -
Disabled pensioner deaths 1 - -
Total 60 (350) (118)
Investment earnings (ii) (14) 2,843 73
Economic salary increases (iii) 86 218 6
Cost/contributions difference (iv) 9 144 68
Change in service or earnings accrual (v) - (54) 10
Pension benefit division payments (vi) (27) (40) -
Promotional and seniority increases (vii) 2 31 -
Pension indexation (viii) 62 16 -
Administrative expenses 20 16 (8)
Expected/actual disbursements (ix) (54) (13) 1
YMPE increases 1 1 -
Miscellaneous (50) 37 -
Net experience gains (losses) 95 2,849 32
(i) The demographic assumptions having a large impact are as follows:
The actual number of members opting for a deferred annuity was greater than
expected which resulted in an increase of $3 million in the actuarial liability
of the Superannuation Account and an increase of $250 million in the CFPF.
Under the RFPF, the previous valuation assumed there would be a lump sum
payment made based on the commuted value of the accrued pension deferred
to age 60 in respect of all vested members who ceased to participate to the
1 Include members exiting the Reserve Force plan due to a rollover. A rollover results in the same transfer of assets from the
RFPF as if the member had elected to receive a Transfer Value. 2 Any condition rendering a member of the Regular Force mentally or physically unfit to perform his or her duties. A member
is discharged under Q. R. & O. 15.01 Article 3B when he or she is unable to perform the duties of his or her own
occupation. A member is discharged under Q.R. & O. 15.01 Article 3A when he or she is unable to perform the duties of
any occupation.
20
ACTUARIAL REPORT
Pension Plans for the CANADIAN FORCES as at 31 March 2016
Reserve Force Plan before the age of 50. However, during the valuation
period, it was observed that there were 2,858 such terminations which were
not rollover terminations and for which the member has not opted to receive a
transfer value. Such members are recognized in this valuation as deferred
annuitants. As at 31 March 2016, the actuarial liability held for these
members as deferred annuitants is less than the corresponding actuarial
liability held for these members as contributors. This resulted in a decrease of
$9 million in the RFPF actuarial liability.
The number of withdrawals with a transfer value was less than expected
while the number of disability 3B terminations with a transfer value was
higher than expected. The net impact of all terminations with a transfer value
resulted in an increase of $3 million in the initial Superannuation Account
excess and a decrease of $23 million in the initial CFPF deficit.
Under the RFPF, withdrawals with a transfer value and rollovers resulted in
an increase of $129 million in the actuarial deficit. The majority of the
increase in the actuarial deficit is attributable to payments made from the
RFPF to the CFPF during the intervaluation period in respect of rollovers
which occurred prior to 31 March 2013.
The significant increase in the actual number of Disability 3B retirements
above the projected number resulted in an increase in the actuarial liability of
$22 million in the Superannuation Account and of $159 million in the CFPF.
A total of 680 pensioners were rehired to the Regular Force Plan during the
intervaluation period. The net impact of releasing the pensioner liability and
setting up the contributor liability for each such member resulted in a
decrease of $17 million in the actuarial liability of the Superannuation
Account and an increase of $2 million in the actuarial liability of the CFPF.
The increase in liability on the CFPF is due to 35 pensioners of the Reserve
Force Plan moving to a contributor status under the Regular Force Plan.
In light of the significant increase in the number of Disability 3B retirements,
the number of retirements has decreased over the intervaluation period which
resulted in a decrease of $137 million in the actuarial liability of the
Superannuation Account and a decrease of $37 million in the actuarial
liability of the CFPF. The impact on the actuarial liability of the RFPF is
minimal with a reduction of $2 million.
Mortality under the Canadian Forces pension plans improved over the
intervaluation which resulted in an increase in the actuarial liabilities. The
impact is an additional $68, $6 and $1 million in actuarial liability of the
Superannuation Account, the CFPF and the RFPF respectively.
(ii) The rates of interest credited to the Superannuation Account were marginally
less than the corresponding projected Superannuation Account yields in the
previous valuation. Consequently, the experience loss was $14 million. The
investment return on both Pension Funds exceeded expectations in plan years
2014 and 2015, but was less than expected in plan year 2016. This resulted in an

21
ACTUARIAL REPORT
Pension Plans for the CANADIAN FORCES as at 31 March 2016
investment gain of $2,843 million for the CFPF and an investment gain of $73
for the RFPF over the three-year intervaluation period.
(iii) Economic salary increases during the intervaluation period were smaller than
expected. This resulted in a decrease in the actuarial liability of $86 million in
the Superannuation Account, of $218 million in the CFPF and of $6 million in
the RFPF.
(iv) Higher than expected member and government contributions during the
intervaluation period resulted in a gain of $9 million with respect to the
Superannuation Account, a gain of $144 million with respect to the CFPF and a
gain of $68 million with respect to the RFPF. The main reason for the
disproportionately large gain on the RFPF is the large number of past earnings
elections which DND processed in the intervaluation period.
(v) Service accruals higher than expected increased the CFPF actuarial liability by
$54 million. Earnings accruals lower than expected decreased the RFPF
actuarial liability by $10 million.
(vi) The net impact of the divisions of pension due to marriage breakdown (amount
paid out to the former spouse versus the actuarial liability released) accounted
for a loss of $27 million in the Superannuation Account and an increase of $40
million in the CFPF actuarial deficit. The Reserve Force Plan is not impacted by
pension divisions since no direction is provided under the Pension Benefits
Division Regulations regarding the division of pension upon the marriage
breakdown of member of the Reserve Force Plan.
(vii) Promotional and seniority salary increases were lower than expected at many
ages resulting in a decrease in the actuarial liability of $2 million in the
Superannuation Account and of $31 million in the CFPF.
(viii) Pension indexation was as expected at 1 January 2014, more than expected at
1 January 2015 and less than expected at 1 January 2016 which resulted in a
decrease in the actuarial liability of $62 million in the Superannuation Account,
of $16 in the CFPF and no impact in the RFPF.
(ix) Under the Superannuation Account, $54 million more than expected was paid in
lump sum and annuity payments as well as $13 million more from the CFPF
and $1 million less from the RFPF.
7) Revision of Actuarial Assumptions
Actuarial assumptions were revised based on economic trends and demographic
experience as described in Appendix 7. This revision has increased the
Superannuation Account actuarial liabilities by $3,120 million, increased the CFPF
actuarial liabilities by $1,794 million and increased the RFPF actuarial liability by
$37 million. The impacts of these revisions are described in the following table.
22
ACTUARIAL REPORT
Pension Plans for the CANADIAN FORCES as at 31 March 2016
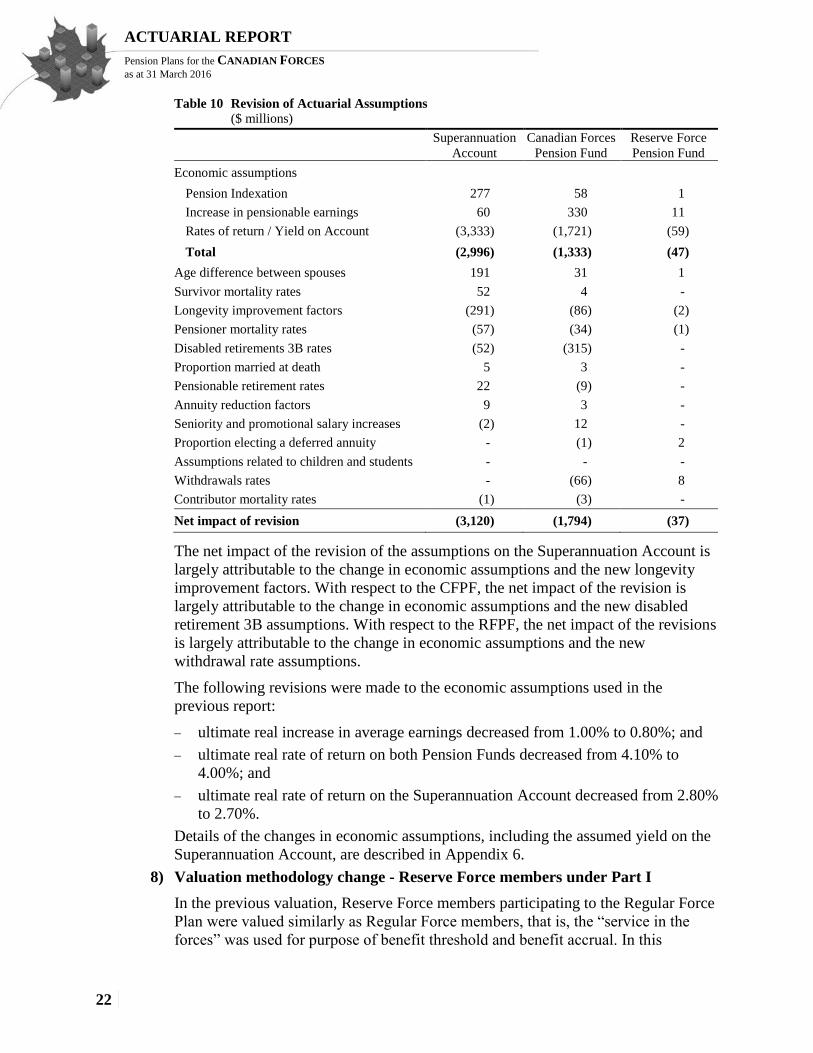
Table 10 Revision of Actuarial Assumptions
($ millions)
Superannuation
Account
Canadian Forces
Pension Fund
Reserve Force
Pension Fund
Economic assumptions
Pension Indexation 277 58 1
Increase in pensionable earnings 60 330 11
Rates of return / Yield on Account (3,333) (1,721) (59)
Total (2,996) (1,333) (47)
Age difference between spouses 191 31 1
Survivor mortality rates 52 4 -
Longevity improvement factors (291) (86) (2)
Pensioner mortality rates (57) (34) (1)
Disabled retirements 3B rates (52) (315) -
Proportion married at death 5 3 -
Pensionable retirement rates 22 (9) -
Annuity reduction factors 9 3 -
Seniority and promotional salary increases (2) 12 -
Proportion electing a deferred annuity - (1) 2
Assumptions related to children and students - - -
Withdrawals rates - (66) 8
Contributor mortality rates (1) (3) -
Net impact of revision (3,120) (1,794) (37)
The net impact of the revision of the assumptions on the Superannuation Account is
largely attributable to the change in economic assumptions and the new longevity
improvement factors. With respect to the CFPF, the net impact of the revision is
largely attributable to the change in economic assumptions and the new disabled
retirement 3B assumptions. With respect to the RFPF, the net impact of the revisions
is largely attributable to the change in economic assumptions and the new
withdrawal rate assumptions.
The following revisions were made to the economic assumptions used in the
previous report:
ultimate real increase in average earnings decreased from 1.00% to 0.80%; and
ultimate real rate of return on both Pension Funds decreased from 4.10% to
4.00%; and
ultimate real rate of return on the Superannuation Account decreased from 2.80%
to 2.70%.
Details of the changes in economic assumptions, including the assumed yield on the
Superannuation Account, are described in Appendix 6.
8) Valuation methodology change - Reserve Force members under Part I
In the previous valuation, Reserve Force members participating to the Regular Force
Plan were valued similarly as Regular Force members, that is, the “service in the
forces” was used for purpose of benefit threshold and benefit accrual. In this

23
ACTUARIAL REPORT
Pension Plans for the CANADIAN FORCES as at 31 March 2016
valuation, Reserve Force members have been segregated and are valued using the
“pensionable service” for benefit threshold and their benefit accrual is based on the
expected accrual ratio (qualifying service/pensionable service). This effectively
treats these Reserve Force members as part time members under the Regular Force
Plan.
While the previous valuation overestimated the accrued liability for these Reserve
Force members, the current valuation would underestimate the liability for Reserve
Force members that are currently working full time. Of a total of 1,582 Reserve
Force members at the valuation date, 1,152 Reserve Force members have an accrual
ratio less than one which indicates that the underestimation would be less in absolute
term compared to the previous report overestimation.
This valuation methodology change resulted in a decrease of $4 million in the
Superannuation Account actuarial liability and a decrease of $38 million in the
CFPF actuarial liability.
9) Change in the Present Value of Prior Service Contributions
The expected total government cost is shown in Table 22 on page 32. The
government is expected to make additional contributions in excess of the current
service cost for members’ prior service elections. The change in the present value of
prior service contributions correspond to members’ elections since the last report
where the members opted to pay for these elections by instalments. Members’ prior
service elections paid through instalments has the effect of increasing the
Superannuation Account and the CFPF assets by $1 and $86 million respectively as
well as increasing the RFPF assets by $5 million.
10) Change in the Present Value of Administrative Expenses
The previous report annual administrative expense assumption of 0.5% of total
pensionable payroll is increased to 0.75% in this report. This increase is based on the
projection of administrative expenses provided by DND, which covers the next three
years.
For plan year 2017, 58.1% of total administrative expenses are being charged to the
Superannuation Account; it is assumed that the proportion charged to the
Superannuation Account will reduce at the rate of 2.5% per year as compare to 3.0%
per year in the previous report. The additional 0.25% of annual administrative
expenses resulted in a decrease of $108 million of the Superannuation Account
initial actuarial excess.
11) Recognition of Remaining Contributions for Processed Prior Service
According to section 17 of the Reserve Force Pension Plan Regulations, past
earnings elections with a cost to the member of more than $500 are to be paid by
way of monthly installments. Section 21 of the Reserve Force Pension Plan
Regulations give members, at any time, the option to pre-pay any amount that
remains unpaid in respect of a past earnings election. Many members have exercised
this pre-payment option.

24
ACTUARIAL REPORT
Pension Plans for the CANADIAN FORCES as at 31 March 2016
In normal circumstances the time elapsed between the processing of a past earnings
election and the creation of a monthly installment schedule is minimal. If a member
has a processed election but there is no installment schedule in effect, it would
normally be assumed that the election was fully paid.
However, many Reserve Force members have been identified who have a processed
past earnings election but who have neither an installment schedule nor any record
of having made a lump sum payment. Discussions with DND have confirmed that
there are many Reserve Force installment schedules which are considered
incomplete in their system. It was therefore decided to estimate and recognize the
expected future contributions for all Reserve Force members having a processed past
earnings election but no installment schedule in effect as of the valuation date.
Given the unknown reliability of the installment schedule which are incomplete and
the tendency of members to make lump sum payments, the expected future
contributions are valued as if members will make an immediate lump sum payment
for the estimated unpaid amount of their past earnings election. Unpaid amounts
were estimated by estimating the cost to the member of the past earnings election
and deducting from that cost the sum of all contributions received up to the valuation
date. Unpaid amounts are subject to interest from the date the member is notified of
the finalized cost of their past earnings election.
As of the valuation date the total unpaid amount was estimated to be $21 million.
When these amounts are paid they will be matched by the government. Therefore the
total remaining contributions for processed past earnings elections not on an
installment schedule is $42 million and the recognition of this amount reduces the
RFPF deficit by the same amount.
12) Recognition of Unprocessed Prior Service
For the current valuation, DND has provided a list of the remaining members with
pre-2007 Reserve Force service elections that have not yet been processed. As at
31 March 2016 there were a total of 368 Regular Force members and 530 Reserve
Force members with such elections. These elections are recognized in both the
actuarial assets and the actuarial liabilities of the CFPF and the RFPF. The gain of
$8 million in the CFPF and loss of $2 million in the RFPF represent the difference
between the recognized future contributions and the recognized liability for these
unprocessed elections.
13) Amount receivable from Reserve Force Plan - Rollover Members
Rollovers are described in Appendix 1D.23. In normal circumstances, the time
elapsed between the rollover date and the date of the transfer of assets between the
plans is minimal. However, given the delays in the processing of past earnings
elections and other challenges associated with the newness of the Reserve Force
Plan, a significant backlog of outstanding asset transfers had accumulated by
31 March 2013. DND processed a large number of these outstanding asset transfers
during the valuation period. However, the impact of the large number of processed
payments was offset by the large number of rollovers which occurred during the
valuation period.
25
ACTUARIAL REPORT
Pension Plans for the CANADIAN FORCES as at 31 March 2016
In this report a total of 930 members have been identified as members who have
rolled over to the Regular Force Plan by the valuation date but assets had not been
transferred by the valuation date. From information provided by DND and PSPC in
April 2017 we know that 341 of the 930 outstanding asset transfers were processed
by 13 April 2017 and that the actual amount transferred in respect of these 341
rollovers was $25.1 million. The outstanding asset transfers in respect of the
remaining 589 rollovers were estimated at $31.9 million for a total amount payable
of $57 million as of the valuation date.
The amount payable to Regular Force Plan decreased by $48 million from $105.4
million as at 31 March 2013 to $57 million as at 31 March 2016.
14) Change in outstanding payments
For members terminating with a return of contributions or a transfer value payment
before 31 March 2016 where the actual payments will occur after that date, a
revision of the estimate of such payments resulted in an increase of $51 million in
the CFPF liability and a decrease of $6 million in the RFPF liability.
15) Pension Modernization Cost
The PSPC Pension Modernization Project is almost completed as the target date for
completion is by the end of plan year 2017. The cost associated with this project is
debited directly from the Superannuation Account, CFPF and the RFPF. The net
impact of the project remaining cost is a reduction of $6 million to the
Superannuation Account initial excess, an increase of $4 million to the CFPF deficit,
and an increase of $2 million to the RFPF deficit.
16) Unrecognized Investment Gains
The actuarial asset valuation method used in this valuation is the same as that
described in the 2013 valuation report. For this valuation, the method resulted in an
actuarial value of CFPF assets and the RFPF assets that is $1,078 and $30 million
less than their respective market value, due to unrecognized investment gains.
C. CFSA - Cost Certificate
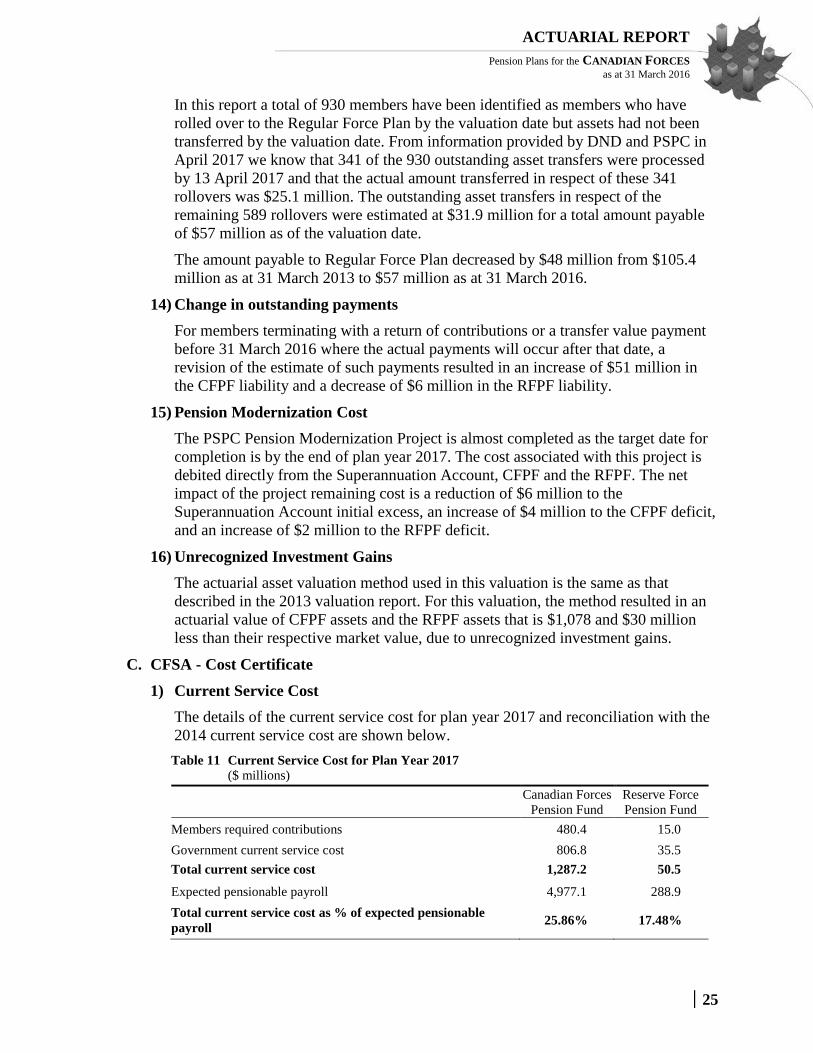
1) Current Service Cost
The details of the current service cost for plan year 2017 and reconciliation with the
2014 current service cost are shown below.
Table 11 Current Service Cost for Plan Year 2017
($ millions)
Canadian Forces
Pension Fund
Reserve Force
Pension Fund
Members required contributions 480.4 15.0
Government current service cost 806.8 35.5
Total current service cost 1,287.2 50.5
Expected pensionable payroll 4,977.1 288.9
Total current service cost as % of expected pensionable
payroll 25.86% 17.48%

26
ACTUARIAL REPORT
Pension Plans for the CANADIAN FORCES as at 31 March 2016
Table 12 Reconciliation of CFSA Current Service Cost
(Percentage of pensionable payroll)
Canadian Forces
Pension Fund
Reserve Force
Pension Fund
For plan year 2014 24.06 15.06
Use correct seniority and promotional salary scale - (0.27)
Valuation methodology change (0.12) -
Retroactive changes to the population data 0.15 0.18
Expected current service cost change (0.28) 0.46
Valuation methodology change - Reservists under Part I (0.05) -
Experience (gains)losses (0.04) 0.15
Changes in assumptions
Pension Indexation - -
Increase in pensionable earnings (0.75) (0.53)
Rates of return 2.30 2.50
Recognition of Pensionable Allowance (0.13) -
Withdrawals 0.09 (0.58)
Pensionable retirements 0.03 -
Proportion electing a deferred annuity 0.01 (0.15)
Disabled retirements 3B 0.44 -
Contributors mortality rates 0.01 -
Pensioners mortality rates 0.03 0.02
Longevity improvement factors 0.09 0.08
Seniority and promotional salary increases (0.03) 0.21
Proportion married at death - (0.01)
Age difference between spouses (0.03) (0.02)
Administrative expenses 0.09 0.50
Unexplained Changes - (0.01)
For plan year 2017 25.86 17.48
2) Projection of Current Service Costs
The current service cost is borne jointly by the plan members and the government.
The Regular Force member contribution rates have been changed since the last
valuation. Contribution rates are set equal to the contribution rates of Group 1
contributors under the pension plan for the PS pension plan.

27
ACTUARIAL REPORT
Pension Plans for the CANADIAN FORCES as at 31 March 2016
Member Contribution Rates1
Regular Force Member
Calendar Year Below YMPE Above YMPE Reserve Force Member
2016 9.05% 11.04% 5.20%
2017 9.47% 11.68% 5.20%
2018 9.83% 12.13% 5.20%
2019 9.76% 12.08% 5.20%
2020 9.71% 12.04% 5.20%
Current service costs on a plan year basis, expressed in percentage of the projected
pensionable payroll as well as in dollar amount are shown in Table 13 for Regular
Force members and Table 14 for Reserve Force members. Member contributions
and the government current service costs are also shown on a calendar year basis in
the Executive Summary.
Table 13 Projection of Current Service Cost on a Plan Year Basis - CFPF
Plan
Year
$ Millions % of Pensionable Payroll Split
Members : Government Members Government Total Members Government Total
2017 480.4 806.8 1287.2 9.65 16.21 25.86 37% : 63%
2018 504.3 780.8 1285.1 10.10 15.64 25.74 39% : 61%
2019 526.2 763.8 1290.0 10.36 15.04 25.40 41% : 59%
2020 533.0 769.7 1302.7 10.29 14.86 25.15 41% : 59%
2021 542.1 777.4 1319.5 10.23 14.68 24.91 41% : 59%
2026 609.0 853.9 1462.9 10.08 14.13 24.21 42% : 58%
2031 701.0 1002.2 1703.2 10.04 14.36 24.40 41% : 59%
Table 14 Projection of Current Service Cost on a Plan Year Basis- RFPF
Plan
Year
$ Millions % of Pensionable Payroll Split
Members : Government Members Government Total Members Government Total
2017 15.0 35.5 50.5 5.20 12.28 17.48 30% : 70%
2018 16.1 35.1 51.2 5.20 11.36 16.56 31% : 69%
2019 17.2 36.8 54.0 5.20 11.17 16.37 32% : 68%
2020 18.2 38.9 57.1 5.20 11.10 16.30 32% : 68%
2021 19.3 41.1 60.4 5.20 11.08 16.28 32% : 68%
2026 24.8 54.9 79.7 5.20 11.50 16.70 31% : 69%
2031 31.1 75.2 106.3 5.20 12.54 17.74 29% : 71%
3) Administrative Expenses (Pension Modernization Cost Included)
Based upon the assumptions described in Appendix 7 B. 3, the CFPF and the RFPF
administrative expenses are included in the total current service costs. As for the
previous report, the expected administration expenses exclude the PSPIB operating
expenses, as these are recognized implicitly through a decrease in the real rate of
1 The Regular Force member contribution rates shown after calendar year 2017 are estimates and subject to change. There are
no scheduled changes to the Reserve Force member contribution rate currently set by the Reserve Force Pension Plan
Regulations at 5.2% of pensionable earnings.

28
ACTUARIAL REPORT
Pension Plans for the CANADIAN FORCES as at 31 March 2016
return. The total administrative expenses for the Regular Force Plan and the Reserve
Force Plan are estimated to be as follows:
Table 15 Administrative Expenses
$ Millions
Plan Year
Ongoing Pension Modernization
SA1 CFPF RFPF SA CFPF RFPF
2017 21.7 15.6 5.1 12.4 9.0 4.1
2018 20.8 16.6 5.4 - - -
2019 20.2 17.9 5.8 - - -
2020 19.7 19.2 6.1 - - -
The Superannuation Account administrative expenses have been capitalized and are
shown as a liability in the balance sheet.
4) Contributions for Prior Service Elections
Based on the valuation data and the assumptions described in sections B and C of
Appendix 6 and recent statistical information provided by the DND, member and
government contributions for prior service elections were estimated as follows:
Table 16 Estimated Contributions for Prior Service 2
($ millions)
Plan
Year
Superannuation Account Canadian Forces Pension Fund Reserve Force Pension Fund
Members Government Members Government Members Government
2017 1.0 1.0 11.6 19.1 5.0 5.0
2018 1.0 1.0 11.9 18.0 13.2 13.2
2019 0.9 0.9 12.3 17.4 13.1 13.1
2020 0.9 0.9 12.7 17.9 9.3 9.3
2021 0.9 0.9 13.1 18.3 1.3 1.3
D. Sensitivity of Valuation Results to Variations in Longevity Improvement Factors
This valuation assumes that the current mortality rates applicable to members of the
Canadian Forces will improve over time. This assumption is based on the longevity
improvement assumption3 contained in the 27th
Canada Pension Plan (CPP) actuarial
report.
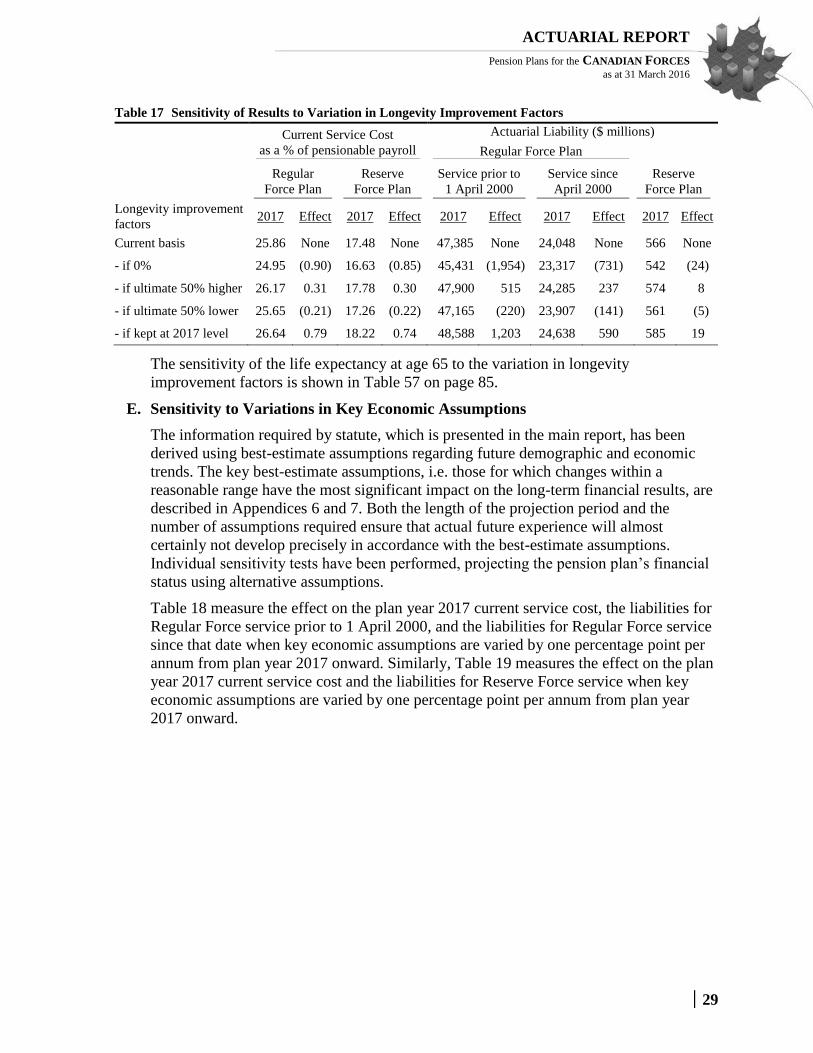
Table 17 measures the effect on the plan year 2017 current service cost and the liabilities
for service prior to 1 April 2000 and for service since that date, under various longevity
improvement assumptions. The current longevity improvement assumption is described
in Table 55 of Appendix 7.
1 Canadian Forces Superannuation Account. 2 There is no contribution for prior service to the RCA. 3 In this report ‘longevity improvement assumption’ is equivalent to the ‘mortality improvement assumption’ discussed in the
27th Actuarial Report on the Canada Pension Plan
29
ACTUARIAL REPORT
Pension Plans for the CANADIAN FORCES as at 31 March 2016
Table 17 Sensitivity of Results to Variation in Longevity Improvement Factors
Current Service Cost
as a % of pensionable payroll
Actuarial Liability ($ millions)
Regular Force Plan
Regular
Force Plan
Reserve
Force Plan
Service prior to
1 April 2000
Service since
April 2000
Reserve
Force Plan
Longevity improvement
factors 2017 Effect 2017 Effect 2017 Effect 2017 Effect 2017 Effect
Current basis 25.86 None 17.48 None 47,385 None 24,048 None 566 None
- if 0% 24.95 (0.90) 16.63 (0.85) 45,431 (1,954) 23,317 (731) 542 (24)
- if ultimate 50% higher 26.17 0.31 17.78 0.30 47,900 515 24,285 237 574 8
- if ultimate 50% lower 25.65 (0.21) 17.26 (0.22) 47,165 (220) 23,907 (141) 561 (5)
- if kept at 2017 level 26.64 0.79 18.22 0.74 48,588 1,203 24,638 590 585 19
The sensitivity of the life expectancy at age 65 to the variation in longevity
improvement factors is shown in Table 57 on page 85.
E. Sensitivity to Variations in Key Economic Assumptions
The information required by statute, which is presented in the main report, has been
derived using best-estimate assumptions regarding future demographic and economic
trends. The key best-estimate assumptions, i.e. those for which changes within a
reasonable range have the most significant impact on the long-term financial results, are
described in Appendices 6 and 7. Both the length of the projection period and the
number of assumptions required ensure that actual future experience will almost
certainly not develop precisely in accordance with the best-estimate assumptions.
Individual sensitivity tests have been performed, projecting the pension plan’s financial
status using alternative assumptions.
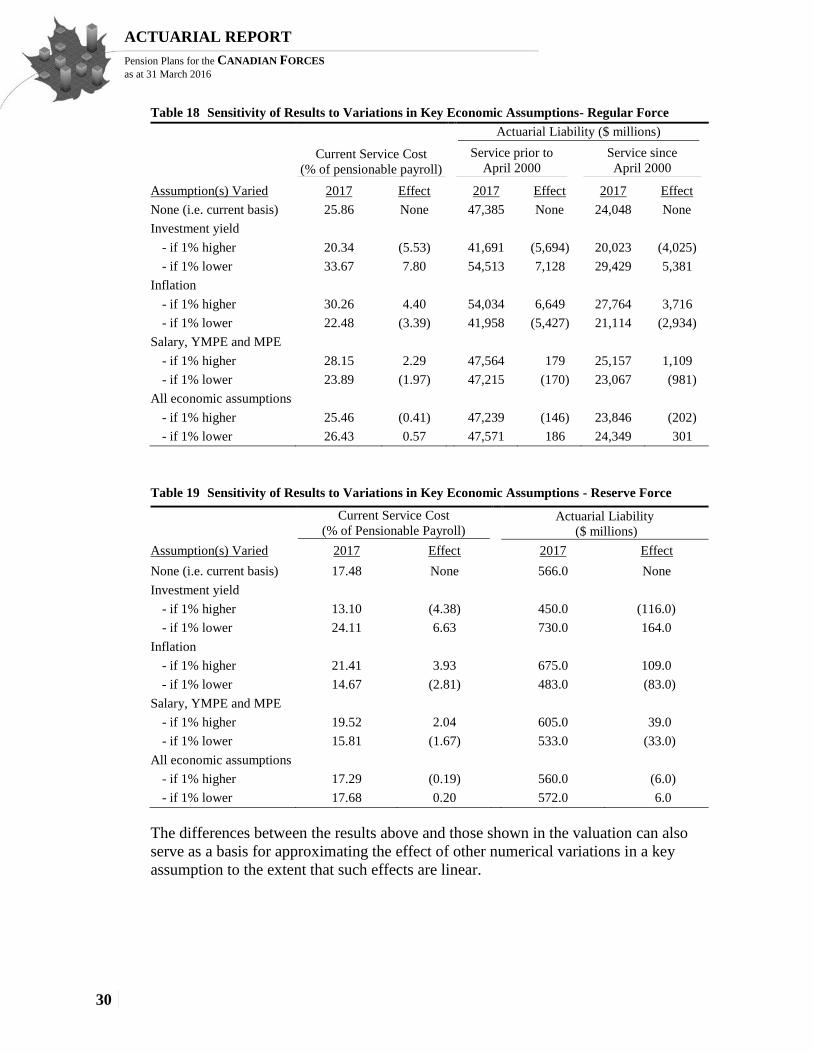
Table 18 measure the effect on the plan year 2017 current service cost, the liabilities for
Regular Force service prior to 1 April 2000, and the liabilities for Regular Force service
since that date when key economic assumptions are varied by one percentage point per
annum from plan year 2017 onward. Similarly, Table 19 measures the effect on the plan
year 2017 current service cost and the liabilities for Reserve Force service when key
economic assumptions are varied by one percentage point per annum from plan year
2017 onward.
30
ACTUARIAL REPORT
Pension Plans for the CANADIAN FORCES as at 31 March 2016
Table 18 Sensitivity of Results to Variations in Key Economic Assumptions- Regular Force
Current Service Cost
(% of pensionable payroll)
Actuarial Liability ($ millions)
Service prior to
April 2000
Service since
April 2000
Assumption(s) Varied 2017 Effect 2017 Effect 2017 Effect
None (i.e. current basis) 25.86 None 47,385 None 24,048 None
Investment yield
- if 1% higher 20.34 (5.53) 41,691 (5,694) 20,023 (4,025)
- if 1% lower 33.67 7.80 54,513 7,128 29,429 5,381
Inflation
- if 1% higher 30.26 4.40 54,034 6,649 27,764 3,716
- if 1% lower 22.48 (3.39) 41,958 (5,427) 21,114 (2,934)
Salary, YMPE and MPE
- if 1% higher 28.15 2.29 47,564 179 25,157 1,109
- if 1% lower 23.89 (1.97) 47,215 (170) 23,067 (981)
All economic assumptions
- if 1% higher 25.46 (0.41) 47,239 (146) 23,846 (202)
- if 1% lower 26.43 0.57 47,571 186 24,349 301
Table 19 Sensitivity of Results to Variations in Key Economic Assumptions - Reserve Force
Current Service Cost
(% of Pensionable Payroll)
Actuarial Liability
($ millions)
Assumption(s) Varied 2017 Effect 2017 Effect
None (i.e. current basis) 17.48 None 566.0 None
Investment yield
- if 1% higher 13.10 (4.38) 450.0 (116.0)
- if 1% lower 24.11 6.63 730.0 164.0
Inflation
- if 1% higher 21.41 3.93 675.0 109.0
- if 1% lower 14.67 (2.81) 483.0 (83.0)
Salary, YMPE and MPE
- if 1% higher 19.52 2.04 605.0 39.0
- if 1% lower 15.81 (1.67) 533.0 (33.0)
All economic assumptions
- if 1% higher 17.29 (0.19) 560.0 (6.0)
- if 1% lower 17.68 0.20 572.0 6.0
The differences between the results above and those shown in the valuation can also
serve as a basis for approximating the effect of other numerical variations in a key
assumption to the extent that such effects are linear.
31
ACTUARIAL REPORT
Pension Plans for the CANADIAN FORCES as at 31 March 2016
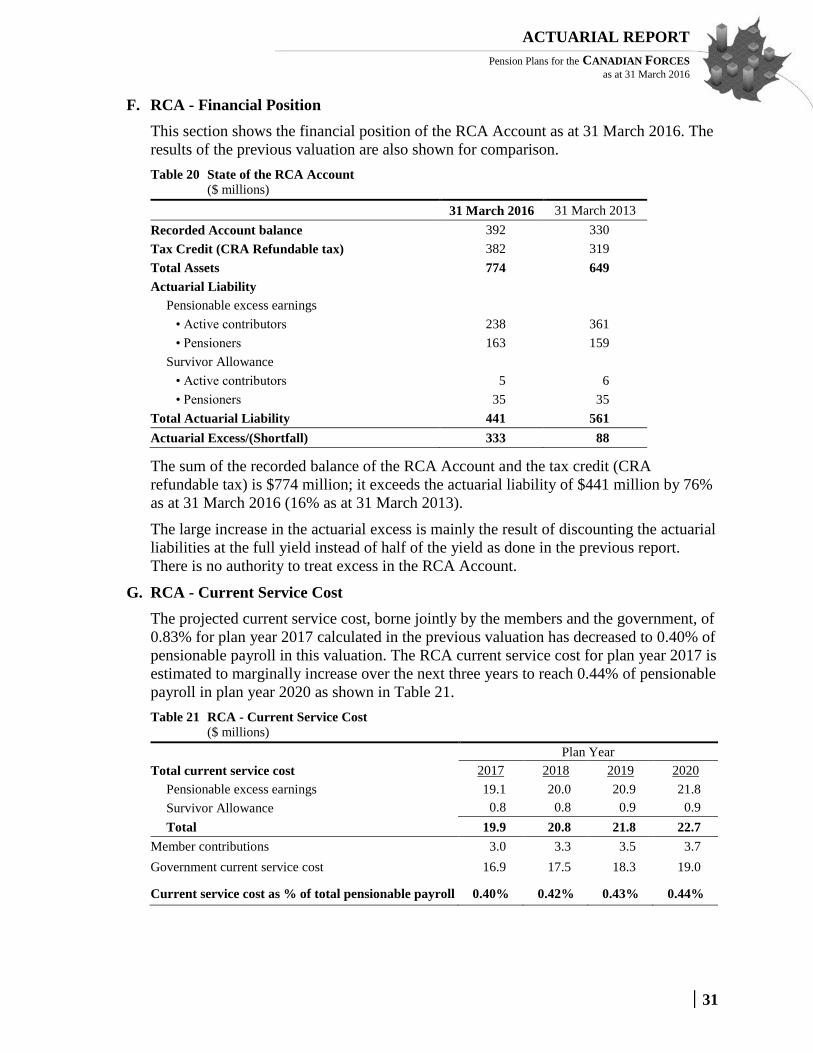
F. RCA - Financial Position
This section shows the financial position of the RCA Account as at 31 March 2016. The
results of the previous valuation are also shown for comparison.
Table 20 State of the RCA Account
($ millions)
31 March 2016 31 March 2013
Recorded Account balance 392 330
Tax Credit (CRA Refundable tax) 382 319
Total Assets 774 649
Actuarial Liability
Pensionable excess earnings
• Active contributors 238 361
• Pensioners 163 159
Survivor Allowance
• Active contributors 5 6
• Pensioners 35 35
Total Actuarial Liability 441 561
Actuarial Excess/(Shortfall) 333 88
The sum of the recorded balance of the RCA Account and the tax credit (CRA
refundable tax) is $774 million; it exceeds the actuarial liability of $441 million by 76%
as at 31 March 2016 (16% as at 31 March 2013).
The large increase in the actuarial excess is mainly the result of discounting the actuarial
liabilities at the full yield instead of half of the yield as done in the previous report.
There is no authority to treat excess in the RCA Account.
G. RCA - Current Service Cost
The projected current service cost, borne jointly by the members and the government, of
0.83% for plan year 2017 calculated in the previous valuation has decreased to 0.40% of
pensionable payroll in this valuation. The RCA current service cost for plan year 2017 is
estimated to marginally increase over the next three years to reach 0.44% of pensionable
payroll in plan year 2020 as shown in Table 21.
Table 21 RCA - Current Service Cost
($ millions)
Plan Year
Total current service cost 2017 2018 2019 2020
Pensionable excess earnings 19.1 20.0 20.9 21.8
Survivor Allowance 0.8 0.8 0.9 0.9
Total 19.9 20.8 21.8 22.7
Member contributions 3.0 3.3 3.5 3.7
Government current service cost 16.9 17.5 18.3 19.0
Current service cost as % of total pensionable payroll 0.40% 0.42% 0.43% 0.44%
32
ACTUARIAL REPORT
Pension Plans for the CANADIAN FORCES as at 31 March 2016
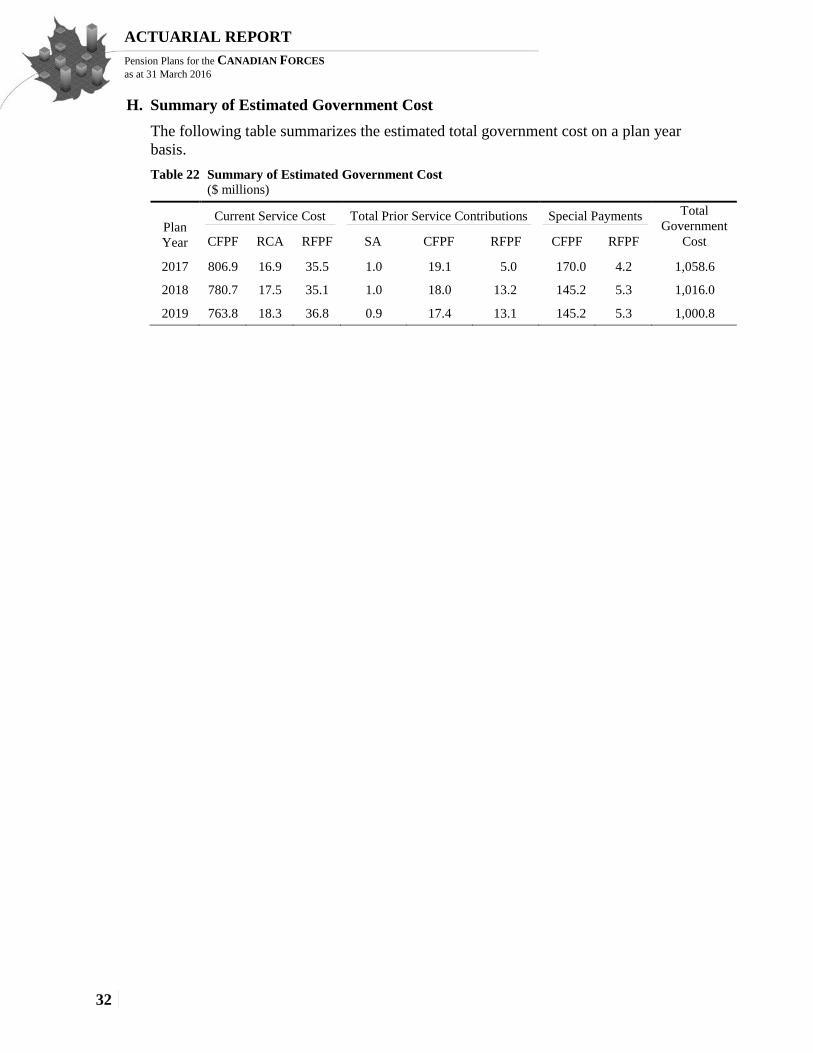
H. Summary of Estimated Government Cost
The following table summarizes the estimated total government cost on a plan year
basis.
Table 22 Summary of Estimated Government Cost
($ millions)
Plan
Year
Current Service Cost Total Prior Service Contributions Special Payments Total
Government
Cost CFPF RCA RFPF SA CFPF RFPF CFPF RFPF
2017 806.9 16.9 35.5 1.0 19.1 5.0 170.0 4.2 1,058.6
2018 780.7 17.5 35.1 1.0 18.0 13.2 145.2 5.3 1,016.0
2019 763.8 18.3 36.8 0.9 17.4 13.1 145.2 5.3 1,000.8

33
ACTUARIAL REPORT
Pension Plans for the CANADIAN FORCES as at 31 March 2016
III. Actuarial Opinion
In our opinion, considering that this report was prepared pursuant to the Public Pensions
Reporting Act,
the valuation input data on which the valuation is based are sufficient and reliable for the
purposes of the valuation;
the assumptions that have been used are, individually and in aggregate, appropriate for
the purposes of the valuation;
the methodology employed is appropriate for the purposes of the valuation; and
this report has been prepared, and our opinions given, in accordance with accepted
actuarial practice in Canada.
In particular, this report was prepared in accordance with the Standards of Practice (General
Standards and Practice – Practice-Specific Standards for Pension Plans) published by the
Canadian Institute of Actuaries.
To the best of our knowledge, after discussion with the Department of National Defence,
there were no events between the valuation date and the date of this report that would have a
material impact on the results of this valuation.
The payment of accrued pension benefits being the responsibility of the government, the
likelihood of the plan being wound-up and its obligation not being fulfilled is practically
nonexistent. Further, the legislation does not define the benefits payable upon wind-up.
Therefore, a solvency valuation has not been performed.
Daniel Hébert, F.S.A., F.C.I.A.
Senior Actuary
Jean-Claude Ménard, F.S.A., F.C.I.A
Chief Actuary
Christopher Dieterle, F.S.A., F.C.I.A.
Senior Actuarial Officer
Ottawa, Canada
21 September 2017
APPENDIX 1 34
ACTUARIAL REPORT
Pension Plans for the CANADIAN FORCES as at 31 March 2016
Appendix 1 - Summary of Pension Benefit Provisions
Pensions for members of the regular force were first provided under the Militia Pension Act of
1901, when in 1950 it became the Defence Services Pension Act until the Defence Services
Pension Continuation Act and the Canadian Forces Superannuation Act (CFSA) were enacted in
1959. Benefits are also provided to members of the regular force under the Special Retirement
Arrangements Act.
The enactment of Bill C-78 on 21 September 1999 gave authority to create a pension plan for the
members of the reserve force. The Reserve Force Plan was established on 1 March 2007 and
provides pension benefits to part-time members of the reserve force who meet the threshold
requirements for becoming plan members. The benefit eligibility rules under this plan are the
same as the rules that apply to Regular Force members starting on 1 March 2007.
Benefits under both the Regular Force Plan and the Reserve Force Plan may be reduced in
accordance with the Pension Benefits Division Act if there is a breakdown of a spousal union.
Changes since the last valuation
This is the first report that shows the combined results of both Regular Force Plan and Reserve
Force Plan.
The previous actuarial reports for the Regular Force Plan and the Reserve Force Plan were made
as at 31 March 2013 and as at 31 March 2015 respectively. However, this report will reconcile
the results to the previous 31 March 2013 Reserve Force Plan actuarial report for consistency
between the Regular and Reserve Force Plans.
Since then, all changes made to the CFSA are considered cosmetic and have no financial impact
on the funding of either pension plan.
Methodology changes
In the previous valuation, Reserve Force members participating in the Regular Force Plan were
valued as Regular Force members, that is, the “service in the forces” (qualifying service) was
used for purpose of benefit threshold and benefit accrual. In this valuation, Reserve Force
members have been segregated and are valued using the “pensionable service” for benefit
threshold and their benefit accrual is based on their expected accrual ratio (qualifying
service/pensionable service). This effectively treats these Reserve Force members as part time
members under the Regular Force Plan.
Pensionable service years credited to each member of the reserve force as at 31 March 2016 was
used to estimate future benefit entitlements. In contrast to the previous valuation, this valuation
no longer recognizes that certain Reserve Force members will be entitled to an immediate
annuity after the completion of a total of 25 years of qualifying service. The impact of this
change in valuation methodology was measured and found to be immaterial to the valuation
results. This change in valuation methodology has allowed us to significantly reduce the
complexity of our valuation data processing.
APPENDIX 1 35
ACTUARIAL REPORT
Pension Plans for the CANADIAN FORCES as at 31 March 2016
Summary of Pension Benefit Provisions
Summarized in this appendix are the pension benefits, for both the Regular Force members and
the Reserve Force members, provided under the CFSA registered provisions, which are in
compliance with the Income Tax Act. For the Regular Force Plan, the portion of the benefits in
excess of the Income Tax Act limits for the registered is provided under the RCA described in
Appendix 2.
The legislation shall prevail if there is a discrepancy between it and this summary.
A. Membership
Regular Force membership in the Regular Force Plan is compulsory for all full-time
members of the Canadian Forces.
As of 1 March 2007, a member of the reserve force is considered to be a member of the
regular force and will become a member of the Regular Force Plan,
on 1 March 2007 if, on that date,
the member’s total number of days of paid Canadian Forces service during any
period of 60 months beginning on or after 1 April 1999 was no less than 1,674,
the member already was or became a member of the Canadian Forces during the first
month of the period and remained a member of the Canadian Forces throughout the
period without any interruption of more than 60 days,
the member is not a person required to contribute to the Public Service Pension Fund
or the Royal Canadian Mounted Police Pension Fund, and
the member does not have any pensionable service to their credit under Part I of the
CFSA;
in any other case, on the first day of the month following a period of 60 months ending
after 1 March 2007 if
the member’s total number of days of paid Canadian Forces service during the
period was no less than 1,674,
the member already was or became a member of the Canadian Forces during the first
month of the period and remained a member of the Canadian Forces throughout the
period without any interruption of more than 60 days, and
the member does not have any pensionable service to their credit under Part I of the
CFSA.
The general rule is that, once a Reserve Force member is deemed a Regular Force member
for the purposes of Part I of the CFSA and does not fail to receive pensionable earnings in
any 12 consecutive months, the member remains a contributor under Part I of the CFSA as
long as they remain a member of the Reserve Force. There are exceptions to the general rule
previously described but for the purpose of this report, these were considered immaterial.
A member of the reserve force is deemed to become a participant in the Reserve Force Plan,
defined under Part I.1 of the CFSA, if,
a) during each of any two consecutive periods of 12 months beginning on or after
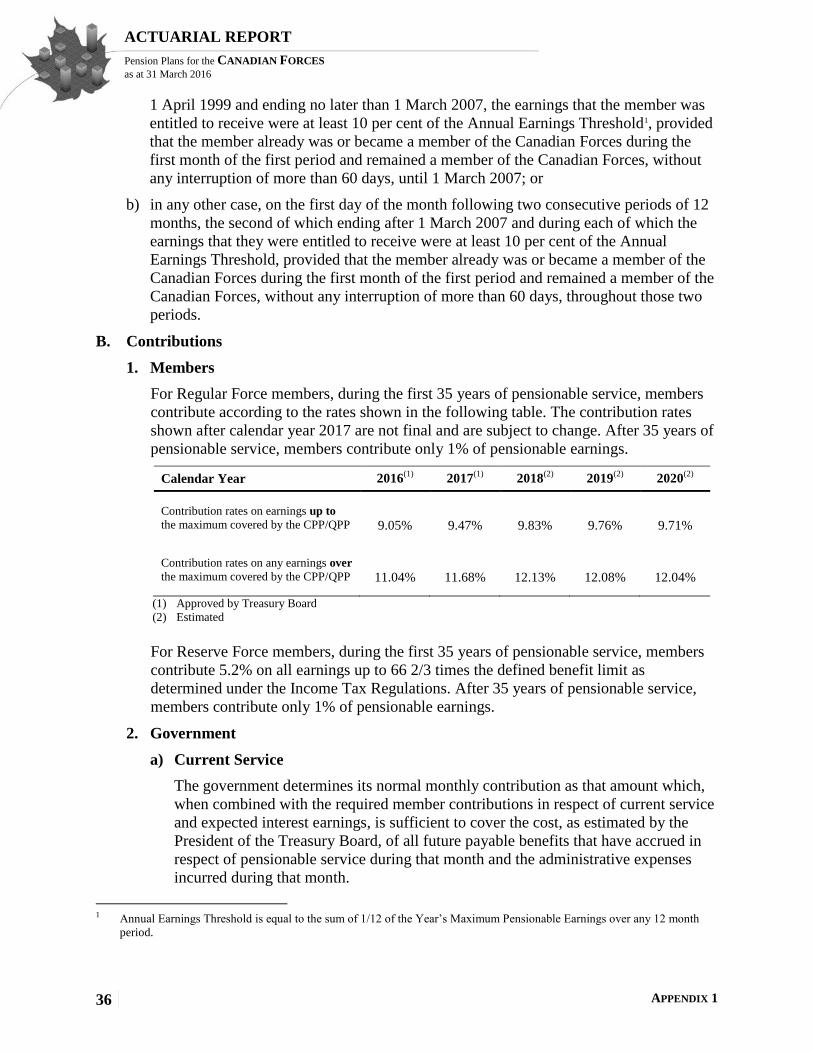
APPENDIX 1 36
ACTUARIAL REPORT
Pension Plans for the CANADIAN FORCES as at 31 March 2016
1 April 1999 and ending no later than 1 March 2007, the earnings that the member was
entitled to receive were at least 10 per cent of the Annual Earnings Threshold1, provided
that the member already was or became a member of the Canadian Forces during the
first month of the first period and remained a member of the Canadian Forces, without
any interruption of more than 60 days, until 1 March 2007; or
b) in any other case, on the first day of the month following two consecutive periods of 12
months, the second of which ending after 1 March 2007 and during each of which the
earnings that they were entitled to receive were at least 10 per cent of the Annual
Earnings Threshold, provided that the member already was or became a member of the
Canadian Forces during the first month of the first period and remained a member of the
Canadian Forces, without any interruption of more than 60 days, throughout those two
periods.
B. Contributions
1. Members
For Regular Force members, during the first 35 years of pensionable service, members
contribute according to the rates shown in the following table. The contribution rates
shown after calendar year 2017 are not final and are subject to change. After 35 years of
pensionable service, members contribute only 1% of pensionable earnings.
Calendar Year 2016(1)
2017(1)
2018(2)
2019(2)
2020(2)
Contribution rates on earnings up to
the maximum covered by the CPP/QPP
9.05%
9.47%
9.83%
9.76%
9.71%
Contribution rates on any earnings over
the maximum covered by the CPP/QPP
11.04%
11.68%
12.13%
12.08%
12.04%
(1) Approved by Treasury Board
(2) Estimated
For Reserve Force members, during the first 35 years of pensionable service, members
contribute 5.2% on all earnings up to 66 2/3 times the defined benefit limit as
determined under the Income Tax Regulations. After 35 years of pensionable service,
members contribute only 1% of pensionable earnings.
2. Government
a) Current Service
The government determines its normal monthly contribution as that amount which,
when combined with the required member contributions in respect of current service
and expected interest earnings, is sufficient to cover the cost, as estimated by the
President of the Treasury Board, of all future payable benefits that have accrued in
respect of pensionable service during that month and the administrative expenses
incurred during that month.
1 Annual Earnings Threshold is equal to the sum of 1/12 of the Year’s Maximum Pensionable Earnings over any 12 month
period.

APPENDIX 1 37
ACTUARIAL REPORT
Pension Plans for the CANADIAN FORCES as at 31 March 2016
b) Elected Prior Service
The government matches Regular Force member contributions credited under the
Superannuation Account for prior service elections; however, no contributions are
credited if the member is paying the double rate.
Government credits to the Canadian Forces Pension Fund in respect of elected prior
service are as described for current service; however, if the member is paying the
double rate the government contribution rate is generally adjusted so that total
member and government contributions match the current service cost.
For Reserve Force members, this valuation assumes that the government will match
member contributions for prior service elections.
c) Actuarial Excess and Surplus
In accordance with the CFSA, the government has the authority to:
debit the excess of accounts available for benefits over the actuarial liability from
the Superannuation Account subject to limitations, and
deal with any actuarial surplus, subject to limitations, in the Canadian Forces
Pension Fund as it occurs, either by reducing members and/or employer
contributions or by making withdrawals.
The regulations under Part I.1 of the CFSA give the government the authority to deal
with any actuarial surplus, subject to limitations, in the RFPF as it occurs by
reducing employer contributions.
d) Actuarial Shortfall and Deficit
In accordance with the CFSA, if an actuarial shortfall under the Superannuation
Account is identified through a statutory actuarial report, the actuarial shortfall can
be amortized over a period of up to 15 years, such that the amount that in the opinion
of the President of the Treasury Board will, at the end of the fifteenth fiscal year
following the tabling of that report or at the end of the shorter period that the
President of the Treasury Board may determine, together with the amount that the
President of the Treasury Board estimates will be to the credit of the Superannuation
Account at that time, meet the cost of the benefits payable in respect of pensionable
service prior to 1 April 2000.
If an actuarial deficit under the CFPF is identified through a statutory actuarial
report, the actuarial deficit can be amortized over a period of up to 15 years, such
that the amount that in the opinion of the President of the Treasury Board will, at the
end of the fifteenth fiscal year following the tabling of that report or at the end of the
shorter period that the President of the Treasury Board may determine, together with
the amount that the President of the Treasury Board estimates will be to the credit of
the Canadian Forces Pension Fund at that time, meet the cost of the benefits payable
in respect of pensionable service since 1 April 2000.
APPENDIX 1 38
ACTUARIAL REPORT
Pension Plans for the CANADIAN FORCES as at 31 March 2016
Similarly, if an actuarial deficit under the RFPF is identified through a statutory
actuarial report, the RFPF is to be credited with such annual amounts that will fully
amortize the actuarial deficit over a period of 15 years.
C. Summary Description of Benefits under the Regular Force Plan and the Reserve Force
Plan
The objective of the Regular Force Plan and the Reserve Force Plan is to provide an
employment earnings–related lifetime retirement pension to eligible members. Benefits to
members in case of disability and to the spouse and children in case of death are also
provided.
Regular Force member’s pension benefits are coordinated with the pensions paid by the
CPP. The initial rate of a Regular Force member’s retirement pension is equal to 2% of the
highest average of annual pensionable earnings over any period of five consecutive1 years,
multiplied by the number of years of pensionable service not exceeding 35. The pension is
indexed annually with the Consumer Price Index (CPI) and the accumulated indexation may
be payable at age 55 at the earliest as defined in Note 6 of section D below. Entitlement to
benefits depends on either the qualifying service in the Canadian Forces or the pensionable
service, as defined below in Notes 7 and 8 of section D below.
Reserve Force member’s pension benefits are equal to 1.5% of the greater of the Reserve
Force member’s total pensionable earnings and total updated pensionable earnings over the
most recent 35 years of pensionable service (i.e. Updated Career Average Plan). The
Reserve Force Plan also provides a bridge benefit equal to 0.5% of the greater of the
pensioner’s total bridge benefit earnings and total updated bridge benefit earnings over the
most recent 35 years of pensionable service. Reserve Force pension and bridge benefits are
indexed annually with the Consumer Price Index and the accumulated indexation may be
payable at age 55 at the earliest, as defined in Note 6 of section D below.
Entitlement to benefits depends on either the qualifying service in the Canadian Forces or
the pensionable service, as defined below in Notes 7 and 8 of section D below.
1 Any five-year period of pensionable service selected by or on behalf of the contributor, or during any period so selected
consisting of consecutive periods of pensionable service totalling five years.
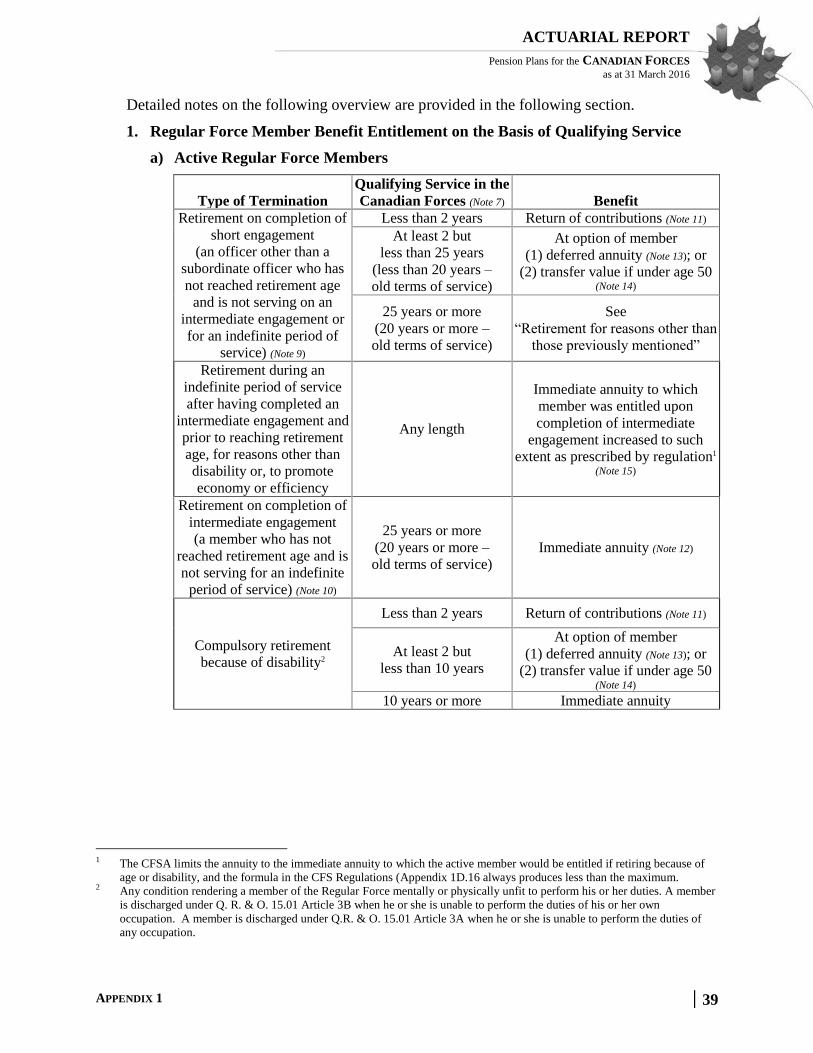
APPENDIX 1 39
ACTUARIAL REPORT
Pension Plans for the CANADIAN FORCES as at 31 March 2016
Detailed notes on the following overview are provided in the following section.
1. Regular Force Member Benefit Entitlement on the Basis of Qualifying Service
a) Active Regular Force Members
Type of Termination
Qualifying Service in the
Canadian Forces (Note 7) Benefit
Retirement on completion of
short engagement
(an officer other than a
subordinate officer who has
not reached retirement age
and is not serving on an
intermediate engagement or
for an indefinite period of
service) (Note 9)
Less than 2 years Return of contributions (Note 11)
At least 2 but
less than 25 years
(less than 20 years –
old terms of service)
At option of member
(1) deferred annuity (Note 13); or
(2) transfer value if under age 50 (Note 14)
25 years or more
(20 years or more –
old terms of service)
See
“Retirement for reasons other than
those previously mentioned”
Retirement during an
indefinite period of service
after having completed an
intermediate engagement and
prior to reaching retirement
age, for reasons other than
disability or, to promote
economy or efficiency
Any length
Immediate annuity to which
member was entitled upon
completion of intermediate
engagement increased to such
extent as prescribed by regulation1 (Note 15)
Retirement on completion of
intermediate engagement
(a member who has not
reached retirement age and is
not serving for an indefinite
period of service) (Note 10)
25 years or more
(20 years or more –
old terms of service)
Immediate annuity (Note 12)
Compulsory retirement
because of disability2
Less than 2 years Return of contributions (Note 11)
At least 2 but
less than 10 years
At option of member
(1) deferred annuity (Note 13); or
(2) transfer value if under age 50 (Note 14)
10 years or more Immediate annuity
1 The CFSA limits the annuity to the immediate annuity to which the active member would be entitled if retiring because of
age or disability, and the formula in the CFS Regulations (Appendix 1D.16 always produces less than the maximum. 2 Any condition rendering a member of the Regular Force mentally or physically unfit to perform his or her duties. A member
is discharged under Q. R. & O. 15.01 Article 3B when he or she is unable to perform the duties of his or her own
occupation. A member is discharged under Q.R. & O. 15.01 Article 3A when he or she is unable to perform the duties of
any occupation.

APPENDIX 1 40
ACTUARIAL REPORT
Pension Plans for the CANADIAN FORCES as at 31 March 2016
Type of Termination
Qualifying Service in the
Canadian Forces (Note 7) Benefit
Compulsory retirement to
promote economy or
efficiency
Less than 2 years Return of contributions
More than 2 but
less than 10 years
At option of member
(1) deferred annuity (Note 13); or
(2) transfer value if under age 50 (Note 14)
At least 10 but
less than 25 years
(less than 20 years –
old terms of service)
At option of member
(1) return of contributions; or
(2) deferred annuity; or
(3) transfer value if under age 50 (Note 14)
(4) with consent of the Minister of
National Defence, an immediate
reduced annuity (Note 16)
25 years or more
(20 years or more –
old terms of service)
Immediate annuity (Note 12)
Retirement for reasons other
than those previously
mentioned
Less than 2 years Return of contributions (Note 11)
At least 2 but
less than 25 years
(less than 20 years –
old terms of service)
At option of member
(1) deferred annuity (Note 13); or
(2) transfer value if under age 50 (Note 14)
(At least 20 but
less than 25 years –
old terms of service)
Immediate reduced annuity
25 years or more
Officer:
- immediate reduced annuity (Note
16);
Other than officer:
- immediate annuity (Note 12)
b) Benefits in Case of Death of an Active Regular Force Member
Status at Death
Qualifying Service in the
Canadian Forces (Note 7) Benefit
Leaving no eligible spouse
or children under 25 (Notes 18 and 19)
Less than 2 years Return of contributions
2 years or more
Five times the annual amount of
retirement pension to which the
member would have been entitled
at the date of death
Leaving eligible spouse
and/or
children under 25
Less than 2 years
Return of contributions or
an amount equal to one month’s
earnings of the deceased member
for each year of credited
pensionable service,
whichever is the greater
2 years or more Annual allowance (Note 20)

APPENDIX 1 41
ACTUARIAL REPORT
Pension Plans for the CANADIAN FORCES as at 31 March 2016
c) Benefits in Case of Death of a Regular Force Pensioner
Status at Death Benefit
Leaving no eligible spouse or children under 25 Minimum death benefit (Note 21)
Leaving eligible spouse and/or children under 25 Annual allowance (Note 20)
2. Regular Force Member Benefit Entitlement on the Basis of Pensionable Service
Member’s Type of Termination Benefit
With two or more years of pensionable service; and
Involuntary termination due to a work force reduction program and
- With 20 years of service or more Immediate annuity (Note 12)
- Age 50 or over and service 10 years of service or more
Leaving prior to age 50, except for death or disability
Deferred annuity (Note 13)
or
Transfer Value (Note 14)
Leaving at age 50 or over, except for death or disability, and
- Age 60 or over, or age 55 or over and service 30 years or more Immediate annuity (Note 12)
- Otherwise Deferred annuity or
annual allowance (Note 20)
3. Reserve Force Member Benefit Entitlement on the basis of “Pensionable” Service
Member’s Type of Termination Benefit
With less than two years of pensionable service Return of contributions (Note11
14)
With two or more years of pensionable service; and
Involuntary termination due to a work force reduction program and
- With 20 years of service or more Immediate annuity (Note 12)
- Age 50 or over and 10 years of service or more
Leaving prior to age 50, except for death, and
- Because of disability Immediate annuity (Note 12)
- Otherwise Deferred annuity (Note 13)
or Transfer Value (Note 14)
Leaving at age 50 or over, except for death or disability, and
- Age 60 or over, or age 55 or over and service 30 years or more Immediate annuity (Note 12)
- Otherwise Deferred annuity (Note 13)
or annual allowance (Note 20)
4. Reserve Force Member Benefit Entitlement on the basis of “Qualifying” Service
Member’s Type of Termination Benefit
Retirement on completion of
25 years or more of Canadian Forces service (Note 7) Immediate annuity (Note 12)
APPENDIX 1 42
ACTUARIAL REPORT
Pension Plans for the CANADIAN FORCES as at 31 March 2016
D. Explanatory Notes
1. Pensionable Earnings
For the Regular Force Plan, pensionable earnings means the salary at the annual rate
prescribed by the regulations made pursuant to the National Defence Act together with
the allowances for medical and dental care costs. Pensionable payroll means the
aggregate pensionable earnings of all members with less than 35 years of pensionable
service.
For the Reserve Force Plan, earnings means pay earned by a member of the Canadian
Forces at the rates prescribed by the regulations made pursuant to the National Defence
Act together with premiums in lieu of leave. Pensionable earnings means the earnings of
a member with less than 35 years of pensionable service, who has completed the
required two-year waiting period. Pensionable payroll means the aggregate pensionable
earnings of all members.
2. Wage measure for Reserve Force Plan
Wage measure is
(a) for a calendar year prior to 2018 , the corresponding rate of pay shown in Table 60
of this report; and
(b) for a calendar year after 2017 , the greater of
a. the standard basic rate of pay for a period of duty or training of six hours or
more, before any retroactive adjustment, that was prescribed or established
under the National Defence Act, to be paid on October 1 of the preceding year
to a member at the rank of Corporal (class A), and
b. the wage measure of the previous year.
3. Updated Pensionable Earnings for Reserve Force Plan
The updated pensionable earnings for a calendar year are the Reserve Force member’s
pensionable earnings for that year, subject to the Income Tax Act limits, times A/B,
rounded to the nearest fourth decimal place, where
A = the average of the wage measures for five years consisting of the year the
member most recently ceased to be a member and the most recent years during
which the member was a member and, if necessary, the years preceding all of
those years, and
B = the wage measure for that calendar year.
4. Bridge Benefit Earnings for Reserve Force Plan
Bridge benefit earnings for a calendar year are the lesser of
(a) the member’s pensionable earnings for that year, and
(b) the Year’s Maximum Pensionable Earnings (YMPE) for that year.
5. Updated Bridge Benefit Earnings for Reserve Force Plan
Updated bridge benefit earnings for a calendar year are the lesser of

APPENDIX 1 43
ACTUARIAL REPORT
Pension Plans for the CANADIAN FORCES as at 31 March 2016
(a) the member’s updated pensionable earnings for that year, and
(b) the average of the YMPE for five years consisting of the year the member most
recently ceased to be a member and the preceding four years.
6. Indexation for Regular Force Plan and Reserve Force Plan
a) Level of Indexation Adjustments
All immediate and deferred annuities (pensions and allowances) are adjusted every
January to the extent warranted by the increase, as at 30 September of the previous
year, in the 12-month average Consumer Price Index. If the indicated adjustment is
negative, annuities are not decreased for that year; however, the next following
adjustment is diminished accordingly.
b) First Indexation Adjustment
Indexation adjustments accrue from the end of the month in which employment or
participation in the plan terminates. The first annual adjustment following
termination of employment is prorated accordingly.
c) Commencement of Indexation Payments
Payment of the indexation portion of a retirement, disability or survivor pension
normally commences when the pension is put into pay. However, regarding a
retirement pension, the pensioner must be at least 55 years old and the sum of age
and pensionable service at least 85; or the retirement pensioner must be at least 60
years old.
7. Qualifying Service in the Canadian Forces (Regular Force Plan and Reserve Force
Plan)
Qualifying service in the Canadian Forces means service for which a Regular or Reserve
Force member is paid, and includes:
days of service in the Regular Force for which pay was authorized and periods of
authorized leave of absence;
- excluding any service for which a member was paid a return of contributions or
lump sum payment under the CFSA that he or she did not elect to repay on
subsequent enrolment;
days of service in the Reserve Force for which pay was authorized and authorized
absences for maternity and parental purposes:
days of training or duty of less than 6 hours = half-day
days of Class “A” service = 1.4 days
periods before 1 April 1999 (when duration of period is verifiable but not the
number of days) = quarter time
during maternity and parental leaves, days of Canadian Forces service are based
on service in previous 12 months
APPENDIX 1 44
ACTUARIAL REPORT
Pension Plans for the CANADIAN FORCES as at 31 March 2016
8. Pensionable Service
Pensionable service includes any period of service in the Regular Force or Reserve
Force in respect of which an active member either (1) made contributions that remain in
the Superannuation Account, CFPF or the RFPF, or (2) elected to contribute. It also
includes any period of prior service for which an active member was paid a return of
contributions or lump sum payment under the CFSA that he or she did elect to repay on
subsequent enrolment. It also includes prior service in the Public Service of Canada, the
Royal Canadian Mounted Police and the militaries of the Commonwealth of Nations
that the member elected to count as pensionable service.
9. Short Engagement for Regular Force Plan
Short engagement means a continuous period of service as a commissioned officer in the
regular force for a period not exceeding nine years.
10. Intermediate Engagement for Regular Force Plan
Intermediate engagement means, under the old terms of service, 20 years of continuous
service as a member of the regular force. Under the new terms of service, an
intermediate engagement is 25 years of continuous service as a member of the regular
force.
11. Return of Contributions
Return of contributions means the payment of an amount equal to the accumulated
current and prior service contributions paid or transferred by the member into the
Superannuation Account, the CFPF or the RFPF together with interest. Interest is
calculated at the quarterly Pension Fund rate each quarter on the accumulated
contributions with interest as at the end of the previous quarter.
12. Immediate Annuity
For Regular Force Plan, immediate annuity means an unreduced pension that becomes
payable immediately upon a pensionable retirement or a pensionable disability. The
annual amount is equal to 2% of the highest average annual pensionable earnings
(Note 1) of the active member over any period of five1 consecutive2 years, multiplied by
the number of years of pensionable service not exceeding 35. However, if such highest
five-year earnings average exceeds the yearly maximum prescribed for the calendar year
in which service is terminated, then the annual amount is reduced by 2% of such excess,
multiplied by the number of years of pensionable service after April 1995.
When a regular force pensioner attains age 65 or becomes entitled to a disability pension
from the CPP, the annual amount of pension is reduced by a percentage of the indexed
1 If the number of years of pensionable service is less than five, then the average is over the entire period of pensionable
service. 2 Any five-year period of pensionable service selected by or on behalf of the contributor, or during any period so selected
consisting of consecutive periods of pensionable service totalling five years.
APPENDIX 1 45
ACTUARIAL REPORT
Pension Plans for the CANADIAN FORCES as at 31 March 2016
CPP annual pensionable earnings1 (or, if lesser, the indexed five-year pensionable
earnings average on which the immediate annuity is based), multiplied by the years of
CPP pensionable service2. The applicable percentage is 0.625%.
For Reserve Force Plan, immediate annuity means an unreduced pension that becomes
payable immediately upon a pensionable retirement or a pensionable disability. The
annual amount is equal to 1.5% of the greater of the member’s total pensionable
earnings and total updated pensionable earnings over the most recent 35 years of
pensionable service, plus an additional bridge benefit equal to 0.5% of the greater of the
member’s total bridge benefit earnings and total updated bridge benefit earnings.
For both plans, annuities are payable in equal monthly instalments in arrears until the
end of the month in which the pensioner dies or when the disability pensioner recovers
from disability. Upon the death of the pensioner, either a survivor allowance (Note 20)
or a minimum death benefit (Note 21) may be payable.
13. Deferred Annuity
Deferred annuity means an annuity that becomes payable to a retirement pensioner when
he or she reaches age 60. The annual payment is determined as for an immediate annuity
(see Note 12 above) but is adjusted to reflect the indexation (see Note 6) from the date
of termination to the commencement of annuity payments.
The deferred annuity becomes an immediate annuity during any period of disability
beginning before age 60. If the disability ceases before age 60, the immediate annuity
reverts to the original deferred annuity.
14. Transfer Value
Active members who, at their date of termination of pensionable service, are under age
50 and who are eligible for a deferred annuity may elect to transfer the commuted value
of their benefits, determined in accordance with the regulations, to
a locked-in Registered Retirement Savings Plan of the prescribed kind; or
another pension plan registered under the Income Tax Act; or
a financial institution for the purchase of a locked-in immediate or deferred annuity
of the prescribed kind.
15. Annuity Payable upon Retirement During an Indefinite Period of Service for
Regular Force Plan
For a regular force active member who has not reached retirement age and who, while
on an indefinite period of service after completing an intermediate engagement, ceases
to be a member of the regular force for any reason other than disability, or to promote
economy or efficiency, the Canadian Forces Superannuation Regulations (CFSR)
prescribe an annuity that is equal to the greater of
1 Indexed CPP annual pensionable earnings means the average of the YMPE, as defined in the CPP, over the last five years of
pensionable service, increased by indexation proportionate to that accrued in respect of the immediate annuity. 2 Years of CPP pensionable service, means the number of years of pensionable service after 1965 or after attaining age 18,
whichever is later, but not exceeding 35.

APPENDIX 1 46
ACTUARIAL REPORT
Pension Plans for the CANADIAN FORCES as at 31 March 2016
(a) an immediate annuity based on the pensionable service to the date of completion
of the intermediate engagement only and the highest consecutive five-year
earnings average at date of retirement, and
(b) an immediate annuity based upon the total pensionable service to the date of
retirement and the highest consecutive five-year employment earnings average at
that date reduced by 5% for each full year by which
in the case of an officer, the age at the date of retirement is less than the
retirement age applicable to the member’s rank; or
in the case of a member other than an officer, the age at the date of retirement
is less than the retirement age applicable to the member’s rank or the period of
service in the Regular Force is less than 25 years, whichever is the lesser.
16. Reduced Immediate Annuity for Regular Force Members
Reduced immediate annuity means an immediate annuity for which the annual amount
of the annuity as determined in Note 12 is reduced as stated below.
With the consent of the Minister of National Defence, a regular force active member
who is required to terminate to promote economy or efficiency and has between 10 and
20 years of service in the regular force may choose an immediate annuity reduced, until
attainment of age 65 but not thereafter, by 5% for each full year not exceeding six by
which
(a) the period of service in the regular force is less than 20 years; or
(b) the age of the active member at the time of retirement is less than the retirement
age applicable to the member’s rank,
whichever is the lesser.
A regular force active member who, not having reached retirement age, ceases to be a
member of the regular force for any reason other than disability, or to promote economy
or efficiency, or while on an indefinite period of service is entitled
(a) as an officer having served in the regular force for 20 years or more, to an
immediate annuity reduced by 5% for each full year by which his or her age at the
time of retirement is less than the retirement age applicable to his or her rank, or
(b) as other than an officer having served in the regular force for 20 years or more but
less than 25 years, to an immediate annuity reduced by 5% for each full year by
which
the period of service in the regular force is less than 25 years, or
the age at the time of retirement is less than the retirement age applicable to
the member’s rank,
whichever is the lesser.
When a Regular Force Plan pensioner in receipt of an immediate reduced annuity
becomes disabled before reaching age 60, the pensioner ceases to be entitled to that
immediate reduced annuity and becomes entitled to an immediate annuity adjusted in

APPENDIX 1 47
ACTUARIAL REPORT
Pension Plans for the CANADIAN FORCES as at 31 March 2016
accordance with regulations to take into account the amount of any immediate reduced
annuity which the pensioner may have received prior to becoming disabled.
17. Annual Allowance for Regular Force and Reserve Force Plan Members
Annual allowance for members means an annuity payable immediately on retirement or
upon attaining age 50, if later. The amount of the allowance is equal to the amount of
the deferred annuity to which the member would otherwise be entitled, reduced by 5%
multiplied by the difference between 60 and the age when the allowance becomes
payable.
However, if the member is at least 50 years old at termination, and has at least 25 years
of pensionable service, then the difference is reduced (subject to the above as a
maximum) to the greater of
• 55 minus the age, and
• 30 minus the number of years of pensionable service.
When a member in receipt of an annual allowance becomes disabled before reaching age
60, the annual allowance becomes an immediate annuity adjusted in accordance with
regulations to take into account the amount of any annual allowance received prior to
becoming disabled.
18. Eligible Surviving Spouse or Common-Law Partner
Eligible surviving spouse means the surviving spouse or common-law partner of an
active member or pensioner except where
(a) the active member or pensioner died within one year of marriage, unless the
Minister of National Defence is satisfied that the member’s health at the time of
the marriage justified an expectation of surviving for at least one year; or
(b) the pensioner married or began a common-law relationship at age 60 or over,
unless after such marriage or partnership the pensioner either
became a plan contributor again, or
made an optional survivor benefit election within 12 months following the
marriage to accept a reduced pension so that the new spouse would be eligible
for a survivor pension. This reduction is reversed if and when the new spouse
predeceases the pensioner or the spousal union is terminated for reason other
than death; or
(c) the pensioner is a female who retired before 20 December 1975 and did not make
an optional survivor benefit election within the one-year period ending
6 May 1995.
19. Eligible Surviving Children
Eligible surviving children are all surviving children of an active member or pensioner
who are either under age 18, or age 18 or over but under 25 and in full-time attendance
at a school or university.
APPENDIX 1 48
ACTUARIAL REPORT
Pension Plans for the CANADIAN FORCES as at 31 March 2016
20. Annual Allowance for Eligible Survivors
For Regular Force Plan, annual allowance means, for the eligible surviving spouse or
common-law partner and children of an active member or pensioner, an annuity that
becomes payable immediately upon the death of that individual. The amount of the
allowance, called a “basic allowance”, is equal to 1% of the highest average of annual
pensionable earnings of the active member over five consecutive years, multiplied by the
number of years of pensionable service not exceeding 35.
The annual allowance for a spouse or a common-law partner is equal to the basic
allowance except in the case where the spouse became eligible to a survivor pension as a
result of an optional survivor benefit election, in which case it is equal to the percentage
of the basic allowance specified by the pensioner making the election.
The annual allowance for an eligible surviving child is equal to 20% of the basic
allowance, subject to a reduction if there are more than four eligible surviving children
in the same family. The annuity otherwise payable to an eligible surviving child is
doubled if the child is an orphan.
Annual allowances are not coordinated with the CPP and are payable in equal monthly
instalments in arrears until the end of the month in which the survivor dies or otherwise
loses eligibility. If applicable, a residual benefit (Note 21) is payable to the estate upon
the death of the last survivor.
For Reserve Force Plan, annual allowance means, for the eligible surviving spouse or
common-law partner and children of a member or pensioner, an annuity that becomes
payable immediately upon the death of that individual. The amount of the annual
allowance, called a basic allowance, is equal to
(a) 1% of the greater of the pensioner’s total pensionable earnings and total updated
pensionable earnings; or,
(b) if the member was in receipt of an annual allowance at the time of death, an
amount equal to A × B / C where:
A = the amount calculated under paragraph (a),
B = the amount of the annual allowance, and
C = the amount of the deferred annuity to which the pensioner was entitled.
(c) Each eligible surviving child of a member is entitled to receive,
if the member died leaving an eligible surviving spouse, an allowance equal
to 1/4 of the basic allowance or, if there are more than two children, to an
annual allowance equal to 1/2 of the basic allowance divided by the number
of children; or
if the member died without leaving an eligible surviving spouse, and
there are fewer than four children, an annual allowance equal to 1/2 of
the basic allowance, or
there are more than three children, an annual allowance equal to 1.5 times
the basic allowance divided by the number of children.
The proportion of the basic allowance that constitutes the annual allowance
shall be revised when the number of children who are entitled changes

APPENDIX 1 49
ACTUARIAL REPORT
Pension Plans for the CANADIAN FORCES as at 31 March 2016
.
21. Minimum Death Benefit
If upon the death of an active member there is no person to whom an allowance
provided under the terms of the CFSA may be paid, or if the persons to whom such
allowances may be paid die or cease to be entitled thereto and no other amount may be
paid to them, then it is paid to the estate of the active member or to the named
beneficiary under CFSA Part II, if any exists
(a) for an active member who was not a member of the Regular Force or the Reserve
Force on or after 20 December 1975, any amount by which the amount of return
of contributions exceeds the aggregate of all amounts paid to those persons and to
the active member ;
(b) for an active member who was a member of the Regular Force or the Reserve
Force on or after 20 December 1975, an amount equal to the greater of a return of
contributions and an amount equal to five times the basic annuity in (including the
bridge benefit for the Reserve Force member) to which the active member was or
would have been entitled at the time of his or her death exceed the aggregate of all
amounts paid to those persons and to the contributor.
22. Division of Pension in Case of Spousal Union Breakdown
In accordance with the Pension Benefits Division Act (PBDA), upon the breakdown of a
spousal union (including common-law partnership), a lump sum can be transferred upon
application supported by a court order or by mutual consent agreement, from the
amounts in the Superannuation Account, the CFPF and the RFPF to the credit of an
active member or pensioner. As at the transfer date, the maximum transferable amount is
half the value of the retirement pension accrued by the active or former member during
the period of cohabitation. If the member’s benefits are not vested, the maximum
transferable amount corresponds to half the member’s contributions made during the
period subject to division, accumulated with interest at the rate applicable on a refund of
contributions. The benefits of the active member or pensioner are then reduced
accordingly. As of 31 March 2016, the Pension Benefits Division Regulations does not
provide the necessary directions to account for the different benefit provisions under the
Reserve Force Plan. Hence, the pension accrued for a member of the Reserve Force Plan
cannot be divided upon a breakdown of a spousal union at this time.
23. Rollovers
Certain members who cease to participate in the Reserve Force Plan subsequently
become participants in the Regular Force Plan. As described in section 10.2 of CFSR,
any period of pensionable service which is to a member’s credit under the Reserve
Force Plan on the day before the day on which that member becomes a contributor to
the Regular Force Plan is rolled over to the Regular Force Plan. Whenever a rollover
occurs, the actuarial liability associated with the member under the Reserve Force Plan
is immediately extinguished and a new actuarial liability is immediately established
under the Regular Force Plan.
There are two main scenarios in which a rollover of service from the Reserve Force
Plan to the Regular Force Plan would arise. In the first scenario a member of Reserve
Force makes a successful application to join the Regular Force. The member’s transfer

APPENDIX 1 50
ACTUARIAL REPORT
Pension Plans for the CANADIAN FORCES as at 31 March 2016
from the Reserve Force to the Regular Force triggers the rollover of service. In the
second scenario the member begins to contribute to the Regular Force Plan by virtue of
meeting the criteria described in section 8.1(1) (d) of the CFSR. This occurs upon the
completion of a minimum of 55 months of Canadian Forces service within a period of
60 consecutive months. The member remains in the Reserve Force but is considered to
be a member of the Regular Force for the purposes of Part I of the CFSA and the CFSR.
Following a rollover the actuarial liability is removed from Reserve Force Plan and
created under the Regular Force Plan and assets are transferred from the RFPF to the
CFPF. For members who are not vested when the rollover occurs, DND calculates the
amount to transfer between the pension funds in the same manner as a return of
contributions. For members who are vested when the rollover occurs, DND calculates
the amount to transfer between the pension plans as the commuted value of the accrued
pension at age 60.
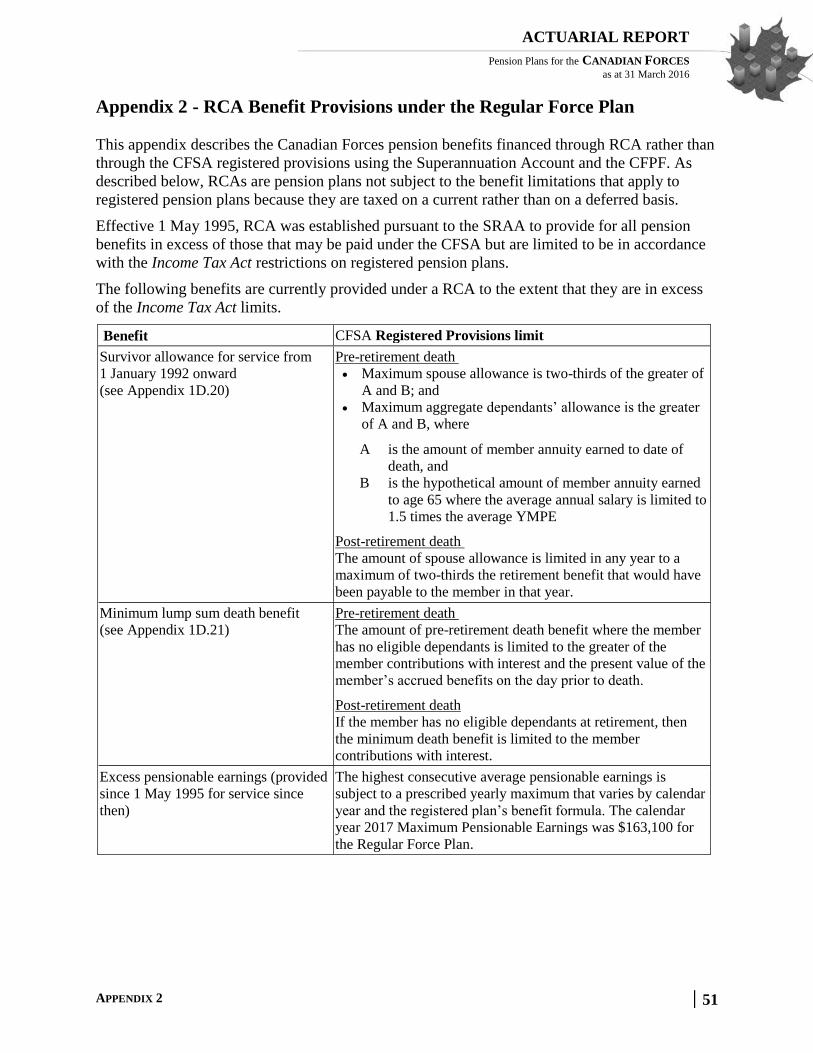
APPENDIX 2 51
ACTUARIAL REPORT
Pension Plans for the CANADIAN FORCES as at 31 March 2016
Appendix 2 - RCA Benefit Provisions under the Regular Force Plan
This appendix describes the Canadian Forces pension benefits financed through RCA rather than
through the CFSA registered provisions using the Superannuation Account and the CFPF. As
described below, RCAs are pension plans not subject to the benefit limitations that apply to
registered pension plans because they are taxed on a current rather than on a deferred basis.
Effective 1 May 1995, RCA was established pursuant to the SRAA to provide for all pension
benefits in excess of those that may be paid under the CFSA but are limited to be in accordance
with the Income Tax Act restrictions on registered pension plans.
The following benefits are currently provided under a RCA to the extent that they are in excess
of the Income Tax Act limits.
Benefit CFSA Registered Provisions limit
Survivor allowance for service from
1 January 1992 onward
(see Appendix 1D.20)
Pre-retirement death
Maximum spouse allowance is two-thirds of the greater of
A and B; and
Maximum aggregate dependants’ allowance is the greater
of A and B, where
A is the amount of member annuity earned to date of
death, and
B is the hypothetical amount of member annuity earned
to age 65 where the average annual salary is limited to
1.5 times the average YMPE
Post-retirement death
The amount of spouse allowance is limited in any year to a
maximum of two-thirds the retirement benefit that would have
been payable to the member in that year.
Minimum lump sum death benefit
(see Appendix 1D.21)
Pre-retirement death
The amount of pre-retirement death benefit where the member
has no eligible dependants is limited to the greater of the
member contributions with interest and the present value of the
member’s accrued benefits on the day prior to death.
Post-retirement death
If the member has no eligible dependants at retirement, then
the minimum death benefit is limited to the member
contributions with interest.
Excess pensionable earnings (provided
since 1 May 1995 for service since
then)
The highest consecutive average pensionable earnings is
subject to a prescribed yearly maximum that varies by calendar
year and the registered plan’s benefit formula. The calendar
year 2017 Maximum Pensionable Earnings was $163,100 for
the Regular Force Plan.
APPENDIX 3 52
ACTUARIAL REPORT
Pension Plans for the CANADIAN FORCES as at 31 March 2016
Appendix 3 - Assets, Accounts and Rates of Return
A. Assets and Accounts Available for Benefits
The government has a statutory obligation to fulfill the pension promise enacted by
legislation to members of the Canadian Forces. Since 1 April 2000, the government has
earmarked invested assets to meet the cost of pension benefits under the CFPF. For the
RFPF, the government has earmarked invested assets since its inception on 1 March 2007.
With respect to the unfunded portion of the Regular Force Plan, accounts available for
benefits were established to track the government’s pension benefit obligations such as the
Superannuation Account, for service prior to 1 April 2000, and the RCA Account for
benefits in excess of those that can be provided under the Income Tax Act limits for
registered pension plans.
1. Canadian Forces Superannuation Account
Regular Force Plan member contributions, government costs and benefits earned up to
31 March 2000 are tracked entirely through the CFSA Superannuation Account, which
forms part of the Accounts of Canada.
The Superannuation Account was credited with all Regular Force member contributions
and government costs prior to 1 April 2000, as well as with prior service contributions
and costs for elections made prior to 1 April 2000 for periods before 1 April 2000 but
credited after that date. It is charged with both the benefit payments made in respect of
service earned under the Superannuation Account and the allocated portion of the plan
administrative expenses.
The Superannuation Account is credited with interest as though net cash flows were
invested quarterly in 20-year Government of Canada bonds issued at prescribed interest
rates and held to maturity. No formal debt instrument is issued to the Superannuation
Account by the government in recognition of the amounts therein. Interest is credited
every three months on the basis of the average yield for the same period on the
combined Superannuation Accounts of the Public Service, Canadian Forces and RCMP
pension plans.

APPENDIX 3 53
ACTUARIAL REPORT
Pension Plans for the CANADIAN FORCES as at 31 March 2016
Table 23 Reconciliation of Balances in Superannuation Account
($ millions)
Plan Year 2014 2015 2016 2014-2016
Public Accounts opening balance 46,357 46,297 46,119 46,357
INCOME
Net Interest earnings 2,427 2,308 2,140 6,875
Employer contributions 3 3 3 9
Member contributions 3 3 3 9
Transfers received 1 - - 1
Actuarial liability adjustments - - - -
Subtotal 2,434 2,314 2,146 6,894
EXPENDITURES
Annuities 2,418 2,425 2,505 7,348
Pension divisions 41 33 23 97
Return of contributions - - - -
Pension transfer value payments 2 2 2 6
Transfers to other pension plans 1 - - 1
Minimum benefits - 1 - 1
Administrative expenses 32 31 38 101
Subtotal 2,494 2,492 2,568 7,554
Public Accounts closing balance 46,297 46,119 45,697 45,697
Since the last valuation, the Superannuation Account balance has decreased by
$660 million (a 1.4% decrease) to reach $45,697 million as at 31 March 2016.
2. Canadian Forces Pension Fund (CFPF)
Since 1 April 2000, Regular Force contributions (except for prior service elections made
prior to 1 April 2000) have been credited to the CFPF. The CFPF is invested in the
financial markets with a view to achieving maximum rates of return without undue risk.
The CFPF has been credited with all Regular Force contributions since 1 April 2000, as
well as with prior service contributions in respect of elections made since that date. The
Pension Fund is also credited with the net investment returns generated by the capital
assets managed by the Public Sector Pension Investment Board (PSPIB). It is debited
with both the benefit payments made in respect of service earned and prior service
elections made since 1 April 2000 and the allocated portion of the plan administrative
expenses.
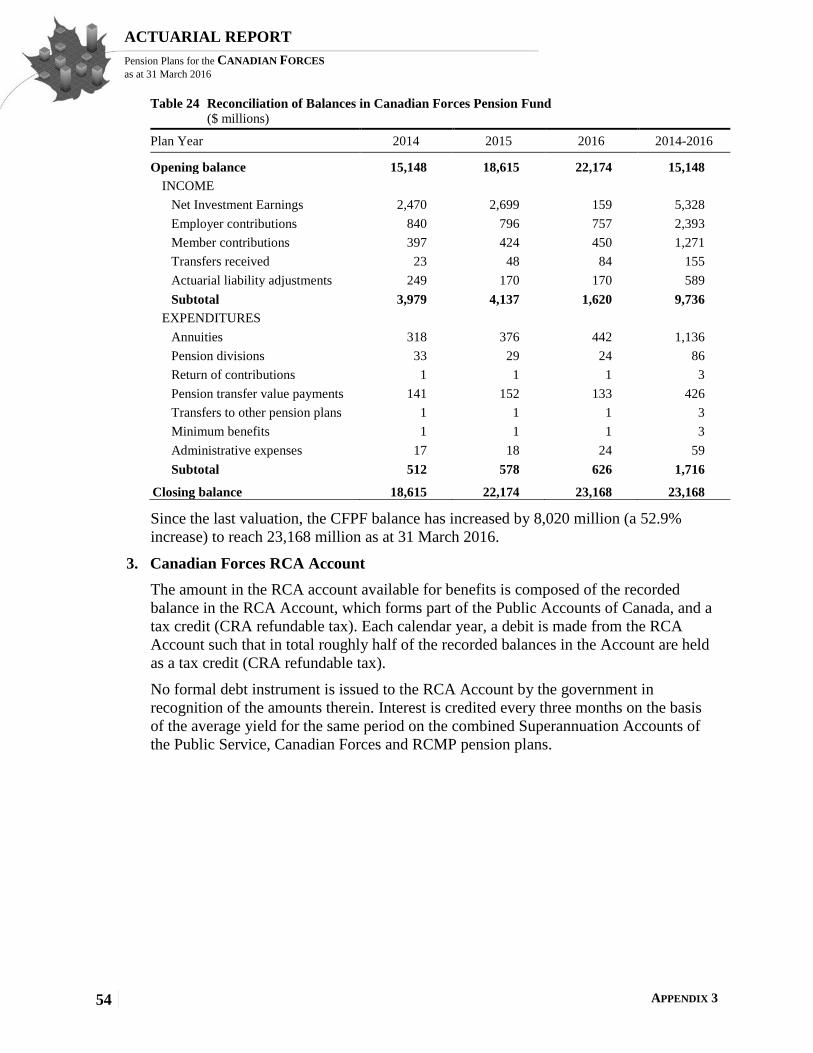
APPENDIX 3 54
ACTUARIAL REPORT
Pension Plans for the CANADIAN FORCES as at 31 March 2016
Table 24 Reconciliation of Balances in Canadian Forces Pension Fund
($ millions)
Plan Year 2014 2015 2016 2014-2016
Opening balance 15,148 18,615 22,174 15,148
INCOME
Net Investment Earnings 2,470 2,699 159 5,328
Employer contributions 840 796 757 2,393
Member contributions 397 424 450 1,271
Transfers received 23 48 84 155
Actuarial liability adjustments 249 170 170 589
Subtotal 3,979 4,137 1,620 9,736
EXPENDITURES
Annuities 318 376 442 1,136
Pension divisions 33 29 24 86
Return of contributions 1 1 1 3
Pension transfer value payments 141 152 133 426
Transfers to other pension plans 1 1 1 3
Minimum benefits 1 1 1 3
Administrative expenses 17 18 24 59
Subtotal 512 578 626 1,716
Closing balance 18,615 22,174 23,168 23,168
Since the last valuation, the CFPF balance has increased by 8,020 million (a 52.9%
increase) to reach 23,168 million as at 31 March 2016.
3. Canadian Forces RCA Account
The amount in the RCA account available for benefits is composed of the recorded
balance in the RCA Account, which forms part of the Public Accounts of Canada, and a
tax credit (CRA refundable tax). Each calendar year, a debit is made from the RCA
Account such that in total roughly half of the recorded balances in the Account are held
as a tax credit (CRA refundable tax).
No formal debt instrument is issued to the RCA Account by the government in
recognition of the amounts therein. Interest is credited every three months on the basis
of the average yield for the same period on the combined Superannuation Accounts of
the Public Service, Canadian Forces and RCMP pension plans.

APPENDIX 3 55
ACTUARIAL REPORT
Pension Plans for the CANADIAN FORCES as at 31 March 2016
Table 25 Reconciliation of Balances in RCA Account
($ millions)
Plan Year 2014 2015 2016 2014-2016
Public Accounts opening balance 330.0 351.2 373.5 330.0
INCOME
Net Interest earnings 18.1 18.3 18.0 54.4
Employer contributions 28.5 28.8 26.5 83.8
Member contributions 2.4 2.5 2.4 7.3
Subtotal 49.0 49.6 46.9 145.5
EXPENDITURES
Annuities 4.7 5.3 6.2 16.2
Pension divisions 0.2 0.0 0.2 0.4
Pension transfer value payments 0.9 1.5 1.3 3.7
Minimum benefits 0.0 0.1 0.0 0.1
Amount transfer to CRA 22.0 20.4 20.7 63.1
Subtotal 27.8 27.3 28.4 83.5
Public Accounts closing balance 351.2 373.5 392.0 392.0
Refundable tax 341.1 361.5 382.2 382.2
Since the last valuation, the RCA Account balance has grown by $62.0 million (a 18.8%
increase) to reach 392.0 million as at 31 March 2016, and the refundable tax, totalling
319.1 $ million as at 31 March 2013, has increased by $63.1 million (a 19.8% increase)
to reach 382.2 $ million as at 31 March 2016.
4. Reserve Force Pension Fund (RFPF)
Since 1 March 2007, Reserve Force member contributions (for current and prior service)
have been credited to the RFPF. The Fund is invested in the financial markets with a
view to achieving maximum rates of return without undue risk.
The RFPF has been credited with all contributions as well as with the net investment
returns generated by the capital assets managed by the PSPIB. It is debited with benefit
payments and plan administrative expenses.

APPENDIX 3 56
ACTUARIAL REPORT
Pension Plans for the CANADIAN FORCES as at 31 March 2016
Table 26 Reconciliation of Balances in Reserve Force Pension Fund
($ millions)
Plan Year 2014 2015 2016 2014-2016
Opening Balance 414.9 466.9 549.8 414.9
INCOME
Net Investment Earnings 63.7 67.9 3.8 135.5
Employer contributions 12.9 65.2 41.7 119.8
Member contributions 27.3 28.3 27.8 83.3
Actuarial liability adjustments - 1.9 1.9 3.8
Subtotal 103.9 163.3 75.2 342.4
EXPENDITURES
Annuities 4.5 5.2 6.1 15.8
Return of contributions 0.1 0.1 - 0.2
Pension transfer value payments 11.8 12.9 13.5 38.2
Transfers to other pension plans 22.5 48.4 83.9 154.8
Minimum benefits - 0.1 0.1 0.2
Administrative expenses 13.0 13.7 16.5 43.2
Subtotal 51.9 80.4 120.1 252.4
Closing Balance 466.9 549.8 504.9 504.9
Since the last valuation, the Fund balance has increased by $90 million (a 21.7%
increase) to reach $505 million as at 31 March 2016.
B. Interest Earnings/ Rates of Return
The interest earnings in respect of the Superannuation Account were calculated using the
entries in Table 23 which are based on book values since the notional bonds are deemed to
be held to maturity. The interest earnings were computed using the dollar-weighted
approach and assume that cash flows occur in the middle of the plan year (except for
actuarial liability adjustments, which occur on 31 March). The CFPF and the RFPF rates of
return are those from the PSPIB 2017 Annual Report.
Plan Year Superannuation Account Canadian Forces Pension Fund Reserve Force Pension Fund
2014 5.4% 15.9% 15.9%
2015 5.1% 14.2% 14.2%
2016 4.8% 0.7% 0.7%
C. Sources of Asset and Accounts Available for Benefits Data
The Superannuation Account, the RCA Account, the CFPF and the RFPF entries shown in
Section A above were taken from the Public Accounts of Canada and the financial
statements of the Public Sector Pension Investment Board.

APPENDIX 4 57
ACTUARIAL REPORT
Pension Plans for the CANADIAN FORCES as at 31 March 2016
Appendix 4 - Membership Data
A. Sources of Membership Data
The valuation input data required in respect of members, former members (pensioners) and
survivors is provided by the Department of National Defence (DND). An additional set of
valuation data on Regular Force and Reserve Force pensioners is extracted from master
computer files maintained by Public Services and Procurement Canada (PSPC) which
provides OSFI with the ability to verify the information provided by DND.
The main valuation data file supplied by DND contains the historical status information on
all members up to 31 March 2016. The valuation data file on pensioners provided by PSPC
covers the period of 1 April 2013 to 31 March 2016.
B. Validation of Membership Data
1. Status-Related Tests
The following status tests were performed on the main valuation data file:
a consistency check that a status could be established for each record of a member.
The status of a member may change over time but at a given point in time it can be
only one of the following: contributor, outstanding termination, pensioner, deceased
leaving an eligible survivor;
a consistency check of the changes in status of a member during the intervaluation
period; e.g.
- if a contributor record indicated that the member retired, then a pensioner record
should exist; and
- if a contributor or pensioner record indicated that the member died leaving an
eligible survivor, then a corresponding survivor record should exist;
a reconciliation between the status of members as at 31 March 2016 from the current
valuation data and the status of the members as at 31 March 2013 from the previous
valuation data.
2. Benefit-Related Tests
Consistency tests were performed to ensure that all information required to value the
member benefits based on individual statuses as at 31 March 2016 was included, by
verifying that
a) For Regular Force Active Members
the pensionable and qualifying service was reasonable in relation to the attained
age;
the salary was included and, if not, a salary was calculated by updating a salary
rate from a previous year with an average earnings increase or, failing that, the
average salary rate for that rank, sex, age and service was used.
b) For Reserve force Active Members
the pensionable and qualifying service was reasonable in relation to the attained
age;

APPENDIX 4 58
ACTUARIAL REPORT
Pension Plans for the CANADIAN FORCES as at 31 March 2016
the earnings were included and, if not, imputing earnings by updating earnings
from a previous year with an average earnings increase or failing that, using the
average earnings for that sex.
c) For Pensioners and Survivors in Receipt of an Annuity
the amount of the annuity, including indexation, was included; and
the benefits were indexed up to 1 January 2016.
d) For Adjustments to Status and Benefit Data
appropriate adjustments were made to the basic data, after consulting with the
data providers, based on the omissions and discrepancies identified by the tests
described herein and other additional tests.
C. Membership Data
The following tables show the detailed reconciliation of membership data since the last
valuation. Detailed membership data are shown in Appendix 13.
Table 27 Reconciliation of Regular Force Contributors
Male Female
Officer Other Rank Total Officer Other Rank Total Total
As at 31 March 2013 14,245 46,905 61,150 3,014 7,783 10,797 71,947
Data corrections 53 (15) 38 12 (14) (2) 36
New Contributors
New entrants 1,651 7,525 9,176 337 1,248 1,585 10,761
Rehired /cash-out 92 800 892 20 111 131 1,023
Rehired/pensioners Part I 203 556 759 44 95 139 898
Rehired/pensioners Part I.1 4 38 42 1 5 6 48
Subtotal 1,950 8,919 10,869 402 1,459 1,861 12,730
Changes of
Activity Status 35 78 113 10 15 25 138
Officers/Other Ranks 287 (287) - 84 (84) - -
Service Type 187 1,502 1,689 73 336 409 2,098
Subtotal 509 1,293 1,802 167 267 434 2,236
Lump sum terminations
Return of contribution (254) (1,230) (1,484) (50) (199) (249) (1,733)
Transfer value (384) (3,186) (3,570) (91) (405) (496) (4,066)
Subtotal (638) (4,416) (5,054) (141) (604) (745) (5,799)
Pensionable terminations
Disability (3A) - (5) (5) - (2) (2) (7)
Disability (3B) (463) (3,017) (3,480) (120) (727) (847) (4,327)
Death (21) (93) (114) (3) (13) (16) (130)
Retirement
Deferred (325) (1,550) (1,875) (115) (326) (441) (2,316)
Immediate (1,290) (2,037) (3,327) (135) (141) (276) (3,603)
Subtotal (2,099) (6,702) (8,801) (373) (1,209) (1,582) (10,383)
As at 31 March 2016 14,020 45,984 60,004 3,081 7,682 10,763 70,767

APPENDIX 4 59
ACTUARIAL REPORT
Pension Plans for the CANADIAN FORCES as at 31 March 2016
Table 28 Reconciliation of Reserve Force Contributors
Male Female
Officer Other Rank Total Officer Other Rank Total Total
As at 31 March 2013 4,620 11,732 16,352 2,201 2,274 4,475 20,827
Data corrections 28 (629) (601) (36) (124) (160) (761)
New Participants 952 3,793 4,745 541 659 1,200 5,945
Rehired/pensioners Part I.1 183 289 472 117 53 170 642
Lumpsum terminations
Return of contribution (123) (572) (695) (43) (102) (145) (840)
Transfer value (138) (619) (757) (82) (132) (214) (971)
Transfer to Res. Part I (104) (332) (436) (58) (160) (218) (654)
Transfer to Reg. Force (177) (1,076) (1,253) (49) (142) (191) (1,444)
Subtotal (542) (2,599) (3,141) (232) (536) (768) (3,909)
Pensionable terminations
Disability (3) (5) (8) - - - (8)
Death (19) (15) (34) (4) (1) (5) (39)
Retirement (867) (2,010) (2,877) (360) (354) (714) (3,591)
Subtotal (889) (2,030) (2,919) (364) (355) (719) (3,638)
As at 31 March 2016 4,354 10,554 14,908 2,228 1,970 4,198 19,106
Table 29 Reconciliation of Regular Force Pensioners
Male Female
Officer Other Rank Total Officer Other Rank Total Total
Retirement Pensioners
As at 31 March 2013 16,846 52,911 69,757 1,085 3,281 4,366 74,123
Data corrections (236) (1,260) (1,496) (67) (59) (126) (1,622)
New pensioners 1,614 3,588 5,202 254 464 718 5,920
Death (1,247) (4,189) (5,436) (34) (41) (75) (5,511)
Rehired (185) (570) (755) (43) (96) (139) (894)
As at 31 March 2016 16,792 50,480 67,272 1,195 3,549 4,744 72,016
Disability Pensioners (3A)
As at 31 March 2013 88 877 965 15 70 85 1,050
Data corrections (10) (276) (286) - (7) (7) (293)
New pensioners - 5 5 - 2 2 7
Death (10) (104) (114) - (2) (2) (116)
As at 31 March 2016 68 502 570 15 63 78 648
Disability Pensioners (3B)
As at 31 March 2013 1,163 12,080 13,243 308 2,027 2,335 15,578
Data corrections 23 247 270 (16) (11) (27) 243
New pensioners 472 3,008 3,480 125 722 847 4,327
Death (33) (516) (549) (2) (20) (22) (571)
Rehired - (4) (4) - - - (4)
As at 31 March 2016 1,625 14,815 16,440 415 2,718 3,133 19,573

APPENDIX 4 60
ACTUARIAL REPORT
Pension Plans for the CANADIAN FORCES as at 31 March 2016
Table 30 Reconciliation of Reserve Force Pensioners
Male Female
Officer Other Rank Total Officer Other Rank Total Total
Retirement Pensioners
As at 31 March 2013 988 2,158 3,146 415 521 936 4,082
Data corrections 14 (185) (171) (28) (71) (99) (270)
New pensioners 867 2,010 2,877 360 354 714 3,591
Death (10) (9) (19) (2) (1) (3) (22)
Rehired (187) (325) (512) (119) (57) (176) (688)
As at 31 March 2016 1,672 3,649 5,321 626 746 1,372 6,693
Disability Pensioners
As at 31 March 2013 13 15 28 1 7 8 36
Data corrections 2 (10) (8) - (2) (2) (10)
New pensioners 3 5 8 - - - 8
Death (1) - (1) (1) - (1) (2)
Rehired - (2) (2) - - - (2)
As at 31 March 2016 17 8 25 - 5 5 30
Table 31 Reconciliation of Spouse Survivors
Regular Force Plan Reserve Force Plan
Widows Widowers Total Widows Widowers Total
As at 31 March 2013 22,993 157 23,150 25 3 28
Data corrections (194) 3 (191) 1 - 1
New from contributors 91 9 100 11 4 15
New from Pensioners 3,370 30 3,400 7 3 10
Spouse deaths (4,004) (12) (4,016) - - -
As at 31 March 2016 22,256 187 22,443 44 10 54
Table 32 Reconciliation of Survivors - Children/Students
Regular Force Plan Reserve Force Plan
Children Students Total Children Students Total
As at 31 March 2013 461 289 750 22 3 25
Data corrections 14 84 98 - - -
New from contributors 86 16 102 9 1 10
New from Pensioners 75 32 107 - - -
Termination of Benefits (60) (315) (375) (4) (3) (7)
Eligible as Student (127) 127 - (3) 3 -
As at 31 March 2016 449 233 682 24 4 28

APPENDIX 5 61
ACTUARIAL REPORT
Pension Plans for the CANADIAN FORCES as at 31 March 2016
Appendix 5 - CFSA Valuation Methodology
A. Plan Assets and Accounts
1. Canadian Forces Superannuation Account
The balance of the Superannuation Account forms part of the Public Accounts of
Canada. The underlying notional bond portfolio described in Appendix 3 is shown at
book value.
The only other Superannuation Account–related amount available for benefits consists
of the discounted value of future Regular Force member contributions and government
credits in respect of prior service elections. The discounted value of future member
contributions was calculated using the projected Superannuation Account yields. The
government is assumed to match these future member contributions when paid at a
single rate, but no contributions are credited by the government if the member is paying
the double rate.
2. Canadian Forces and Reserve Force Pension Funds
For valuation purposes, an adjusted market value method is used to determine the
actuarial value of assets in respect of the CFPF and RFPF. The method is unchanged
from the previous valuations.
Under the adjusted market value method, the difference between the observed
investment returns during a given plan year and the expected investment returns for that
year based on the previous report assumptions, is recognized over five years at the rate
of 20% per year. The actuarial value of assets is then determined by applying a 10%
corridor, such that the actuarial value of assets is within 10% of the market value of
assets. As a result, the actuarial value of assets is a five-year smoothed market value
where the investment gains or losses are recognized at the rate of 20% per year subject
to a 10% corridor to the market value of assets. The value produced by this method is
related to the market value of the assets but is more stable than the market value.
The other Pension Fund–related assets consist of:
the discounted value of future member and government contributions in respect of
prior service elections1. The discounted value of future member and government
contributions was calculated using the assumed rates of return on the Pension Fund;
the amount payable/receivable from Reserve Force Rollover members2; and
the remaining contributions for processed and unprocessed Reserve Force prior
service. This is the estimated amount of contributions for pre-2007 Reserve Force
service that Regular Force members and Reserve Force members have committed to
purchase.
The actuarial value of the assets determined as at 31 March 2016 under the adjusted
market value method is $22,478 million and was determined as follows.
1 As defined in Appendix 1B.2.b) Elected Prior Service 2 As defined in Appendix 1D.23.
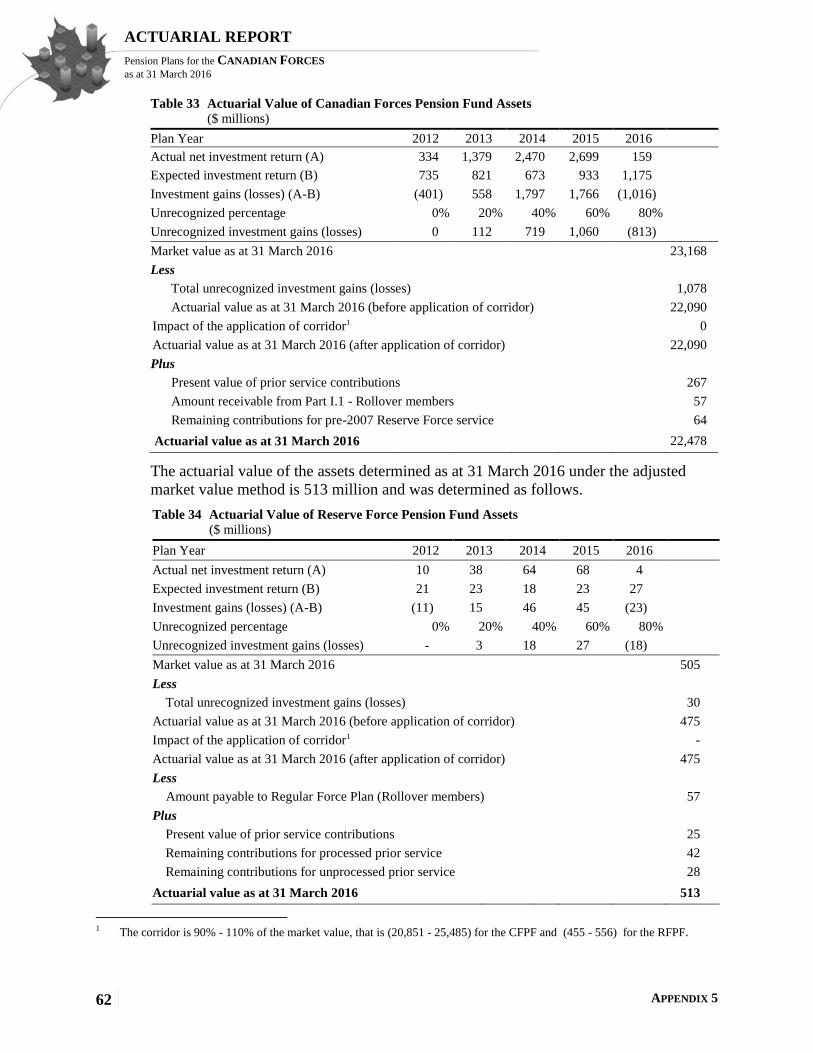
APPENDIX 5 62
ACTUARIAL REPORT
Pension Plans for the CANADIAN FORCES as at 31 March 2016
Table 33 Actuarial Value of Canadian Forces Pension Fund Assets
($ millions)
Plan Year 2012 2013 2014 2015 2016
Actual net investment return (A) 334 1,379 2,470 2,699 159
Expected investment return (B) 735 821 673 933 1,175
Investment gains (losses) (A-B) (401) 558 1,797 1,766 (1,016)
Unrecognized percentage 0% 20% 40% 60% 80%
Unrecognized investment gains (losses) 0 112 719 1,060 (813)
Market value as at 31 March 2016 23,168
Less
Total unrecognized investment gains (losses) 1,078
Actuarial value as at 31 March 2016 (before application of corridor) 22,090
Impact of the application of corridor1 0
Actuarial value as at 31 March 2016 (after application of corridor) 22,090
Plus
Present value of prior service contributions 267
Amount receivable from Part I.1 - Rollover members 57
Remaining contributions for pre-2007 Reserve Force service 64
Actuarial value as at 31 March 2016 22,478
The actuarial value of the assets determined as at 31 March 2016 under the adjusted
market value method is 513 million and was determined as follows.
Table 34 Actuarial Value of Reserve Force Pension Fund Assets
($ millions)
Plan Year 2012 2013 2014 2015 2016
Actual net investment return (A) 10 38 64 68 4
Expected investment return (B) 21 23 18 23 27
Investment gains (losses) (A-B) (11) 15 46 45 (23)
Unrecognized percentage 0% 20% 40% 60% 80%
Unrecognized investment gains (losses) - 3 18 27 (18)
Market value as at 31 March 2016 505
Less
Total unrecognized investment gains (losses) 30
Actuarial value as at 31 March 2016 (before application of corridor) 475
Impact of the application of corridor1 -
Actuarial value as at 31 March 2016 (after application of corridor) 475
Less
Amount payable to Regular Force Plan (Rollover members) 57
Plus
Present value of prior service contributions 25
Remaining contributions for processed prior service 42
Remaining contributions for unprocessed prior service 28
Actuarial value as at 31 March 2016 513
1 The corridor is 90% - 110% of the market value, that is (20,851 - 25,485) for the CFPF and (455 - 556) for the RFPF.

APPENDIX 5 63
ACTUARIAL REPORT
Pension Plans for the CANADIAN FORCES as at 31 March 2016
B. Actuarial Cost Method
As benefits earned in respect of current service will not be payable for many years, the
purpose of an actuarial cost method is to assign costs over the working lifetime of the
members.
As in the previous valuation, the projected accrued benefit actuarial cost method (also
known as the projected unit credit method) was used to determine the current service cost
and actuarial liability. Consistent with this cost method, pensionable earnings are projected
up to retirement using the assumed annual increases in average pensionable earnings
(including seniority and promotional increases). The yearly maximum salary cap and other
benefit limits under the Income Tax Act described in Appendix 2 were taken into account to
determine the benefits payable under CFPF and RFPF and those payable under the RCA.
1. Current Service Cost
Under the projected accrued benefit actuarial cost method, the current service cost, also
called the normal cost, computed in respect of a given year, is the sum of the value,
discounted in accordance with the actuarial assumptions for the CFPF and RFPF, of all
future payable benefits considered to accrue in respect of that year’s service. The CFPF
and RFPF administrative expenses1 are deemed to be included in the total current service
cost.
Under this method, the current service cost for an individual member will increase each
year as the member approaches retirement. However, all other things being equal, the
current service cost for the total population, expressed as a percentage of total
pensionable payroll, can be expected to remain stable as long as the average age and
service of the total population remains constant. For a given year, the government
current service cost is the total current service cost reduced by the members’
contributions during the year.
The Reserve Force Plan has been in operation since 1 March 2007. As at 31 March 2016
the average age and pensionable service are respectively 33.4 and 6.9 years. Being a
young pension plan, the Reserve Force Plan current service cost is expected to increase
over the years. In addition, the pension plan’s own experience is limited and determining
when the current service cost for the total population will become stable is still unknown
at this time.
2. Actuarial Liability
The actuarial liability with respect to contributor corresponds to the value, discounted in
accordance with the actuarial assumptions, of all future payable benefits accrued as at
the valuation date in respect of all previous service to the credit of members. For
pensioners and survivors, the actuarial liability corresponds to the value, discounted in
accordance with the actuarial assumptions, of future payable benefits.
1 As defined in Appendix 7-B.-3 Administrative Expenses
APPENDIX 5 64
ACTUARIAL REPORT
Pension Plans for the CANADIAN FORCES as at 31 March 2016
3. Actuarial Excess (Deficit)
It is unlikely that the actual experience will conform exactly to the assumptions that
underlie the actuarial estimates. Thus, a balancing item must be calculated under this
cost method to estimate the necessary adjustments. Adjustments may also be necessary
if the terms of the pension benefits enacted by legislation are modified or if assumptions
need to be updated.
The actuarial excess or deficit is the difference between the actuarial value of assets and
the actuarial liability. The disposition of any actuarial surplus or deficit is defined in the
CFSA.
4. Government Contributions
The recommended government contribution corresponds to the sum of:
the government current service cost;
the government contributions for prior service; and
as applicable, special payments in respect of a deficit or, as the case may be,
actuarial surplus debits.
C. Projected Yields and Rates of Return
The projected yields (shown in Appendix 6) used to calculate future interest credits to the
Superannuation Account are the projected annual yields on the combined book value of the
Superannuation Accounts of the Public Service, Canadian Forces and RCMP pension plans.
The projected Superannuation Account yields were determined by an iterative process
involving the following:
the combined notional bond portfolio of the three Superannuation Accounts as at the
valuation date;
the assumed future new money interest rates (also shown in Appendix 6);
the expected future benefits payable in respect of all pension entitlements accrued up to
31 March 2000;
the expected future contributions for prior service elections made up to 31 March 2000;
and
the expected future administrative expenses,
taking into account that the quarterly interest credited to the Superannuation Account is
calculated as if the principal at the beginning of a quarter remains unchanged during the
quarter.
The projected yields (shown in Appendix 6) were then used for the computation of the
present value of benefits to determine the liability for service prior to 1 April 2000.
The projected rates of return (shown in Appendix 6) assumed for computing the present
value of the benefits accrued or accruing under the CFPF and the RFPF were developed on
the basis that the Funds hold a diversified mix of assets.

APPENDIX 5 65
ACTUARIAL REPORT
Pension Plans for the CANADIAN FORCES as at 31 March 2016
D. Membership Data
For valuation purposes, individual data on each member were used.
The member data shown in Appendices 4 and 13 was provided as at 31 March 2016. This
valuation is based on the member data as at the valuation date.
The information in respect of the contributions for elected prior service was provided as at
31 March 2016. Future member contributions in respect of elected prior service took into
account only the payment streams that were still in effect at 31 March 2016. Only payments
due after 31 March 2016 were included.
Information regarding unprocessed prior service is taken from a revised supplementary
spreadsheet which was provided by DND in August 2016. Any elected prior service which
is reported both in the supplemental spreadsheet and also in the data provided as at
31 March 2016 is valued on the basis of the data provided as at 31 March 2016 . The
liability for unprocessed prior service is due to elections which were signed by
1 March 2011 deadline and remained unprocessed as at 31 March 2016. As at
31 March 2016 there were a total of 368 Regular Force Plan members and 530 Reserve
Force Plan members with such elections.
Supplemental information on amounts transferred to the Regular Force Plan during the year
ended 31 March 2017 was provided by DND and PSPC in April 2017. This report
incorporates that information into the determination of the amount payable to the Regular
Force Plan as at 31 March 2016.
APPENDIX 6 66
ACTUARIAL REPORT
Pension Plans for the CANADIAN FORCES as at 31 March 2016
Appendix 6 - CFSA Economic Assumptions
The payment of accrued pension benefits is the responsibility of the government, therefore the
likelihood of the plan being wound-up and its obligation not being fulfilled is practically
nonexistent, consequently all of the assumptions used in this report are best-estimate
assumptions, i.e. they reflect our best judgement of the future long-term experience of the plan
and do not include margins.
A. Inflation-Related Assumptions
1. Level of Inflation
Price increases, as measured by changes in the Consumer Price Index (CPI), tend to
fluctuate from year to year. In 2016, the Bank of Canada and the Government renewed
their commitment to keep inflation between 1% and 3% until the end of 2021. However,
with the level of inflation currently lower than the 2% target, it is assumed that the level
of inflation will increase from 1.6% in 2017 to its ultimate rate of 2.0% in 2018. The
ultimate rate of 2.0% is unchanged from the assumed rate in the previous valuation.
2. Increase in Pension Indexing Factor
The year’s pension indexing factor is required in the valuation process by virtue of its
role in maintaining the purchasing power of pensions. It was derived by applying the
indexation formula described in Appendix 1, which relates to the assumed Consumer
Price Index increases over successive 12-month periods ending on 30 September.
B. Employment Earnings Increases
1. Increase in the Year’s Maximum Pensionable Earnings (YMPE)
The YMPE is required in the Regular Force Plan valuation process because the plan is
coordinated with the Canada Pension Plan. The YMPE is required in the Reserve Force
Plan valuation process because the plan provides a bridge benefit based on career
earnings up to the YMPE. The assumed increase in the YMPE for a given calendar year
is derived, in accordance with the Canada Pension Plan, to correspond to the increase in
the Average Weekly Earnings (AWE), as calculated by Statistics Canada, over
successive 12-month periods ending on 30 June. The AWE, and thus the YMPE, is
deemed to include a component for seniority and promotional increases. The YMPE is
equal to $55,300 for calendar year 2017. Future increases in the YMPE correspond to
the assumed real1 increase in the AWE plus assumed increases in the CPI.
The real-wage differential is developed taking into account historical trends, a possible
labour shortage and an assumed moderate economic growth for Canada. Thus, a real-
wage differential of 0.6% is assumed for 2018, and is assumed to gradually increase to
the ultimate assumption of 1.1% by 2024 (1.2% by 2021 in the previous valuation). The
ultimate real-wage differential assumption combined with the ultimate price increase
assumption results in an assumed annual increase in nominal wages of 3.1% in 2024 and
1 Note that all of the real rates presented in this report are actually differentials, i.e. the difference between the effective
annual rate and the rate of increase in prices. This differs from the technical definition of a real rate of return, which, for
example in the case of the ultimate Fund assumption would be 3.9% (derived from 1.060/1.020) rather than 4.0%.
APPENDIX 6 67
ACTUARIAL REPORT
Pension Plans for the CANADIAN FORCES as at 31 March 2016
thereafter. Thus, the ultimate rate of increase for the YMPE is 3.1%, resulting from a
1.1% increase in the real AWE and a 2.0% increase in the CPI.
2. Increase in Pensionable Earnings
Pensionable earnings are applicable to CFSA pension plan members only, whereas the
YMPE applies to the general working population in Canada. In addition, increases in
pensionable earnings are exclusive of seniority and promotional increases, which are
considered under a separate demographic assumption. Thus, the annual increase in
pensionable earnings is assumed to be 0.3% lower than the corresponding increase in the
YMPE (0.2% lower in the previous valuation), except for years 2017 and 2018 where
the annual increase in pensionable earnings is assumed to be 1.7% greater than, and
1.3% lower than the corresponding increase in the YMPE. The ultimate increase in
pensionable earnings is 2.8% (3.0% in previous valuation).
3. Increase in Tax Related Maximum Pensionable Earnings (MPE)
The maximum annual pension accrual under a registered defined benefit plan of
$2,890.00 for 2016 will increase to $2,914.44 for 2017, in accordance with Income Tax
Regulations. Thereafter, the maximum annual pension accrual increases in accordance
with the increase in the YMPE, which is the same as the assumed increase in the AWE.
Regular Force Plan
Since the plan is coordinated with the Canada Pension Plan, the tax-related maximum
pensionable earnings were derived from both the maximum annual pension accrual
under a registered defined benefit plan as previously defined and the YMPE.
Beginning with calendar year 2012, the coordination factor is 0.625%. The MPE is
$163,100 for calendar year 2017.
Reserve Force Plan
Since the plan is not coordinated with the Canada Pension Plan, the tax-related
maximum pensionable earnings were derived from the maximum annual pension accrual
under a registered defined benefit plan.
The MPE is $194,300 for calendar year 2017. As at 31 March 2016, no member had
earnings in excess of $194,300.
C. Investment-Related Assumptions
1. New Money Rate
The new money rate is the nominal yield on 10-year-plus Government of Canada bonds
and is set for each year in the projection period. The real yield on 10-year-plus federal
bonds is equal to the new money rate less the assumed rate of inflation.
Recognizing recent experience, the annual real yield on 10-year-plus federal bonds is
assumed to be 0.3% in plan year 2017, and is assumed to increase gradually to its
ultimate level of 2.7% first attained in plan year 2028. This increase is consistent with
the average of private sector forecasts. The real yield on 10-year-plus bonds is based on
historical yields. The ultimate real yield was 2.8% in the previous valuation. The real
new money rates over the first eleven years of the projection are on average 0.9% lower
than assumed for the corresponding years in the previous valuation.

APPENDIX 6 68
ACTUARIAL REPORT
Pension Plans for the CANADIAN FORCES as at 31 March 2016
2. Projected Yields on Superannuation Account
These yields are required for the computation of present values of benefits to determine
the liability for service prior to 1 April 2000. The methodology used to determine the
projected yields on the Account is described in Section C of Appendix 5. The
methodology is unchanged from previous valuations. However, since the real projected
yields are determined based on the real new money rates, they are projected to be lower
than assumed in the previous valuation and to be lower by 0.1 % ultimately from 2044.
3. Rate of Return on the CFPF & RFPF
The expected annual nominal rates of return on the Funds are required for the
computation of present values of benefits to determine the liability and the current
service cost. The following sections describe how the rates of return on the Fund are
determined.
a) Investment Strategy
Since 1 April 2000, invested assets resulting from transferred amount equal to the
government and member contributions, net of benefit payments and administrative
expenses, are invested in capital markets through the Public Sector Pension
Investment Board (PSPIB). PSPIB invests funds to maximize returns without undue
risk of loss according to the investment policy set and approved by its Board of
Directors that take into account the needs of contributor and beneficiaries, as well as
financial market constraints. For the purpose of this report, the investments have
been grouped into three broad categories: equities, fixed income securities and real
assets. Equities consist of Canadian, foreign developed market and emerging market
equities. Fixed income securities consist of bonds which are usually a mix of federal,
provincial, corporate and real return bonds. Real assets include such categories as
real estate and infrastructure.
As at 31 March 2016, PSPIB assets consisted of 52% equity, 21% fixed income
securities (including private debt and world inflation-linked bonds) and 27% real
assets (including asset classes such as real estate, infrastructure and renewable
resources). PSPIB has developed a long-term target Policy Portfolio (approved by its
Board of Directors on 10 November 2016 and subject to an annual review), which
consists of 47% equity, 23% fixed income securities and 30% real assets. The Policy
Portfolio asset mix weights represent long-term targets. Therefore, the initial asset
mix is derived using the actual investments reported by PSPIB as at 31 March 2016.
As PSPIB Policy Portfolio reflects long-term expectations, it is assumed that the
asset mix will converge slowly toward the Policy Portfolio. The ultimate asset mix is
reached in plan year 2022 and consists of 47% equity, 23% fixed income securities
(including 2% cash) and 30% real assets. Net cash flows (contributions less
expenditures, disregarding special payments) are expected to become negative
during plan year 2027 for CFPF and 2045 for RFPF. When this happen, a portion of
investment income will therefore be required to pay benefits. Changes to the
assumed asset mix may be required in the future to reduce funding risks and to take
into account the maturity of the plan.
APPENDIX 6 69
ACTUARIAL REPORT
Pension Plans for the CANADIAN FORCES as at 31 March 2016
Table 35 shows the assumed asset mix for each plan year throughout the projection
period.
Table 35 Asset Mix
(in percentage)
Plan
Year
Fixed Income
Securities Cash
Canadian
Equity
U.S. and Foreign
Equity
Emerging
Market Equity Real Assets
2017 18 2 14 31 8 27
2018 18 2 14 31 8 27
2019 19 2 13 31 7 28
2020 20 2 12 30 7 29
2021 20 2 11 30 7 30
2022+ 21 2 10 30 7 30
b) Real Rates of Return by Asset Type
Real rates of return are required in order to discount benefits payable in the future
for the determination of the actuarial liability and current service cost. They are
assumed for each year of the projection period and for each of the main asset
categories in which CFPF and RFPF assets are invested. All real rates of return
described in this section are shown before reduction for assumed investment
expenses. Subsection c) describes how the returns are adjusted for investment
expenses.
In addition, the assumed real rate of return for each asset class includes an allowance
for rebalancing and diversification to take into account the beneficial effect of
reduced volatility that comes from diversification within a portfolio. If the expected
rates of return for each asset class were not increased to reflect their respective share
of this allowance, then the expected long-term portfolio rate of return calculated as
the weighted average rate of return of each asset class would be underestimated.
The real rates of return were developed by looking at historical returns (expressed in
Canadian dollars) and adjusting the returns upward or downward to reflect
expectations that differ from the past. Future currency variations will impact the real
rates of return over the projection period, creating gains and (losses). However, as
the projection period is long, these gains and (losses) are expected to offset each
other over time. Hence, it is assumed that currency variations will not have an
impact on the long-term real rates of return.
With the exception of fixed income securities and cash, real rates of return for all
asset classes are generally assumed to be constant for the entire projection period.
The current context of extremely low yields and the general expectations that yield
will increase over the coming years are reflected in the expected fixed income
securities’ short-term real rates of return. A constant real rate of return is assumed
for more volatile asset classes, reflecting the difficulty to predict yearly market
returns.

APPENDIX 6 70
ACTUARIAL REPORT
Pension Plans for the CANADIAN FORCES as at 31 March 2016
Fixed Income Securities
As at 31 March 2016, PSPIB had 21% of its portfolio invested in what this report
classifies as fixed income securities, including Canadian fixed income, world
government bonds, world inflation-linked bonds, corporate bonds, private debt and
cash. It is assumed that the proportion invested in fixed income securities will
increase to 23% of Pension Fund assets in plan year 2022 and remain at that level for
the projection period.
It is assumed that, excluding cash, fixed income securities’ ultimate mix in plan year
2021 will consist of 12% federal bonds, 12% provincial bonds, 33% corporate bonds
and private debt and 43% inflation-linked bonds.
The assumed real yield on 10-year-plus federal bonds is expected to increase from
0.3% at the beginning of plan year 2017 to an ultimate of 2.7% at the end of plan
year 2028. This increase in real yield is consistent with the average private sector
forecasts. The initial spreads over the 10-year-plus federal bond real yield are
assumed to be 110 basis points for long-term provincial bonds and 240 basis points
for corporate bonds. The corporate spread is higher than in the last report and
reflects the current economic environment. The ultimate spreads for provincial and
corporate bonds are assumed to be 50 basis points and 160 basis points, respectively,
and are reached at the end of plan year 2028. Corporate bond spreads are net of the
expected default rate. Real return bonds, on the other hand, usually have a lower real
yield than long-term federal bonds, since the real return is guaranteed and will not
vary with inflation. Thus, the spread on inflation-linked bonds is assumed to be -70
basis points initially and will reach its ultimate value of -40 basis points at the end of
plan year 2028.
Since the current PSPIB policy portfolio and its long-term target Policy Portfolio is
composed of universe bonds, it is assumed that fixed income securities are
composed of universe bonds for the entire projection period. Due to their shorter
duration, the yield on universe bonds is lower than the yield on long-term bonds.
The spread between the 10-year-plus federal bonds and the universe of federal bonds
is assumed to decrease from 85 basis points at the beginning of plan year 2017 to 55
basis points at the beginning of plan year 2028. Spreads between universe federal
bonds and universe provincial, or universe corporate bonds are assumed to be similar
to spreads between long-term bonds.
The expected real rates of return for individual bonds take into account the coupons
and market value fluctuations due to the expected movement of their respective yield
rates. As the economy continues to strengthen (following the 2008-2009 economic
downturn), the 10-year-plus federal bond yield is assumed to increase between plan
years 2017 and 2027 and to stabilize at the end of plan year 2027. Therefore, bond
returns are quite low for the first eleven years of the projection. The assumed
ultimate real rate of return for 10-year-plus federal bonds is 2.7% starting in plan
year 2028. An ultimate fixed income real rate of return of 2.8% is assumed for 2028
and thereafter.

APPENDIX 6 71
ACTUARIAL REPORT
Pension Plans for the CANADIAN FORCES as at 31 March 2016
Equity
Currently, the assets of the pension fund are mostly invested in equity, specifically in
developed world equity and emerging markets equity. In the derivation of the real
rates of return for these equity investments, consideration was given to the long-term
equity risk premiums for these equity classes. The rates of return also include
dividends from the equities and market value fluctuations. No distinction is made
between realized and unrealized capital gains.
Consistent with the assumption that risk taking must be rewarded, equity returns are
developed by adding an equity risk premium to the long-term federal bond real rate
of return. The historical equity risk premium over long-term government bond
returns for 21 countries, representing about 90% of global stock market value, for
the 116-year period starting in 1900 was 3.2% (3.3% for Canada)1. Historical equity
risk premiums were higher than expected due to several non-repeatable factors
(mainly diversification and globalization). As a result, the long-term expected equity
risk premium is assumed to be lower than what was realized in the past 116 years.
However, the equity risk premium is assumed to be higher in the first eleven years of
the projection, reflecting assumed low bond returns over the same period, before
reaching its ultimate rate of 2.1% for Canadian and foreign developed markets. The
equity risk premium for emerging market equities is expected to be 100 basis points
higher than for Canadian and foreign developed market equities, reflecting the
additional risk inherent with investments in emerging countries.
As described in the previous section, the 10-year-plus federal bond real rate of return
is set at 2.7% for plan years 2028 and thereafter. The real rates of return are thus
projected at 4.8% for developed market equities and 5.8% for emerging markets
equities.
Real Assets
Real assets such as real estate and infrastructure are considered to be a hybrid of
corporate bonds and equity. If these assets are considered to behave 50% like
corporate bonds and 50% like developed market equities, then the assumed return
should be composed of 50% of the return on corporate bonds and 50% of the return
on developed market equities. Considering the inherent difficulties in modelling
short-term returns for volatile assets, real assets are projected at 4.3% throughout the
projection period.
Table 36 summarizes the assumed real rates of return by asset type throughout the
projection period, prior to reduction for investment expenses.
1 Source: Elroy Dimson, Paul Marsh and Mike Staunton, Credit Suisse Global Investment Returns Yearbook 2016.

APPENDIX 6 72
ACTUARIAL REPORT
Pension Plans for the CANADIAN FORCES as at 31 March 2016
Table 36 Real Rate of Return by Asset Type
(before investment expenses)
(in percentage)
Plan Year
Fixed Income
Securities Cash
Canadian
Equity
U.S. and
Foreign Equity
Emerging
Market Equity Real Assets
2017 (3.2) (0.9) 4.8 4.8 5.8 4.3
2018 (4.1) (0.9) 4.8 4.8 5.8 4.3
2019 (3.1) (0.7) 4.8 4.8 5.8 4.3
2020 (1.1) (0.3) 4.8 4.8 5.8 4.3
2021 (0.7) (0.1) 4.8 4.8 5.8 4.3
2022 0.0 0.1 4.8 4.8 5.8 4.3
2023 0.3 0.3 4.8 4.8 5.8 4.3
2024 0.4 0.5 4.8 4.8 5.8 4.3
2025 1.2 0.7 4.8 4.8 5.8 4.3
2026 1.7 0.9 4.8 4.8 5.8 4.3
2027 2.1 1.0 4.8 4.8 5.8 4.3
2028+ 2.8 1.0 4.8 4.8 5.8 4.3
c) Investment Expenses
Over the last three plan years, PSPIB’s operating and asset management expenses
have averaged 0.60% of average net assets. It is assumed that going forward PSPIB
investment expenses will average 0.60% of average net assets. The majority of those
investment expenses were incurred through active management decisions.
The active management objective is to generate returns in excess of those from the
policy portfolio, after reduction for additional expenses. Thus, the additional returns
from a successful active management program should equal at least the cost incurred
to pursue active management. In seven of the past ten years, PSPIB’s additional
returns from active management exceeded related expenses. For the purpose of this
valuation, it is assumed that additional returns due to active management will equal
additional expenses related to active management. Those expenses are assumed to be
the difference between total investment expenses of 0.6% and the assumed expenses
of 0.2% that would be incurred for passive management of the portfolio considering
that part of the portfolio is invested in real estate and infrastructure.
The next section shows the overall rate of return on the fund net of investment
expenses.
d) Overall Rate of Return on Assets of the CFPF and the RFPF
The best-estimate rate of return on total assets is derived from the weighted average
assumed rate of return on all types of assets, using the assumed asset mix
proportions as weights. The best-estimate rate of return is further increased to reflect
additional returns due to active management and reduced to reflect all investment
expenses. The ultimate real rate of return is developed in Table 37.
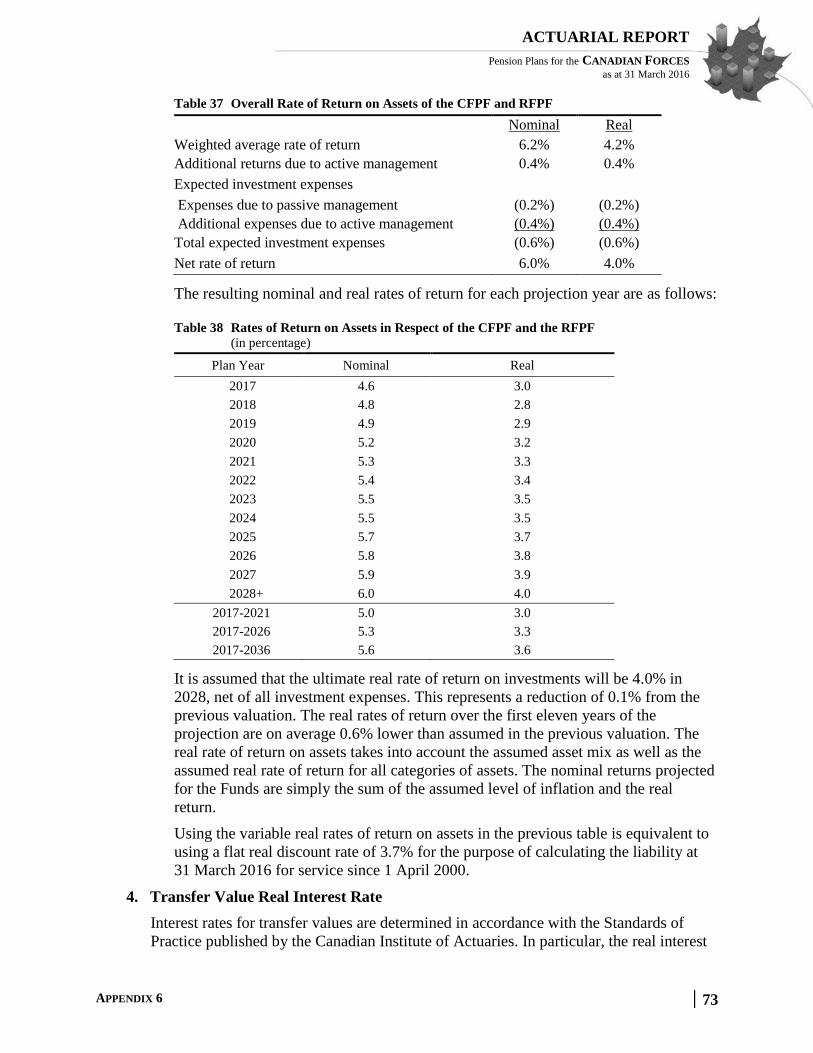
APPENDIX 6 73
ACTUARIAL REPORT
Pension Plans for the CANADIAN FORCES as at 31 March 2016
Table 37 Overall Rate of Return on Assets of the CFPF and RFPF
Nominal Real
Weighted average rate of return 6.2% 4.2%
Additional returns due to active management 0.4% 0.4%
Expected investment expenses
Expenses due to passive management (0.2%) (0.2%)
Additional expenses due to active management (0.4%) (0.4%)
Total expected investment expenses (0.6%) (0.6%)
Net rate of return 6.0% 4.0%
The resulting nominal and real rates of return for each projection year are as follows:
Table 38 Rates of Return on Assets in Respect of the CFPF and the RFPF
(in percentage)
Plan Year Nominal Real
2017 4.6 3.0
2018 4.8 2.8
2019 4.9 2.9
2020 5.2 3.2
2021 5.3 3.3
2022 5.4 3.4
2023 5.5 3.5
2024 5.5 3.5
2025 5.7 3.7
2026 5.8 3.8
2027 5.9 3.9
2028+ 6.0 4.0
2017-2021 5.0 3.0
2017-2026 5.3 3.3
2017-2036 5.6 3.6
It is assumed that the ultimate real rate of return on investments will be 4.0% in
2028, net of all investment expenses. This represents a reduction of 0.1% from the
previous valuation. The real rates of return over the first eleven years of the
projection are on average 0.6% lower than assumed in the previous valuation. The
real rate of return on assets takes into account the assumed asset mix as well as the
assumed real rate of return for all categories of assets. The nominal returns projected
for the Funds are simply the sum of the assumed level of inflation and the real
return.
Using the variable real rates of return on assets in the previous table is equivalent to
using a flat real discount rate of 3.7% for the purpose of calculating the liability at
31 March 2016 for service since 1 April 2000.
4. Transfer Value Real Interest Rate
Interest rates for transfer values are determined in accordance with the Standards of
Practice published by the Canadian Institute of Actuaries. In particular, the real interest

APPENDIX 6 74
ACTUARIAL REPORT
Pension Plans for the CANADIAN FORCES as at 31 March 2016
rates to be used for the computation of commuted values as at a particular date are as
follows:
First 10 years: r7 + 0.90%
After 10 years: rL + 0.5 × (rL-r7) + 0.90%
Where
r7 = rL × (i7/iL)
rL is the long-term real-return Government of Canada bond yield, annualized
iL is the long-term Government of Canada benchmark bond yield, annualized and
i7 is the 7-year Government of Canada benchmark bond yield, annualized
The obtained rates of interest are rounded to the nearest multiple of 0.10%.
For example, for plan year 2019, the assumed real rates of interest are 1.6% for the first
10 years and 2.0% thereafter. The rates are derived from the assumed CPI increase, the
assumed 10-year-plus Government of Canada benchmark bond yield which corresponds
to the new money rate in this valuation and the assumed spreads1 between the new
money rate and the long-term real-return Government of Canada bond yield, the long-
term Government of Canada benchmark bond yield and the 7-year Government of
Canada benchmark bond yield. Table 39 shows the assumed transfer value real interest
rates used in this report:
1 The spreads for the first year are based on the October 2016 actual spreads of 17, 14 and -82 basis points between 10-year-
plus Government of Canada bond yield and the bonds underlying rL, iL and i7 respectively. The ultimate spreads of -7, 6 and
-74 basis points, starting in fiscal year 2025, are based on the average spreads over the last 10 years. An interpolation
reflecting the variation in new money rates is applied for intermediate years.
Table 39 Transfer Value
(As a percentage)
Real Interest Rates
Plan Year rL iL i7 r7 First 10 Years After 10 Years
2017 0.46 2.04 1.07 0.24 1.10 1.50
2018 0.51 2.52 1.59 0.32 1.20 1.50
2019 0.95 3.01 2.10 0.66 1.60 2.00
2020 1.31 3.39 2.51 0.97 1.90 2.40
2021 1.49 3.59 2.72 1.12 2.00 2.60
2022 1.75 3.88 3.03 1.37 2.30 2.80
2023 1.93 4.07 3.23 1.53 2.40 3.00
2024 2.02 4.17 3.34 1.61 2.50 3.10
2025 2.20 4.36 3.55 1.79 2.70 3.30
2026 2.39 4.56 3.74 1.97 2.90 3.50
2027 2.49 4.66 3.84 2.06 3.00 3.60
2028+ 2.59 4.76 3.94 2.15 3.00 3.70

APPENDIX 6 75
ACTUARIAL REPORT
Pension Plans for the CANADIAN FORCES as at 31 March 2016
5. Summary of Economic Assumptions
The economic assumptions used in this report are summarized in the following table.
Table 40 Economic Assumptions1
(As a percentage)
Inflation Employment Earning Increases Interest
Plan
Year
CPI
Increase2
Pension
Indexing3 YMPE
3 Pensionable
Earnings4
Maximum
Pensionable
Earnings3
New
Money
Rate
Projected
Yield on
Account
Projected
Return on
Funds
2017 1.6 1.3 0.8 2.5 0.8 1.9 4.4 4.6
2018 2.0 1.9 2.6 1.3 2.6 2.4 4.2 4.8
2019 2.0 2.0 2.7 2.4 2.7 2.9 4.0 4.9 2020 2.0 2.0 2.8 2.5 2.8 3.3 3.8 5.2
2021 2.0 2.0 2.9 2.6 2.9 3.5 3.7 5.3
2022 2.0 2.0 3.0 2.7 3.0 3.8 3.6 5.4
2023 2.0 2.0 3.0 2.7 3.0 4.0 3.5 5.5
2024 2.0 2.0 3.1 2.8 3.1 4.1 3.4 5.5 2025 2.0 2.0 3.1 2.8 3.1 4.3 3.4 5.7
2026 2.0 2.0 3.1 2.8 3.1 4.5 3.3 5.8
2027 2.0 2.0 3.1 2.8 3.1 4.6 3.2 5.9
2030 2.0 2.0 3.1 2.8 3.1 4.7 3.1 6.0
2035 2.0 2.0 3.1 2.8 3.1 4.7 3.5 6.0
2040 2.0 2.0 3.1 2.8 3.1 4.7 4.4 6.0
2044+ 2.0 2.0 3.1 2.8 3.1 4.7 4.7 6.0
As a reference, for periods ending December 2015, the following table was prepared
based on the Canadian Institute of Actuaries Report on Canadian Economic Statistics
1924-2015.
Period of Years Ending 2015 15 25 50
Level of Inflation 1.8% 1.9% 4.1%
Real Increases in Pensionable Earnings 0.7% 0.5% 0.8%
Real Yield of Long-Term Canada Bonds 2.1% 3.4% 3.2%
Real Return on Long-Term Canada Bonds 5.1% 7.0% 4.0%
Average Real Return on Diversified Portfolios 4.3% 6.6% 4.4%
1 Bold figures denote actual experience. 2 Assumed to be effective during the Plan Year. 3 Assumed to be effective as at 1 January. 4 Assumed to be effective as at 1 April. Exclusive of seniority and promotional increases.

APPENDIX 7 76
ACTUARIAL REPORT
Pension Plans for the CANADIAN FORCES as at 31 March 2016
Appendix 7 - CFSA Demographic and Other Assumptions
A. Demographic Assumptions
Given the size of the Regular Force Plan population subject to the CFSA, the plan’s own
experience, except where otherwise noted, was deemed to be the best model to determine
the demographic assumptions. As mentioned in Appendix 1, demographic assumptions
based on service were derived from the pension plan experience of the last five years and
those assumptions from the previous valuation not based on ‘service’ were updated to
reflect past experience to the extent it was deemed credible.
The Reserve Force Plan is a young plan, with little experience, providing little predictable
information for establishing appropriate demographic assumptions. Except where otherwise
noted, the experience of the Regular Force members covered under Part I of the CFSA was
deemed to be the best source of data to determine the demographic assumptions.
1. Seniority and Promotional Salary Increases
Seniority means length of service within a classification and promotion means moving
to a higher paid classification.
The assumption for seniority and promotional salary increase for both the Regular Force
Plan and Reserve Force Plan are determined by studying the experience for the Regular
Force Plan.
The seniority and promotional salary increase assumption was marginally revised to
reflect the intervaluation experience. The revised assumption had very minimal impact
on the financial results. The following table provide sample rates of seniority and
promotional increases for both pension plans.
Table 41 Sample of Assumed Seniority and Promotional Salary Increases
(Percentage of annual earnings)
Completed Years of
Qualifying Service1 Officer Other Rank
Completed Years of
Qualifying Service Officer Other Rank
0 6.7 20.2 10 3.8 0.8
1 7.3 17.8 11 3.6 0.9
2 14.9 5.1 12 3.4 1.0
3 24.6 9.0 13 3.0 1.1
4 11.6 2.6 14 2.6 1.1
5 6.6 2.0 15 2.3 1.2
6 7.4 1.8 20 1.8 1.2
7 5.4 1.5 25 1.3 1.1
8 4.4 1.0 30 1.1 0.9
9 4.0 0.9 40 0.5 0.6
1 For the Reserve Force pension plan, completed years of pensionable service
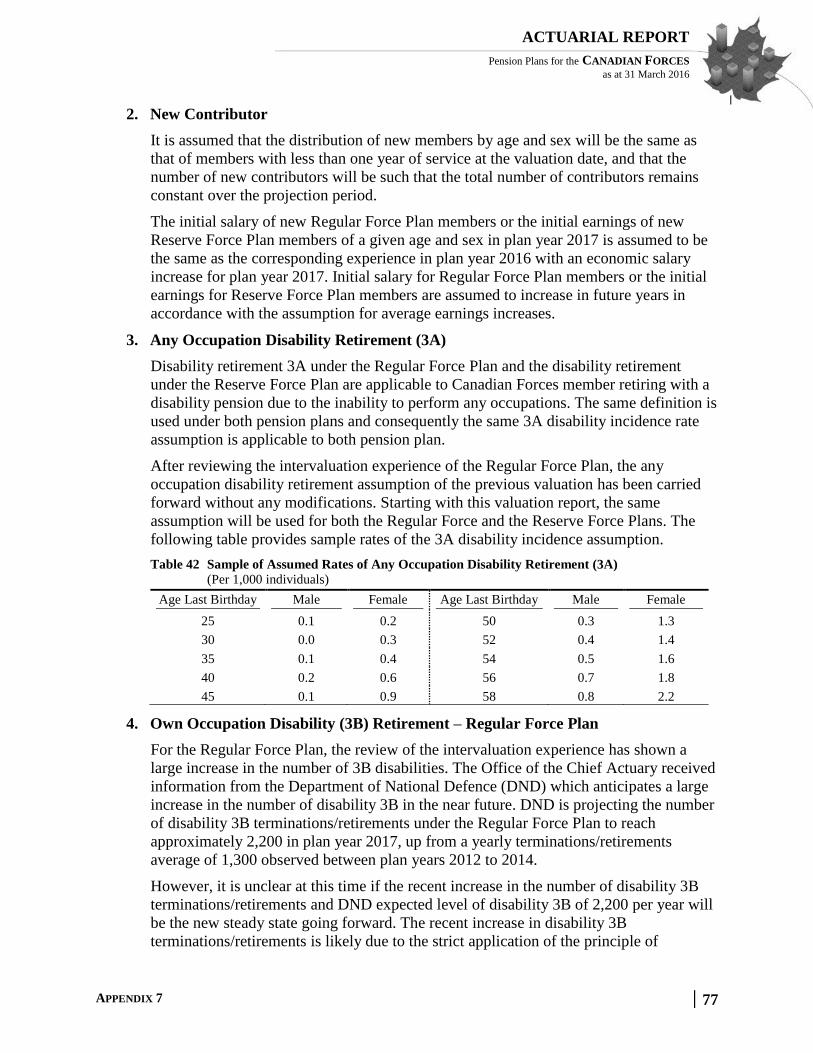
APPENDIX 7 77
ACTUARIAL REPORT
Pension Plans for the CANADIAN FORCES as at 31 March 2016
2. New Contributor
It is assumed that the distribution of new members by age and sex will be the same as
that of members with less than one year of service at the valuation date, and that the
number of new contributors will be such that the total number of contributors remains
constant over the projection period.
The initial salary of new Regular Force Plan members or the initial earnings of new
Reserve Force Plan members of a given age and sex in plan year 2017 is assumed to be
the same as the corresponding experience in plan year 2016 with an economic salary
increase for plan year 2017. Initial salary for Regular Force Plan members or the initial
earnings for Reserve Force Plan members are assumed to increase in future years in
accordance with the assumption for average earnings increases.
3. Any Occupation Disability Retirement (3A)
Disability retirement 3A under the Regular Force Plan and the disability retirement
under the Reserve Force Plan are applicable to Canadian Forces member retiring with a
disability pension due to the inability to perform any occupations. The same definition is
used under both pension plans and consequently the same 3A disability incidence rate
assumption is applicable to both pension plan.
After reviewing the intervaluation experience of the Regular Force Plan, the any
occupation disability retirement assumption of the previous valuation has been carried
forward without any modifications. Starting with this valuation report, the same
assumption will be used for both the Regular Force and the Reserve Force Plans. The
following table provides sample rates of the 3A disability incidence assumption.
Table 42 Sample of Assumed Rates of Any Occupation Disability Retirement (3A)
(Per 1,000 individuals)
Age Last Birthday Male Female Age Last Birthday Male Female
25 0.1 0.2 50 0.3 1.3
30 0.0 0.3 52 0.4 1.4
35 0.1 0.4 54 0.5 1.6
40 0.2 0.6 56 0.7 1.8
45 0.1 0.9 58 0.8 2.2
4. Own Occupation Disability (3B) Retirement – Regular Force Plan
For the Regular Force Plan, the review of the intervaluation experience has shown a
large increase in the number of 3B disabilities. The Office of the Chief Actuary received
information from the Department of National Defence (DND) which anticipates a large
increase in the number of disability 3B in the near future. DND is projecting the number
of disability 3B terminations/retirements under the Regular Force Plan to reach
approximately 2,200 in plan year 2017, up from a yearly terminations/retirements
average of 1,300 observed between plan years 2012 to 2014.
However, it is unclear at this time if the recent increase in the number of disability 3B
terminations/retirements and DND expected level of disability 3B of 2,200 per year will
be the new steady state going forward. The recent increase in disability 3B
terminations/retirements is likely due to the strict application of the principle of

APPENDIX 7 78
ACTUARIAL REPORT
Pension Plans for the CANADIAN FORCES as at 31 March 2016
“Universality of Service1”. After taking into account the recent available information,
the 3B disability incidence rates have been modified to incorporate a 10-year select
period which will produce approximately 2,200 such terminations/retirements in plan
year 2017 reducing linearly over 10 years to attain a steady state of approximately 1,300
disability terminations/retirements per year starting in plan year 2027.
In addition, the increase in the number of 3B disability terminations/retirements is not
expected to increase the total number of terminations (withdrawal, disability, death and
retirement combined) historically observed under the Regular Force Plan. Accordingly,
the increase number of 3B disability terminations/retirements will generate an
equivalent decrease in the overall number of withdrawals and terminations over the
same 10-year select period. The following table provides a sample of 3B disability
incidence rates for the Regular Force Plan.
Table 43 Sample of Assumed 3B Disability Incidence Rates (Own Occupation) - Regular Force
Plan
(Per 1,000 individuals)
Completed Years of
Qualifying Service
Male Officer Male Other Rank Female
2017 2027+ 2017 2027+ 2017 2027+
1 1.0 1.2 9.1 4.3 12.8 6.6
5 9.3 4.5 13.4 7.4 22.8 12.3
10 8.5 4.6 25.8 15.3 31.4 21.1
15 10.6 4.8 28.6 21.2 40.6 25.1
20 16.7 11.0 55.5 40.8 49.8 49.1
25 21.1 12.8 65.2 44.2 78.6 61.1
30 28.0 17.9 73.1 54.8 110.2 78.8
35 80.7 35.6 161.2 119.9 133.5 116.1
There are no 3B disability incidence rates (own occupation) for the Reserve Force Plan
as there are no such similar benefits provided under the Reserve Force Plan.
5. Pensionable Retirement
Members of the Canadian Forces may qualify for retirement using either their total
qualifying Canadian Forces service or the pensionable service to their credit. For the
Regular Force Plan, the assumed rates of pensionable retirement were revised to reflect
the intervaluation experience (2014-16). In general, the number of retirements decreased
as compared to the 2011-2013 observation period of the previous report. As explained in
Section 4 above, the intervaluation experience has shown an increase in the number of
3B disability retirements which had the direct impact of reducing the number of
pensionable retirements.
To recognize the projected increase in the 3B disability incidence rates assumption over
the next 10 years, as explained in section 4 above, the updated pensionable retirement
assumption, developed on the experience of the last three years, is further reduced to
absorb the corresponding increase in the projected number of 3B disability retirements.
The pensionable retirement assumption of plan year 2027 has been developed on the
1 The requirement to be physically fit, employable and deployable for general operational duties.

APPENDIX 7 79
ACTUARIAL REPORT
Pension Plans for the CANADIAN FORCES as at 31 March 2016
basis of the 2012-2014 plan experience further modified downward to account for the
marginal increase in the projected 2027 3B disability retirement assumption. The
retirement assumptions for plan year 2018 to 2026 have been linearly interpolated
between the updated retirement rates of plan year 2017 and 2027. The following tables
provide sample rates of pensionable retirement for member of the Regular Force Plan.
Table 44 Sample of Assumed Rates of Retirement - Regular Force Plan - Old Terms of Service
(Per 1,000 individuals)
Completed Years of
Qualifying Service
Officer Other Rank
Male Female Male Female
2017 2027+ 2017 2027+ 2017 2027+ 2017 2027+
19 43 75 107 144 24 58 18 42
20 55 63 93 109 47 69 22 60
21 56 42 95 60 53 59 49 49
22 38 34 73 44 52 51 40 39
23 34 17 35 55 60 57 33 48
24 54 43 53 96 66 63 50 61
25 65 63 59 83 60 67 78 86
30 87 80 87 86 76 78 55 80
35 341 336 351 422 268 304 359 296
Table 45 Sample of Assumed Rates of Retirement - Regular Force Plan - New Terms of Service
(Per 1,000 individuals)
Completed Years of
Qualifying Service
Officer Other Rank
Male Female Male Female
2017 2027+ 2017 2027+ 2017 2027+ 2017 2027+
24 63 78 43 175 81 80 23 112
25 66 64 138 146 66 89 76 88
26 57 61 103 126 63 71 59 74
27 53 54 77 139 45 57 68 63
28 51 48 95 115 42 59 65 86
29 60 59 89 81 78 72 57 96
30 87 80 86 86 76 81 55 83
35 339 334 344 420 263 305 359 288
After a review of the Reserve Force Plan intervaluation experience, the retirement rates for less
than 13 years of pensionable service were modified. Retirement rates after 12 years of
pensionable service are the same as those in the previous report. Table 46 provides sample rates
of pensionable retirement for the Reserve Force Plan.

APPENDIX 7 80
ACTUARIAL REPORT
Pension Plans for the CANADIAN FORCES as at 31 March 2016
Table 46 Sample of Assumed Rates of Retirement - Reserve Force members
(Per 1,000 individuals)
Completed Years of
Pensionable Service
Age - Male Age - Female
49 54 59 49 54 59
5 28 62 179 38 40 136
10 19 40 178 23 31 162
15 8 18 169 11 27 197
25 7 13 245 13 28 322
30 15 232 307 19 281 342
35 35 577 417 35 530 307
6. Withdrawal
Withdrawal means ceasing to be a member of the Regular Force Plan for reasons other
than death or retirement with an immediate annuity or an annual allowance. Under the
Regular Force Plan, the withdrawal assumptions were revised to reflect the
intervaluation experience. Except for the Male Officer under the old terms of service
group, the experience has shown an average decrease of 16% in the number of
withdrawals during the observed period of 2013-16. As explained in section 4 above, the
intervaluation experience has shown an increase in the number of 3B disability
retirements and withdrawals which had the direct impact of reducing the number of
withdrawals.
To recognize the projected increase in the 3B disability retirement assumption over the
next 10 years, as explained in section 4 above, the updated withdrawal assumption,
developed on the experience of the last three years, is further reduced to absorb the
corresponding increase in the projected number of 3B disability retirements. The
withdrawal assumption of plan year 2027 has been developed on the basis of the 2012-
2014 plan experience further modified downward to account for the marginal increase
in the projected 2027 3B disability retirement assumption. The withdrawal assumptions
for plan year 2018 to 2026 have been linearly interpolated between the updated
withdrawal rates of plan year 2017 and 2027. The following tables provide sample rates
of withdrawal for members of the Regular Force Plan.
Table 47 Sample of Assumed Withdrawal Rates - Regular Force Plan - Old Terms of Service
(Per 1,000 individuals)
Officer Other Rank
Completed Years of
Qualifying Service
Male Female Male Female
2017 2027+ 2017 2027+ 2017 2027+ 2017 2027+
0 96 97 89 94 84 78 67 68
1 36 49 30 40 23 33 26 20
5 20 28 21 17 58 55 32 34
10 21 25 14 16 22 22 23 24
15 12 13 6 19 7 10 3 4
18 8 13 10 25 0 12 4 18
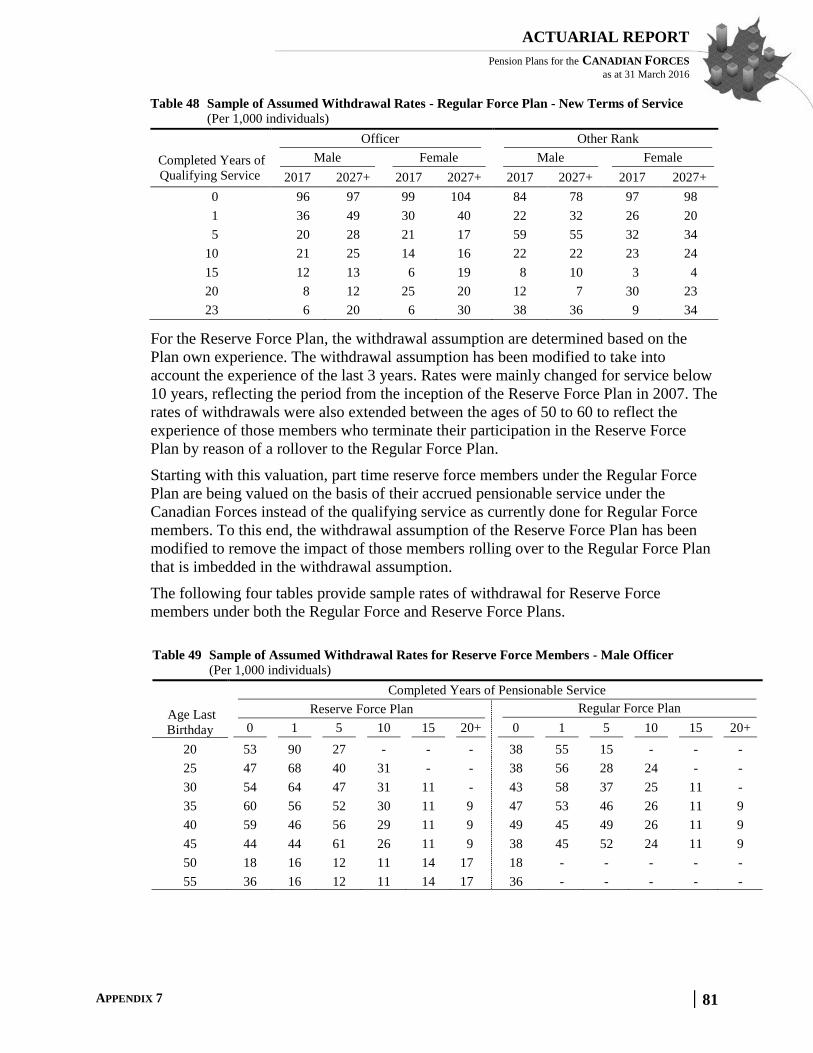
APPENDIX 7 81
ACTUARIAL REPORT
Pension Plans for the CANADIAN FORCES as at 31 March 2016
Table 48 Sample of Assumed Withdrawal Rates - Regular Force Plan - New Terms of Service
(Per 1,000 individuals)
Officer Other Rank
Completed Years of
Qualifying Service
Male Female Male Female
2017 2027+ 2017 2027+ 2017 2027+ 2017 2027+
0 96 97 99 104 84 78 97 98
1 36 49 30 40 22 32 26 20
5 20 28 21 17 59 55 32 34
10 21 25 14 16 22 22 23 24
15 12 13 6 19 8 10 3 4
20 8 12 25 20 12 7 30 23
23 6 20 6 30 38 36 9 34
For the Reserve Force Plan, the withdrawal assumption are determined based on the
Plan own experience. The withdrawal assumption has been modified to take into
account the experience of the last 3 years. Rates were mainly changed for service below
10 years, reflecting the period from the inception of the Reserve Force Plan in 2007. The
rates of withdrawals were also extended between the ages of 50 to 60 to reflect the
experience of those members who terminate their participation in the Reserve Force
Plan by reason of a rollover to the Regular Force Plan.
Starting with this valuation, part time reserve force members under the Regular Force
Plan are being valued on the basis of their accrued pensionable service under the
Canadian Forces instead of the qualifying service as currently done for Regular Force
members. To this end, the withdrawal assumption of the Reserve Force Plan has been
modified to remove the impact of those members rolling over to the Regular Force Plan
that is imbedded in the withdrawal assumption.
The following four tables provide sample rates of withdrawal for Reserve Force
members under both the Regular Force and Reserve Force Plans.
Table 49 Sample of Assumed Withdrawal Rates for Reserve Force Members - Male Officer
(Per 1,000 individuals)
Completed Years of Pensionable Service
Age Last
Birthday
Reserve Force Plan Regular Force Plan
0 1 5 10 15 20+ 0 1 5 10 15 20+
20 53 90 27 - - - 38 55 15 - - -
25 47 68 40 31 - - 38 56 28 24 - -
30 54 64 47 31 11 - 43 58 37 25 11 -
35 60 56 52 30 11 9 47 53 46 26 11 9
40 59 46 56 29 11 9 49 45 49 26 11 9
45 44 44 61 26 11 9 38 45 52 24 11 9
50 18 16 12 11 14 17 18 - - - - -
55 36 16 12 11 14 17 36 - - - - -

APPENDIX 7 82
ACTUARIAL REPORT
Pension Plans for the CANADIAN FORCES as at 31 March 2016
Table 50 Sample of Assumed Withdrawal Rates for Reserve Force Members - Male Other Rank
(Per 1,000 individuals)
Completed Years of Pensionable Service
Age Last
Birthday
Reserve Force Plan Regular Force Plan
0 1 5 10 15 20+ 0 1 5 10 15 20+
20 92 111 88 - - - 64 87 73 - - -
25 88 106 101 47 - - 64 82 79 36 - -
30 75 85 89 42 11 - 57 68 64 35 11 -
35 57 68 67 35 11 9 47 59 54 31 11 9
40 39 58 60 33 11 9 33 49 55 29 11 9
45 25 50 57 31 11 9 23 37 53 28 11 9
50 22 16 12 11 14 17 22 - - - - -
55 38 16 12 11 14 17 38 - - - - -
Table 51 Sample of Assumed Withdrawal Rates for Reserve Force Members - Female Officer
(Per 1,000 individuals)
Completed Years of Pensionable Service
Age Last
Birthday
Reserve Force Plan Regular Force Plan
0 1 5 10 15 20+ 0 1 5 10 15 20+
20 47 50 52 - - - - 43 48 - - -
25 30 51 52 40 - - - 43 48 29 - -
30 24 53 52 38 12 - - 45 49 30 12 -
35 27 54 50 35 12 10 10 46 47 31 12 10
40 31 55 49 34 12 10 10 46 46 32 12 10
45 29 54 48 34 12 10 10 46 45 33 12 10
50 18 16 12 11 14 17 17 - - - - -
55 23 16 12 11 14 17 17 - - - - -
Table 52 Sample of Assumed Withdrawal Rates for Reserve Force Members - Female Other Rank
(Per 1,000 individuals)
Completed Years of Pensionable Service
Age Last
Birthday
Reserve Force Plan Regular Force Plan
0 1 5 10 15 20+ 0 1 5 10 15 20+
20 75 91 99 - - - 57 80 73 - - -
25 89 92 98 40 - - 64 81 74 27 - -
30 95 93 99 40 12 - 66 81 75 27 12 -
35 86 95 101 40 12 9 58 81 75 27 12 9
40 62 93 103 40 12 9 43 79 74 27 12 9
45 34 92 103 40 12 9 26 78 74 27 12 9
50 23 16 12 11 14 17 23 - - - - -
55 22 16 12 11 14 17 22 - - - - -
7. Proportion of Members Opting for a Deferred Annuity
Not all vested members transfer the commuted value of their deferred pension upon
withdrawal, and an assumption must be made as to the proportion of members opting for
a deferred annuity. For members of the Regular Force Plan, this assumption was revised
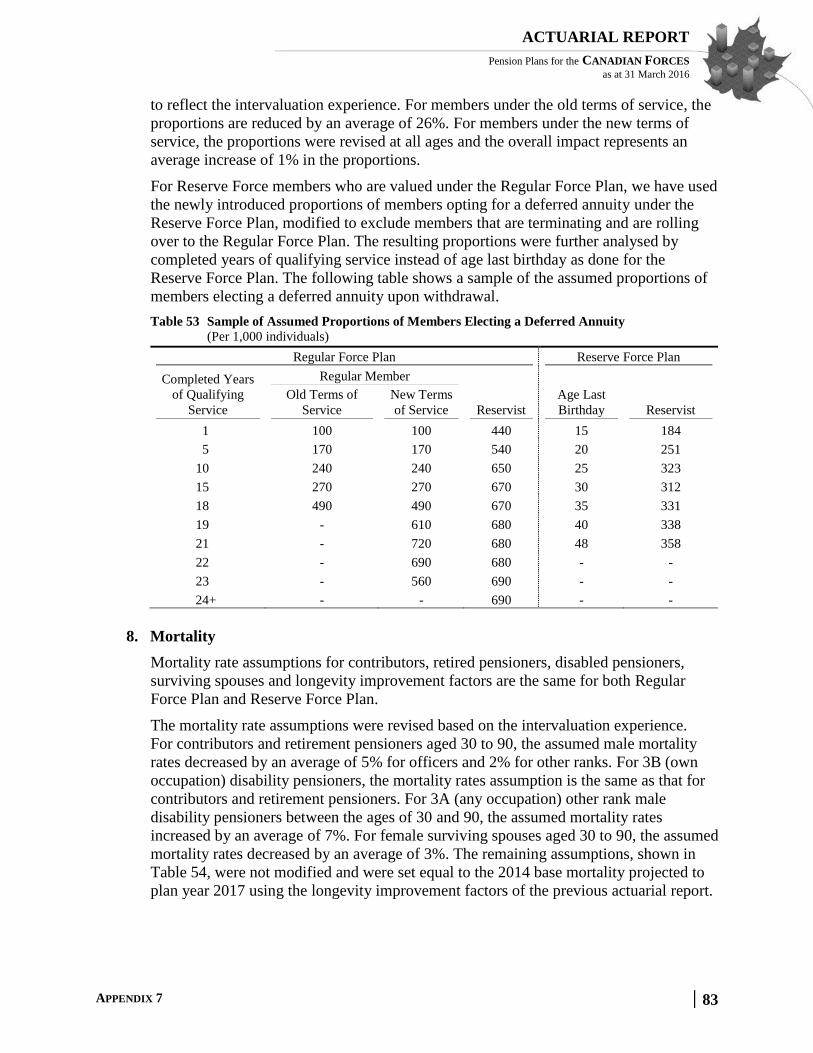
APPENDIX 7 83
ACTUARIAL REPORT
Pension Plans for the CANADIAN FORCES as at 31 March 2016
to reflect the intervaluation experience. For members under the old terms of service, the
proportions are reduced by an average of 26%. For members under the new terms of
service, the proportions were revised at all ages and the overall impact represents an
average increase of 1% in the proportions.
For Reserve Force members who are valued under the Regular Force Plan, we have used
the newly introduced proportions of members opting for a deferred annuity under the
Reserve Force Plan, modified to exclude members that are terminating and are rolling
over to the Regular Force Plan. The resulting proportions were further analysed by
completed years of qualifying service instead of age last birthday as done for the
Reserve Force Plan. The following table shows a sample of the assumed proportions of
members electing a deferred annuity upon withdrawal.
Table 53 Sample of Assumed Proportions of Members Electing a Deferred Annuity
(Per 1,000 individuals)
Regular Force Plan Reserve Force Plan
Completed Years
of Qualifying
Service
Regular Member
Age Last
Birthday Reservist
Old Terms of
Service
New Terms
of Service Reservist
1 100 100 440 15 184
5 170 170 540 20 251
10 240 240 650 25 323
15 270 270 670 30 312
18 490 490 670 35 331
19 - 610 680 40 338
21 - 720 680 48 358
22 - 690 680 - -
23 - 560 690 - -
24+ - - 690 - -
8. Mortality
Mortality rate assumptions for contributors, retired pensioners, disabled pensioners,
surviving spouses and longevity improvement factors are the same for both Regular
Force Plan and Reserve Force Plan.
The mortality rate assumptions were revised based on the intervaluation experience.
For contributors and retirement pensioners aged 30 to 90, the assumed male mortality
rates decreased by an average of 5% for officers and 2% for other ranks. For 3B (own
occupation) disability pensioners, the mortality rates assumption is the same as that for
contributors and retirement pensioners. For 3A (any occupation) other rank male
disability pensioners between the ages of 30 and 90, the assumed mortality rates
increased by an average of 7%. For female surviving spouses aged 30 to 90, the assumed
mortality rates decreased by an average of 3%. The remaining assumptions, shown in
Table 54, were not modified and were set equal to the 2014 base mortality projected to
plan year 2017 using the longevity improvement factors of the previous actuarial report.

APPENDIX 7 84
ACTUARIAL REPORT
Pension Plans for the CANADIAN FORCES as at 31 March 2016
The following table provides sample rates of mortality.
Table 54 Sample of Assumed Rates of Mortality
(Per 1,000 individuals)
Age Last
Birthday
Contributors and Retirement
Pensioners Disability (3A) Pensioners
Surviving Spouses Male Male
Officer Other Rank Female Officer Other Rank Female Male Female
30 0.5 0.6 0.4 0.6 3.0 0.4 0.9 0.2
40 0.6 0.8 0.5 1.0 4.1 1.0 1.4 1.7
50 1.0 2.3 1.2 6.3 7.1 2.5 3.1 3.2
60 3.0 6.8 3.5 14.0 13.6 6.4 8.5 7.0
70 10.6 18.6 11.1 25.8 29.2 16.0 21.8 16.9
80 41.5 57.4 33.4 60.0 66.6 43.2 57.3 42.3
90 137.6 156.1 105.3 134.3 163.5 120.5 153.8 116.6
100 306.6 319.8 281.6 304.3 329.4 279.5 331.2 308.4
110 500.0 500.0 500.0 500.0 500.0 500.0 500.0 500.0
As shown in the 27th
Actuarial Report on the Canada Pension Plan, life expectancy in
Canada has been increasing constantly over the years. This trend is also observed in the
Canadian Forces membership as supported by analysis of past mortality experience.
Mortality rates are reduced in the future in accordance with the same longevity
improvement assumption1
used in the 27th Actuarial Report on the Canada Pension
Plan. Mortality improvements are expected to continue in the future but at a slower pace
than most recently observed over the 15-year period ending in 2011. Further, it is
assumed that, ultimately, mortality improvement rates for males will decrease to the
same level as females.
Factors shown in the 27th
Actuarial Report of the Canada Pension Plan are based on
calendar years. These factors have been interpolated to obtain plan year longevity
improvement factors.
The average annual mortality improvement rates experienced in Canada over the 15-
year period from 1996 to 2011 by age and sex were used as the basis for projecting
annual mortality.
The ultimate longevity improvement factors for plan years 2033 and thereafter were
established by analysing the trend by age only and not by sex or calendar year. The
ultimate mortality improvement rates are derived by analyzing Canadian experience
over the period 1921 to 2011.
1 In this report ‘longevity improvement assumption’ is equivalent to the ‘mortality improvement assumption’ discussed in the
27th Actuarial Report on the Canada Pension Plan.
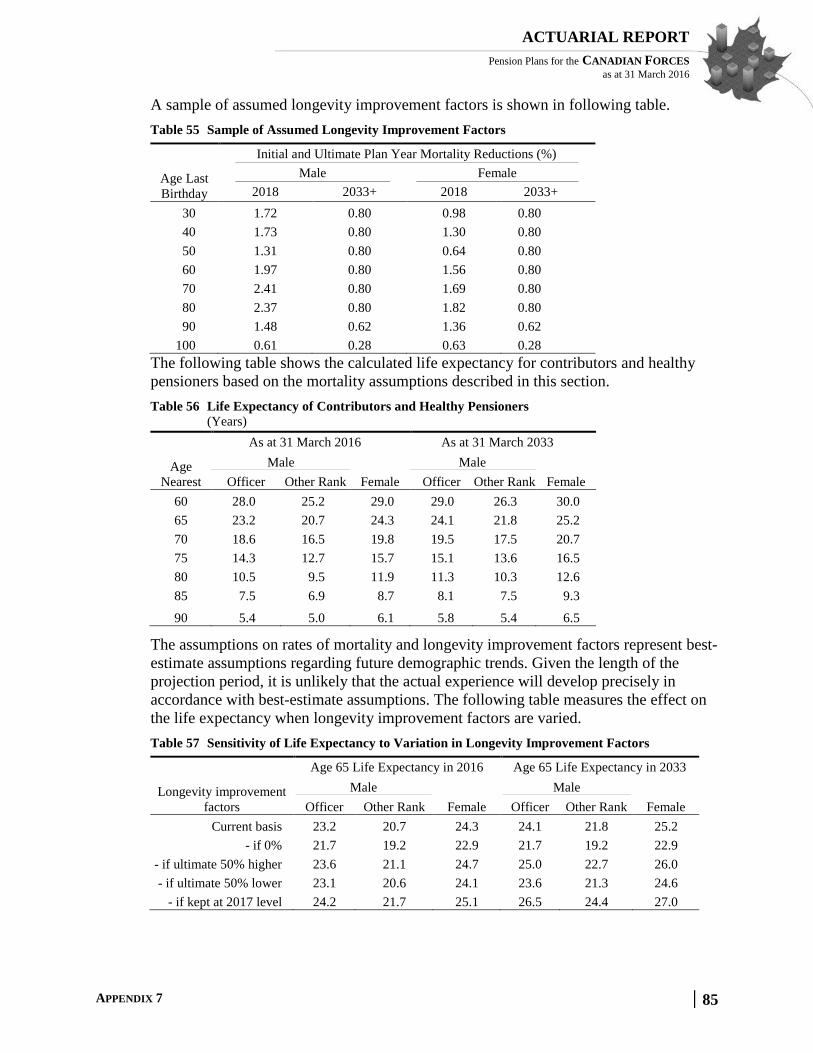
APPENDIX 7 85
ACTUARIAL REPORT
Pension Plans for the CANADIAN FORCES as at 31 March 2016
A sample of assumed longevity improvement factors is shown in following table.
Table 55 Sample of Assumed Longevity Improvement Factors
Age Last
Birthday
Initial and Ultimate Plan Year Mortality Reductions (%)
Male Female
2018 2033+ 2018 2033+
30 1.72 0.80 0.98 0.80
40 1.73 0.80 1.30 0.80
50 1.31 0.80 0.64 0.80
60 1.97 0.80 1.56 0.80
70 2.41 0.80 1.69 0.80
80 2.37 0.80 1.82 0.80
90 1.48 0.62 1.36 0.62
100 0.61 0.28 0.63 0.28
The following table shows the calculated life expectancy for contributors and healthy
pensioners based on the mortality assumptions described in this section.
Table 56 Life Expectancy of Contributors and Healthy Pensioners
(Years)
Age
Nearest
As at 31 March 2016 As at 31 March 2033
Male Male
Officer Other Rank Female Officer Other Rank Female
60 28.0 25.2 29.0 29.0 26.3 30.0
65 23.2 20.7 24.3 24.1 21.8 25.2
70 18.6 16.5 19.8 19.5 17.5 20.7
75 14.3 12.7 15.7 15.1 13.6 16.5
80 10.5 9.5 11.9 11.3 10.3 12.6
85 7.5 6.9 8.7 8.1 7.5 9.3
90 5.4 5.0 6.1 5.8 5.4 6.5
The assumptions on rates of mortality and longevity improvement factors represent best-
estimate assumptions regarding future demographic trends. Given the length of the
projection period, it is unlikely that the actual experience will develop precisely in
accordance with best-estimate assumptions. The following table measures the effect on
the life expectancy when longevity improvement factors are varied.
Table 57 Sensitivity of Life Expectancy to Variation in Longevity Improvement Factors
Longevity improvement
factors
Age 65 Life Expectancy in 2016 Age 65 Life Expectancy in 2033
Male Male
Officer Other Rank Female Officer Other Rank Female
Current basis 23.2 20.7 24.3 24.1 21.8 25.2
- if 0% 21.7 19.2 22.9 21.7 19.2 22.9
- if ultimate 50% higher 23.6 21.1 24.7 25.0 22.7 26.0
- if ultimate 50% lower 23.1 20.6 24.1 23.6 21.3 24.6
- if kept at 2017 level 24.2 21.7 25.1 26.5 24.4 27.0

APPENDIX 7 86
ACTUARIAL REPORT
Pension Plans for the CANADIAN FORCES as at 31 March 2016
9. Family Composition1
The assumptions regarding spouse survivors for both Regular and Reserve Force
members were revised based on the intervaluation experience. The probability of
leaving, upon death, a spouse eligible for a survivor pension was decreased from the
previous valuation by an average of 5% for male members while the previous
assumption for female members were decreased by an average of 1%. The assumption
for the age difference of the spouse at the time of death of the member was marginally
reduced for male members but remains unchanged from the previous valuation for
female members.
Table 58 Assumptions for Survivor Spouse Allowances
Age Last
Birthday
Probability of an Eligible Spouse at Death of Member Spouse Age Difference
Male Female Male Female
30 0.51 0.49 (2) 1
40 0.67 0.51 (2) 2
50 0.70 0.52 (2) 1
60 0.76 0.52 (2) 0
70 0.74 0.49 (3) (1)
80 0.62 0.43 (3) (1)
90 0.40 0.26 (4) (5)
100 0.12 0.00 (8) (6)
The assumptions regarding the average number of eligible children for both Regular and
Reserve Force members were revised for male members based on the intervaluation
experience. The assumptions for female members remained unchanged from the
previous valuation.
For male members, age 30 and below, the average number of children assumption was
increased on average by 25%. Between the ages of 31 and 50, the average number
children assumed to be eligible for a survivor allowance decreased by an average of 3%.
Above age 50, the average number of children decreased by an average of 25%.
The assumption regarding the average age of eligible children was changed from the
previous report by one year at select ages. As in the previous valuation, to determine the
value of pensions payable to eligible children, the rates of pension termination were
assumed to be 0% prior to age 17 and 16% per annum thereafter until expiry of the
benefit on the 25th
birthday.
Table 59 Assumptions for Survivor Children Allowances
Age Last
Birthday at Death
Average Number of Children Average Age of Children
Male Female Male Female
30 0.7 0.7 4 5
40 1.3 0.8 11 13
50 0.4 0.3 15 17
60 0.1 0.0 18 -
70 0.0 0.0 - -
1 Survivor pensions are not payable if the deceased member has less than two years of pensionable service.

APPENDIX 7 87
ACTUARIAL REPORT
Pension Plans for the CANADIAN FORCES as at 31 March 2016
B. Other Assumptions
1. Pension Benefits Division/Optional Survivor Benefit/Leave Without Pay
The division of pension benefits has almost no effect on the valuation results because
the liability is reduced, on average, by approximately the amount paid to the credit of the
former spouse. Consequently, no future pension benefits divisions were assumed in
estimating the current service cost and liability. However, past pension benefits
divisions were fully reflected in the liability. Two other provisions, namely the optional
survivor benefit and the suspension of membership while on leave without pay, were
also treated like pension benefits divisions for the same reason.
2. Minimum Post-Retirement Death Benefit
This valuation does not take into account the minimum death benefit described in
Note 21 in Appendix 1 D, with respect to deaths occurring after retirement. The
resulting understatement of the accrued liability and current service cost is not material
since the majority of the relatively few pensioners who die in the early years of
retirement leave an eligible survivor.
3. Administrative Expenses
The operating expenses of the PSPIB continue to be recognized implicitly in this report.
Beside the additional administration cost associated with the Pension Modernization, all
other pension plan administrative expenses are charged to the Superannuation Account,
the CFPF and the RFPF.
For the Regular Force Plan, the annual administrative expenses assumption was
increased from 0.5% to 0.75% of total pensionable payroll and from 1.25% to 1.75% of
total pensionable payroll for the Reserve Force Plan. These revisions are based on
discussions with DND regarding their expectations going forwards. For plan year 2017,
the Superannuation Account is assumed to be charged with 58.1% of total administrative
expenses, reducing by 2.5% each year thereafter. The future expenses expected to be
charged to the Superannuation Account have been capitalized and are shown as a
liability, whereas the expenses to the CFPF and RFPF have been recognized as a part of
the annual current service cost.
4. Wage Measure
Under the Reserve Force Plan, the retirement benefit is based on the career average of
the updated earnings. Past earnings are updated using the wage measure as defined in
the schedule of the Reserve Force Pension Plan Regulations. The regulations also
prescribe the wage measures for calendar year 2007 and later as the greater of:
the standard basic rate of pay for a period of duty or training of six hours or more,
before any retroactive adjustment , that was prescribed or established under the
National Defence Act to be paid on October 1 of the preceding year to a member
at the rank of Corporal (class A), and
the wage measure of the previous year.
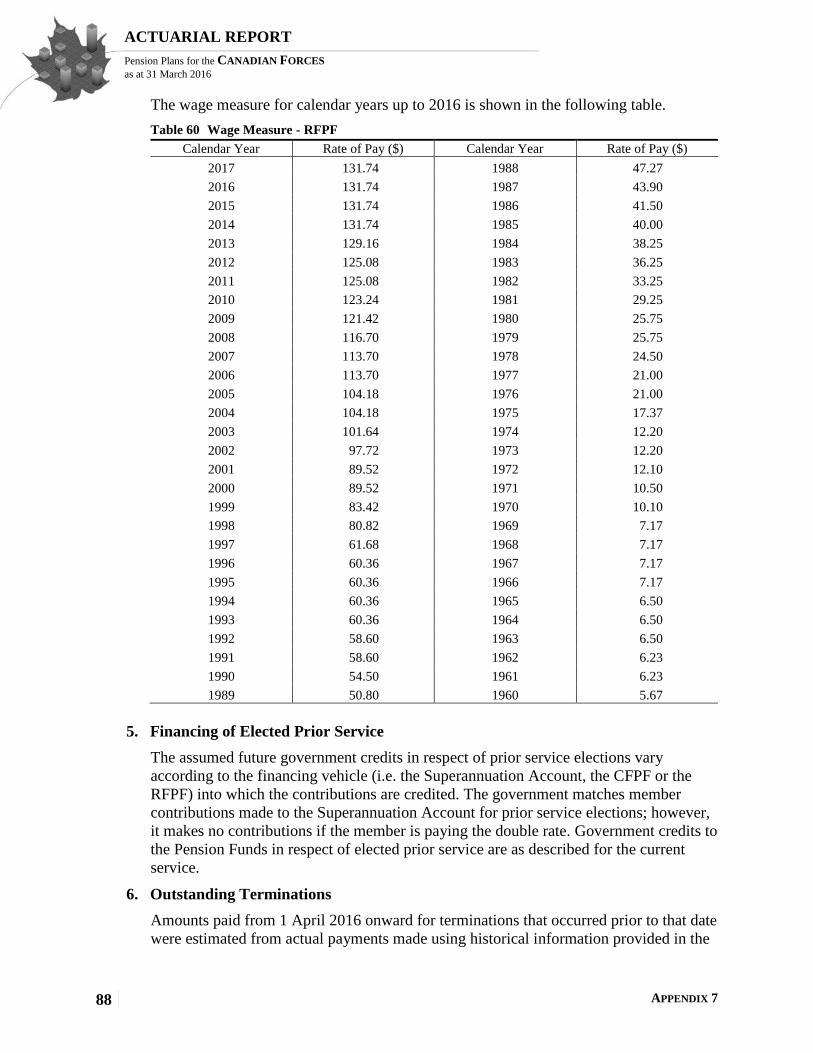
APPENDIX 7 88
ACTUARIAL REPORT
Pension Plans for the CANADIAN FORCES as at 31 March 2016
The wage measure for calendar years up to 2016 is shown in the following table.
Table 60 Wage Measure - RFPF
Calendar Year Rate of Pay ($) Calendar Year Rate of Pay ($)
2017 131.74 1988 47.27
2016 131.74 1987 43.90
2015 131.74 1986 41.50
2014 131.74 1985 40.00
2013 129.16 1984 38.25
2012 125.08 1983 36.25
2011 125.08 1982 33.25
2010 123.24 1981 29.25
2009 121.42 1980 25.75
2008 116.70 1979 25.75
2007 113.70 1978 24.50
2006 113.70 1977 21.00
2005 104.18 1976 21.00
2004 104.18 1975 17.37
2003 101.64 1974 12.20
2002 97.72 1973 12.20
2001 89.52 1972 12.10
2000 89.52 1971 10.50
1999 83.42 1970 10.10
1998 80.82 1969 7.17
1997 61.68 1968 7.17
1996 60.36 1967 7.17
1995 60.36 1966 7.17
1994 60.36 1965 6.50
1993 60.36 1964 6.50
1992 58.60 1963 6.50
1991 58.60 1962 6.23
1990 54.50 1961 6.23
1989 50.80 1960 5.67
5. Financing of Elected Prior Service
The assumed future government credits in respect of prior service elections vary
according to the financing vehicle (i.e. the Superannuation Account, the CFPF or the
RFPF) into which the contributions are credited. The government matches member
contributions made to the Superannuation Account for prior service elections; however,
it makes no contributions if the member is paying the double rate. Government credits to
the Pension Funds in respect of elected prior service are as described for the current
service.
6. Outstanding Terminations
Amounts paid from 1 April 2016 onward for terminations that occurred prior to that date
were estimated from actual payments made using historical information provided in the

APPENDIX 7 89
ACTUARIAL REPORT
Pension Plans for the CANADIAN FORCES as at 31 March 2016
valuation data at 31 March 2016. For this valuation, after reviewing the information, a
total of $51 and $1 million were set aside respectively for the CFPF and the RFPF.
7. Disability Incidence Rates for Pensioners Under Age 60
Both deferred pensioners and pensioners receiving an annual allowance while under
age 60 were assumed to have a 0% disability rate. The resulting understatement of
liability and current service cost is negligible.
8. Recovery Rates for Disability Pensioners
No recoveries are assumed for disability pensioners. The resulting overstatement of
liability and current service cost is negligible.
9. Sex of Surviving Spouses
The sex of each eligible surviving spouse is assumed to be the opposite of the deceased
member’s.

APPENDIX 8 90
ACTUARIAL REPORT
Pension Plans for the CANADIAN FORCES as at 31 March 2016
Appendix 8 - RCA Valuation Methodology and Assumptions
A. Valuation of the Amounts Available for Benefits
The amounts available for benefits comprise the recorded balance in the Retirement
Compensation Arrangements Account (RCA), which forms part of the Accounts of Canada,
as well as a tax credit (CRA refundable tax).
Interest is credited every three months in accordance with the actual average yield on a book
value basis for the same period on the combined Superannuation Accounts of the Public
Service, Canadian Forces - Regular Force and Royal Canadian Mounted Police pension
plans. The actuarial value of the amounts available for benefits is equal to the book value.
B. Valuation of Liabilities
Described in this appendix are the liability valuation methodologies used and any
differences in economic assumptions from those used in the CFSA valuation.
1. Terminally Funded RCA Benefits
The following RCA benefits are being terminally funded (i.e. not prefunded but on an
occurrence basis):
pre-retirement survivor benefits
minimum death benefit
The above benefits are terminally funded because they are uncommon or of little
financial significance. The pre-retirement survivor benefit becomes payable only when
the average salary is less than 1.4 times the YMPE. As well, the minimum death benefit
is expected to occur only with deaths at younger ages where the mortality rates are low.
2. Post-Retirement Survivor Benefits
The limit on the amount of spousal annual allowance that can be provided under the
CFSA decreases at the same time the member’s pension reduces due to the CPP
coordination, usually at age 65.
This benefit was valued conservatively by assuming the plan limit is always coordinated
with the CPP. The liability overstatement is minor because the probability of the former
contributor dying prior to age 65 is small. (This overstatement tends to be offset by the
understatement of accrued liability caused by terminally funding the pre-retirement
survivor benefit.) The projected accrued benefit cost method was used to estimate the
liabilities and current service cost for this RCA benefit.
3. Excess Pensionable Earnings
The projected accrued benefit cost method was used to estimate plan liabilities and
current service costs for benefits in excess of the Maximum Pensionable Earnings
(MPE).
This valuation applies the same valuation methodology that was used in the previous
report. Officers are divided into specialists (doctors, dentists, etc.) and non-specialists.
Also included in the specialist group are officers with salary as at 31 March 2016 in
excess of the 2016 MPE. The specialists, who represent more than 70% of the RCA
APPENDIX 8 91
ACTUARIAL REPORT
Pension Plans for the CANADIAN FORCES as at 31 March 2016
liabilities, are valued using the actuarial assumptions described in Appendix 6, as was
the case in the previous report.
4. Administrative Expenses
To compute the liabilities and current service cost, no provision was made regarding the
expenses incurred for the administration of the RCA Account. These expenses, which
are not debited to the RCA Account, are borne entirely by the government and are
commingled with all other government expenses.
C. Actuarial Assumptions
The valuation economic assumptions described in Appendix 6 were used without any
modifications. In prior actuarial valuations, the valuation interest rates used to determine the
present value of the RCA liabilities and RCA current service cost were half of the interest
rate used to determine the present value of the Superannuation Account liabilities. For this
valuation, the valuation interest discount rate is equaled to the yield projected on the
combined Superannuation Accounts.
D. Valuation Data
The RCA pension benefits in payment were provided as at 31 March 2016. RCA benefits
expected to be paid in respect of contributor and accrued spousal allowances of current
retired members were all derived from the membership data described in Appendix 4 and
shown in Appendix 13.

APPENDIX 9 92
ACTUARIAL REPORT
Pension Plans for the CANADIAN FORCES as at 31 March 2016
Appendix 9 - Canadian Forces Superannuation Account Projection
Prior to 1 April 2000, the CFSA Superannuation Account tracked all government pension benefit
obligations related to the CFSA. The Superannuation Account is now debited only with benefit
payments made in respect of service earned before that date and administrative expenses; it is
credited with prior service related to elections made prior to 1 April 2000 and interest earnings.
The results of the following projection were computed using the amounts available for benefits
described in Appendix 3, the data described in Appendices 4 and 13, the methodology described
in Appendix 1 and the assumptions described in Appendices 6 and 7.
The projection shows the expected cash flows and balance of the Superannuation Account if all
assumptions are realized. Emerging experience that differs from the corresponding assumptions
will result in gains or losses to be revealed in subsequent valuation reports.
Table 61 Canadian Forces Superannuation Account Projection
($ millions)
Plan
Year
Beginning
Account
Balance
Present value of
prior service
contributions
Beginning
Liability
Capitalized
Administrative
Expenses
Special Credit
at End of Plan
Year
Net
Payments1
Interest
Earnings
2017 45,695 23 47,1532 232 - 2,499 1,956
2018 45,152 22 46,694 220 1,813 2,505 1,844
2019 46,305 21 46,118 208 - 2,528 1,802
2020 45,579 20 45,403 195 - 2,547 1,684
2021 44,716 19 44,552 183 - 2,559 1,608
2022 43,764 17 43,611 170 - 2,567 1,530
2023 42,727 16 42,586 157 - 2,568 1,451
2024 41,611 15 41,481 144 - 2,562 1,372
2025 40,420 14 40,303 132 - 2,550 1,331
2026 39,201 13 39,095 119 - 2,532 1,252
2027 37,921 12 37,827 107 - 2,507 1,174
2028 36,588 11 36,505 94 - 2,476 1,132
2029 35,244 11 35,171 82 - 2,442 1,089
2030 33,890 10 33,829 71 - 2,406 1,014
2031 32,498 9 32,447 60 - 2,370 971
2032 31,099 8 31,058 49 - 2,333 958
2033 29,725 8 29,692 40 - 2,294 943
2040 20,971 4 20,974 - - 1,971 880
2050 10,925 1 10,925 - - 1,377 481
1 Benefit payments plus administrative expenses minus prior service contributions and pension modernization cost. 2 Includes pension modernization cost of $12 million.

APPENDIX 10 93
ACTUARIAL REPORT
Pension Plans for the CANADIAN FORCES as at 31 March 2016
Appendix 10 - Canadian Forces Pension Fund Projection
Starting 1 April 2000, the CFSA is financed through the Canadian Forces Pension Fund (CFPF).
Government and member contributions, investment earnings and prior service contributions for
elections since 1 April 2000 are added to the CFPF. Benefit payments made in respect of service
earned since that date and administrative expenses are subtracted from the CFPF.
The results of the following projection were computed using the data described in Appendices 4
and 13, the methodology described in Appendix 5 and the assumptions described in Appendices
6 and 7.
The projection shows the expected growth of the CFPF if all assumptions are realized.
According to the projection, cash flows are expected to be positive until plan year 2028.
Emerging experience that differs from the corresponding assumptions will result in gains or
losses to be revealed in subsequent valuation reports.
Table 62 Canadian Forces Pension Fund Projection
($ millions)
Plan
Year
Expected
Unrecognized
Investment
(Gains)/Losses
Present value of
prior service
contributions
Beginning
Market
Value of
Assets Contributions1 Payments
Investment
Earnings
Special
Payments2
Beginning
Actuarial
Liability
2017 (1,078) 267 23,2893 1,318 721 1,085 170 24,047
2018 (456) 248 25,140 1,313 716 1,221 145 25,732
2019 53 231 27,103 1,316 787 1,341 145 27,549
2020 203 216 29,117 1,327 869 1,526 145 29,414
2021 - 202 31,247 1,343 956 1,666 145 31,388
2022 - 189 33,445 1,362 1,052 1,814 145 33,425
2023 - 176 35,715 1,386 1,155 1,971 145 35,526
2024 - 163 38,062 1,414 1,259 2,098 145 37,695
2025 - 151 40,460 1,445 1,365 2,308 145 39,906
2026 - 139 42,993 1,482 1,477 2,494 145 42,241
2027 - 127 45,637 1,526 1,588 2,691 145 44,677
2028 - 116 48,410 1,573 1,704 2,901 145 47,230
2029 - 106 51,326 1,620 1,824 3,074 145 49,913
2030 - 97 54,341 1,667 1,948 3,252 145 52,682
2031 - 90 57,457 1,714 2,083 3,437 145 55,541
2032 - 84 60,670 1,760 2,230 3,626 145 58,483
2033 - 79 63,972 1,806 2,385 3,821 - 61,498
2040 - 49 88,102 2,156 3,693 5,241 - 84,312
2050 - 22 128,024 2,807 5,973 7,588 - 121,171
1 Total current service cost plus prior service contributions. 2 The special payments are based on a 15-year amortization period. The President of the Treasury Board may select a shorter
period of time over which to make payments. 3 As at 31 March 2016, this item includes $64 million of remaining contributions for pre-2007 Reserve Force service as well
as $57 million of receivable asset from the Reserve Force Plan for members that have rolled over to the Regular Force Plan.

APPENDIX 11 94
ACTUARIAL REPORT
Pension Plans for the CANADIAN FORCES as at 31 March 2016
Appendix 11 - Reserve Force Pension Fund Projection
Since the inception of the Reserve Force Plan on 1 March 2007, the plan has been financed
through the RFPF. Government and member contributions, investment earnings and prior service
contributions are added to the RFPF. Benefit payments and administrative expenses are
subtracted from the RFPF.
The results of the following projection were computed using the data described in Appendices 4
and 13, the methodology described in Appendix 5 and the assumptions described in Appendices
6 and 7.
The projection shows the expected growth of the RFPF if all assumptions are realized.
According to the projection, cash flows are expected to be positive until plan year 2044.
Emerging experience that differs from the corresponding assumptions will result in gains or
losses to be revealed in subsequent valuation reports.
Table 63 Reserve Force Pension Fund Projection
($ millions)
Plan
Year
Expected
Unrecognized
Investment
(Gains)/Losses
Present value of
prior service
contributions
Beginning
Market
Value of
Assets Contributions1 Payments
Investment
Earnings
Special
Payments2
Beginning
Actuarial
Liability
2017 (30) 25 5183 54 36 24 4 566
2018 (13) 23 564 54 31 28 5 608
2019 (1) 21 621 57 31 31 5 658
2020 (4) 19 683 60 32 36 5 714
2021 - 17 752 63 34 41 5 776
2022 - 16 827 66 35 46 5 845
2023 - 14 909 70 38 51 5 920
2024 - 12 998 74 40 56 5 1,001
2025 - 10 1,093 78 42 63 5 1,088
2026 - 8 1,198 82 44 71 5 1,185
2027 - 6 1,311 86 48 78 5 1,290
2028 - 4 1,434 91 51 87 5 1,404
2029 - 3 1,566 96 54 95 5 1,528
2030 - 2 1,708 101 58 104 5 1,661
2031 - 2 1,860 107 62 113 5 1,804
2032 - 1 2,023 113 67 123 5 1,957
2033 - 1 2,197 119 72 133 - 2,122
2040 - - 3,735 170 125 225 - 3,621
2050 - - 6,744 225 308 402 - 6,539
1 Total current service cost plus prior service contributions. 2 The special payments are based on a 15-year amortization period. 3 As at 31 March 2016, this item includes $42 million and $28 million of remaining contributions for processed and
unprocessed prior service and excludes $57 million of payable asset to the Regular Force Plan for members that have rolled
over to the Regular Force Plan.

APPENDIX 12 95
ACTUARIAL REPORT
Pension Plans for the CANADIAN FORCES as at 31 March 2016
Appendix 12 - Uncertainty of Results
A. Introduction
The projected financial status of the CFPF depends on many demographic and economic
factors, including new contributors, average earnings, inflation, level of interest rates and
investment returns. The projected long-term financial status of the CFPF is based on
best-estimate assumptions; the objective of this section is to present alternative scenarios.
The alternatives presented illustrate the sensitivity of the long-term projected financial
position of the CFPF to changes in the future economic outlook. In this appendix, any
references, in sections B and C, to assets, liabilities, surplus/(deficit), annual special
payments and service cost relate to the CFPF, unless indicated otherwise.
Section B examines the sensitivity of the CFPF to different asset allocations. Alternative
investment portfolios are described, along with the volatility of each portfolio and the
resulting impact on the CFPF’s funding ratio and current service cost. The impact of
financial market volatility on the financial status of the Pension Fund is explored in section
C, where severe one-time financial shocks are applied to three investment portfolios with
the purpose of quantifying the impact on the funding ratio over the short term. Lastly, the
impacts of prolonged low bond yields on the Superannuation Account and on the CFPF due
to slower than expected economic growth are analyzed in section D.
B. Sensitivity of Investment Policy
A major risk all pension plans face is funding risk – the risk that pension assets are
insufficient to meet pension obligations. If funding deficiencies or surpluses continue for an
extended period of time, risk is transferred from one generation to another and may
ultimately take the form of an increase or a decrease in the contribution rate.
Historically, equities have shown greater volatility than fixed income instruments (such as
bonds). Similarly, long-term bonds have historically shown greater volatility than shorter
fixed income instruments. For instance, in the twenty-five years ending in 2015, the
volatility (standard deviation) of Canadian equity returns (indicated by the S&P/TSX Total
Return Index) was 16.5%, as given in the Canadian Institute of Actuaries’ Report on
Canadian Economic Statistics 1924 – 2015. This compares with the volatility of returns of
long-term federal bonds (10+ years) of 9.9% and with the volatility of returns of medium-
term federal bonds (5-10 years) of 6.9% over the same period. Higher volatility of a
security’s returns implies a greater risk since the range of possible outcomes of returns
widens. Hence, equities are viewed as being more risky than bonds and long-term bonds are
viewed as more risky than medium- or short-term bonds.
Investing in a greater proportion of equities represents a higher level of risk and hence the
possibility of realizing a wider range of returns. Conversely, investing in lower risk fixed
income instruments will tend to produce lower returns.
The Regular Force Plan represents a long-term obligation to pay pension benefits. Thus, a
long-term approach must be taken to fund these obligations. Long-term Government of
Canada bonds are considered risk-free and their yields are considered low. The real yield on
long-term federal bonds was around 0.3% in March 2016. This is significantly below the
ultimate best-estimate real return on assets of 4.0% that is currently used to determine the
liabilities and contributions rates.
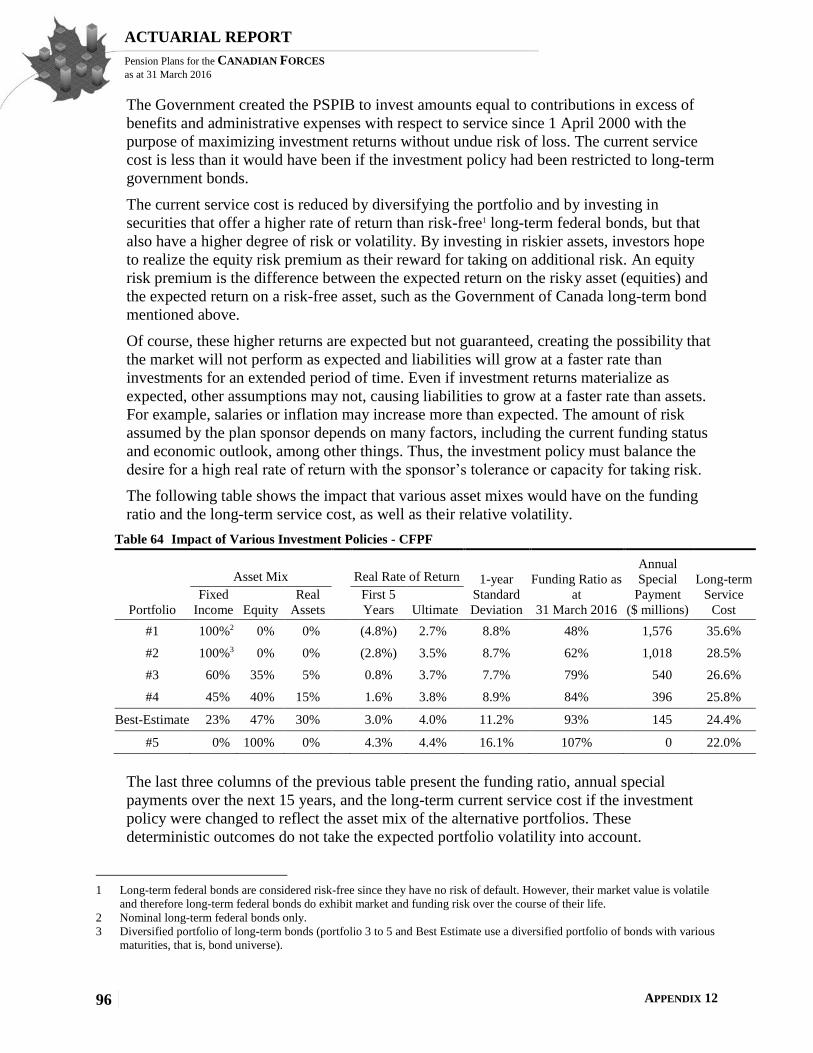
APPENDIX 12 96
ACTUARIAL REPORT
Pension Plans for the CANADIAN FORCES as at 31 March 2016
The Government created the PSPIB to invest amounts equal to contributions in excess of
benefits and administrative expenses with respect to service since 1 April 2000 with the
purpose of maximizing investment returns without undue risk of loss. The current service
cost is less than it would have been if the investment policy had been restricted to long-term
government bonds.
The current service cost is reduced by diversifying the portfolio and by investing in
securities that offer a higher rate of return than risk-free1 long-term federal bonds, but that
also have a higher degree of risk or volatility. By investing in riskier assets, investors hope
to realize the equity risk premium as their reward for taking on additional risk. An equity
risk premium is the difference between the expected return on the risky asset (equities) and
the expected return on a risk-free asset, such as the Government of Canada long-term bond
mentioned above.
Of course, these higher returns are expected but not guaranteed, creating the possibility that
the market will not perform as expected and liabilities will grow at a faster rate than
investments for an extended period of time. Even if investment returns materialize as
expected, other assumptions may not, causing liabilities to grow at a faster rate than assets.
For example, salaries or inflation may increase more than expected. The amount of risk
assumed by the plan sponsor depends on many factors, including the current funding status
and economic outlook, among other things. Thus, the investment policy must balance the
desire for a high real rate of return with the sponsor’s tolerance or capacity for taking risk.
The following table shows the impact that various asset mixes would have on the funding
ratio and the long-term service cost, as well as their relative volatility.
Table 64 Impact of Various Investment Policies - CFPF
Asset Mix
Real Rate of Return 1-year
Standard
Deviation
Funding Ratio as
at
31 March 2016
Annual
Special
Payment
($ millions)
Long-term
Service
Cost Portfolio
Fixed
Income Equity
Real
Assets
First 5
Years Ultimate
#1 100%2 0% 0% (4.8%) 2.7% 8.8% 48% 1,576 35.6%
#2 100%3 0% 0% (2.8%) 3.5% 8.7% 62% 1,018 28.5%
#3 60% 35% 5% 0.8% 3.7% 7.7% 79% 540 26.6%
#4 45% 40% 15% 1.6% 3.8% 8.9% 84% 396 25.8%
Best-Estimate 23% 47% 30% 3.0% 4.0% 11.2% 93% 145 24.4%
#5 0% 100% 0% 4.3% 4.4% 16.1% 107% 0 22.0%
The last three columns of the previous table present the funding ratio, annual special
payments over the next 15 years, and the long-term current service cost if the investment
policy were changed to reflect the asset mix of the alternative portfolios. These
deterministic outcomes do not take the expected portfolio volatility into account.
1 Long-term federal bonds are considered risk-free since they have no risk of default. However, their market value is volatile
and therefore long-term federal bonds do exhibit market and funding risk over the course of their life.
2 Nominal long-term federal bonds only.
3 Diversified portfolio of long-term bonds (portfolio 3 to 5 and Best Estimate use a diversified portfolio of bonds with various
maturities, that is, bond universe).

APPENDIX 12 97
ACTUARIAL REPORT
Pension Plans for the CANADIAN FORCES as at 31 March 2016
Portfolio #1 is invested in 10-year plus federal bonds. This portfolio does not result in a
feasible scenario due to its prohibitive cost. Other portfolios with lower volatility and higher
expected returns are available.
Portfolio #2 is invested in a marketable bond portfolio consisting of long-term federal,
provincial, corporate and real return bonds. This diversification into four bond asset
categories that are not perfectly correlated increases the real rate of return and reduces the
volatility compared to the first portfolio. This portfolio produces a higher real rate of return
compared to portfolio #1, while maintaining a lower current service cost. This is also a low
risk, low return portfolio. A portfolio with greater diversification in variable income assets
is required in order to keep funding cost to a lower level.
Portfolio #3 and portfolio #4 are more diversified than the first two portfolios and are
invested 35% and 40%, respectively, in equity. This diversification, into three broad asset
categories that are not perfectly correlated, combined with shorter fixed income maturities
increases the real rate of return earned on these portfolios and keeps their volatility
comparable to the first two portfolios. These portfolios have lower expected current service
cost than portfolio #1 and portfolio #2 due to their higher expected return. However, despite
an increased real return, these portfolios are still not sufficient to maintain the current
funded ratio and an increase in the plan’s current service cost would be required with both
portfolios.
Portfolio #5 is considered riskier because it is less diversified and has no allocation to fixed
income securities. This portfolio is heavily invested in equity, which has much more volatile
returns than bonds. Although this portfolio (portfolio #5) leads to the highest expected
return, the highest funding ratio and the lowest long-term service cost, its volatility is
significantly higher which may lead to significant additional contribution requirements as
illustrated in the next table.
Table 65 presents the expected median and 10 percent downside real returns over the next 3
years1, the resulting funding ratio, and the ensuing expected contributions assuming the plan
is fully funded as at 31 March 2016 under each portfolio. It further assumes that the ultimate
real rate of return applies for the full discounting period (no select period with lower real
rate of return and lower inflation).
1 The 10 percent downside real returns over the next 3 years represent the expected 10th percentile average return over that
period. That is, there is a 10% probability that the average real returns over the next 3 years will be lower than the 10
percent downside real returns.

APPENDIX 12 98
ACTUARIAL REPORT
Pension Plans for the CANADIAN FORCES as at 31 March 2016
Table 65 Median and 10% Downside Returns, Funding Ratio and Contributions for Various Portfolios -
CFPF
Portfolio
Expected Average
Annual Real Returns Funding Ratio Contributions (2019-20)
(2017-2019) 1 (31 March 2019) (% of pensionable payroll)
1-year
Standard
Deviation
Downside
10th Pct Median
Downside
10th Pct Median
Current Service
Cost (downside
and median)
Special
Payments
(downside)
Total
(downside)
#3 7.7% (2.0%) 3.7% 94% 100% 26.2% 4.0% 30.2%
#4 8.9% (2.9%) 3.8% 91% 100% 25.6% 5.5% 31.1%
Best-Estimate 11.2% (4.4%) 4.0% 86% 100% 24.4% 8.1% 32.5%
#5 16.1% (7.7%) 4.4% 77% 100% 22.3% 13.1% 35.4%
The previous table highlights the trade-off between risk and return as well as between
higher current service cost with low downside risk and lower current service cost and high
downside risk. A portfolio (portfolio #3) exhibiting low volatility of returns has a high
current service cost, but a low downside risk. Alternatively, a risky portfolio (portfolio #5)
would produce a much lower current service cost; however, the volatility of this portfolio is
quite high, resulting in significant downside risk and total downside contributions compared
to portfolio #3 and greater than the best-estimate portfolio. By investing in a diversified
portfolio, a reasonable current service cost can still be achieved along with lower volatility
and lower downside risk than portfolio #5, and therefore, a lower probability of significant
losses and large unforeseen additional contributions.
The best-estimate portfolio is invested 23% in fixed income securities, 47% in equity and
30% in real assets in the long-term, which is close to PSPIB’s current long-term asset-mix
objective. Such a portfolio produces an ultimate annual real return of 4.0% net of all
investment expenses (assumed to total 0.20% of assets) with a standard deviation of 11.2%.
C. Financial Market Tail Events
This section focuses on the volatility present in the best-estimate portfolio and the extreme
outcomes that could result. During plan year 2009, the nominal return on PSPIB assets was
(22.7%) due to the economic slowdown. Such an event could be characterized as low
probability (also referred to as a “tail event”). However, when these events do occur, the
impact on the funding ratio is significant. This section analyzes the impacts that tail events
returns would have on the Pension Fund’s funding ratio. To illustrate this, returns other than
the best-estimate are assumed to occur in plan year 2019. Two alternative portfolios were
selected from section B to show the potential variation in tail returns of a less risky
(Portfolio 4: 40% equity, 15% real assets, 45% fixed income) and a more risky (Portfolio 5:
100% equity) portfolio in relation to the best-estimate portfolio.
It is assumed that the returns of the three portfolios follow a normal distribution. The long-
term mean and annual standard deviation for each portfolio is given in Table 64. Returns at
two probability levels were selected to analyze: 1/10 and 1/50. The probabilities of earning
1 For illustration purposes, it is assumed that ultimate returns apply for the entire projection period. Annual returns are
assumed to follow a normal distribution and are assumed to be independent between the years (no mean reversion).

APPENDIX 12 99
ACTUARIAL REPORT
Pension Plans for the CANADIAN FORCES as at 31 March 2016
these returns can be thought of as once every 10 and 50 years, respectively. Since the
normal distribution has two tails, a left tail and a right tail, both were examined. The left tail
event is the occurrence of a nominal return such that the probability of earning that return or
less is equal to 1/10 (or 1/50). The right tail event is the occurrence of a nominal return such
that the probability of earning that return or more is equal to 1/10 (or 1/50).
For each portfolio a nominal return is calculated at the two probability levels. The nominal
returns are given in the following table.
Table 66 Tail Event Portfolio Returns - CFPF
Probability of
return1
Portfolio 4:
40% Equities/
45% Fixed Income/
15% Real Assets
Best-Estimate Portfolio:
47% Equities/
23% Fixed Income/
30% Real Assets Portfolio 5:
100% Equities
Tail Nominal Return Nominal Return Nominal Return
1/50 Left (12.2%) (16.4%) (25.4%)
1/10 Left (5.3%) (7.8%) (12.9%)
1/10 Right 17.7% 21.0% 28.3%
1/50 Right 24.6% 29.7% 40.8%
Table 67 shows the impact on the projected surplus/(deficit) as at 31 March 2019 (the
expected date of the next actuarial review) if the nominal return for plan year 2019 happens
to be equal to the returns presented in Table 66 for the best-estimate scenario. Following the
various portfolio returns in plan year 2019, it is assumed that the return will revert back to
its best-estimate value for plan year 2020.
Table 67 Sensitivity of the Projected CFPF Surplus/(Deficit) as at 31 March 2019
($ millions)
Assumption(s) Varied
Actuarial
Value of
Assets Liability
Surplus/
(Deficit)
Annual
Special
Payments2
None (i.e. current basis) 29,537 29,414 123 0
Investment return
- Left Tail event at 1/50th probability 25,823 29,414 (3,591) 366
- Left Tail event at 1/10th probability 28,435 29,414 (979) 89
- Right Tail event at 1/10th probability 30,419 29,414 1,005 0
- Right Tail event at 1/50th probability 32,523 29,414 3,109 0
D. Impact of Lower Bond Yields
This section explores the consequences of slower than expected economic growth through a
reduction in expected bond yields and variable income securities over the full projection
period. Current bond yields are much lower than their historical averages and, without
stronger economic growth, might well remain low over the next few years. Over the last 15-
and 50-year periods ending 31 December 2015, the average real yield of long-term
1 The probability of earning the positive returns in the table corresponds to the probability that the annual return is greater
than or equal to the indicated return. Similarly, the probability of earning the negative returns in the table corresponds to the
probability that the annual return is less than or equal to the indicated return. 2 Equal annual special payments to amortize the deficit over the next 15 years starting 31 March 2021

APPENDIX 12 100
ACTUARIAL REPORT
Pension Plans for the CANADIAN FORCES as at 31 March 2016
Government of Canada bonds was 2.1% and 3.2%, respectively. This is much higher than
the 0.3% real yield on long-term federal bonds as at March 2016. This section looks at the
impact of keeping the current 0.3% real yield for another year and reducing all subsequent
long-term federal bond yields by at least 0.3% prolonging the current period of low bond
yields for another year and reducing all subsequent long-term federal bond yields by 0.3%.
The best-estimate scenario assumes that the long-term federal bond real (nominal) yield
reaches its ultimate value of 2.7% (4.7%) at the beginning of plan year 2028. This scenario
assumes that economic growth will remain weak for another year and moderate thereafter.
Consequently, the long-term federal bond nominal yield would not increase above its
current level before the third year of projection, and would reach its ultimate real (nominal)
value of 2.4% (4.4%) at the beginning of plan year 2028. As a result, the new money rate
will also be affected and would be about 0.3% lower over the full projection period. In
addition, returns for equities and real assets would also be lower for the entire projection
period. Thus, returns would be 0.3% per year lower on average over the next 10 years and
thereafter than under the best estimate scenario.
Table 68 shows the impact that such a scenario would have on the expected short-term
investment returns and new money rate, as well as the impact on accrued liabilities and
annual special credits/payments required to fund the Superannuation Account shortfall and
the CFPF deficit.
Table 68 Impact on the Superannuation Account / CFPF of Prolonged Low Bond Yields
($ millions)
Superannuation Account Best-Estimate Low Bond Yields Difference
2017-2021 Average New Money Rate 2.8% 2.5% (0.3%)
2017-2026 Average New Money Rate 3.5% 3.2% (0.3%)
Total Actuarial Liability 47,385 48,104 719
Actuarial Excess/(Shortfall) (1,667) (2,386) (719)
Special Credits 152 218 66
CFPF Best-Estimate Low Bond Yields Difference
2017-2021 Average New Money Rate 5.0% 4.8% (0.2%)
2017-2026 Average New Money Rate 5.3% 5.0% (0.3%)
Total Actuarial Liability 24,048 25,302 1,254
Actuarial Surplus/(Deficit) (1,570) (2,824) (1,254)
Special Payments 145 270 125
Prolonging low bond yields for an additional year and reducing the ultimate long-term
federal bond yields by 0.3% result in higher actuarial liability and higher special
credits/payments for both, the Superannuation Account and the CFPF.

APPENDIX 13 101
ACTUARIAL REPORT
Pension Plans for the CANADIAN FORCES as at 31 March 2016
Appendix 13 - Detailed Information on Membership Data
In this appendix, the ‘Age’ and ‘Service’ nomenclature refers to completed years calculated at
the beginning of the plan year.
31 March 2016 31 March 2013
Average age: 38.1 38.4
Average pensionable service: 14.7 15.0
Annualized pensionable payroll3: $1,317,989,709 $1,243,420,040
Total PBDA
4 indexed reduction to basic annuity: $4,044,409 $4,149,135
Total PBDA4 indexed reduction adjustment: $705,478 $752,057
1 As defined in Note 1 of Appendix 2-D. 2 As at 31 March 2016 these members are treated as pensioners. 3 The aggregate pensionable earnings of all contributors with less than 35 years of pensionable service. 4 PBDA means the Pension Benefits Division Act.
Table 69 Regular Force Male Officers
Number and Average Annual Earnings1 as at 31 March 2016
Age 0-4 5-9 10-14 15-19 20-24 25-29 30-34 35+ All Years
of Service
15-19 326 326
$20,199 $20,199
20-24 890 313 1,203
$33,191 $60,136 $40,201
25-29 613 1,022 277 1,912
$56,854 $77,872 $86,519 $72,386
30-34 282 771 917 182 2,152
$63,725 $88,054 $96,551 $104,436 $89,872
35-39 93 355 747 775 146 2,116
$65,780 $91,141 $102,504 $107,163 $117,066 $101,695
40-44 60 153 360 536 659 200 1,968
$77,592 $92,178 $100,666 $110,325 $115,356 $120,133 $108,831
45-49 59 110 147 243 353 793 126 1,831
$81,424 $97,519 $103,153 $105,708 $115,564 $119,352 $127,148 $113,513
50-54 23 77 102 92 163 531 750 91 1,829
$87,459 $100,583 $103,562 $106,795 $112,829 $118,976 $120,872 $129,329 $117,078
55-59 3 37 36 29 53 119 264 126 667
$97,058 $118,241 $104,672 $106,138 $112,022 $112,834 $123,510 $118,103 $117,488
60+2 2 1 5 6 2 16
$72,579 $105,057 $91,170 $93,436 $130,817 $95,520
All Ages 2,349 2,840 2,587 1,862 1,374 1,643 1,146 219 14,020
$45,477 $83,010 $98,536 $107,540 $115,163 $118,854 $122,026 $122,884 $94,008

APPENDIX 13 102
ACTUARIAL REPORT
Pension Plan for the CANADIAN FORCES as at 31 March 2016
Table 70 Regular Force Male Other Ranks
Number and Average Annual Earnings1 as at 31 March 2016
Age 0-4 5-9 10-14 15-19 20-24 25-29 30-34 35+ All Years
of Service
15-19 934 934
$36,966 $36,966
20-24 5,366 652 6,018
$46,429 $60,916 $47,998
25-29 3,131 5,958 555 9,644
$49,768 $62,668 $65,380 $58,636
30-34 958 3,628 4,118 307 9,011
$51,325 $63,227 $66,609 $69,729 $63,729
35-39 328 1,310 2,797 2,400 141 6,976
$51,093 $63,437 $67,214 $70,485 $74,512 $67,020
40-44 138 546 1,015 1,619 1,417 348 5,083
$51,500 $62,867 $66,914 $70,242 $74,550 $77,570 $69,979
45-49 77 238 396 487 806 2,055 209 4,268
$53,294 $63,140 $65,811 $68,927 $73,073 $78,700 $81,809 $74,152
50-54 36 128 190 184 265 881 1,430 141 3,255
$51,417 $62,649 $65,585 $66,014 $69,709 $75,836 $81,475 $85,473 $76,289
55-59 10 33 46 51 68 115 274 190 787
$52,758 $64,302 $66,990 $67,682 $67,261 $71,088 $78,390 $81,765 $74,900
60+2 2 3 2 1 8
$75,160 $59,557 $67,993 $80,524 $68,188
All Ages 10,978 12,493 9,117 5,050 2,700 3,401 1,914 331 45,984
$47,277 $62,841 $66,700 $70,022 $73,432 $77,579 $81,069 $83,345 $63,297
31 March 2016 31 March 2013
Average age: 34.4 34.8
Average pensionable service: 11.4 11.9
Annualized pensionable payroll3: $2,910,652,558 $2,832,355,612
Total PBDA
4 indexed reduction to basic annuity: $6,181,203 $6,838,473
Total PBDA4 indexed reduction adjustment: $1,544,662 $1,797,924
1 As defined in Note 1 of Appendix 2-D. 2 As at 31 March 2016 these members are treated as pensioners. 3 The aggregate pensionable earnings of all contributors with less than 35 years of pensionable service. 4 PBDA means the Pension Benefits Division Act.
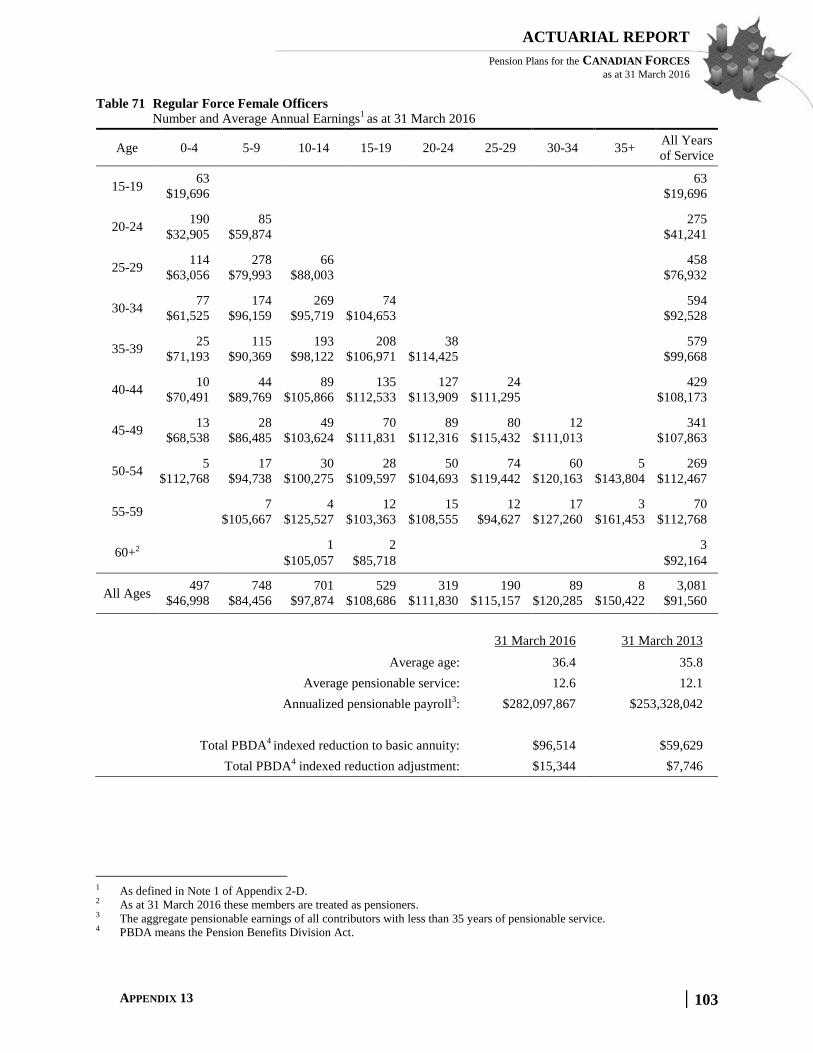
APPENDIX 13 103
ACTUARIAL REPORT
Pension Plans for the CANADIAN FORCES as at 31 March 2016
Table 71 Regular Force Female Officers
Number and Average Annual Earnings1 as at 31 March 2016
Age 0-4 5-9 10-14 15-19 20-24 25-29 30-34 35+ All Years
of Service
15-19 63 63
$19,696 $19,696
20-24 190 85 275
$32,905 $59,874 $41,241
25-29 114 278 66 458
$63,056 $79,993 $88,003 $76,932
30-34 77 174 269 74 594
$61,525 $96,159 $95,719 $104,653 $92,528
35-39 25 115 193 208 38 579
$71,193 $90,369 $98,122 $106,971 $114,425 $99,668
40-44 10 44 89 135 127 24 429
$70,491 $89,769 $105,866 $112,533 $113,909 $111,295 $108,173
45-49 13 28 49 70 89 80 12 341
$68,538 $86,485 $103,624 $111,831 $112,316 $115,432 $111,013 $107,863
50-54 5 17 30 28 50 74 60 5 269
$112,768 $94,738 $100,275 $109,597 $104,693 $119,442 $120,163 $143,804 $112,467
55-59 7 4 12 15 12 17 3 70
$105,667 $125,527 $103,363 $108,555 $94,627 $127,260 $161,453 $112,768
60+2 1 2 3
$105,057 $85,718 $92,164
All Ages 497 748 701 529 319 190 89 8 3,081
$46,998 $84,456 $97,874 $108,686 $111,830 $115,157 $120,285 $150,422 $91,560
31 March 2016 31 March 2013
Average age: 36.4 35.8
Average pensionable service: 12.6 12.1
Annualized pensionable payroll3: $282,097,867 $253,328,042
Total PBDA4 indexed reduction to basic annuity: $96,514 $59,629
Total PBDA4 indexed reduction adjustment: $15,344 $7,746
1 As defined in Note 1 of Appendix 2-D. 2 As at 31 March 2016 these members are treated as pensioners. 3 The aggregate pensionable earnings of all contributors with less than 35 years of pensionable service. 4 PBDA means the Pension Benefits Division Act.

APPENDIX 13 104
ACTUARIAL REPORT
Pension Plan for the CANADIAN FORCES as at 31 March 2016
Table 72 Regular Force Female Other Ranks
Number and Average Annual Earnings1 as at 31 March 2016
Age 0-4 5-9 10-14 15-19 20-24 25-29 30-34 35+ All Years
of Service
15-19 54 54
$37,834 $37,834
20-24 575 53 628
$46,153 $60,281 $47,345
25-29 554 680 48 1,282
$47,971 $61,739 $65,481 $55,929
30-34 270 611 510 43 1,434
$48,637 $62,190 $64,414 $68,410 $60,616
35-39 161 335 512 339 6 1,353
$48,382 $61,712 $64,820 $68,245 $69,977 $62,976
40-44 69 210 349 302 182 44 1,156
$49,280 $62,227 $64,984 $67,359 $69,676 $76,606 $65,347
45-49 36 100 216 148 160 264 19 943
$49,729 $60,785 $65,092 $67,397 $69,113 $76,608 $81,521 $68,648
50-54 14 67 116 87 84 150 121 5 644
$50,441 $60,488 $64,241 $66,008 $66,014 $72,604 $79,385 $88,155 $69,000
55-59 3 13 37 27 36 33 26 9 184
$42,466 $57,672 $59,876 $65,576 $64,402 $69,644 $76,801 $83,750 $66,470
All Ages 1,736 2,069 1,788 948 469 492 166 14 7,682
$47,294 $61,768 $64,647 $67,539 $68,404 $74,915 $79,225 $85,323 $61,547
31 March 2016 31 March 2013
Average age: 36.8 36.9
Average pensionable service: 11.0 11.1
Annualized pensionable payroll2: $472,802,042 $462,148,161
Total PBDA3 indexed reduction to basic annuity: $101,980 $70,120
Total PBDA4 indexed reduction adjustment: $28,427 $19,559
1 As defined in Note 1 of Appendix 2-D. 2 The aggregate pensionable earnings of all contributors with less than 35 years of pensionable service. 3 PBDA means the Pension Benefits Division Act.

APPENDIX 13 105
ACTUARIAL REPORT
Pension Plans for the CANADIAN FORCES as at 31 March 2016
31 March 2016 31 March 2013
Average age: 39.7 39.6
Average pensionable service: 9.0 6.0
Annualized pensionable payroll3: $60,068,961 $68,524,496
1 As defined in Note 1 of Appendix 1-D. 2 As at 31 March 2016 these members are treated as pensioners. 3 The aggregate pensionable earnings of all contributors with less than 35 years of pensionable service.
Table 73 Reserve Force - Male Officers
Number and Average Annual Earnings1 as at 31 March 2016
Age 0-4 5-9 10-14 15-19 20-24 25-29 30-34 35+ All Years
of Service
15-19 3 3
$15,672 $15,672
20-24 370 7 377
$12,449 $20,805 $12,604
25-29 440 304 12 756
$13,168 $16,364 $24,455 $14,633
30-34 152 342 91 17 602
$12,477 $14,770 $16,081 $15,341 $14,405
35-39 113 290 33 86 14 536
$10,797 $10,551 $14,321 $19,313 $22,382 $12,550
40-44 118 249 20 31 85 37 540
$11,809 $12,279 $14,230 $11,504 $17,855 $18,384 $13,500
45-49 130 247 10 13 32 86 19 537
$12,119 $13,786 $12,722 $17,659 $14,484 $24,222 $18,987 $15,353
50-54 105 215 11 18 17 26 66 20 478
$9,840 $11,448 $24,108 $18,908 $19,972 $24,156 $23,337 $21,055 $14,705
55-59 66 184 20 11 14 17 17 57 386
$9,141 $12,749 $20,366 $22,908 $22,516 $25,676 $19,669 $24,604 $15,795
60+2 33 127 10 9 3 3 10 17 212
$7,075 $9,235 $11,285 $16,344 $8,557 $6,434 $26,116 $12,849 $10,334
All Ages 1,530 1,965 207 185 165 169 112 94 4,427
$12,028 $13,066 $16,554 $17,553 $18,030 $22,764 $22,290 $21,723 $14,030

APPENDIX 13 106
ACTUARIAL REPORT
Pension Plan for the CANADIAN FORCES as at 31 March 2016
Table 74 Reserve Force - Male Other Ranks
Number and Average Annual Earnings1 as at 31 March 2016
Number and Average Annual Earnings2 as at 31 March 2016
Age 0-4 5-9 10-14 15-19 20-24 25-29 30-34 35+ All Years
of Service
15-19 285 285
$12,066 $12,066
20-24 3,098 404 3,502
$13,605 $15,449 $13,818
25-29 1,070 1,740 111 2,921
$14,086 $15,498 $14,878 $14,957
30-34 326 833 224 76 1,459
$13,768 $11,889 $14,090 $15,242 $12,821
35-39 194 312 34 133 44 717
$10,612 $12,029 $17,809 $14,960 $14,187 $12,596
40-44 119 248 11 34 130 77 619
$11,320 $8,995 $14,124 $15,951 $13,840 $13,821 $11,533
45-49 113 196 12 13 26 92 33 485
$9,845 $9,766 $9,350 $12,679 $14,731 $15,914 $16,754 $11,760
50-54 80 151 11 8 19 9 52 29 359
$9,780 $10,923 $14,868 $17,468 $12,447 $17,531 $16,169 $17,603 $12,481
55-59 40 84 9 9 7 16 8 30 203
$8,268 $10,741 $10,588 $6,620 $16,136 $16,462 $17,178 $13,840 $11,413
60+3 51 32 2 3 88
$5,794 $7,325 $7,363 $35,125 $7,386
All Ages 5,376 4,000 412 273 228 194 93 62 10,638
$13,221 $13,449 $14,416 $14,852 $13,906 $15,203 $16,463 $16,630 $13,494
31 March 2016 31 March 2013
Average age: 29.9 28.9
Average pensionable service: 6.3 4.5
Annualized pensionable payroll4: $142,515,113 $166,186,539
1 As defined in Note 1 of Appendix 1-D. 2 As defined in Note 1 of Appendix 1-D. 3 As at 31 March 2016 these members are treated as pensioners. 4 The aggregate pensionable earnings of all contributors with less than 35 years of pensionable service.
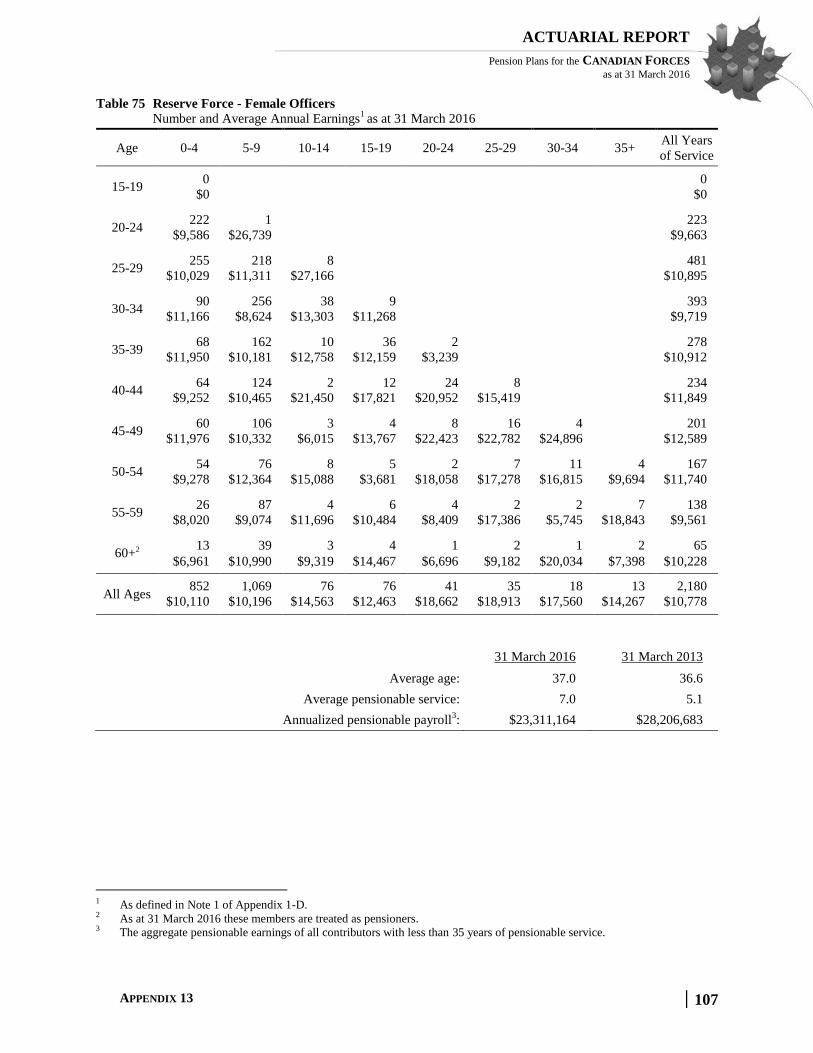
APPENDIX 13 107
ACTUARIAL REPORT
Pension Plans for the CANADIAN FORCES as at 31 March 2016
Table 75 Reserve Force - Female Officers
Number and Average Annual Earnings1 as at 31 March 2016
Age 0-4 5-9 10-14 15-19 20-24 25-29 30-34 35+ All Years
of Service
15-19 0 0
$0 $0
20-24 222 1 223
$9,586 $26,739 $9,663
25-29 255 218 8 481
$10,029 $11,311 $27,166 $10,895
30-34 90 256 38 9 393
$11,166 $8,624 $13,303 $11,268 $9,719
35-39 68 162 10 36 2 278
$11,950 $10,181 $12,758 $12,159 $3,239 $10,912
40-44 64 124 2 12 24 8 234
$9,252 $10,465 $21,450 $17,821 $20,952 $15,419 $11,849
45-49 60 106 3 4 8 16 4 201
$11,976 $10,332 $6,015 $13,767 $22,423 $22,782 $24,896 $12,589
50-54 54 76 8 5 2 7 11 4 167
$9,278 $12,364 $15,088 $3,681 $18,058 $17,278 $16,815 $9,694 $11,740
55-59 26 87 4 6 4 2 2 7 138
$8,020 $9,074 $11,696 $10,484 $8,409 $17,386 $5,745 $18,843 $9,561
60+2 13 39 3 4 1 2 1 2 65
$6,961 $10,990 $9,319 $14,467 $6,696 $9,182 $20,034 $7,398 $10,228
All Ages 852 1,069 76 76 41 35 18 13 2,180
$10,110 $10,196 $14,563 $12,463 $18,662 $18,913 $17,560 $14,267 $10,778
31 March 2016 31 March 2013
Average age: 37.0 36.6
Average pensionable service: 7.0 5.1
Annualized pensionable payroll3: $23,311,164 $28,206,683
1 As defined in Note 1 of Appendix 1-D. 2 As at 31 March 2016 these members are treated as pensioners. 3 The aggregate pensionable earnings of all contributors with less than 35 years of pensionable service.

APPENDIX 13 108
ACTUARIAL REPORT
Pension Plan for the CANADIAN FORCES as at 31 March 2016
Table 76 Reserve Force - Female Other Ranks
Number and Average Annual Earnings1 as at 31 March 2016
Age 0-4 5-9 10-14 15-19 20-24 25-29 30-34 35+ All Years
of Service
15-19 28 28
$13,650 $13,650
20-24 498 69 567
$15,705 $19,579 $16,177
25-29 220 358 24 602
$18,188 $16,028 $15,251 $16,786
30-34 61 162 70 15 308
$21,551 $15,710 $16,069 $5,761 $16,464
35-39 51 69 3 44 13 180
$18,620 $11,738 $2,275 $13,767 $17,039 $14,409
40-44 41 43 3 8 15 6 116
$16,759 $18,346 $17,976 $15,472 $25,909 $19,787 $18,630
45-49 35 32 1 5 3 15 7 98
$20,374 $18,864 $8,959 $26,334 $36,868 $15,926 $13,601 $19,409
50-54 25 27 4 1 3 6 13 3 82
$14,798 $17,484 $15,551 $18,815 $6,083 $18,913 $17,583 $15,662 $16,223
55-59 13 17 3 3 2 2 5 45
$23,459 $10,622 $31,369 $21,981 $21,081 $19,458
$14,820 $17,795
60+2 2 4 6
$7,066 $7,064 $7,065
All Ages 974 781 108 76 34 29 22 8 2,032
$17,000 $16,027 $15,897 $13,584 $21,735 $17,699 $16,487 $15,136 $16,516
31 March 2016 31 March 2013
Average age: 30.7 29.9
Average pensionable service: 6.5 5.0
Annualized pensionable payroll3: $33,439,523 $38,475,409
1 As defined in Note 1 of Appendix 1-D. 2 As at 31 March 2016 these members are treated as pensioners. 3 The aggregate pensionable earnings of all contributors with less than 35 years of pensionable service.

APPENDIX 13 109
ACTUARIAL REPORT
Pension Plans for the CANADIAN FORCES as at 31 March 2016
Table 77 Regular Force - Officer Male - Retirement Pensioners
Number and Average Annual Pension as at 31 March 2016
Immediate Annuity (includes PBDA,CPP if applicable)1 Deferred annuity
SA/CFPF RCA SA/CFPF RCA
Age Number Pension Number Pension Number Pension Number Pension
To 24 - - - - 47 799 - -
25-29 - - - - 48 3,762 - -
30-34 - - - - 57 11,257 - -
35-39 15 45,224 1 9,900 83 13,392 2 6,101
40-44 225 42,243 4 36,876 60 13,176 2 1,162
45-49 651 40,726 18 25,094 40 18,050 1 7,824
50-54 1,681 42,168 39 17,602 65 18,025 1 9,903
55-59 2,246 51,468 112 14,148 44 16,215 3 2,289
60-64 2,173 57,728 127 9,353 - - - -
65-69 2,168 46,240 96 5,288 - - - -
70-74 2,296 44,302 36 1,469 - - - -
75-79 1,813 45,926 4 537 - - - -
80-84 1,416 46,575 - - - - - -
90-94 527 41,380 - - - - - -
95-99 130 38,457 - - - - - -
100+ 9 33,508 - - - - - -
All Ages 16,348 $47,110 437 $10,596 444 $12,092 9 $4,347
31 March 2016 31 March 2013
Average age 67.4 67.7
Average age at retirement 48.3 48.1
Table 78 Regular Force - Officer Female - Retirement Pensioners
Number and Average Annual Pension as at 31 March 2016
Immediate Annuity (includes PBDA,CPP if applicable) 1 Deferred annuity
SA/CFPF RCA SA/CFPF RCA
Age Number Pension Number Pension Number Pension Number Pension
To 24 - $- - $- 12 $1,150 - $-
25-29 - - - - 10 3,790 - -
30-34 - - - - 25 9,111 - -
35-39 9 41,794 - - 26 13,377 1 8,491
40-44 77 41,582 1 29,228 15 9,560 3 2,169
45-49 118 36,406 8 23,992 11 17,436 - -
50-54 193 35,954 7 15,159 19 19,305 1 5,857
55-59 195 44,321 7 24,916 13 19,513 2 3,884
60-64 167 47,563 12 9,026 - - - -
65-69 135 38,310 4 4,585 - - - -
70-74 55 32,682 3 2,178 - - - -
75-79 36 36,743 - - - - - -
80-84 26 33,970 - - - - - -
90-94 22 28,809 - - - - - -
95-99 5 17,843 - - - - - -
100+ 2 21,821 - - - - - -
All Ages 1,064 $39,542 42 $15,116 131 $12,084 7 $4,089
31 March 2016 31 March 2013
Average age 57.8 59.6
Average age at retirement 45.2 46.2
1 Includes annual allowance adjustments, PBDA reductions and CPP coordination if in effect at the valuation date.
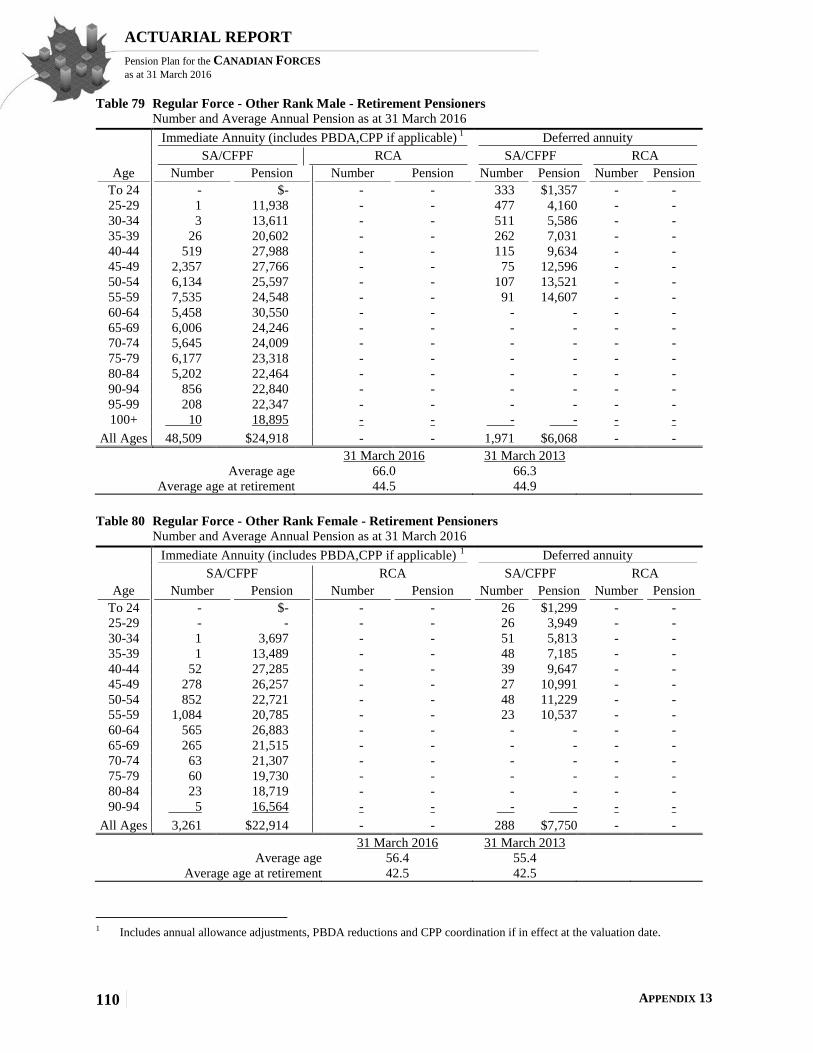
APPENDIX 13 110
ACTUARIAL REPORT
Pension Plan for the CANADIAN FORCES as at 31 March 2016
Table 79 Regular Force - Other Rank Male - Retirement Pensioners
Number and Average Annual Pension as at 31 March 2016
Immediate Annuity (includes PBDA,CPP if applicable) 1 Deferred annuity
SA/CFPF RCA SA/CFPF RCA
Age Number Pension Number Pension Number Pension Number Pension
To 24 - $- - - 333 $1,357 - -
25-29 1 11,938 - - 477 4,160 - -
30-34 3 13,611 - - 511 5,586 - -
35-39 26 20,602 - - 262 7,031 - -
40-44 519 27,988 - - 115 9,634 - -
45-49 2,357 27,766 - - 75 12,596 - -
50-54 6,134 25,597 - - 107 13,521 - -
55-59 7,535 24,548 - - 91 14,607 - -
60-64 5,458 30,550 - - - - - -
65-69 6,006 24,246 - - - - - -
70-74 5,645 24,009 - - - - - -
75-79 6,177 23,318 - - - - - -
80-84 5,202 22,464 - - - - - -
90-94 856 22,840 - - - - - -
95-99 208 22,347 - - - - - -
100+ 10 18,895 - - - - - -
All Ages 48,509 $24,918 - - 1,971 $6,068 - -
31 March 2016 31 March 2013
Average age 66.0 66.3
Average age at retirement 44.5 44.9
Table 80 Regular Force - Other Rank Female - Retirement Pensioners
Number and Average Annual Pension as at 31 March 2016
Immediate Annuity (includes PBDA,CPP if applicable) 1 Deferred annuity
SA/CFPF RCA SA/CFPF RCA
Age Number Pension Number Pension Number Pension Number Pension
To 24 - $- - - 26 $1,299 - -
25-29 - - - - 26 3,949 - -
30-34 1 3,697 - - 51 5,813 - -
35-39 1 13,489 - - 48 7,185 - -
40-44 52 27,285 - - 39 9,647 - -
45-49 278 26,257 - - 27 10,991 - -
50-54 852 22,721 - - 48 11,229 - -
55-59 1,084 20,785 - - 23 10,537 - -
60-64 565 26,883 - - - - - -
65-69 265 21,515 - - - - - -
70-74 63 21,307 - - - - - -
75-79 60 19,730 - - - - - -
80-84 23 18,719 - - - - - -
90-94 5 16,564 - - - - - -
All Ages 3,261 $22,914 - - 288 $7,750 - -
31 March 2016 31 March 2013
Average age 56.4 55.4
Average age at retirement 42.5 42.5
1 Includes annual allowance adjustments, PBDA reductions and CPP coordination if in effect at the valuation date.
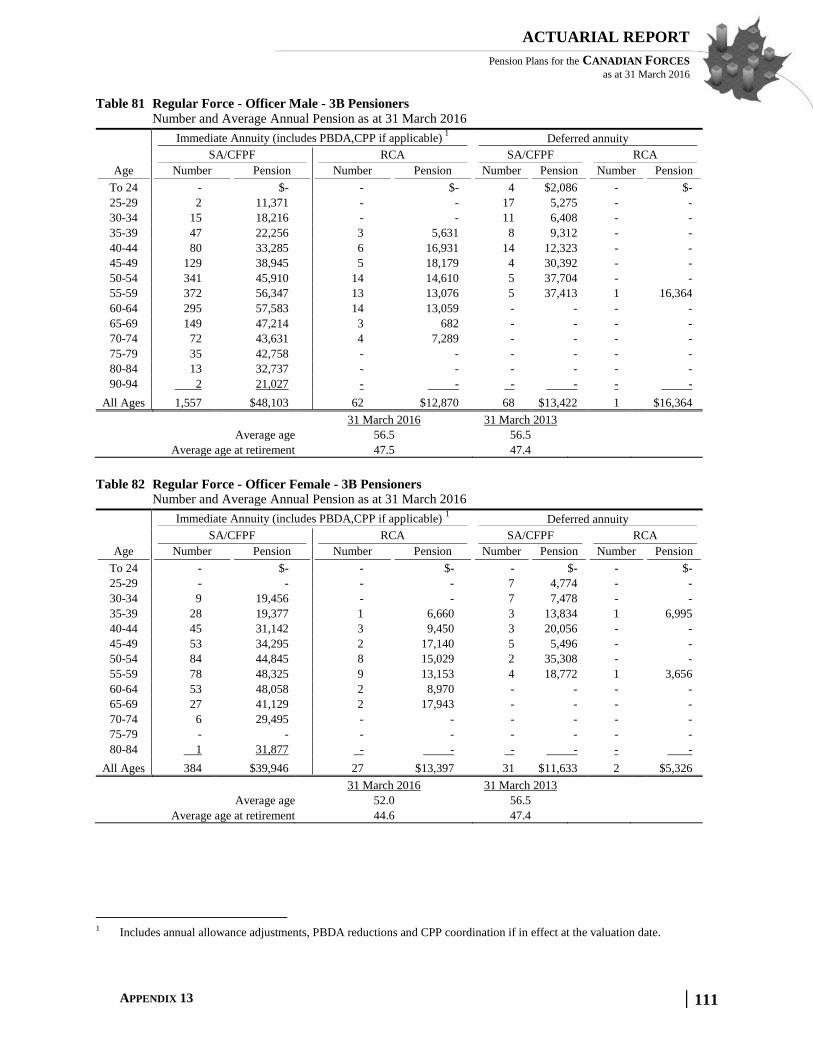
APPENDIX 13 111
ACTUARIAL REPORT
Pension Plans for the CANADIAN FORCES as at 31 March 2016
Table 81 Regular Force - Officer Male - 3B Pensioners
Number and Average Annual Pension as at 31 March 2016
Immediate Annuity (includes PBDA,CPP if applicable) 1
Deferred annuity
SA/CFPF RCA SA/CFPF RCA
Age Number Pension Number Pension Number Pension Number Pension
To 24 - $- - $- 4 $2,086 - $-
25-29 2 11,371 - - 17 5,275 - -
30-34 15 18,216 - - 11 6,408 - -
35-39 47 22,256 3 5,631 8 9,312 - -
40-44 80 33,285 6 16,931 14 12,323 - -
45-49 129 38,945 5 18,179 4 30,392 - -
50-54 341 45,910 14 14,610 5 37,704 - -
55-59 372 56,347 13 13,076 5 37,413 1 16,364
60-64 295 57,583 14 13,059 - - - -
65-69 149 47,214 3 682 - - - -
70-74 72 43,631 4 7,289 - - - -
75-79 35 42,758 - - - - - -
80-84 13 32,737 - - - - - -
90-94 2 21,027 - - - - - -
All Ages 1,557 $48,103 62 $12,870 68 $13,422 1 $16,364
31 March 2016 31 March 2013
Average age 56.5 56.5
Average age at retirement 47.5 47.4
Table 82 Regular Force - Officer Female - 3B Pensioners
Number and Average Annual Pension as at 31 March 2016
Immediate Annuity (includes PBDA,CPP if applicable) 1 Deferred annuity
SA/CFPF RCA SA/CFPF RCA
Age Number Pension Number Pension Number Pension Number Pension
To 24 - $- - $- - $- - $-
25-29 - - - - 7 4,774 - -
30-34 9 19,456 - - 7 7,478 - -
35-39 28 19,377 1 6,660 3 13,834 1 6,995
40-44 45 31,142 3 9,450 3 20,056 - -
45-49 53 34,295 2 17,140 5 5,496 - -
50-54 84 44,845 8 15,029 2 35,308 - -
55-59 78 48,325 9 13,153 4 18,772 1 3,656
60-64 53 48,058 2 8,970 - - - -
65-69 27 41,129 2 17,943 - - - -
70-74 6 29,495 - - - - - -
75-79 - - - - - - - -
80-84 1 31,877 - - - - - -
All Ages 384 $39,946 27 $13,397 31 $11,633 2 $5,326
31 March 2016 31 March 2013
Average age 52.0 56.5
Average age at retirement 44.6 47.4
1 Includes annual allowance adjustments, PBDA reductions and CPP coordination if in effect at the valuation date.

APPENDIX 13 112
ACTUARIAL REPORT
Pension Plan for the CANADIAN FORCES as at 31 March 2016
Table 83 Regular Force - Other Rank Male - 3B Pensioners
Number and Average Annual Pension as at 31 March 2016
Immediate Annuity (includes PBDA,CPP if applicable) 1
Deferred annuity
SA/CFPF RCA SA/CFPF RCA
Age Number Pension Number Pension Number Pension Number Pension
To 24 - $- - - 8 $2,247 - -
25-29 17 11,481 - - 106 6,092 - -
30-34 245 13,955 - - 110 7,239 - -
35-39 554 16,025 - - 69 9,468 - -
40-44 1,100 20,585 - - 33 9,510 - -
45-49 2,470 24,097 - - 28 14,895 - -
50-54 3,916 27,154 - - 22 10,706 - -
55-59 2,745 30,686 - - 17 11,281 - -
60-64 1,206 31,744 - - - - - -
65-69 759 23,413 - - - - - -
70-74 480 19,422 - - - - - -
75-79 423 17,537 - - - - - -
80-84 318 15,368 - - - - - -
90-94 28 15,698 - - - - - -
95-99 8 16,915 - - - - - -
All Ages 14,422 $25,367 - - 393 $8,324 - -
31 March 2016 31 March 2013
Average age 54.6 54.4
Average age at retirement 42.4 42.2
Table 84 Regular Force - Other Rank Female - 3B Pensioners
Number and Average Annual Pension as at 31 March 2016
Immediate Annuity (includes PBDA,CPP if applicable) 1 Deferred annuity
SA/CFPF RCA SA/CFPF RCA
Age Number Pension Number Pension Number Pension Number Pension
To 24 - $- - - 3 $3,356 - -
25-29 2 11,483 - - 25 5,431 - -
30-34 50 13,436 - - 29 6,428 - -
35-39 118 15,522 - - 27 7,809 - -
40-44 221 19,195 - - 22 8,669 - -
45-49 521 22,280 - - 22 11,766 - -
50-54 825 25,140 - - 13 8,578 - -
55-59 578 27,016 - - 13 13,715 - -
60-64 201 27,091 - - - - - -
65-69 44 20,659 - - - - - -
70-74 1 25,261 - - - - - -
75-79 1 25,189 - - - - - -
80-84 1 17,455 - - - - - -
All Ages 2,564 $23,854 - - 154 $8,328 - -
31 March 2016 31 March 2013
Average age 51.1 50.4
Average age at retirement 42.6 42.1
1 Includes annual allowance adjustments, PBDA reductions and CPP coordination if in effect at the valuation date.

APPENDIX 13 113
ACTUARIAL REPORT
Pension Plans for the CANADIAN FORCES as at 31 March 2016
Table 85 Reserve Force Officer Male - Retirement Pensioners
Number and Average Annual Pension as at 31 March 2016
Immediate annuity Deferred annuity
Age Number Pension Number Number
To 29 - $- 99 $726
30-34 - - 168 965
35-39 - - 138 1,302
40-44 - - 110 1,847
45-49 - - 121 2,574
50-54 9 6,795 116 4,745
55-59 50 11,535 127 4,040
60-64 238 6,511 - -
65-69 240 3,354 - -
70-74 40 2,715 - -
All Ages 577 $5,375 879 $2,266
31 March 2016 31 March 2013 31 March 2016 31 March 2013
Average age 64.4 63.5 42.3 41.5
Average age at retirement 60.8 62.3 39.4 39.6
Table 86 Reserve Force Officer Female - Retirement Pensioners
Number and Average Annual Pension as at 31 March 2016
Immediate annuity Deferred annuity
Age Number Pension Number Number
To 29 - $- 79 $442
30-34 - - 124 578
35-39 - - 61 940
40-44 - - 50 1,452
45-49 - - 40 2,793
50-54 7 1,821 36 1,871
55-59 13 8,036 41 2,885
60-64 46 6,480 - -
65-69 61 2,871 - -
70-74 6 2,757 - -
All Ages 133 $4,564 431 $1,238
31 March 2016 31 March 2013 31 March 2016 31 March 2013
Average age 64.0 63.3 38.8 38.0
Average age at retirement 60.8 61.0 35.7 35.9
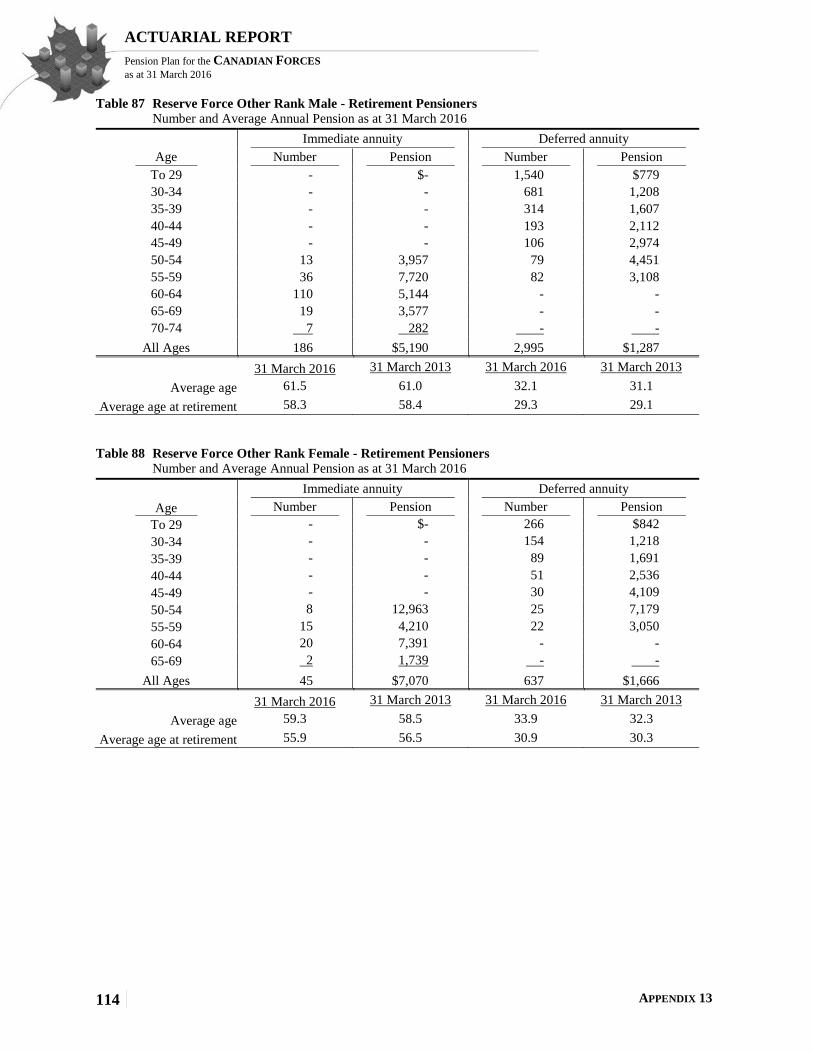
APPENDIX 13 114
ACTUARIAL REPORT
Pension Plan for the CANADIAN FORCES as at 31 March 2016
Table 87 Reserve Force Other Rank Male - Retirement Pensioners
Number and Average Annual Pension as at 31 March 2016
Immediate annuity Deferred annuity
Age Number Pension Number Pension
To 29 - $- 1,540 $779
30-34 - - 681 1,208
35-39 - - 314 1,607
40-44 - - 193 2,112
45-49 - - 106 2,974
50-54 13 3,957 79 4,451
55-59 36 7,720 82 3,108
60-64 110 5,144 - -
65-69 19 3,577 - -
70-74 7 282 - -
All Ages 186 $5,190 2,995 $1,287
31 March 2016 31 March 2013 31 March 2016 31 March 2013
Average age 61.5 61.0 32.1 31.1
Average age at retirement 58.3 58.4 29.3 29.1
Table 88 Reserve Force Other Rank Female - Retirement Pensioners
Number and Average Annual Pension as at 31 March 2016
Immediate annuity Deferred annuity
Age Number Pension Number Pension
To 29 - $- 266 $842
30-34 - - 154 1,218
35-39 - - 89 1,691
40-44 - - 51 2,536
45-49 - - 30 4,109
50-54 8 12,963 25 7,179
55-59 15 4,210 22 3,050
60-64 20 7,391 - -
65-69 2 1,739 - -
All Ages 45 $7,070 637 $1,666
31 March 2016 31 March 2013 31 March 2016 31 March 2013
Average age 59.3 58.5 33.9 32.3
Average age at retirement 55.9 56.5 30.9 30.3
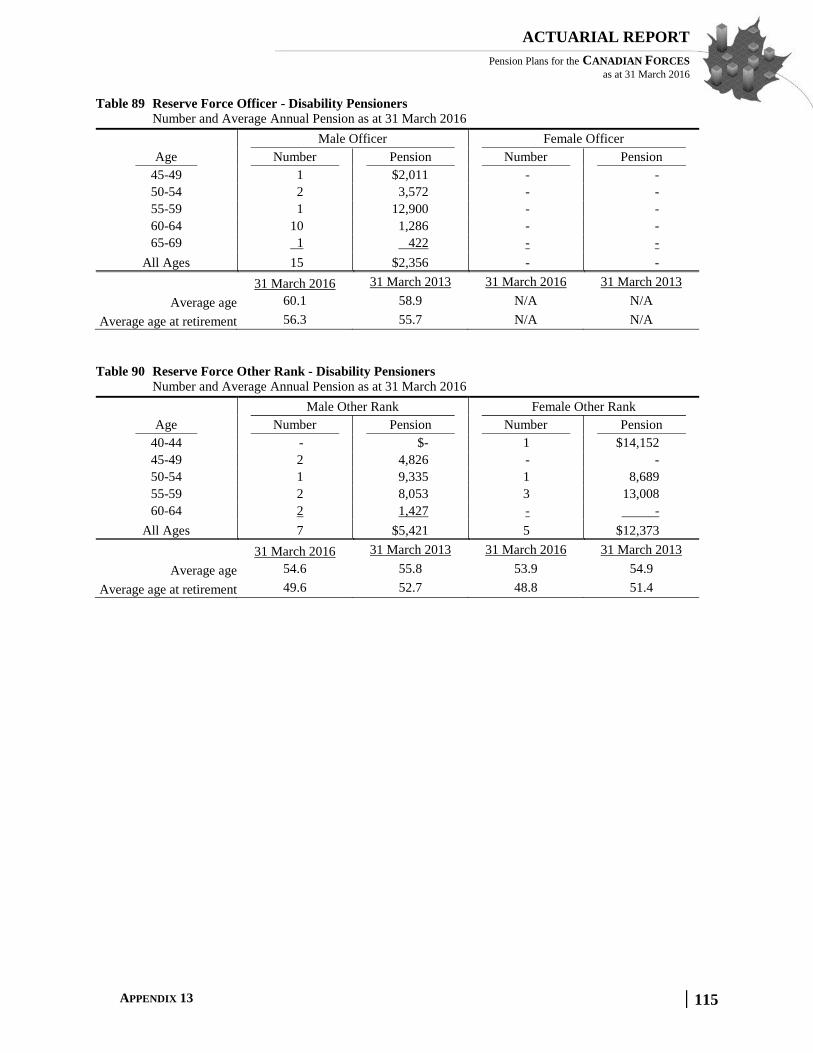
APPENDIX 13 115
ACTUARIAL REPORT
Pension Plans for the CANADIAN FORCES as at 31 March 2016
Table 89 Reserve Force Officer - Disability Pensioners
Number and Average Annual Pension as at 31 March 2016
Male Officer Female Officer
Age Number Pension Number Pension
45-49 1 $2,011 - -
50-54 2 3,572 - -
55-59 1 12,900 - -
60-64 10 1,286 - -
65-69 1 422 - -
All Ages 15 $2,356 - -
31 March 2016 31 March 2013 31 March 2016 31 March 2013
Average age 60.1 58.9 N/A N/A
Average age at retirement 56.3 55.7 N/A N/A
Table 90 Reserve Force Other Rank - Disability Pensioners
Number and Average Annual Pension as at 31 March 2016
Male Other Rank Female Other Rank
Age Number Pension Number Pension
40-44 - $- 1 $14,152
45-49 2 4,826 - -
50-54 1 9,335 1 8,689
55-59 2 8,053 3 13,008
60-64 2 1,427 - -
All Ages 7 $5,421 5 $12,373
31 March 2016 31 March 2013 31 March 2016 31 March 2013
Average age 54.6 55.8 53.9 54.9
Average age at retirement 49.6 52.7 48.8 51.4
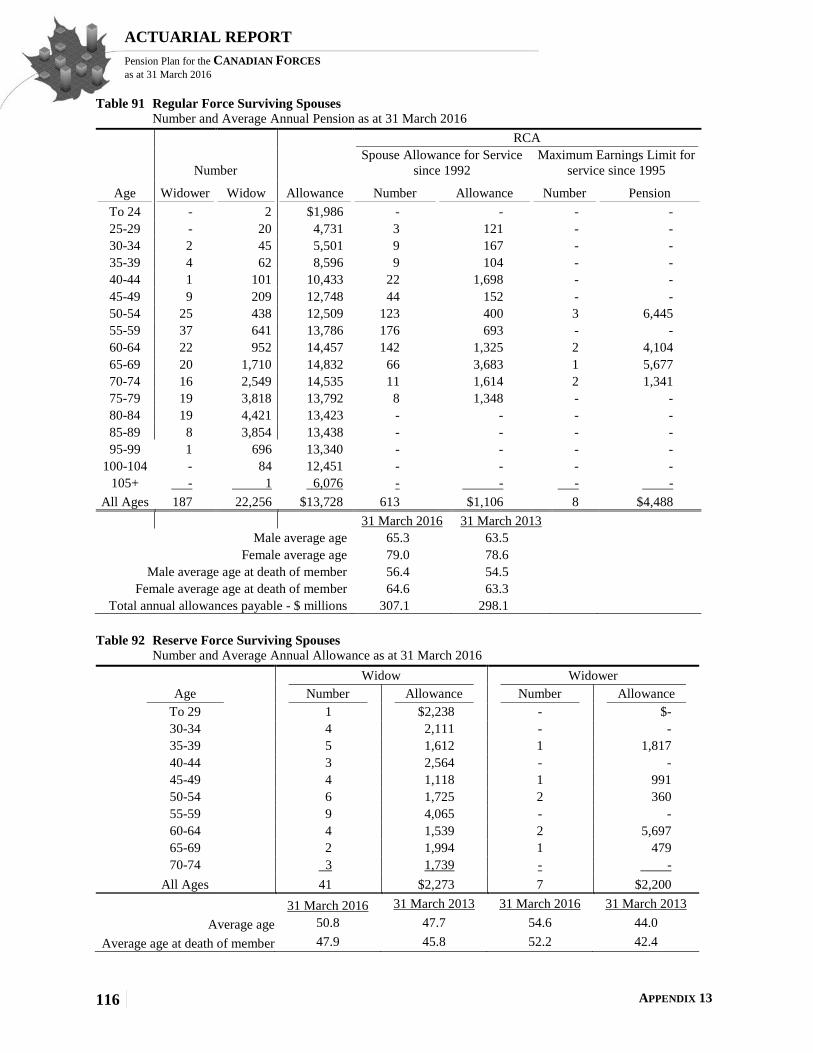
APPENDIX 13 116
ACTUARIAL REPORT
Pension Plan for the CANADIAN FORCES as at 31 March 2016
Table 91 Regular Force Surviving Spouses
Number and Average Annual Pension as at 31 March 2016
RCA
Number
Spouse Allowance for Service
since 1992
Maximum Earnings Limit for
service since 1995
Age Widower Widow Allowance Number Allowance Number Pension
To 24 - 2 $1,986 - - - -
25-29 - 20 4,731 3 121 - -
30-34 2 45 5,501 9 167 - -
35-39 4 62 8,596 9 104 - -
40-44 1 101 10,433 22 1,698 - -
45-49 9 209 12,748 44 152 - -
50-54 25 438 12,509 123 400 3 6,445
55-59 37 641 13,786 176 693 - -
60-64 22 952 14,457 142 1,325 2 4,104
65-69 20 1,710 14,832 66 3,683 1 5,677
70-74 16 2,549 14,535 11 1,614 2 1,341
75-79 19 3,818 13,792 8 1,348 - -
80-84 19 4,421 13,423 - - - -
85-89 8 3,854 13,438 - - - -
95-99 1 696 13,340 - - - -
100-104 - 84 12,451 - - - -
105+ - 1 6,076 - - - -
All Ages 187 22,256 $13,728 613 $1,106 8 $4,488
31 March 2016 31 March 2013
Male average age 65.3 63.5
Female average age 79.0 78.6
Male average age at death of member 56.4 54.5
Female average age at death of member 64.6 63.3
Total annual allowances payable - $ millions 307.1 298.1
Table 92 Reserve Force Surviving Spouses
Number and Average Annual Allowance as at 31 March 2016
Widow Widower
Age Number Allowance Number Allowance
To 29 1 $2,238 - $-
30-34 4 2,111 - -
35-39 5 1,612 1 1,817
40-44 3 2,564 - -
45-49 4 1,118 1 991
50-54 6 1,725 2 360
55-59 9 4,065 - -
60-64 4 1,539 2 5,697
65-69 2 1,994 1 479
70-74 3 1,739 - -
All Ages 41 $2,273 7 $2,200
31 March 2016 31 March 2013 31 March 2016 31 March 2013
Average age 50.8 47.7 54.6 44.0
Average age at death of member 47.9 45.8 52.2 42.4

APPENDIX 14 117
ACTUARIAL REPORT
Pension Plans for the CANADIAN FORCES as at 31 March 2016
Appendix 14 - Acknowledgements
The Department of National Defence provided relevant valuation input data on active members,
pensioners and survivors. Superannuation Directorate of the Department of Public Services and
Procurement Canada provided additional information in respect of pensioners and survivors.
The co-operation and able assistance received from the above-mentioned data providers deserve
to be acknowledged.
The following individuals assisted in the preparation of this report:
Alice Chiu, A.S.A.
François Lemire, F.S.A., F.C.I.A.
Véronique Ménard, F.S.A., F.C.I.A
Top Related