


Languages
Pages
Legal

Aalborg Universitet
Physical Modelling of Cyclic Laterally Loaded Pile in Cohesionless Soil
Hansen, Mette; Wolf, Torben K.; Rasmussen, Kristian L.; Roesen, Hanne Ravn; Ibsen, LarsBo
Publication date:2013
Document VersionPublisher's PDF, also known as Version of record
Link to publication from Aalborg University
Citation for published version (APA):Hansen, M., Wolf, T. K., Rasmussen, K. L., Roesen, H. R., & Ibsen, L. B. (2013). Physical Modelling of CyclicLaterally Loaded Pile in Cohesionless Soil. Department of Civil Engineering, Aalborg University. DCE TechnicalMemorandum No. 026
General rightsCopyright and moral rights for the publications made accessible in the public portal are retained by the authors and/or other copyright ownersand it is a condition of accessing publications that users recognise and abide by the legal requirements associated with these rights.
? Users may download and print one copy of any publication from the public portal for the purpose of private study or research. ? You may not further distribute the material or use it for any profit-making activity or commercial gain ? You may freely distribute the URL identifying the publication in the public portal ?
Take down policyIf you believe that this document breaches copyright please contact us at [email protected] providing details, and we will remove access tothe work immediately and investigate your claim.
Downloaded from vbn.aau.dk on: November 15, 2021

Department of Civil EngineeringISSN 1901-7278 DCE Technical Memorandum No. 026
Physical Modelling of Cyclic
Laterally Loaded Pile in
Cohesionless Soil
Mette Hansen
Torben Kirk Wolf
Kristian Lange Rasmussen
Hanne Ravn Roesen
Lars Bo Ibsen

DCE Technical Memorandum No. 026
Physical Modelling of Cyclic Laterally Loaded
Pile in Cohesionless Soil
by
Mette Hansen Torben Kirk Wolf
Kristian Lange Rasmussen Hanne Ravn Roesen
Lars Bo Ibsen
June 2013
© Aalborg University
Aalborg University Department of Civil Engineering

Scientific Publications at the Department of Civil Engineering
Technical Reports are published for timely dissemination of research results and scientific work
carried out at the Department of Civil Engineering (DCE) at Aalborg University. This medium
allows publication of more detailed explanations and results than typically allowed in scientific
journals.
Technical Memoranda are produced to enable the preliminary dissemination of scientific work by
the personnel of the DCE where such release is deemed to be appropriate. Documents of this kind
may be incomplete or temporary versions of papers—or part of continuing work. This should be
kept in mind when references are given to publications of this kind.
Contract Reports are produced to report scientific work carried out under contract. Publications of
this kind contain confidential matter and are reserved for the sponsors and the DCE. Therefore,
Contract Reports are generally not available for public circulation.
Lecture Notes contain material produced by the lecturers at the DCE for educational purposes. This
may be scientific notes, lecture books, example problems or manuals for laboratory work, or
computer programs developed at the DCE.
Theses are monograms or collections of papers published to report the scientific work carried out at
the DCE to obtain a degree as either PhD or Doctor of Technology. The thesis is publicly available
after the defence of the degree.
Latest News is published to enable rapid communication of information about scientific work
carried out at the DCE. This includes the status of research projects, developments in the
laboratories, information about collaborative work and recent research results.
Published 2013 by
Aalborg University
Department of Civil Engineering
Sohngaardsholmsvej 57,
DK-9000 Aalborg, Denmark
Printed in Aalborg at Aalborg University
ISSN 1901-7278
DCE Technical Memorandum No. 026

Recent publications in the DCE Technical Memorandum Series

Physical Modelling of Cyclic Laterally Loaded Pile in Cohesionless Soil
M. Hansen1, T. K. Wolf
1, K. L. Rasmussen
2, H. R. Roesen
3 and L. B. Ibsen
3
1 COWI, Lyngby, Denmark 2 Niras, Aalborg, Denmark
3Department of Civil Engineering, Aalborg University, Denmark
ABSTRACT
Offshore wind turbines are placed in a rough environment, subjected to
variable lateral loads, mostly from wind and waves. A long-term lateral
loading may create rotation (tilt) of the pile by change in the soil-pile
system which is critical in the serviceability limit state. The
accumulated rotation due to long-term lateral loading is therefore a
current issue of interest as today's design guidances have little
knowledge in this area. The cost of large-scale testing is extensive
which make small-scale testing desirable as a tool for describing the
behaviour of a soil-pile system subjected to lateral load. In this paper
small-scale testing of a pile subjected to cyclic, lateral loading is treated
in order to investigate the effect of cyclic loading. The test pile has a
diameter of 100 mm and is 600 mm high, making the slenderness ratio
6, which resembles the ratio of offshore wind turbines today. The test
pile is placed in saturated dense sand. A monotonic test is conducted to
define the ultimate lateral capacity. Afterwards a cyclic test is
conducted to investigate the accumulation of rotation when the pile is
subjected to cyclic lateral load. Force and displacement during both
tests are recorded to determine the deformation of the pile. Comparing
the responses of the monotonic and the cyclic test, the cyclic test shows
a stiffer response. During the cyclic test, the rotation of the pile
accumulates with decreasing rotation increments. However, no
stabilised situation occurs. The measured data is compared to theories
on degradation, agreeing that the accumulated rotation as an estimate
can be express by both a logarithmic and exponential expression.
Comparing the results from the cyclic test with results from other
recent small-scale tests shows agreement in the accumulation of
rotation with decreasing rotation increments with no stabilising
situation.
KEY WORDS: small-scale; model; tests; monopiles; cyclic; long-
term; sand.
INTRODUCTION
The monopile foundation is the most commonly used foundation for
wind turbines. These foundations often have a diameter of 4 - 6 m and a
slenderness ratio, the ratio between the length and the diameter of the
pile, of approximately 5 as the normal embedded length is 20 - 30 m.
Long-term lateral loading of piles is an area on which the recent design
guidances have little knowledge. It is of current interest since the long-
term loading may create rotation (tilt) of the pile by change in the soil-
pile system which is critical in the serviceability limit state (SLS).
The issue is rather complex as many parameters seem to influence the
behaviour of the soil-pile system. Parameters such as load
characteristic, number of load cycles and their amplitudes, and soil
parameters are all possible to affect this system. Theory on the subject
of cyclically loaded piles in sand have among others been presented by
Long and Vanneste (1994) and Lin and Liao (1999) in terms of
degradation factors. These are implemented in determining deformation
of the pile by means of soil density, installation method of the pile, and
load ratio. The theories are simple and give an estimate on
deformations based on relatively few full-scale experiments with no
more than 500 load cycles. As full-scale testing is comprehensive
experimental studies in small-scale testing is pursued. In the following,
the more recent work in small-scale testing in sand by Peng et al.
(2006), Peralta and Achmus (2010), LeBlanc et al. (2010) and Roesen
et al. (2011b) is outlined.
In order to further investigate the subject of long-term lateral loading a
small-scale experiment of a pile placed in saturated soil is conducted.
First a monotonic loading is applied to the pile to determine the
ultimate capacity. Based on the capacity, a cyclic load is chosen and the
pile is subjected to one-way cyclic loading. The test results are
compared with the theoretical basis for determining effects of cyclic
load.
RECENT SMALL-SCALE CYCLIC TESTING
Peng et al. (2006) subjects a pile with a diameter of 44.5 mm and a
slenderness ratio of 9 to two-way loading. The load scenarios are both
balanced and unbalanced. The pile is placed in dry sand with a relative
density, Dr = 0.72. Based on a few tests subjected to approximately
10000 load cycles they reach the conclusion that the soil-pile system
will keep deforming with increase in number of cycles. They also

2
observe that larger deformation is caused by unbalanced loading in
comparison with balanced loading.
Peralta and Achmus (2010) investigate one-way loading of piles with a
diameter of 60 mm and varying length, describing slenderness ratios
from 3.2 to 8.3. The tests are conducted in dry sand with Dr from 0.4 to
0.6. Also Peralta and Achmus (2010) experience a continuous
deformation after 10 000 load cycles. They fit their results to a power
and a logarithmic expression and they conclude that the deformation of
the rigid piles fit the power function best and the more slender piles fit
the logarithmic function.
LeBlanc et al. (2010) perform both one- and two-way loading of a 80
mm wide pile with a slenderness ratio of 4.5. The sand has Dr of 0.04
and 0.38. In several of their tests the pile is loaded with 8000 to 9000
cycles, for a few tests approximately 18000 cycles are applied and one
test is conducted with 65000 cycles. In agreement with Peng et al.
(2006) and Peralta and Achmus (2010) they conclude that the system
keeps deforming with increase in number of load cycles. They find that
a power function fit their data best.
Roesen et al. (2011b) conduct a cyclic loading test of a 100 mm wide
pile with a slenderness ratio of 6. The test is of one-way loading. The
pile is placed in saturated sand with relative density between 0.78 to
0.87. Approximately 46 000 load cycles is applied. In contrast to the
previous tests Roesen et al. (2011b) present results where the
accumulation in rotation of the pile stabilises. This happens after
approximately 15 000 load cycles.
EXPERIMENTAL PROGRAMME
Before the cyclic load test a monotonic load test is carried out. A
monotonic load is applied until a predetermined rotation of of the pile
of 3° is reached. The load at this rotation will by defined as the ultimate
lateral capacity. The ultimate limit state (ULS) load is used to
determine the cyclic load. The size of the maximum force in a load
cycle is determined based on LeBlanc et al. (2010). The load
characterising fatigue limit state (FLS) and the serviceability limit state
(SLS) is presented by (LeBlanc et al., (2010) as 28 to 45% of the ULS,
respectively. The cyclic test is carried out as a one-way long-term
lateral loading. The test setup is capable of producing more than 40 000
load cycles.
Test Setup
The test setup is developed based on the test setup by LeBlanc et al.
(2010) with some geometric deviations. For cyclic lateral loading the
load characteristics are defined by the ratios ζb and ζc (LeBlanc et al.,
2010). ζb describes the ratio between the maximum cyclic moment,
Mmax and the maximum static moment capacity, MS. ζc describes the
ratio between maximum and minimum moment, Mmin, of a load cycle,
cf. Eq.1. A list of symbols is in the back of the article.
S
maxb
M
M=ζ
,
max
minc
M
M=ζ (1)
The tests are conducted in a cylinder shaped, steel container which has
a diameter of 2000 mm and a depth of 1200 mm, cf. Fig. 1. The bottom
of the container is equipped with equally distributed pipes and 300 mm
gravel, used as draining material, which is covered with a sheet of
geotextile. The pipes are perforated making a drainage system to ensure
a homogeneous and saturated soil. Water level is at all times kept 20 -
40 mm above the soil surface.
Fig. 1: Sketch of the test setup for cyclic loading with dimension in
mm. F1 and F2 denote the force transducers and H1, H2 and H3 denote
the horizontal displacement transducers. m1, m2 and m3 are the
weights of mass.
Two different loading systems are used for the static and the cyclic load
tests. The static test is conducted, by means of a motor attached to the
load frame 600 mm above the soil surface, pulling the pile through a
steel wire in a monotonic movement at a speed of 0.02 mm/s. The steel
wire is connected to the pile via a load transducer fixated to the pile.
For the static test one horizontal and two vertical displacement
transducers are attached to the pile to determine the rotation of the pile,
as presented by Roesen et al. (2011a). A different setup with three
horizontal displacement transducers, H1, H2 and H3 is used for the
cyclic test, cf. Fig. 1. They are placed 600 mm, 382.5 mm and 165 mm
above the soil surface, respectively.
The loading system for creating cyclic load is based on the test setup by
LeBlanc et al. (2010) and is a simple mechanical system of weights
connected by steel wires to control the loading of the pile. A load frame
with pulleys is fixated to the container connecting the masses m1, m2
and m3 via the wires, cf. Fig. 1. The wires also connect the masses to a
lever on which a motor, providing a rotating behaviour of m3, is
attached. The lever is attached to the load frame by a pivot. Initially,
the weight of m1 is chosen sufficiently to outbalance the weight of this
lever, creating an outer system in balance. Masses m2 and m3 are each
attached to the pile through load transducers with wires at 600 mm
above the soil surface and provide the opportunity of different load
scenarios as they control the cyclic load characteristic: m2 controls ζb
and thereby the average cyclic moment where m3 controls the cyclic
amplitude, expressed by ζc. The wire to the outer left is for safety,
carrying no weight during the test. The motor produces a sinusoidal
long-term cyclic behaviour and to simulate environmental load a
rotation frequency of 0.1 Hz is used for the cyclic test (Peng et al.,
2006).
The two load transducers attached through wires to m2 and m3 measure
the actual load that the pile is subjected to. For static loading only one
load transducer is used. All measurement equipment is connected to a
PC-based data acquisition HBM Spider which transfers measuring data
to the computer. Time, forces and horizontal displacements are
recorded with a sampling rate of 1 Hz during long-term cyclic loading.
During the static tests the sampling rate is 2 Hz.

3
Procedure
The pile used in the tests is an aluminium, hollow cylinder with an
outer diameter of 100 mm and a slenderness ratio of 6. The pile is
installed in the middle of the container with a motor identical to that
applying the load under static loading and at the same speed. For the
static test a wire is mounted at 600 mm above soil surface. The pile is
pulled to a rotation of 3 degrees, then unloaded completely, and
reloaded to a rotation higher than 3 degrees. To out-balance the lever in
the cyclic test the counterbalance m1 = 27 kg. Once the outer system is
in balance the wires are mounted for the cyclic test also in a height of
600 mm above soil surface.
The maximum force during a load cycle is, preferably, 35% of the ULS
load, which is the load resembling FLS. A one-way loading is desired.
The combination of the weights is chosen to reach a maximum load of
35% of the ultimate capacity and a minimum load of 5 - 10 % of the
ultimate capacity. To correspond the load a weight of m2 = m3 = 12 kg
is placed on the rig.
Soil Conditions
The container is filled with 300 mm of gravel and 800 mm of sand. The
tests are conducted in fully saturated soil. The sand used in the test
setup is Aalborg University Sand No. 1 (Baskarp Sand No. 15).
Material properties can be seen in Table 1.
Table 1 Material properties for University Sand No. 1
Specific grain
density
sd
[g/cm3]
Maximum
void ratio
maxe
[-]
Minimum
void ratio
mine
[-]
50%-
quantile
50d
[mm]
Uniformity
coefficient
10050 / ddU =[-]
2.64 0.858 0.549 0.14 1.78
Homogeneity of the soil is important for the interpretation of soil
parameters and for comparison of test results. Therefore, the soil is
loosened by applying an upward gradient of 0.9 and hereafter the soil is
prepared for testing by vibrating it so the sand will compact. Water
level will at all times be kept above the soil surface. When vibrating,
the water level is approximately 100 mm above the soil surface to
ensure no air enters the soil. The gravel in the bottom of the container
ensures proper drainage conditions and a homogeneous in-flow.
Prior to the load tests cone penetration tests (CPT) are conducted to
evaluate the state of the soil. A mini cone with a diameter of 15 mm is
pushed through the sand with a velocity of 5 mm/s. The cone penetrates
approximately 360 mm down into the soil. A change in piston
equipment before the cyclic test made it possible to penetrate further,
400 mm. For the static and the cyclic test three CPTs are conducted for
each: One in the middle of the container and one to each side in a
distance of 500 mm from the middle. An additional CPT test of nine
CPTs is conducted to evaluate the variations in homogeneity and the
compaction of the sand. All CPTs are made in a straight line parallel to
the direction of the force. From the CPTs the cone resistance is
obtained, cf. Fig. 2. The CPT cone is very sensitive and a proper cone
resistance is first obtained when the resistance stabilises.
Fig. 2 Cone resistance for the nine CPTs taken additionally. The CPTs
are taken in order from the passive side to the active side.
Fig. 2 shows a good resemblance among the CPTs and a smooth linear
increase except for CPT 1 and CPT 9. CPT 1 shows much higher
resistance and both CPT 1 and CPT 9 are more uneven in their shapes.
These two CPTs are made closest to the edge of the container and are
clearly affected hereby. The compaction of the sand may be different as
the preparation of the sand with the vibration device is difficult along
the sides. For CPT 2 to CPT 8 the soil behaves very similar and
uniform and are thereby presentable data for determining soil
parameters. Also, the resemblance in the cone resistance for those
seven CPTs supports using three CPTs to obtain suitable data for the
static test and the cyclic test.
The cone resistance is basis of further determination of soil parameters.
An iterative process proposed in (Ibsen et al., 2009), Eqs. 2 to 5, is the
first step in finding soil parameters.
wws
e
eSdγγ
++
=1
(2)
xw )('1 γγσ −= (3)
3
1
12
'c
cc
rq
cD
=
σ (4)
minmax
maxr
ee
eeD
−−
= (5)
where the degree of saturation, Sw = 1 and x is the depth. From Eqs. 2
to 5 the unit weight, γ, the void ratio, e, and thereby the relative density,
Dr, are derived. For both the static and the cyclic test the relative
densities are shown, cf. Fig. 3. qc is the cone resistance, σ’1 is the
vertical effective stress and c1, c2 and c3 are coefficients, 0.75, 5.14 and
0.42 respectively, to determine the relative density from the mini-CPT.

4
Fig. 3 The relative density of the sand for the static test and the cyclic
test in green and red shades, respectively.
The three relative densities obtained from the CPTs taken before the
static test are plotted in red shades and the ones made before the cyclic
test are shades of green. Near the soil surface very large fluctuations are
observed which is a clear sign that the CPT cone has not stabilised.
Proper cone resistances are obtained after approximately 150 mm and
values obtained above this depth are disregarded. A combined mean
relative density for all three CPTs is made for each test. This is done
separately for the relative densities above and below 150 mm under soil
surface, cf. Fig. 3. This clearly illustrates that the values obtained above
this limit differ from the more stabilized values below the limit. One
mean value is used as representative for the entire soil layer and these
are determined on behalf of values obtained from 150 mm below the
soil surface and down. The mean relative density for the two tests, µ,
are given in Table 2. The standard deviations, σ, are also shown. It
should be noted that the standard deviations are not used in any further
calculations, as the parameters are not normally distributed. The values
are presented for comparability only.
An interesting observation, cf. Fig. 3, is that the relative density seems
to decrease slightly with depth. This behaviour is especially
pronounced for the CPT made before the cyclic test. Due to overburden
pressure the opposite effect would be expected. This decrease may be
caused by the sand being a young deposit. Further vibration and
thereby a better compaction may create an increasing relative density
with soil depth.
Table 2 Mean value, µ, and standard deviation, σ, of soil parameters of
Aalborg University No. 1.
Test Statistical
parameter
Dr
[-]
e
[-] γ
[kN/m3]
Static µ
σ
0.74
0.01
0.63
0.00
10.3
0.1
Cyclic µ
σ
0.79
0.02
0.61
0.00
10.8
0.2
The strength parameters of the sand are calculated using formulas
derived in Ibsen et al. (2009), cf. Eqs. 6 to 8. These expressions are
derived for Aalborg University Sand No. 1 at confining pressures, σ’3, in the range of 5 kPa to 800 kPa. As σ’3 is outside this range over the
entire depth of the setup, σ’3 is set to 5 kPa in the derivation of the
strength parameters. This is considered a better estimation than using
confining pressures outside the range of validity of the formulas. The
results are shown in Table 3.
21233927152028070
3 .'.D..
rtr ++= −σϕ (6)
946986141950
0976403 .'.D.
.rtr −+= −σψ
(7)
5230320 .D.c r +=
(8)
Table 3 Mean value, µ, and standard deviation, σ, of strength
parameters evaluated on basis of CPT test.
Test Statistical
parameter ϕ
[°]
ψ
[°]
c
[kPa]
Static µ
σ
51.9
0.1
17.2
0.2
5.9
0.0
Cyclic µ
σ
52.6
0.2
18.1
0.3
6.0
0.0
TESTING RESULTS
Initially, the static test is run to determine the ultimate load capacity of
the laterally loaded pile. The pile is loaded in a monotonic movement
and the force-rotation relationship is shown in Fig. 4. At a force of
approximately 400 N a break on the curve appears. A reason for the
break may be found in the test setup. A small chain connects the wire
from the motor to the pile. A slip between two links in this chain may
have caused the break. The failure load is defined at a rotation of 3°.
Thus, the ultimate capacity is approximate 660 N. The pile is
afterwards un- and reloaded. The reloading curve continues to increase
in force after having crossed the maximum force of the first load curve.
Fig. 4 The force-rotation relationship in the static test with failure
determined at 3°.
The load applied as m3 for the cyclic test is determined to 12 kg.
Friction in the setup can affect the system. Though, this mass is
considered sufficient. Before the test is run the system is in balance.
The load transducers are reset and the oscillation in load from the
cyclic movement is obtained, cf. Fig. 5. The force measured from the
sinusoidal loading shows similar, even load cycles for force 1, F1. A
small sinusoidal behaviour is obtained from the load transducer, i.e.
force 2, due to friction in the test setup or perhaps due to noise in the
measurements. Force 2, F2, should remain constant during the test.

5
However, the variation is little and will not affect the interpretation, as
the resulting force, F, affecting the pile is the difference between F1
and F2,cf. Fig. 6.
Fig. 5 Forces measured under cyclic loading. The active and passive
side denote the sides of F1 and F2, respectively.
Fig. 6 Forces measured under cyclic loading.
The resulting force varies between average values of 216 N and 44 N.
The force should keep a constant amplitude over time. However, the
maximum force per load cycle slightly decreases over time, cf. Fig. 7.
The minimum and maximum values of the minimum and maximum
forces for the load cycles are given in Table 4. The difference in load
may be due to friction in the setup.
Fig. 7 Resulting force from the cyclic loading. The test stops around
3900 cycles and is started again (first and second run).
Fig. 8 shows the rotation of the pile affected by load cycles. The
response is an increase in stiffness with increasing number of cycles.
From the first load cycle a permanent rotation of approximately 0.2° is
obtained and the next load cycle only creates an additional permanent
rotation of less than 0.03°. Almost half of the rotation is obtained from
the first load cycle. In Fig. 8 load cycles for N< 2500 are light blue and
N>2500 are dark blue. The incremental accumulation in rotation
decrease with number of cycles.
Fig. 8 Force/rotation relation at cyclic loading.
Approximately 5000 load cycles are recorded. A small increase in the
load amplitude can be detected after approximately 4000 load cycles,
i.e. 0.42° rotation, cf. Fig. 8. The cyclic test experienced a mechanical
stop and was started again, which caused the irregular behaviour
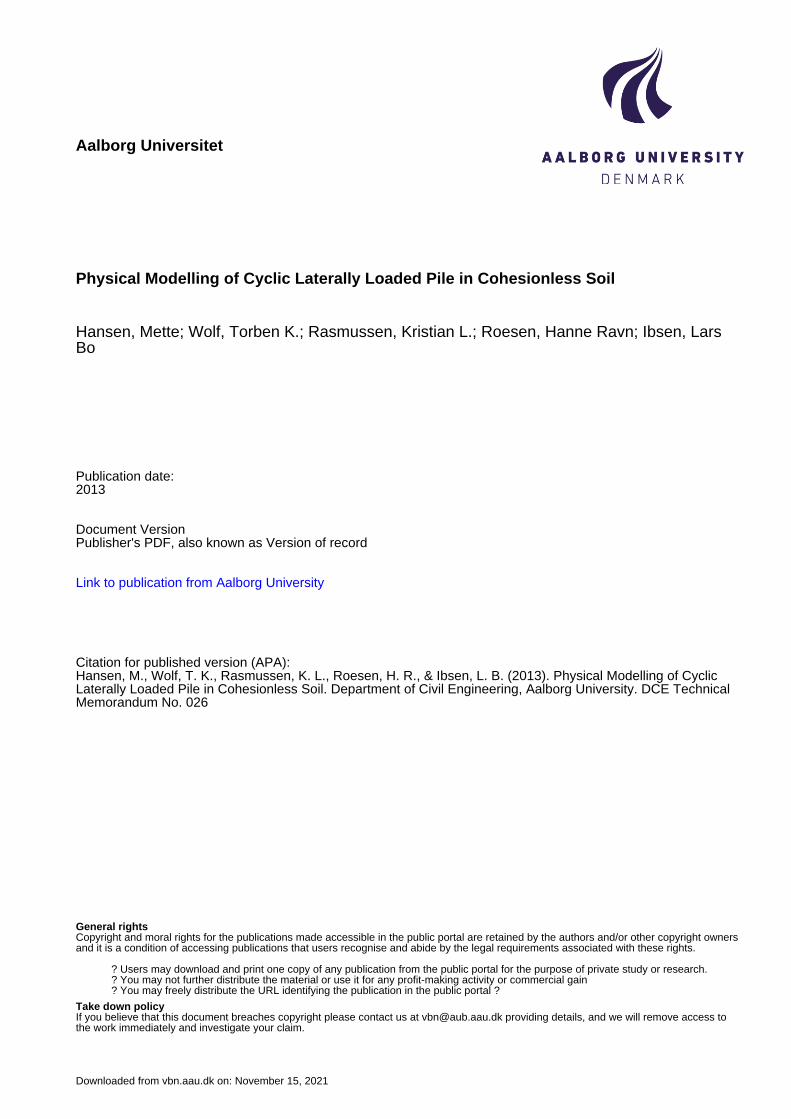
The accumulated rotation after a certain number of load cycles, ∆θ(N),
is given for the maximum and minimum force in the load cycles. Long
and Vanneste (1994) and Lin and Liao (1999) suggest that the rotation
of the first load cycle is treated separately. The accumulated rotation
after the first rotation is described as ∆θ(N)= θN -θ1. Definitions are
shown in Fig. 9. θs is the rotation in a static test at the same load as the
corresponding cyclic load.
6
Fig. 9 The rotation as function of number of load cycles. (LeBlanc et al.
2010)
The total rotation of 100% is defined after 4919 load cycles, cf. Table
5.
Table 4 Minimum and maximum force in load cycles.
Fmax
[N]
Fmin
[N]
210-233 36-49
Table 5 Accumulated rotation for minimum and maximum force in the
load cycles.
Load cycle
N ∆θ(N) for Fmin
[%]
∆θ(N) for Fmax
[%]
10 33.4 28.6
100 66.0 64.7
1000 84.8 85.7
2000 90.3 91.6
4000 97.3 96.7
4919 100.0 100.0
The design criterion for dimensioning laterally loaded piles is related to
the permanent accumulated rotation, i.e. the plastic deformations.
Previous small-scale testing have determined rotation for the maximum
loads, even though this rotation contain both elastic and plastic
deformations. However, in agreement with Roesen et al. (2011b) it is
assumed that the representative accumulated rotation for describing
deformations is given by the minimum load in a load cycle. This load
represents the least elastic deformation which is desirable when
determining permanent rotation.
The static test and the cyclic test are plotted together in Fig. 10. The
maximum cyclic force is approximately 33% of the ULS load. It
appears from Fig. 10 that the cyclic test has a stiffer response than the
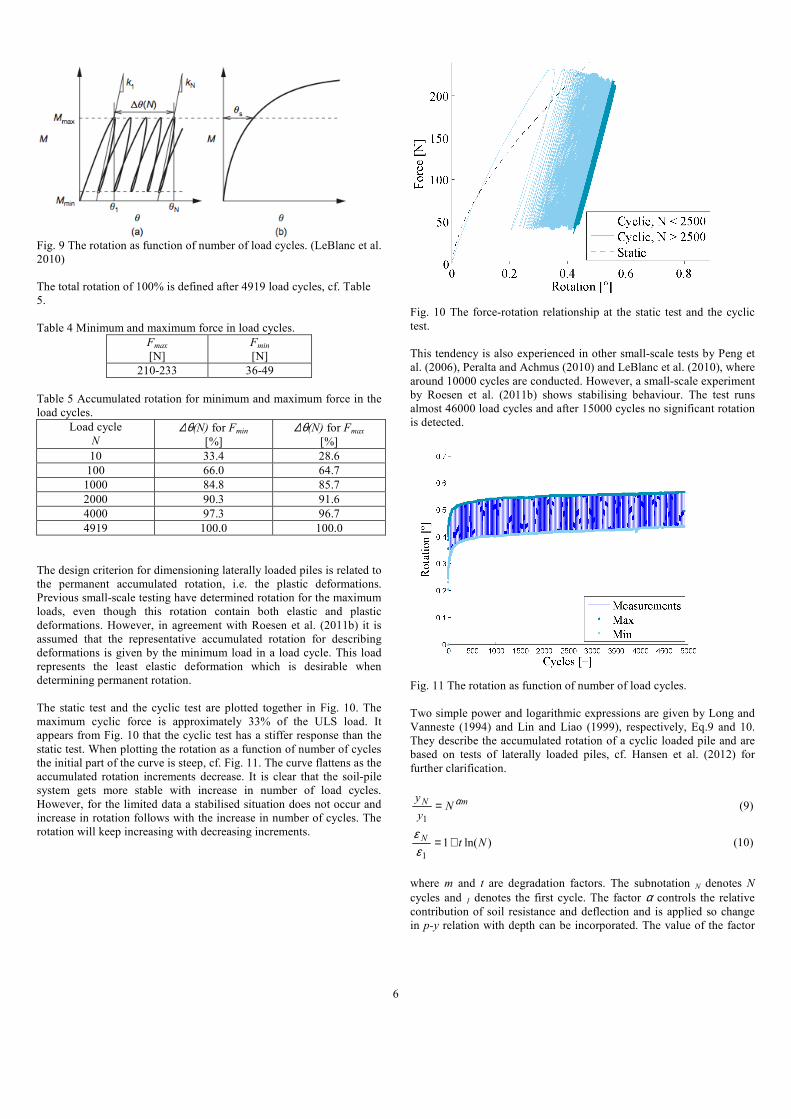
static test. When plotting the rotation as a function of number of cycles
the initial part of the curve is steep, cf. Fig. 11. The curve flattens as the
accumulated rotation increments decrease. It is clear that the soil-pile
system gets more stable with increase in number of load cycles.
However, for the limited data a stabilised situation does not occur and
increase in rotation follows with the increase in number of cycles. The
rotation will keep increasing with decreasing increments.
Fig. 10 The force-rotation relationship at the static test and the cyclic
test.
This tendency is also experienced in other small-scale tests by Peng et
al. (2006), Peralta and Achmus (2010) and LeBlanc et al. (2010), where
around 10000 cycles are conducted. However, a small-scale experiment
by Roesen et al. (2011b) shows stabilising behaviour. The test runs
almost 46000 load cycles and after 15000 cycles no significant rotation
is detected.
Fig. 11 The rotation as function of number of load cycles.
Two simple power and logarithmic expressions are given by Long and
Vanneste (1994) and Lin and Liao (1999), respectively, Eq.9 and 10.
They describe the accumulated rotation of a cyclic loaded pile and are
based on tests of laterally loaded piles, cf. Hansen et al. (2012) for
further clarification.
mN Ny
y α=1
(9)
)ln(11
NtN +=εε
(10)
where m and t are degradation factors. The subnotation N denotes N
cycles and 1 denotes the first cycle. The factor α controls the relative
contribution of soil resistance and deflection and is applied so change
in p-y relation with depth can be incorporated. The value of the factor

7
varies from 0 to 1. However, changing the α factor provides no
improvement in results, so a constant value of α = 0.6 is applied,
making the method independent of depth. εN is the strain accumulation
after N cycles and ε1 is the strain after the first cycle.
The two expressions are fitted by a degradation factor for a driven pile
in sand with Dr = 0.77 and a load characteristic corresponding to the
small-scale test. These expressions are compared to the normalised
maximum and minimum rotation for number of cycles, cf. Fig. 12. In
Table 6 Pearson's correlation coefficient, R, and the root mean square
error, RMSE, are given to describe the correlation between the
measured results and the power and logarithmic function by Long and
Vanneste (1994) and Lin and Liao (1999), respectively. Looking at
Pearsons correlation coefficient, R, the shape of the curves for both
expressions fit the data well. However, RSME, give a mean value of
how close the data is fitted to the expressions. The logarithmic
expression fit the minimum rotation best and the power expression fit
the maximum rotation best. Since the minimum rotation is assumed to
give the most exact permanent rotation the logarithmic function fits the
best. However, it overestimates the rotation after the first 350 cycles.
Peralta and Achmus (2010) suggest fitting accumulated rotation to
power and logarithmic expressions. Also, LeBlanc et al. (2010) uses a
power function.
Fig. 12 The normalised maximum and minimum rotation compared to
logarithmic and exponential functions by Long and Vanneste (1994)
and Lin and Liao (1999).
Table 6 Pearsons correlation coefficient, R, and root mean square error
between measured data and the functions by * Long and Vanneste
(1994) and ** Lin and Liao (1999).
Pow.fit* Log.fit**
θ(N)/θ1(min) R
RMSE
0.977
0.339
0.990
0.090
θ(N)/θ1(max) R
RMSE
0.973
0.068
0.989
0.377
The measured data is fitted the functions
bN aN=1θ
θ (11)
)ln(1
NbaN +=θθ
(12)
where a and b are fitting coefficients and the rotation is normalised by
the rotation from the first load cycle. LeBlanc et al. (2010) normalise
their data differently by ∆θ(N)/θs defined in Fig. 9. LeBlanc et al.
(2010) only normalise the maximum accumulated rotations, since the
minimum rotation is zero for the static rotation, θs, for one-way loading
with ζc = 0. However, in the conducted small-scale test ζc is not zero
and thus the minimum rotation is normalised as well.
In Fig. 13 and Fig. 14 the logarithmic and the power functions are fitted
the minimum and maximum accumulated rotation, respectively. The
correlation between each function and the measured data is given by
Pearson correlation coefficient, R, and RMSE in Table 7 for the
minimum and maximum measured rotations. Both functions fit the
measured data well with correlation coefficients between 0.959 and
0.988. The RMSE show a slightly smaller mean error for the maximum
rotations. However, not one of the functions can be favoured as they
are very alike. Normalising the rotation according to LeBlanc et al.
(2010) makes little change. A slightly better fit is obtained by the
logarithmic function according to R and RMSE. It must be emphasised
that both expressions give good fits.
Fig. 13 Logarithmic and exponential functions fitted to minimum
rotation.

8
Fig. 14 Logarithmic and exponential functions fitted to maximum
rotation.
Table 7 Pearsons correlation coefficient, R, and root mean square error,
(RMSE), between measured data and the functions suggested by *
Peralta and Achmus (2010) and LeBlanc et al. (2010)
Pow.fit* Log.fit*
(min))N(
1θθ
R
RMSE
0.962
0.020
0.981
0.014
(max))N(
1θθ
R
RMSE
0.959
0.009
0.988
0.005
(min))N(
sθθ
R
RMSE
0.949
0.010
0.982
0.006
(max))N(
sθθ
R
RMSE
0.940
0.009
0.989
0.004
Fig. 15 Logarithmic and exponential functions fitted to minimum
rotation normalised as LeBlanc et al. (2010).
Fig. 16 Logarithmic and exponential functions fitted to maximum
rotation normalised as LeBlanc et al. (2010).
CONCLUSION
To analyse the effect that environmental forces have on offshore wind
turbines small-scale testing is conducted. The test is of an aluminium
pipe pile with an outer diameter of 100 mm and a length of 600 mm
corresponding to a slenderness ratio of 6. The pile is placed in saturated
cohesionless soil with a relative density between 74 - 79%. The relative
density of the sand is determined based on CPTs conducted prior to the
test. A monotonic test is conducted loading the pile to a 3° rotation and
afterwards the pile is unloaded and then reloaded again. The load is
applied by a motor pulling the pile with a speed of 0.02 mm/s. The
ultimate capacity is defined at 3° rotation to 660 N. A cyclic load
simulating FLS is chosen to approximately 35% of the ultimate
capacity. This load is applied by a rotating arm with a frequency of 0.1
Hz causing a sinusoidal loading of the pile. Applied force and
displacement are measured and the rotation is found.
The test results show an accumulated rotation of the pile as it is
subjected to the load cycles. The rotation increments decrease with
increasing number of load cycles, but no stable situation occurs.
Comparing the static and cyclic test the stiffness response is larger for
the cyclic test. The stiffer response may be due to different relative
densities in the two tests. The frequency of which the load is applied
may have an influence as the cyclic load is applied approximately 190
times faster than the cyclic load. The results give an indication of the
expected behaviour of long-term loading of piles in sand. However,
further investigations with a larger number of load cycles should be
conducted, as 5000 cycles does not describe long-term loading.
Long and Vanneste (1994) and Lin and Liao (1999) suggest
degradation of stiffness of the soil-pile system based on large-scale
experiments of maximum 500 load cycles. The degradation is
influenced by the relative density, the installation method and the load
ratio. Lin and Liao (1999) also included a depth coefficient in the
degradation. Long and Vanneste (1994) and Lin and Liao (1999)
suggest a power and a logarithmic expression, respectively. Both
expressions give a simple estimate of the accumulated rotation for the
number of cycles applied. However, the methods are not clear on
whether the rotation should be found as the maximum or the minimum
rotation for a load cycles. It is the authors opinion that the minimum
rotation in a load cycle represents the permanent rotation best as the
elastic deformation is at its minimum as well.

9
Recent small-scale testing provides information on rotation of a
cyclically loaded pile. Peng et al. (2006), Peralta and Achmus (2010)
and LeBlanc et al. (2010) test different load scenarios with
approximately 10000 cycles applied. They all agree with the measured
results that rotation will keep increasing with number of load cycles.
Peralta and Achmus (2010) and LeBlanc et al. (2010) suggest fitting of
data by a power and logarithmic expression. The measured results can
be fitted well by both expressions. Here, it should be kept in mind that
the measured results only include less than 5000 cycles. Roesen et al.
(2012b) measures cyclic loading of a pile subjected to approximately
46000 cycles. A stabilisation seems to occur around 15000 load cycles.
AKNOWLEDGEMENT
This research is associated with the EUDP programme “Monopile cost
reduction and demonstration by joint applied research” funded by the
Danish energy sector. The financial support is sincerely acknowledged.
REFERENCES
Rasmussen, K. L., Hansen, M., Wolf, T. K., Ibsen, L. B., Roesen, H. R.
2012 “A literature study on the effects of cyclic lateral loading of
monopiles in cohesionless soil”. DCE Technical Memorandum No.
25, Department of Civil Engineering, Aalborg University,
Denmark.
Ibsen, L. B., Hanson, M. Hjort, T. and Taarup, M. 2009.
MC-parameter Calibration of Baskarp Sand No. 15, DCE Technical
Report No. 62. Department of Civil Engineering, Aalborg
University
LeBlanc, C., Houlsby, G. and Byrne, B. (2010). “Response of stiff piles
to long-term cyclic lateral load”. Géotechnique, 60 (2), pp. 79-90.
Lin, S.-S., and Liao J.C. (1999) “Permanent Strains of Piles in Sand
due to Cyclic Lateral Loads”, Journal of Geotechnical and
Geoenvironmental Engineering, 125 (9). pp. 789-802
Long J. H. and Vanneste G. (1994) “Effects of Cyclic Lateral Loads on
Piles in Sand”. Journal of Geotechnical Engineering, 120 (1), pp.
225-244.
Peng, J.-R., Clarke, B. G. and Rouainia, M. (2006). “A device to Cyclic
Lateral Loaded Model Piles” Geotechnical Testing Journal 29 (4)
pp. 1-7.
Peralta, P. and Achmus, M. (2010) “An experimental investigation of
piles in sand subjected to lateral cyclic loads” 7th International
Conference on Physical Modeling in Geotechnics, Zurich,
Switzerland.
Roesen, H. R., Ibsen, L. B., and Andersen, L. V. (2012a). “Small-Scale
Testing Rig for Long-Term Cyclically Loaded Monopiles in
Cohesionless Soil”, Proceedings of the 16th Nordic Geotechnical
Meeting, Copenhagen, 9-12 May, 2012, vol. 1/2, p.435-442..
Roesen, H. R., Andersen, L. V., Ibsen, L. B. and Foglia, A. (2012b)
“Experimental Setup for Cyclic Lateral Loading of Monopiles in
Sand.” Proceedings of the Twenty-second International Offshore
and Polar Engineering Conference, Rhodes, Greece.

ISSN 1901-7278 DCE Technical Memorandum No. 026
Top Related