


Languages
Pages
Legal

1
Ashok Leyland – Nissan Joint Venture For LCV Business
Presentation By Group 8
Submitted to, Prof Govinda Sharma

2
IntroductionProject – “Sunrise”
Major Purpose of this Joint Venture
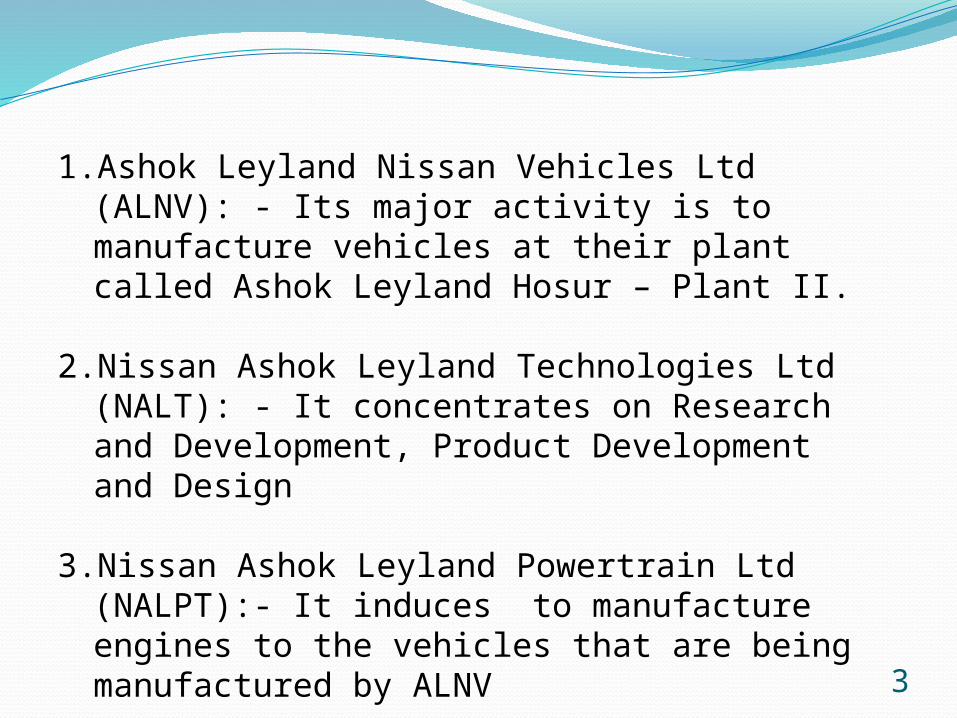
Basically this Joint venture has led to the following activities/Organizations:
Ashok Leyland Nissan Vehicles Ltd
Nissan Ashok Leyland Technologies Ltd
Nissan Ashok Leyland Powertrain Ltd
3
1.Ashok Leyland Nissan Vehicles Ltd (ALNV): - Its major activity is to manufacture vehicles at their plant called Ashok Leyland Hosur – Plant II.
2.Nissan Ashok Leyland Technologies Ltd (NALT): - It concentrates on Research and Development, Product Development and Design
3.Nissan Ashok Leyland Powertrain Ltd (NALPT):- It induces to manufacture engines to the vehicles that are being manufactured by ALNV
4
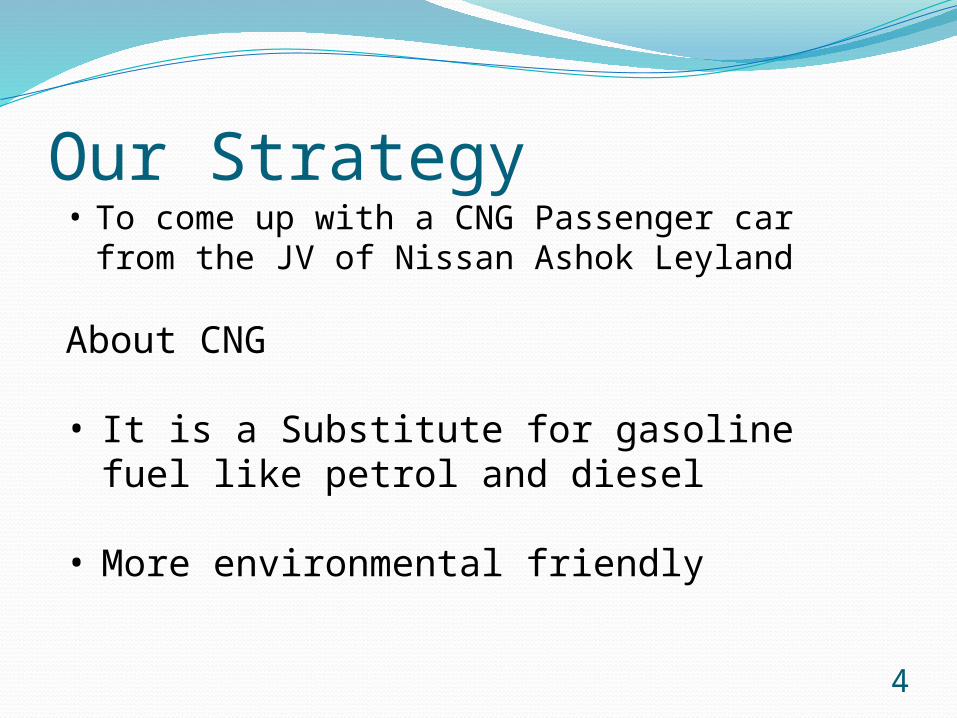
Our Strategy • To come up with a CNG Passenger car from
the JV of Nissan Ashok Leyland
About CNG
• It is a Substitute for gasoline fuel like petrol and diesel
• More environmental friendly

Ashok LeylandVision:Achieving leadership in the medium/heavy duty segments of the domestic commercial vehicle market and a significant presence in the world market through transport solutions that best anticipate customer needs, with the highest value-to-cost ratio.
Mission:The great insight of Ashok Leyland’s mission is:Identifying with the customerBeing the lowest cost manufacturerGlobal benchmarking our products, processes and people
5

Strategy formulation frameworkStage 1: The input stageSummarizes the basic input required for strategy
formulation (CPM)Stage 2: The matching stageFocuses on generating feasible alternatives by
aligning key external & internal factors (SWOT, SPACE)
Stage 3: The decision stageEvaluation of relative attractiveness of
alternative strategies and help choose the best alternatives (QSPM)
6

Competitive Profile MatrixCompetitive Profile Matrix
CSF Weight
Ashok Leyland
Tata motors Maruti Suzuki Honda
rating
weighted score
rating
weighted score
rating
weighted score
rating weighted score
Market Share
25% 3 0.75 2 0.5 4 1 1.5 0.375
Product quality
18% 4 0.72 4 0.72 3 0.54 3 0.54
Customer loyalty
15% 4 0.6 2.5 0.375 3 0.45 2 0.3
Distribution Channel
12% 2.5 0.3 3 0.36 3.5 0.42 2.5 0.3
After sale Service
20% 3 0.6 2 0.4 4 0.8 2.5 0.5
Financial Strength
10% 2.5 0.25 4 0.4 3 0.3 3 0.3
Total 100% 3.22 2.755 3.51 2.3157
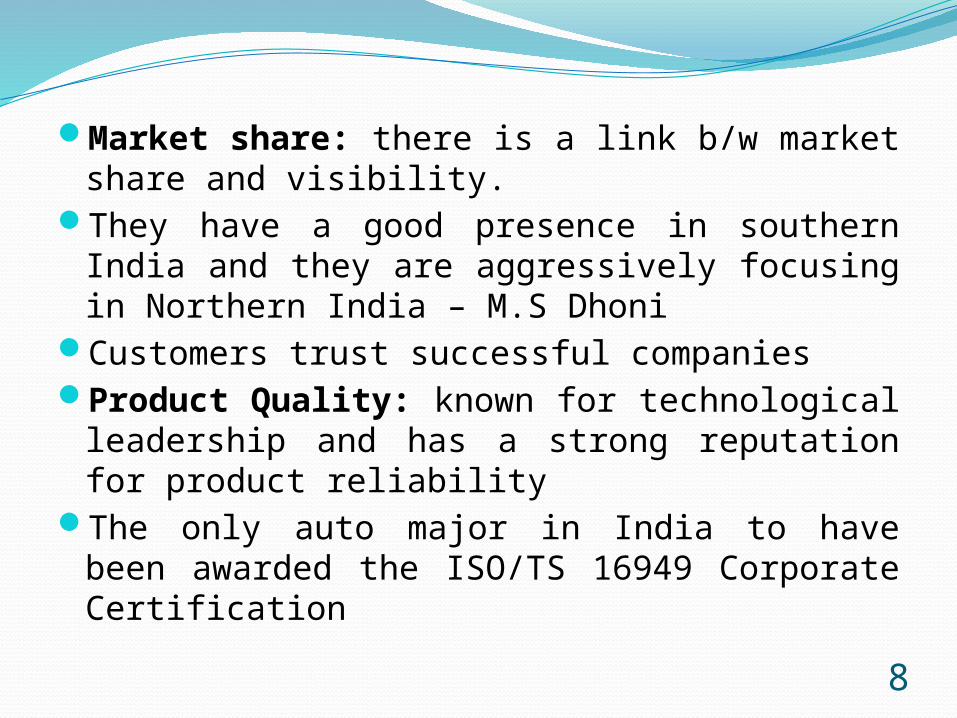
Market share: there is a link b/w market share and visibility.
They have a good presence in southern India and they are aggressively focusing in Northern India – M.S Dhoni
Customers trust successful companiesProduct Quality: known for technological
leadership and has a strong reputation for product reliability
The only auto major in India to have been awarded the ISO/TS 16949 Corporate Certification
8

Customer Loyalty: To sell is to know your customers
Built-up a data base of 130,000 customersDistribution Channel: 420 nationwide
dealersNew 3S outlet in ChindwaraService centers at every 75 kmsReaching customers within 4 hours and
restoration of vehicle in 48 hours19,000 mechanics and nearly 5,800 retailers
9

10
Financial Strength: operating profit margin declined 50 basis points y-o-y to 10.7% in September '11
net sales growing 14% to Rs 3,094.6 croreAfter Sale Service: easy access to
customers anywhere in the country5000 plus outlets for Leyparts, genuine
spares for our products serviced by five warehouses
Around 300 Highway mechanic tie-ups for corridor support

11
SWOT AnalysisOPPURTUNITIES1. Getting the advantage
from government2. Tax Benefits.3. Due to liberalization,
demand for heavy vehicle have stepped-up all over the globe
4. Increasing demand for credit for dealers
THREATS1. Entry of new global
competitors2. Weak Index of
Industrial production3. Tight monetary policy
viz., Higher lending rate
4. Suspension of mining activities in many parts of the country
12
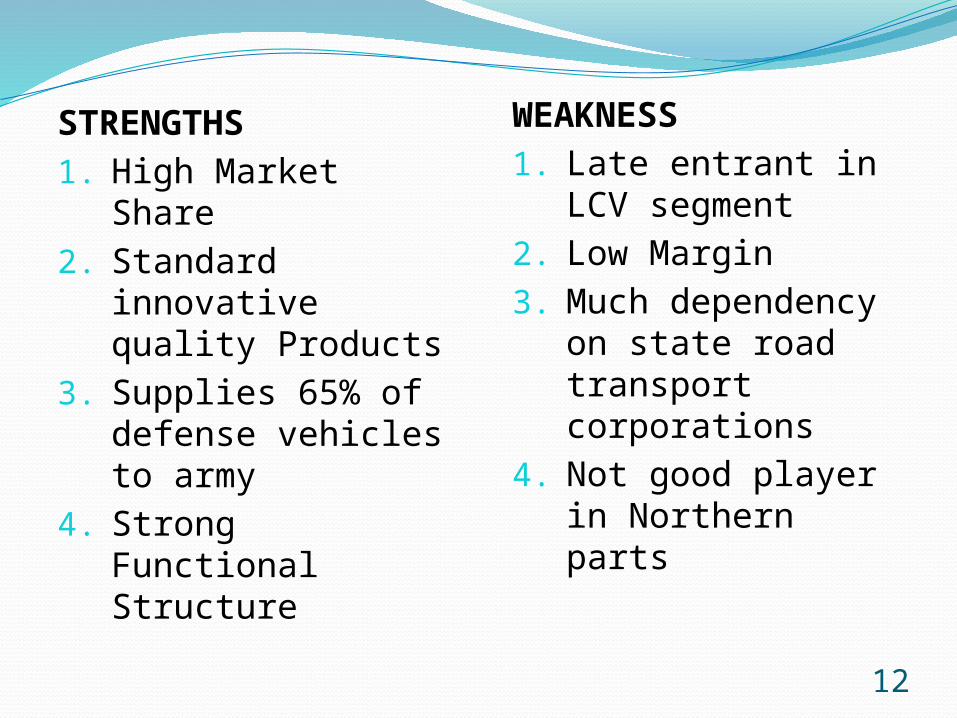
STRENGTHS1. High Market Share2. Standard
innovative quality Products
3. Supplies 65% of defense vehicles to army
4. Strong Functional Structure
WEAKNESS1. Late entrant in LCV
segment2. Low Margin3. Much dependency
on state road transport corporations
4. Not good player in Northern parts

13
SO strategiesIncrease the supplies to defense to 75% with the
opportunity of getting the benefit from government. (S3,O1)
Can use the functional structure and distribution network to gain more dealers.(S4,O4)
WO strategiesSetup new manufacturing plant in Northern India for
heavy vehicle segment.(W4,O3)ST strategiesRelease new products yearly to overcome
competition(S1,S2,T1)WT strategiesInvest on private transport agencies for the
transportation or import of raw material(W3,T4)

14
SPACE MatrixAshok Leyland financial, competitive and
industry profilesRatings or numerical value between +1 to +7
and -1 to -7Several factors under each SPACE matrix
axes are considered which determines the recommended strategy of Ashok Leyland

15
Ashok Leyland’s net sales growing 14% despite low operating margin
1
The company’s return on capital is 8% in 2012.Decreased from 10% in 2011
1
The company’s earnings per share decreased from 1.96 to 1.53 2
Total 4
Financial Position Rating
Liberalization and tax benefits provide huge competition in Indian Automobile industry
5
Tax benefits provide product freedom and price fluctuations 3
Suspension of mining leads to lower supply of raw material 4
Total 12
Industry Position Rating

16
Increasing inflation and depreciation of rupee causing instability in Indian economy
-4
Rising fuel prices effecting the price elasticity of demand for light commercial vehicles
-5
Increasing lending rates by banks lead to slowdown for expansion -6
Total -15
Stability Position Rating
Huge market share -2
Known for quality products and services -5
Strong distribution network and organizational structure -2
Total -9
Competitive Position Rating

17
Conclusion from above criteria:FP Average= 4/3= 1.33IP Average= 12/3= 3SP Average= -15/3= -5CP Average= -9/3= -3Directional vector co-
ordinates: X-axis: -3+ (+4) = 1 Y-axis: -5+ (+1.33) = -3.67
FP
CP IP
(1,-3.67)
SP

18
Analysis From SPACE MatrixFrom the above analysis using SPACE matrix,
it can be concluded that Ashok Leyland should pursue Competitive strategies.
Thus Ashok Leyland has a competitive advantage of new product development by entering into joint venture with Nissan for LCV strategy.
The company is fairly competing in the unstable and unpredictable automobile industry

19
Why to apply QSPM model ?
Alternative 1: Entering into the CNG Passenger models solely owned by Ashok
Leyland.Alternative 2: Entering into the CNG
Passenger models in a joint venture with Nissan Motors.
20
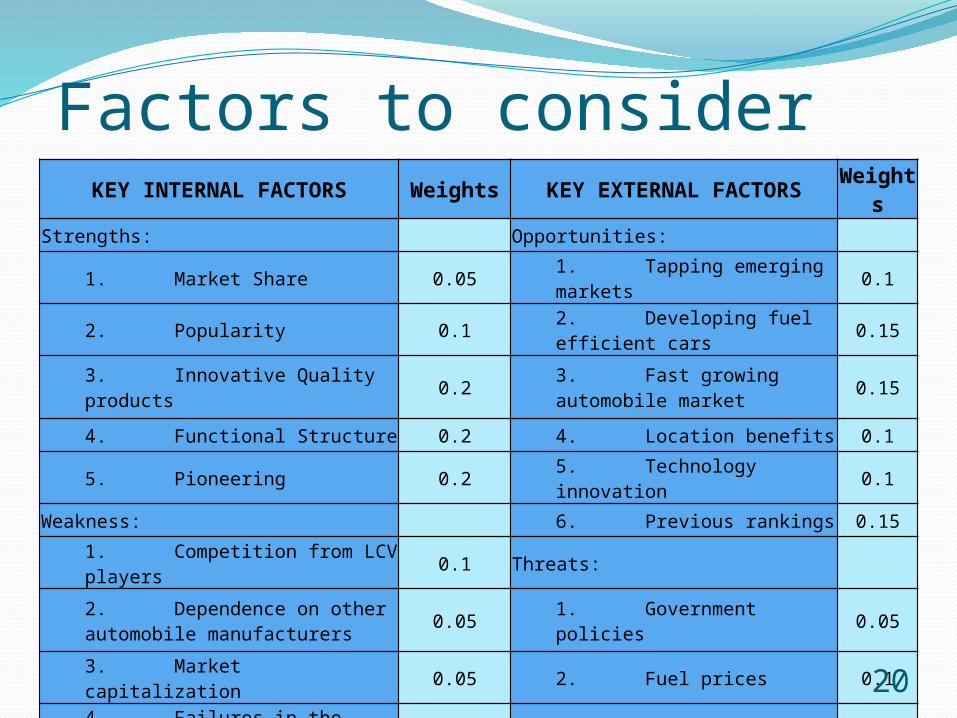
Factors to considerKEY INTERNAL FACTORS Weights KEY EXTERNAL FACTORS Weights
Strengths: Opportunities:
1. Market Share 0.05 1. Tapping emerging markets 0.1
2. Popularity 0.1 2. Developing fuel efficient cars 0.15
3. Innovative Quality products 0.2 3. Fast growing automobile market 0.15
4. Functional Structure 0.2 4. Location benefits 0.1
5. Pioneering 0.2 5. Technology innovation 0.1
Weakness: 6. Previous rankings 0.15
1. Competition from LCV players 0.1 Threats:
2. Dependence on other automobile manufacturers 0.05 1. Government policies 0.05
3. Market capitalization 0.05 2. Fuel prices 0.1
4. Failures in the previous segments 0.05 3. Substitute modes 0.05
Total: 1 4. Major existing players 0.05
Total: 1
21
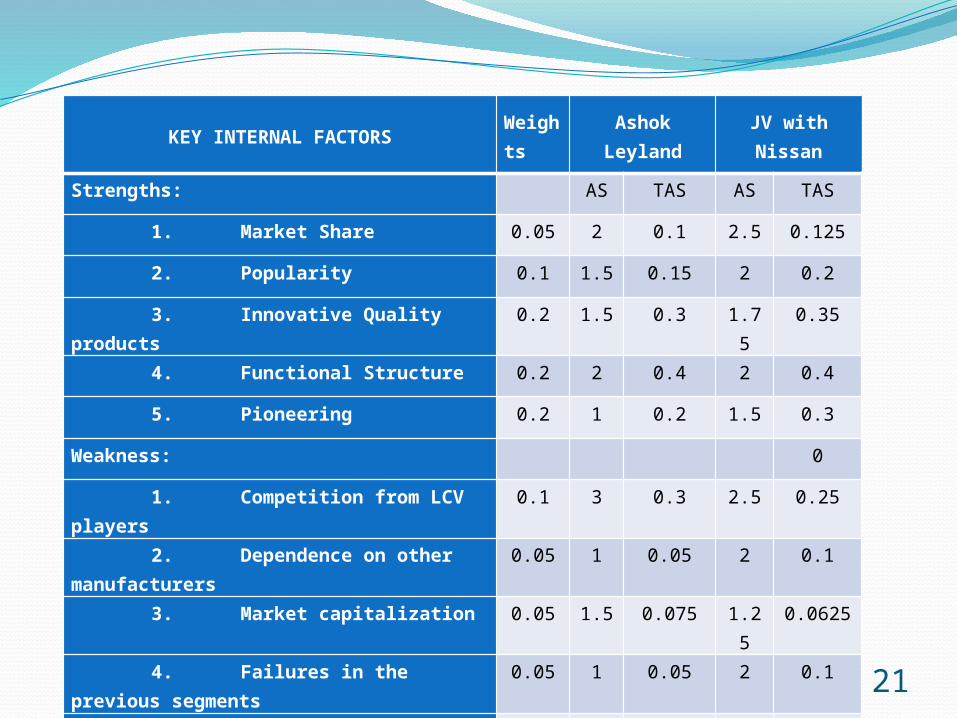
KEY INTERNAL FACTORSWeights
Ashok Leyland JV with Nissan
Strengths: AS TAS AS TAS
1. Market Share 0.05 2 0.1 2.5 0.125
2. Popularity 0.1 1.5 0.15 2 0.2
3. Innovative Quality products 0.2 1.5 0.3 1.75 0.35
4. Functional Structure 0.2 2 0.4 2 0.4
5. Pioneering 0.2 1 0.2 1.5 0.3
Weakness: 0
1. Competition from LCV players 0.1 3 0.3 2.5 0.25
2. Dependence on other manufacturers 0.05 1 0.05 2 0.1
3. Market capitalization 0.05 1.5 0.075 1.25 0.0625
4. Failures in the previous segments 0.05 1 0.05 2 0.1
Total: 1 0.475 1.8875
22
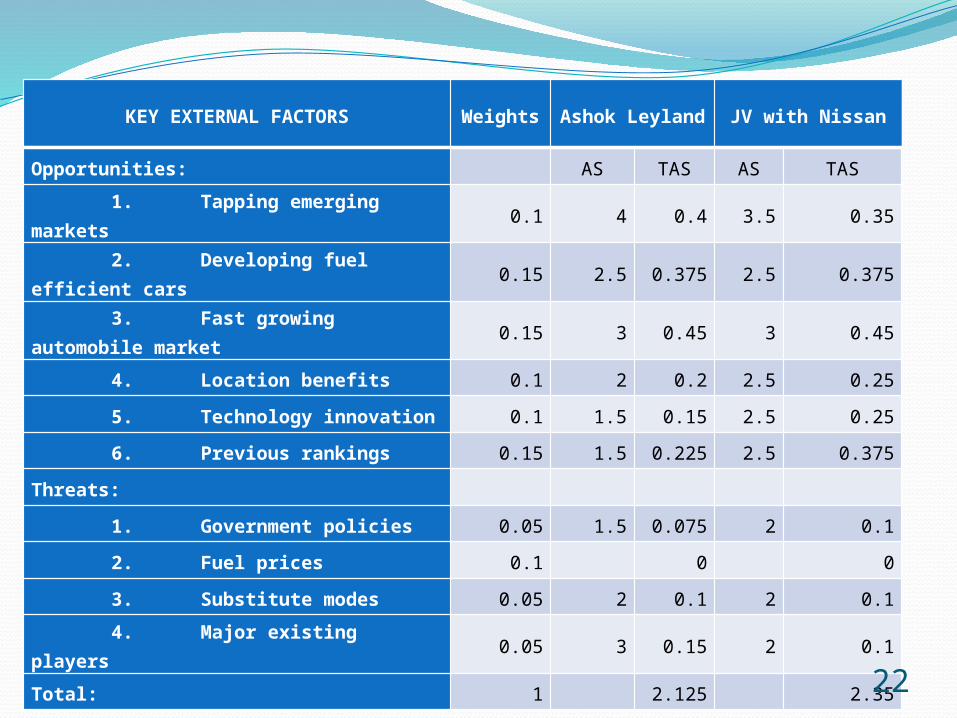
KEY EXTERNAL FACTORS Weights Ashok Leyland JV with Nissan
Opportunities: AS TAS AS TAS
1. Tapping emerging markets 0.1 4 0.4 3.5 0.35
2. Developing fuel efficient cars 0.15 2.5 0.375 2.5 0.375
3. Fast growing automobile market 0.15 3 0.45 3 0.45
4. Location benefits 0.1 2 0.2 2.5 0.25
5. Technology innovation 0.1 1.5 0.15 2.5 0.25
6. Previous rankings 0.15 1.5 0.225 2.5 0.375
Threats:
1. Government policies 0.05 1.5 0.075 2 0.1
2. Fuel prices 0.1 0 0
3. Substitute modes 0.05 2 0.1 2 0.1
4. Major existing players 0.05 3 0.15 2 0.1
Total: 1 2.125 2.35

23
Results
Alternative 1’s Total attractiveness score: 0.475+2.125 = 2.6
Alternative 2’s Total attractiveness score: 1.8875+2.35 = 4.23

24
Balance Scorecard for Ashok Leyland:Financial perspective:
Revenue of Rs 133.59 billions
Ashok Leyland’s net sales growing 14%
The company’s return on capital is 8% in 2012
Conservative volume growth of 15%Efficiency:
Production hits all time high at
95,337 vehicles, higher return on
investment, efficiency
increases wrt cost and time by the
use of technology.
Quality: Development of a
modern and contemporary
engine package protected for
Euro-6 emission standards, very
good in plain road and excellent fuel
average.
Innovation: R&D-relevant , appropriate and affordable world class technology. Spend 2.59% of total turnover in
R&D.
Responsiveness to customers: Easy access to
customers anywhere in the
country, they have more than 450 touch points for offering sales,
service and parts support.

25
Conclusion SWOT Matrix, SPACE Matrix, BCG Matrix, IE
Matrix, and QSPM can significantly enhance the quality of strategic decisions
They should never be used to dictate the choice of strategies.
Behavioral, cultural, and political aspects of strategy generation and selection are always important to consider and manage.

26
THANK YOU
Top Related