


Languages
Pages
Legal

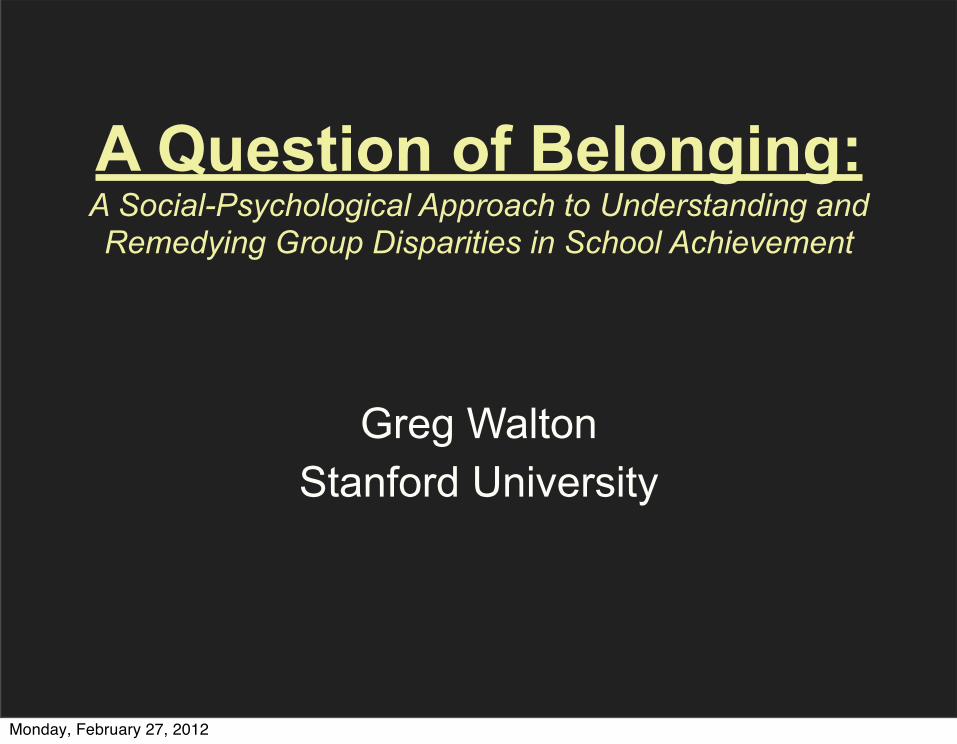
A Question of Belonging:A Social-Psychological Approach to Understanding and Remedying Group Disparities in School Achievement
Greg WaltonStanford University
Monday, February 27, 2012
200
230
260
290
320
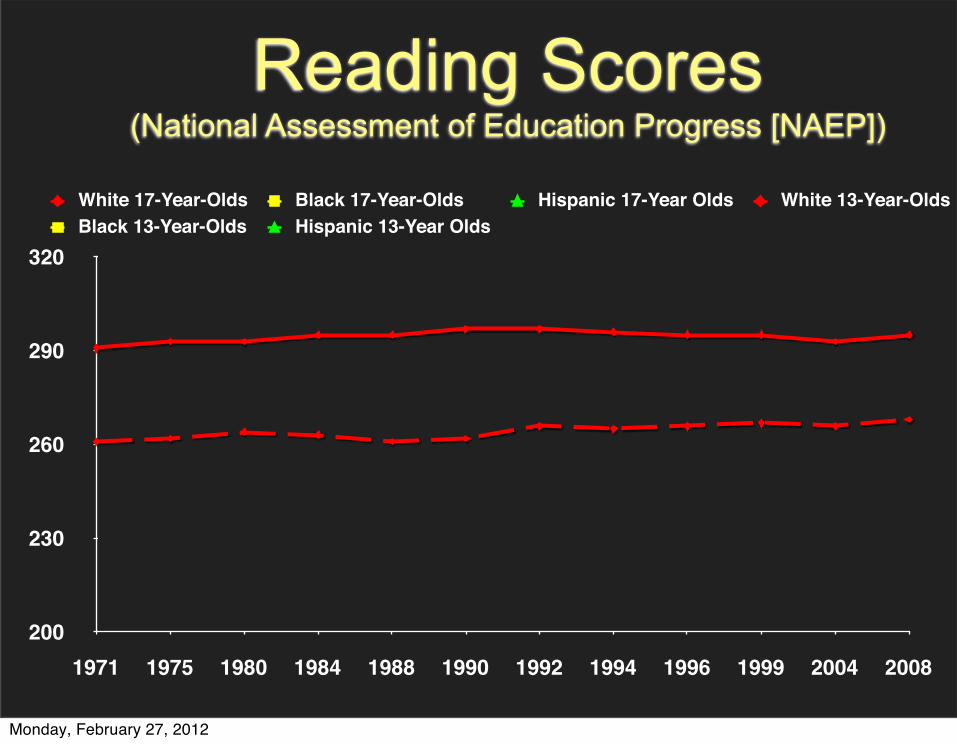
1971 1975 1980 1984 1988 1990 1992 1994 1996 1999 2004 2008
White 17-Year-Olds Black 17-Year-Olds Hispanic 17-Year Olds White 13-Year-OldsBlack 13-Year-Olds Hispanic 13-Year Olds
Reading Scores (National Assessment of Education Progress [NAEP])
Monday, February 27, 2012
200
230
260
290
320
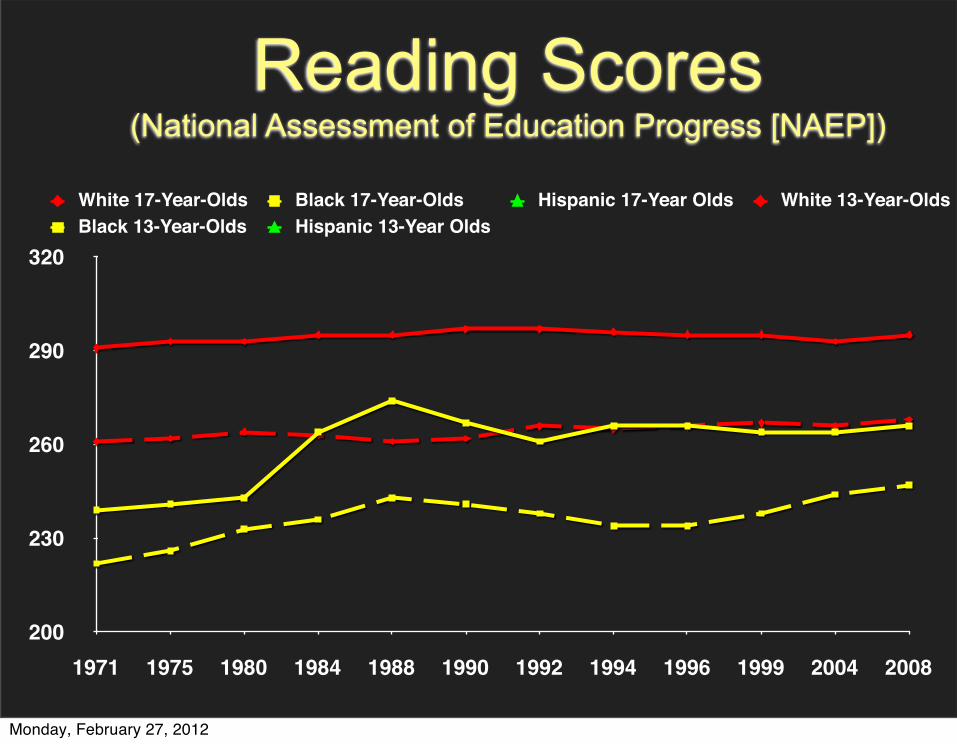
1971 1975 1980 1984 1988 1990 1992 1994 1996 1999 2004 2008
White 17-Year-Olds Black 17-Year-Olds Hispanic 17-Year Olds White 13-Year-OldsBlack 13-Year-Olds Hispanic 13-Year Olds
Reading Scores (National Assessment of Education Progress [NAEP])
Monday, February 27, 2012
200
230
260
290
320
1971 1975 1980 1984 1988 1990 1992 1994 1996 1999 2004 2008
White 17-Year-Olds Black 17-Year-Olds Hispanic 17-Year Olds White 13-Year-OldsBlack 13-Year-Olds Hispanic 13-Year Olds
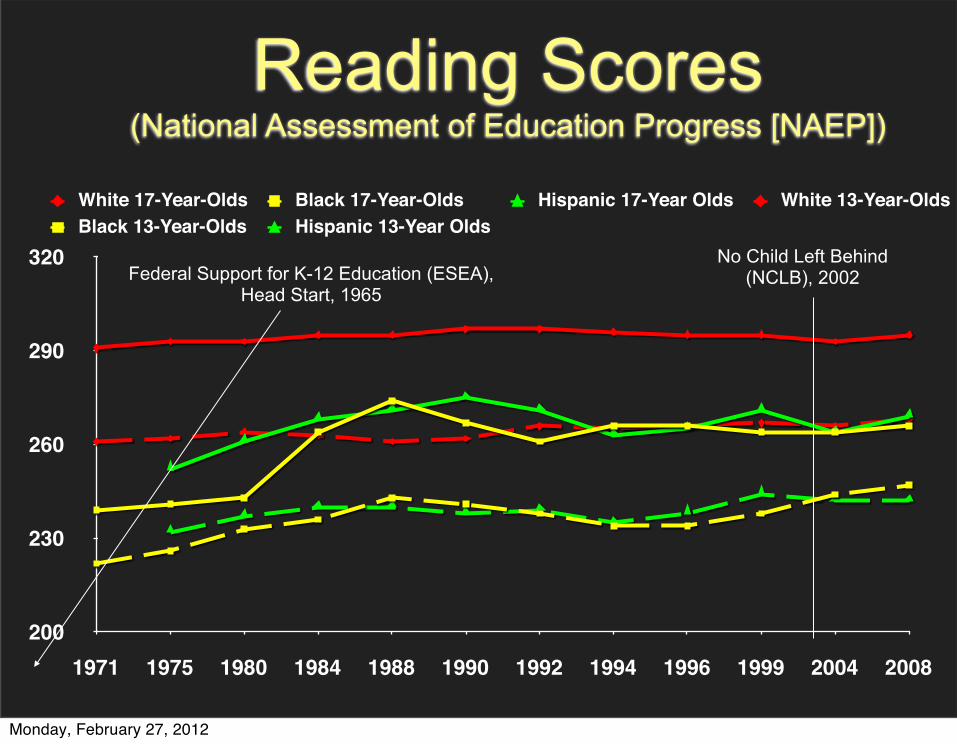
Federal Support for K-12 Education (ESEA), Head Start, 1965
No Child Left Behind (NCLB), 2002
Reading Scores (National Assessment of Education Progress [NAEP])
Monday, February 27, 2012
• Poverty matters
• But → at every income level, race differences exist in achievement (e.g., SAT)
• Preparation/prior ability matter
• But → at every level of prior preparation (e.g., SAT), race differences exist in subsequent achievement (e.g., college GPA)
What causes achievement gaps?
Monday, February 27, 2012
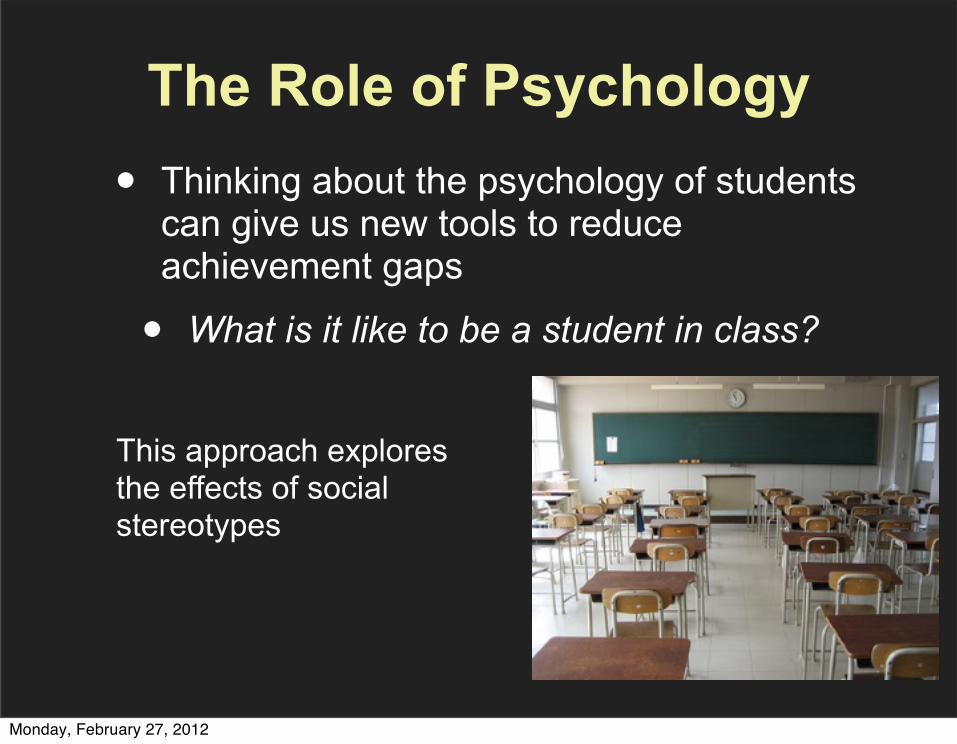
• Thinking about the psychology of students can give us new tools to reduce achievement gaps
• What is it like to be a student in class?
The Role of Psychology
This approach explores the effects of social stereotypes
Monday, February 27, 2012
African Americans in the Yale College
Class of 1970
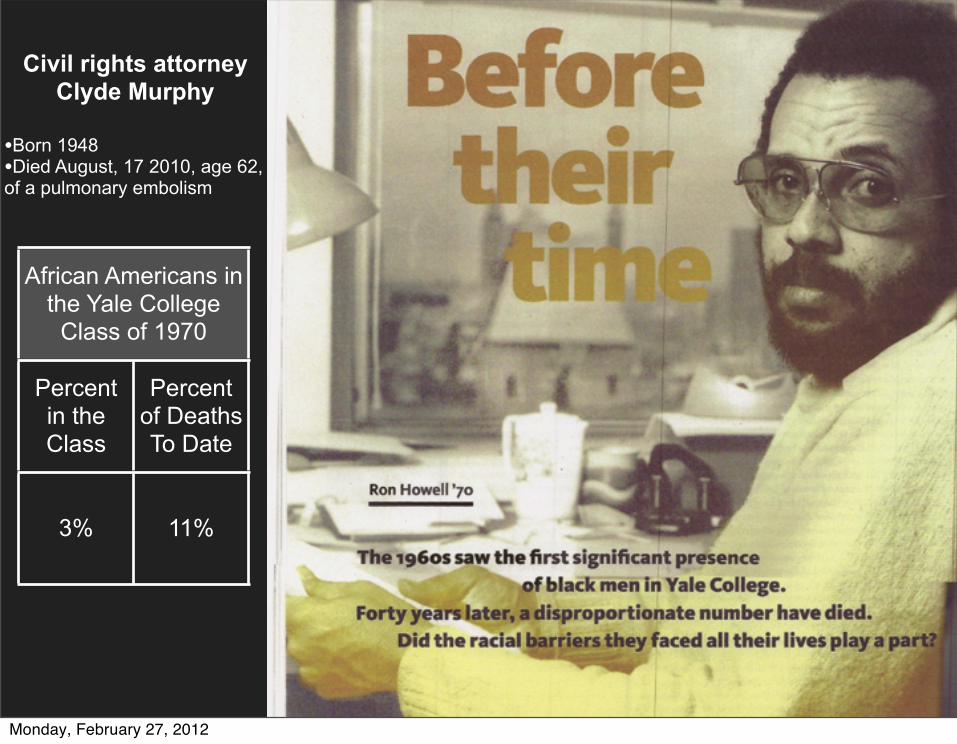
African Americans in the Yale College
Class of 1970
Percent in the Class
Percent of Deaths To Date
3% 11%
Civil rights attorney Clyde Murphy
•Born 1948•Died August, 17 2010, age 62, of a pulmonary embolism
Monday, February 27, 2012

You’re from San Francisco?!
You’re a professor?!
Monday, February 27, 2012
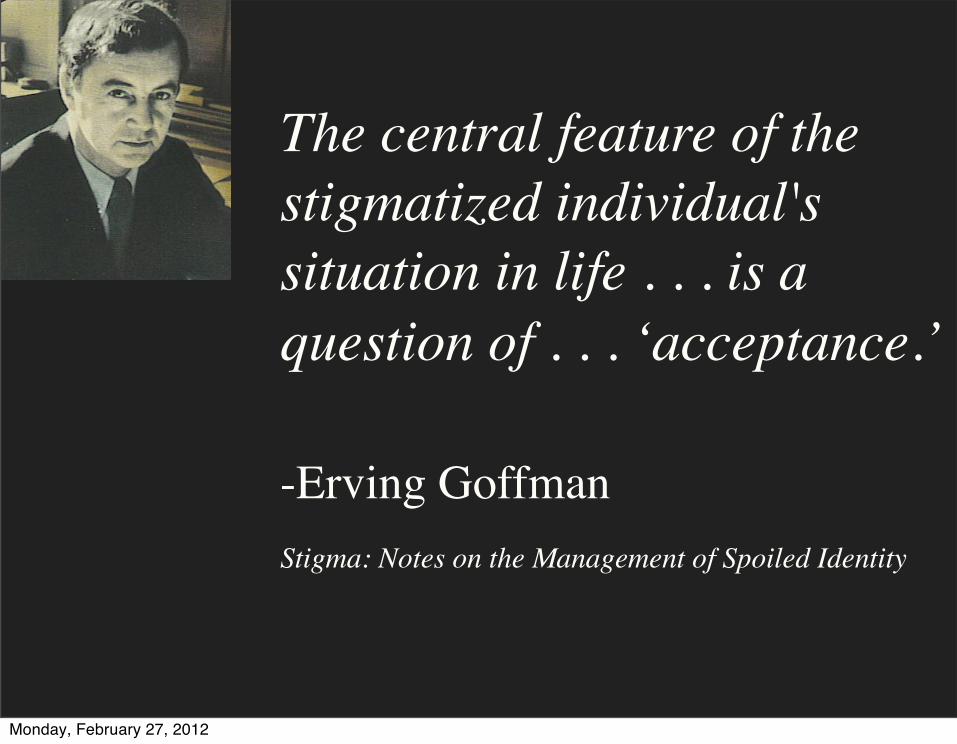
The central feature of the stigmatized individual's situation in life . . . is a question of . . . ‘acceptance.’
-Erving GoffmanStigma: Notes on the Management of Spoiled Identity
Monday, February 27, 2012
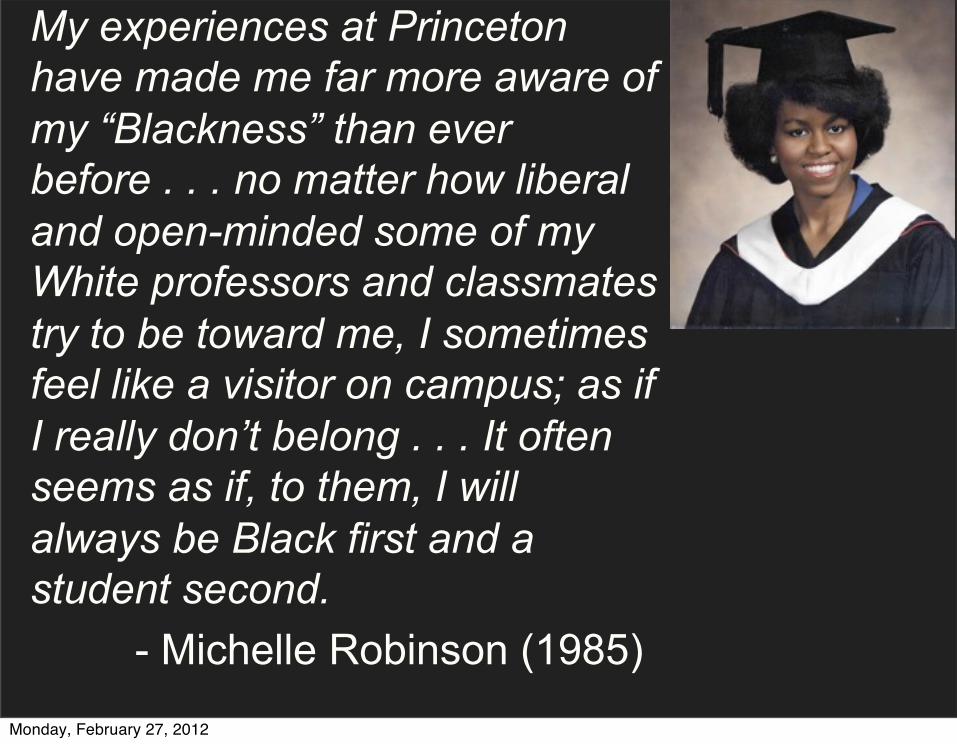
My experiences at Princeton have made me far more aware of my “Blackness” than ever before . . . no matter how liberal and open-minded some of my White professors and classmates try to be toward me, I sometimes feel like a visitor on campus; as if I really don’t belong . . . It often seems as if, to them, I will always be Black first and a student second.
- Michelle Robinson (1985)Monday, February 27, 2012
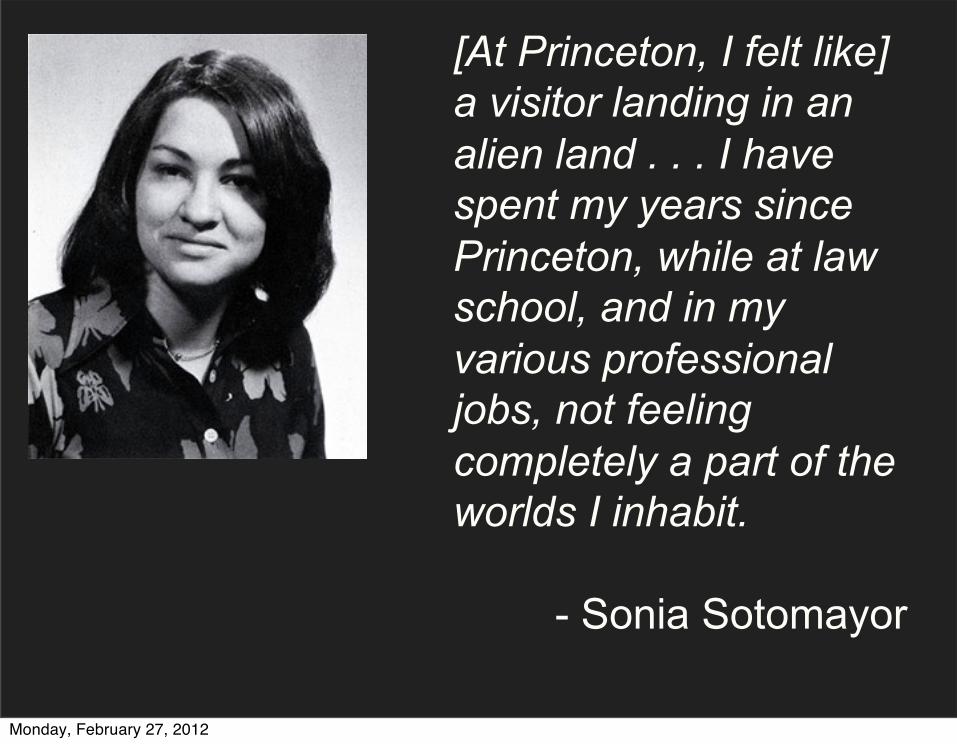
[At Princeton, I felt like] a visitor landing in an alien land . . . I have spent my years since Princeton, while at law school, and in my various professional jobs, not feeling completely a part of the worlds I inhabit.
- Sonia Sotomayor
Monday, February 27, 2012
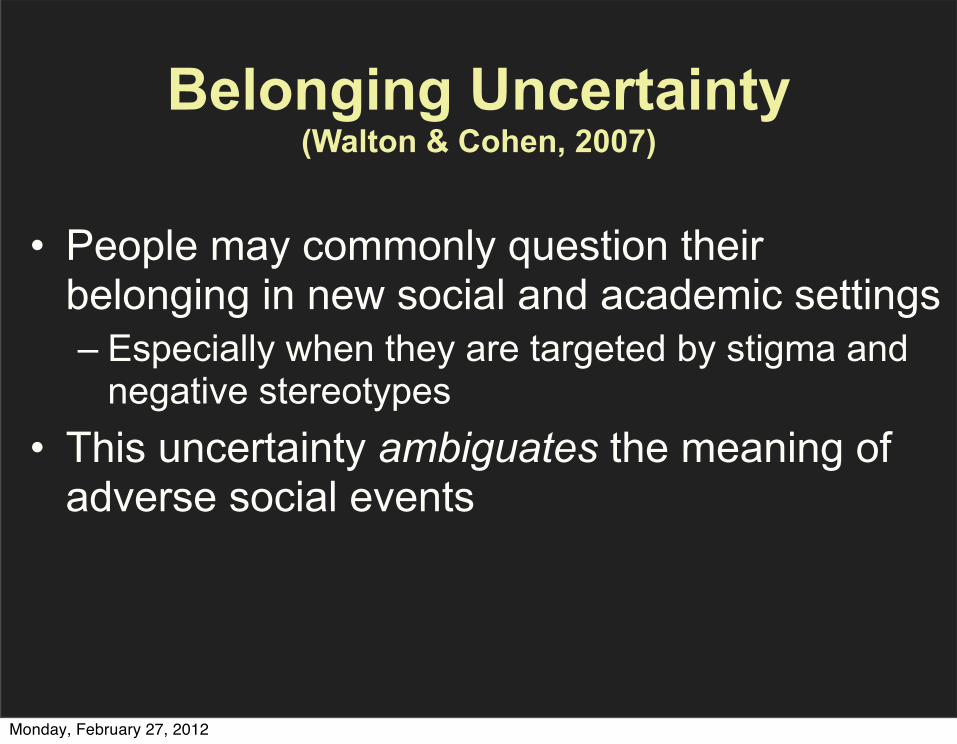
Belonging Uncertainty(Walton & Cohen, 2007)
• People may commonly question their belonging in new social and academic settings– Especially when they are targeted by stigma and
negative stereotypes• This uncertainty ambiguates the meaning of
adverse social events
Monday, February 27, 2012
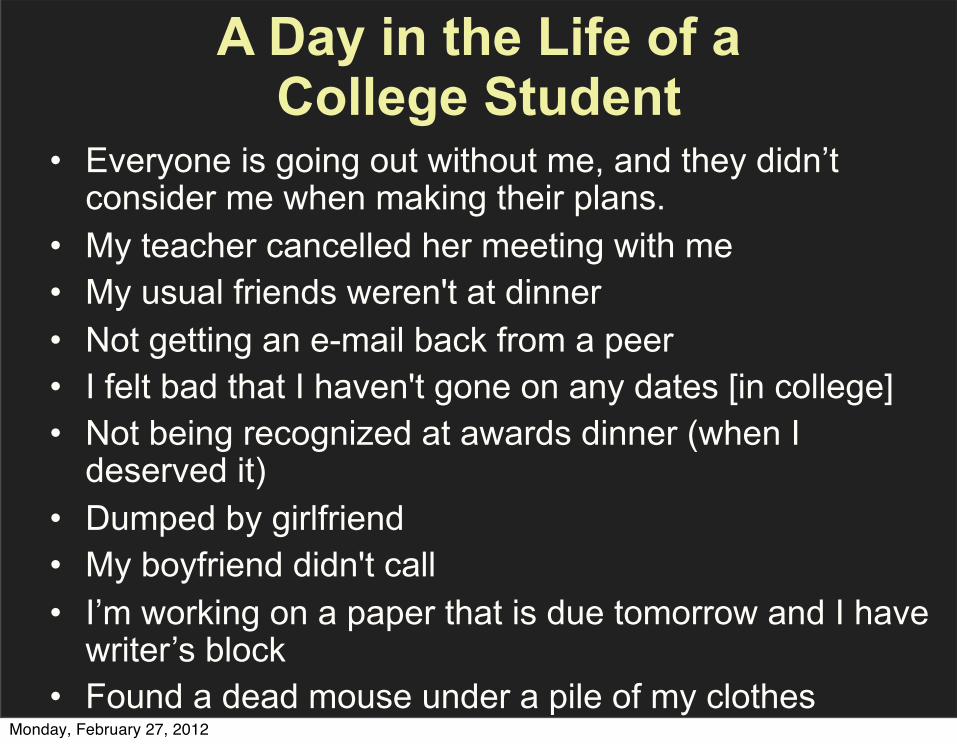
A Day in the Life of a College Student
• Everyone is going out without me, and they didn’t consider me when making their plans.
• My teacher cancelled her meeting with me• My usual friends weren't at dinner• Not getting an e-mail back from a peer• I felt bad that I haven't gone on any dates [in college]• Not being recognized at awards dinner (when I
deserved it)• Dumped by girlfriend• My boyfriend didn't call• I’m working on a paper that is due tomorrow and I have
writer’s block • Found a dead mouse under a pile of my clothes
Monday, February 27, 2012
Propositions
1. Group differences may emerge in response to social experience
2. The social experience need not be evaluative or pose a risk of bias
Monday, February 27, 2012
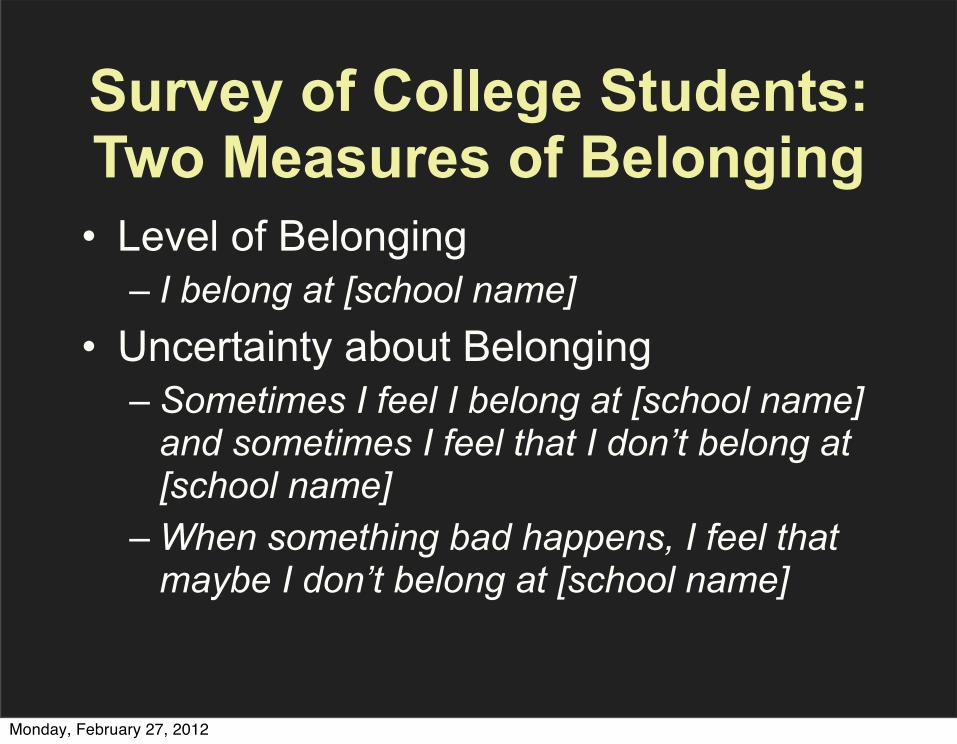
Survey of College Students:Two Measures of Belonging• Level of Belonging
– I belong at [school name]• Uncertainty about Belonging
– Sometimes I feel I belong at [school name] and sometimes I feel that I don’t belong at [school name]
– When something bad happens, I feel that maybe I don’t belong at [school name]
Monday, February 27, 2012
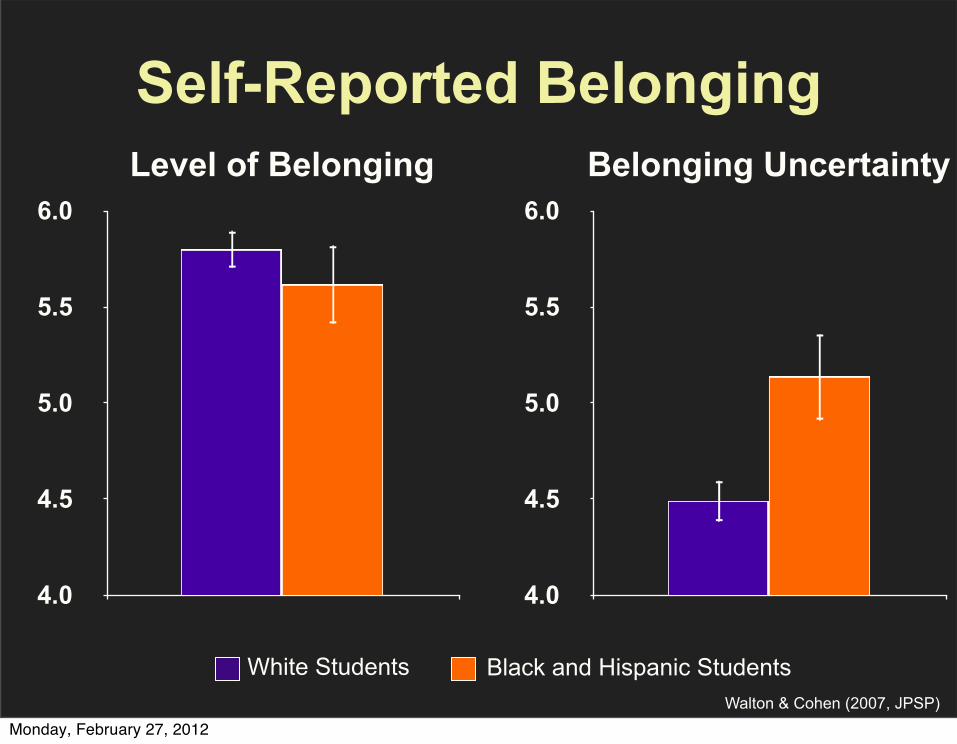
Self-Reported Belonging
4.0
4.5
5.0
5.5
6.0Level of Belonging
4.0
4.5
5.0
5.5
6.0Belonging Uncertainty
White Students Black and Hispanic StudentsWalton & Cohen (2007, JPSP)
Monday, February 27, 2012
A Social Belonging Intervention(with Geoff Cohen)
Monday, February 27, 2012

Social-Belonging Intervention• Two questions:
– Are stereotyped students more likely to globalize negative experiences in school as evidence that they do not belong?
– Can this process be short-circuited?• Hypotheses
– Treatment would sustain stereotyped students’ sense of belonging in the face of adversity
– Effects may self-sustain over time and raise stereotyped students’ achievement
Monday, February 27, 2012

Attributional Retraining• Treatment: First-year students learn that
doubts about belonging in college are:– common at first and short-lived
• Presented with:– Survey summary statistics– Representative quotations attributed to
ethnically diverse juniors and seniors
Freshman year, even though I met large numbers of people, I didn’t have a small group of close friends . . . I had to remind myself that making close friends takes time. Since then . . . I have met people, some of whom are now just as close as my friends in high school were. - Junior, Asian-American male
Monday, February 27, 2012
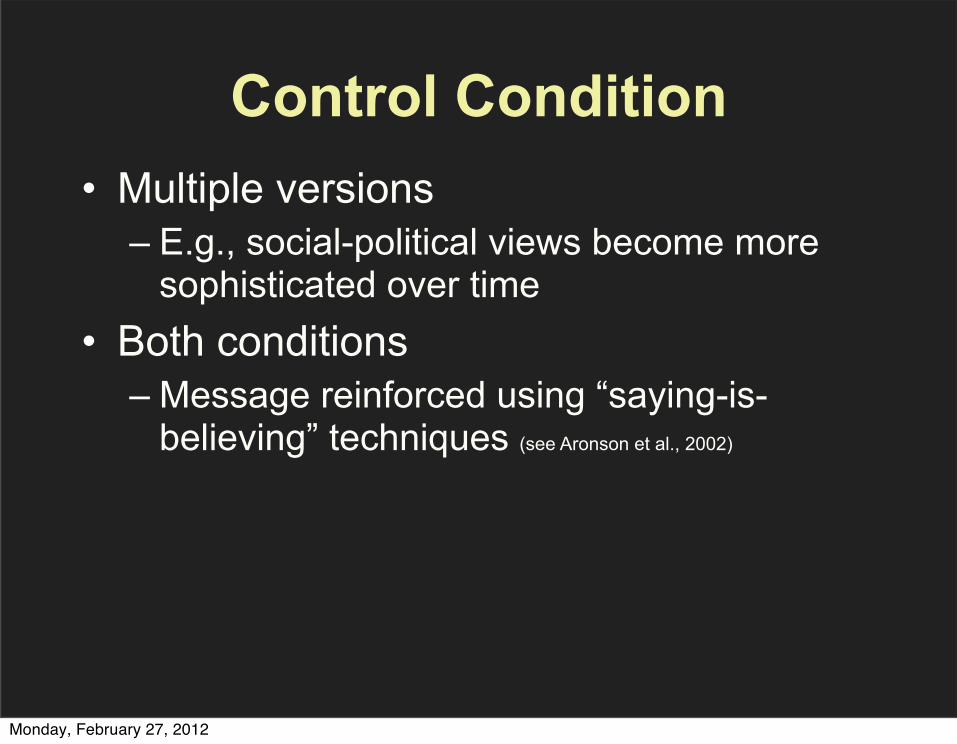
Control Condition• Multiple versions
– E.g., social-political views become more sophisticated over time
• Both conditions– Message reinforced using “saying-is-
believing” techniques (see Aronson et al., 2002)
Monday, February 27, 2012

Long-Term Effects on Academic Performance
3-Year Follow-Up Among Two Cohorts of Students
Monday, February 27, 2012
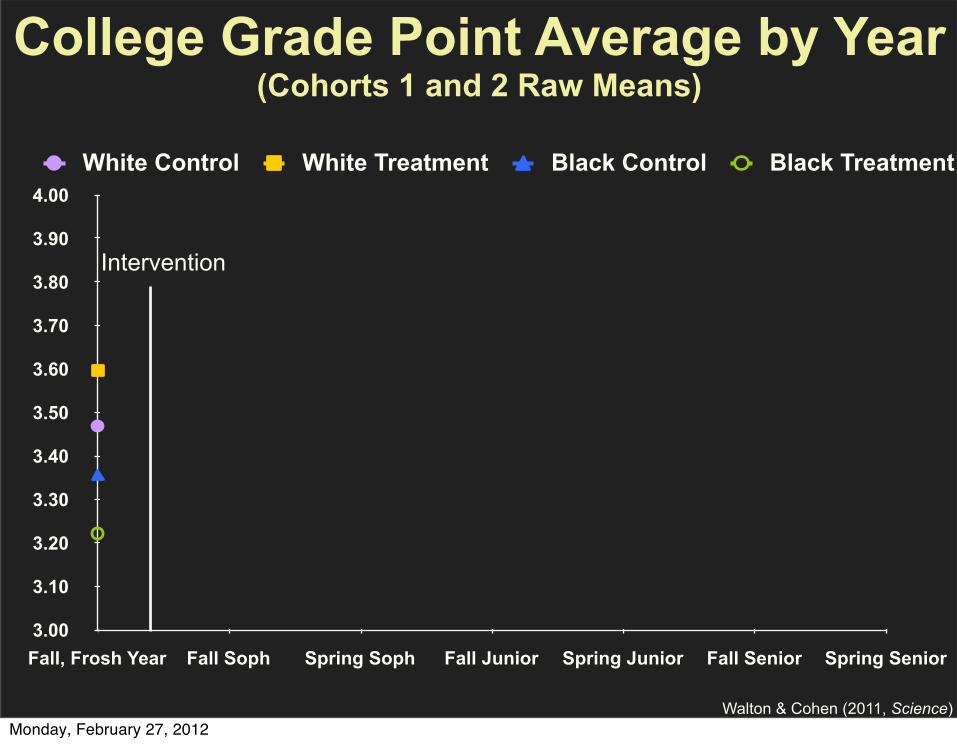
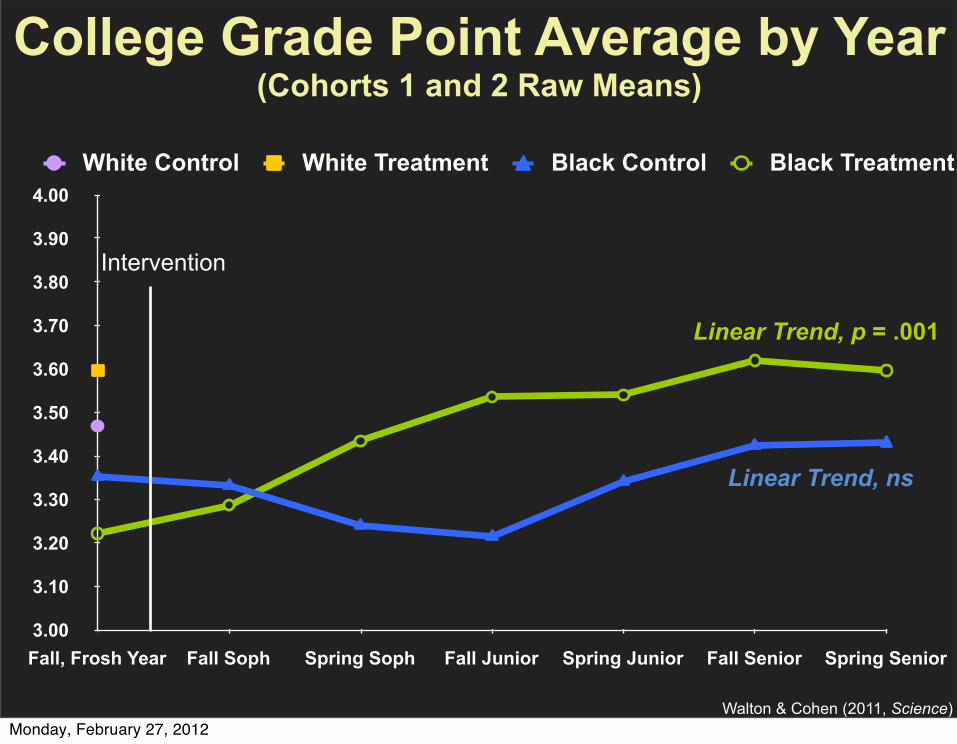
College Grade Point Average by Year (Cohorts 1 and 2 Raw Means)
3.00
3.10
3.20
3.30
3.40
3.50
3.60
3.70
3.80
3.90
4.00
Fall, Frosh Year Fall Soph Spring Soph Fall Junior Spring Junior Fall Senior Spring Senior
White Control White Treatment Black Control Black Treatment
Intervention
Walton & Cohen (2011, Science)Monday, February 27, 2012
College Grade Point Average by Year (Cohorts 1 and 2 Raw Means)
3.00
3.10
3.20
3.30
3.40
3.50
3.60
3.70
3.80
3.90
4.00
Fall, Frosh Year Fall Soph Spring Soph Fall Junior Spring Junior Fall Senior Spring Senior
White Control White Treatment Black Control Black Treatment
Intervention
Linear Trend, p = .001
Linear Trend, ns
Walton & Cohen (2011, Science)Monday, February 27, 2012

College Grade Point Average by Year (Cohorts 1 and 2 Raw Means)
3.00
3.10
3.20
3.30
3.40
3.50
3.60
3.70
3.80
3.90
4.00
Fall, Frosh Year Fall Soph Spring Soph Fall Junior Spring Junior Fall Senior Spring Senior
White Control White Treatment Black Control Black Treatment
Intervention
Walton & Cohen (2011, Science)Monday, February 27, 2012
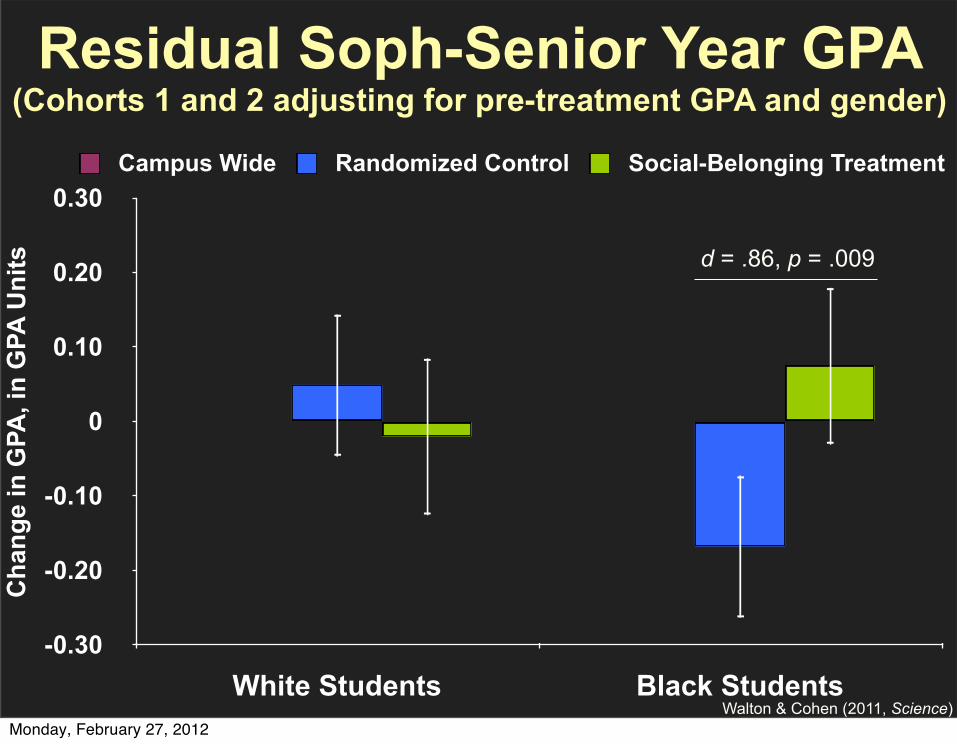
-0.30
-0.20
-0.10
0
0.10
0.20
0.30
White Students Black Students
Cha
nge
in G
PA, i
n G
PA U
nits
Campus Wide Randomized Control Social-Belonging Treatment
Residual Soph-Senior Year GPA (Cohorts 1 and 2 adjusting for pre-treatment GPA and gender)
d = .86, p = .009
Walton & Cohen (2011, Science)Monday, February 27, 2012
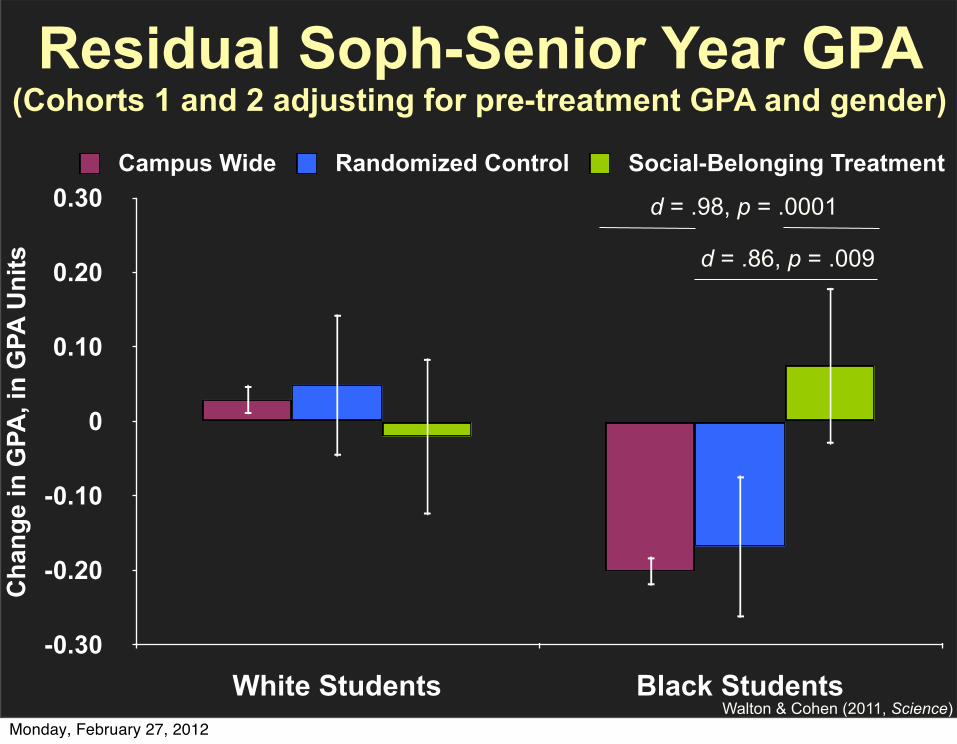
-0.30
-0.20
-0.10
0
0.10
0.20
0.30
White Students Black Students
Cha
nge
in G
PA, i
n G
PA U
nits
Campus Wide Randomized Control Social-Belonging Treatment
Residual Soph-Senior Year GPA (Cohorts 1 and 2 adjusting for pre-treatment GPA and gender)
d = .98, p = .0001
d = .86, p = .009
Walton & Cohen (2011, Science)Monday, February 27, 2012
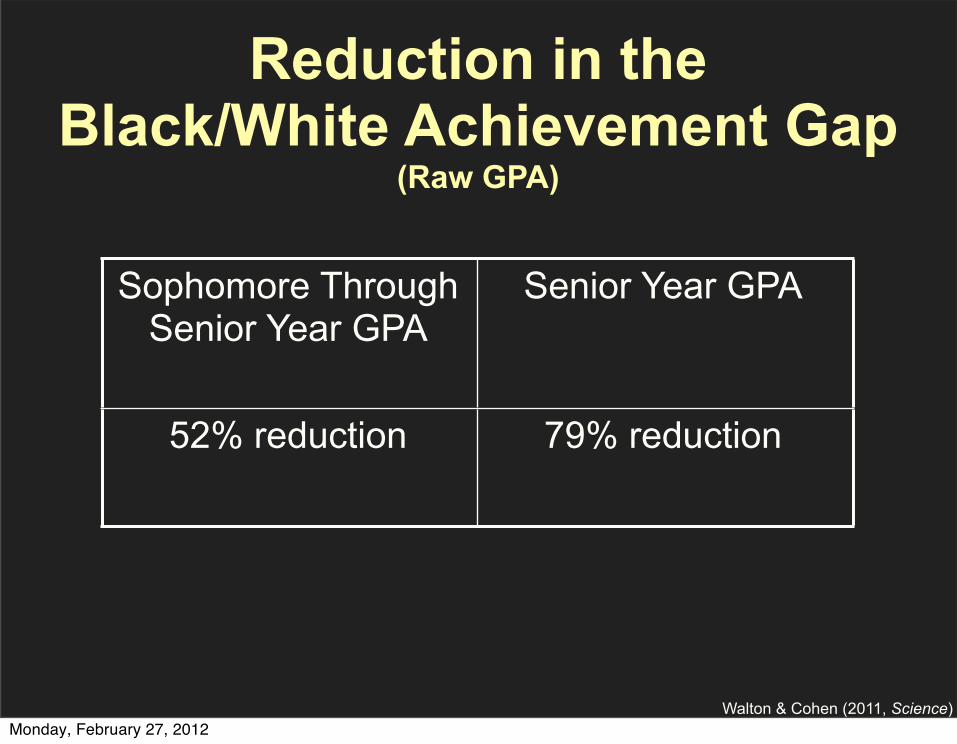
Sophomore Through Senior Year GPA
Senior Year GPA
52% reduction 79% reduction
Reduction in the Black/White Achievement Gap
(Raw GPA)
Walton & Cohen (2011, Science)Monday, February 27, 2012
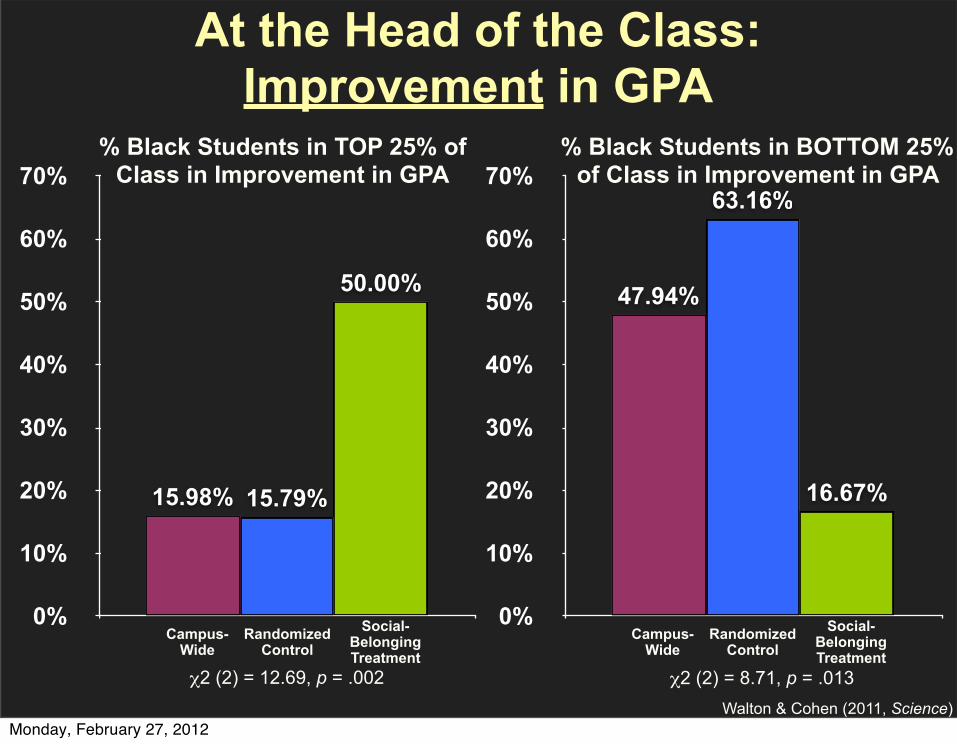
0%
10%
20%
30%
40%
50%
60%
70%
50.00%
15.79%15.98%
% Black Students in TOP 25% of Class in Improvement in GPA
χ2 (2) = 12.69, p = .002
0%
10%
20%
30%
40%
50%
60%
70%
16.67%
63.16%
47.94%
χ2 (2) = 8.71, p = .013
% Black Students in BOTTOM 25% of Class in Improvement in GPA
At the Head of the Class:Improvement in GPA
Campus-Wide
Randomized Control
Social-Belonging Treatment
Campus-Wide
Randomized Control
Social-Belonging Treatment
Walton & Cohen (2011, Science)Monday, February 27, 2012
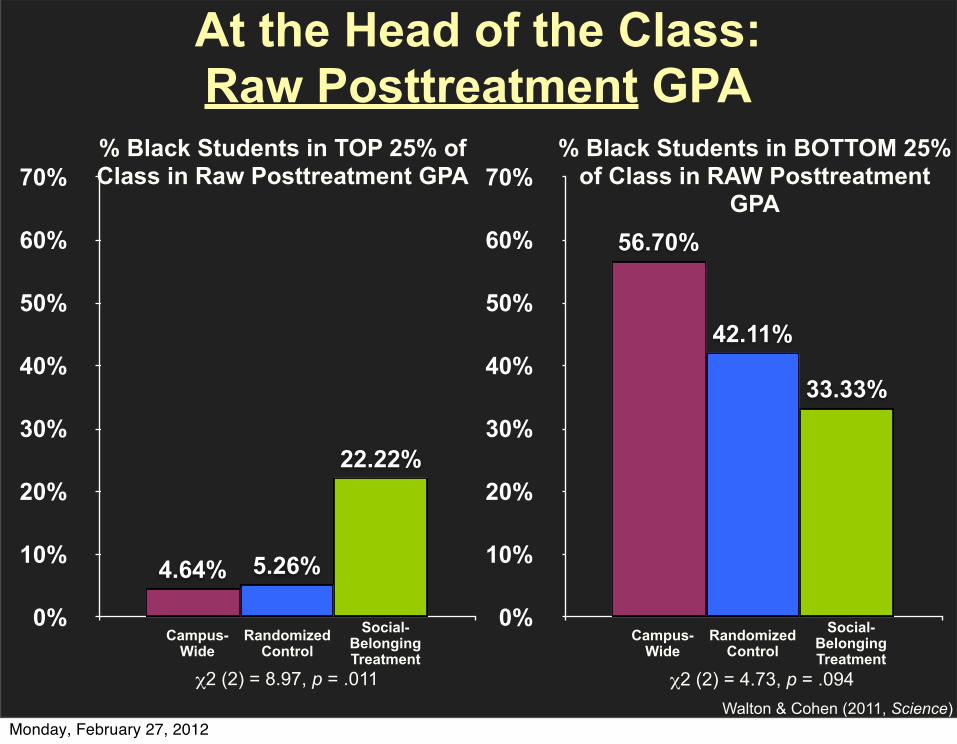
0%
10%
20%
30%
40%
50%
60%
70%
22.22%
5.26%4.64%
% Black Students in TOP 25% of Class in Raw Posttreatment GPA
χ2 (2) = 8.97, p = .011
0%
10%
20%
30%
40%
50%
60%
70%
33.33%
42.11%
56.70%
χ2 (2) = 4.73, p = .094
% Black Students in BOTTOM 25% of Class in RAW Posttreatment
GPA
At the Head of the Class:Raw Posttreatment GPA
Campus-Wide
Randomized Control
Social-Belonging Treatment
Campus-Wide
Randomized Control
Social-Belonging Treatment
Walton & Cohen (2011, Science)Monday, February 27, 2012
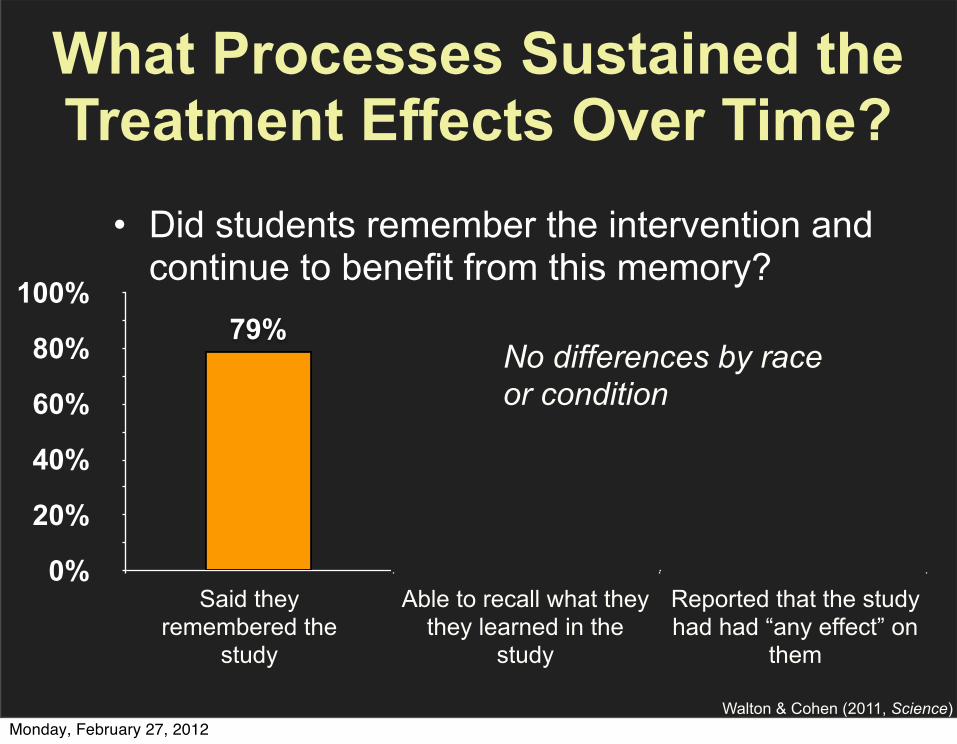
What Processes Sustained the Treatment Effects Over Time?
0%
20%
40%
60%
80%
100%
14%8%
79%
Said they remembered the
study
Able to recall what they they learned in the
study
Reported that the study had had “any effect” on
them
No differences by race or condition
Walton & Cohen (2011, Science)
• Did students remember the intervention and continue to benefit from this memory?
Monday, February 27, 2012
• Did students remember the intervention and continue to benefit from this memory?
• By securing students’ sense of belonging in college?
What Processes Sustained the Treatment Effects Over Time?
Monday, February 27, 2012

Daily Diary Measures(completed in the first week after the intervention)
• How did students’ respond when they experienced high levels of adversity in school?
• Daily diaries – Assessed how much adversity students
experienced each day– Assessed students’ level of belonging that night
and the next day• Calculated the within-subjects correlation
between adversity and belonging
Monday, February 27, 2012
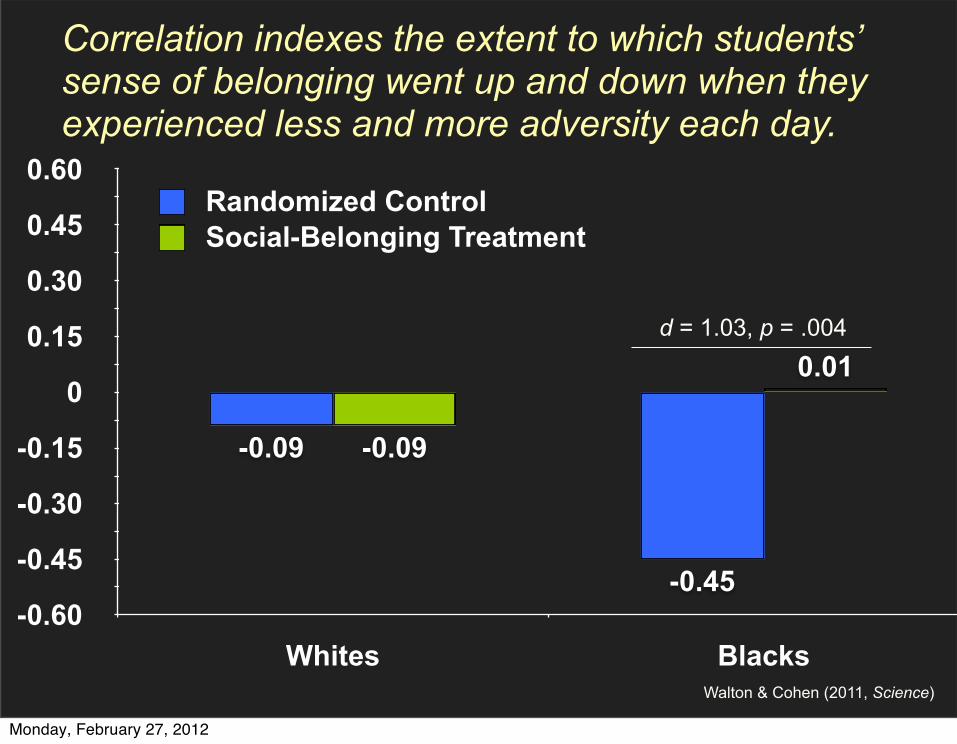
Walton & Cohen (2011, Science)
Correlation indexes the extent to which students’ sense of belonging went up and down when they experienced less and more adversity each day.
-0.60
-0.45
-0.30
-0.15
0
0.15
0.30
0.45
0.60
Whites Blacks
0.01
-0.09
-0.45
-0.09
Randomized ControlSocial-Belonging Treatment
d = 1.03, p = .004
Monday, February 27, 2012

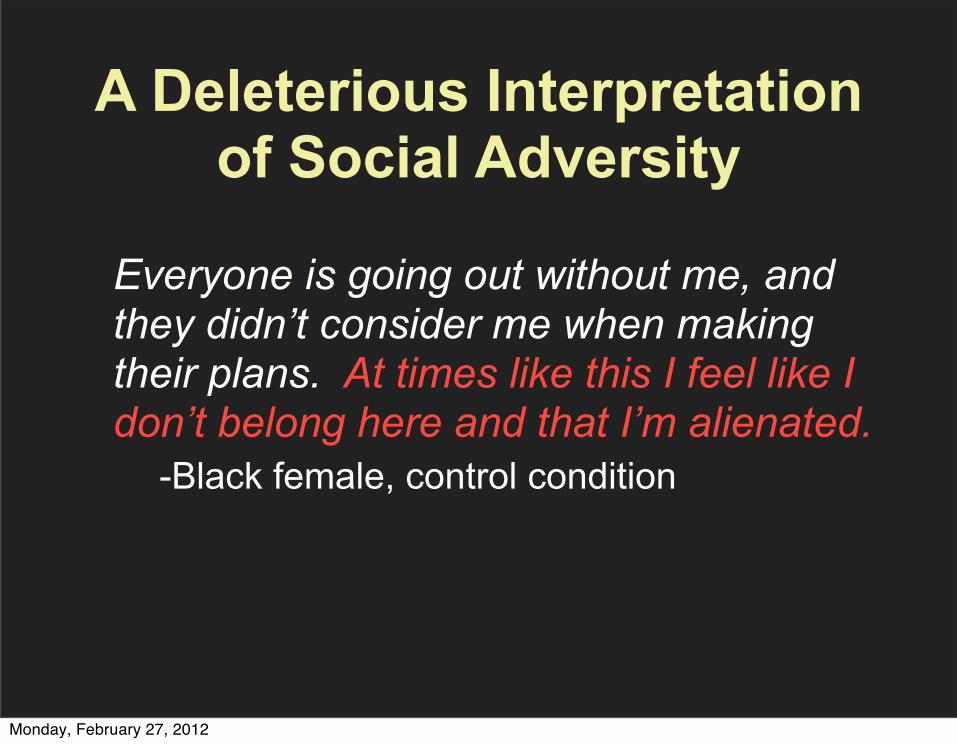
A Deleterious Interpretation of Social Adversity
Everyone is going out without me, and they didn’t consider me when making their plans. At times like this I feel like I don’t belong here and that I’m alienated.
-Black female, control condition
Monday, February 27, 2012
A Deleterious Interpretation of Social Adversity
Everyone is going out without me, and they didn’t consider me when making their plans. At times like this I feel like I don’t belong here and that I’m alienated.
-Black female, control condition
Monday, February 27, 2012
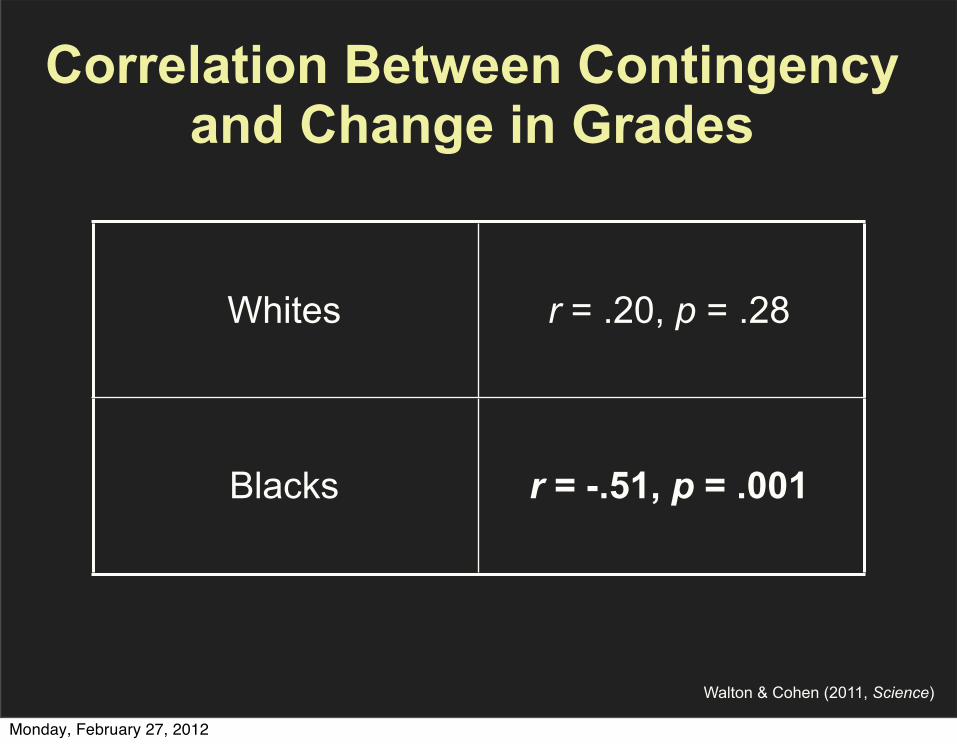
Correlation Between Contingency and Change in Grades
Whites r = .20, p = .28
Blacks r = -.51, p = .001
Walton & Cohen (2011, Science)
Monday, February 27, 2012
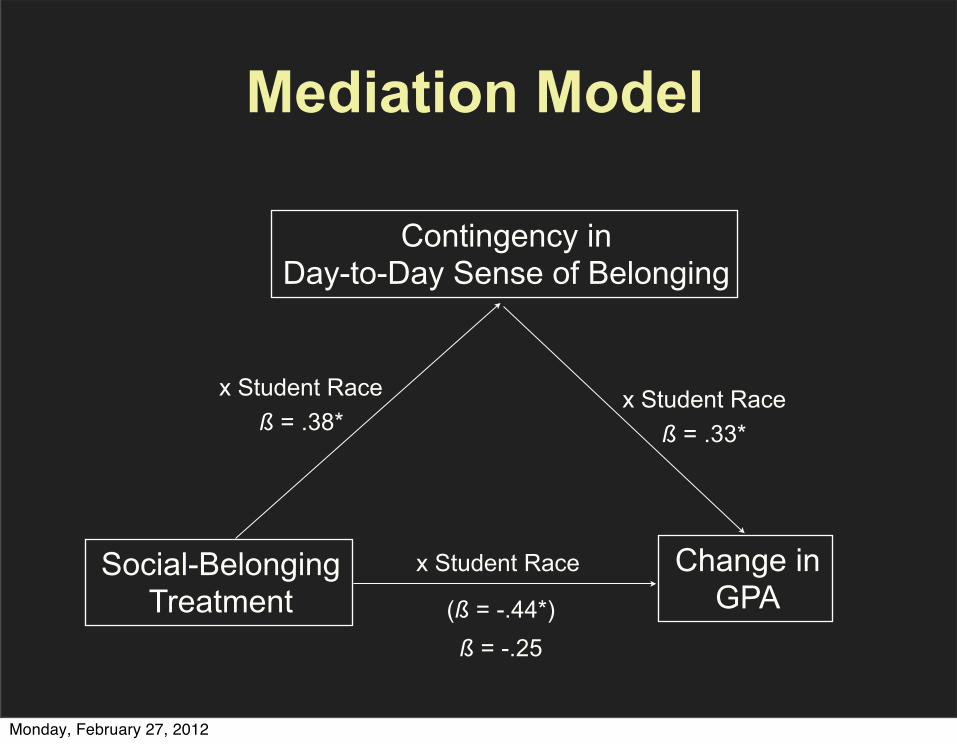
Change in GPA
Social-Belonging Treatment
Contingency in Day-to-Day Sense of Belonging
x Student Race
x Student Race
(ß = -.44*)
ß = .38* ß = .33*
Mediation Model
x Student Race
ß = -.25
Monday, February 27, 2012
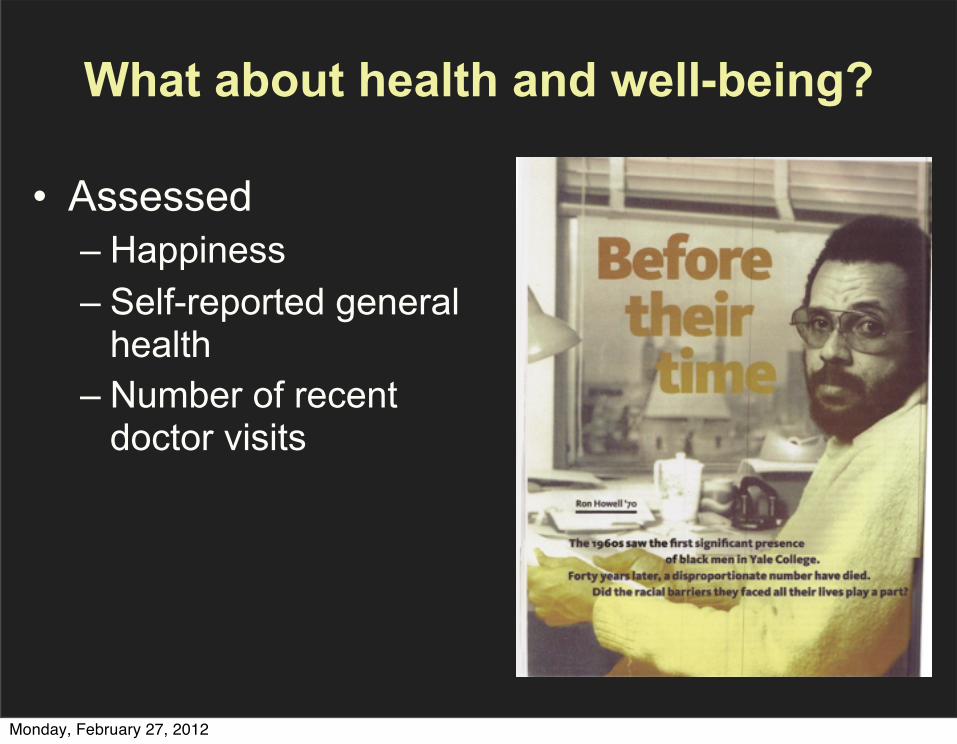
What about health and well-being?
• Assessed– Happiness– Self-reported general
health– Number of recent
doctor visits
Monday, February 27, 2012

Subjective Happiness 3 Years Post-Treatment
(4-items, e.g., “In general, I consider myself” 1=not a very happy person, 7=a very happy person; Lyubomirsky & Lepper, 1999; controlling for pre-treatment attitudes, SAT-Score)
1.00
2.00
3.00
4.00
5.00
6.00
7.00
Whites Blacks
Randomized ControlSocial-Belonging Treatment d = 1.17, p = .008
Walton & Cohen (2011, Science)
Monday, February 27, 2012
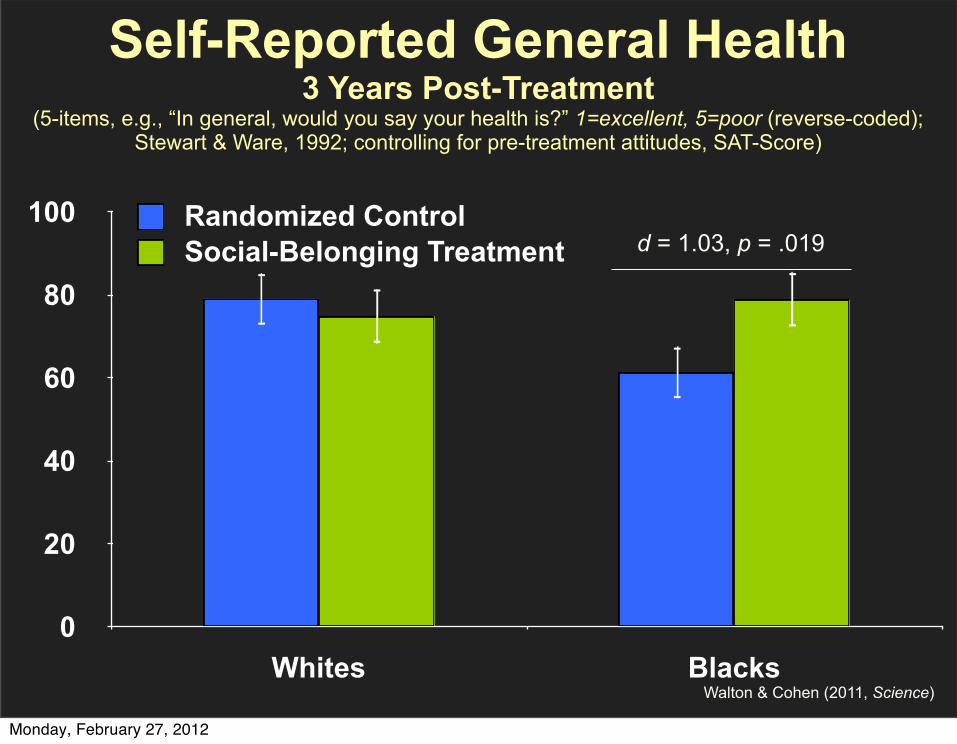
Self-Reported General Health3 Years Post-Treatment
(5-items, e.g., “In general, would you say your health is?” 1=excellent, 5=poor (reverse-coded); Stewart & Ware, 1992; controlling for pre-treatment attitudes, SAT-Score)
0
20
40
60
80
100
Whites Blacks
Randomized ControlSocial-Belonging Treatment d = 1.03, p = .019
Walton & Cohen (2011, Science)
Monday, February 27, 2012
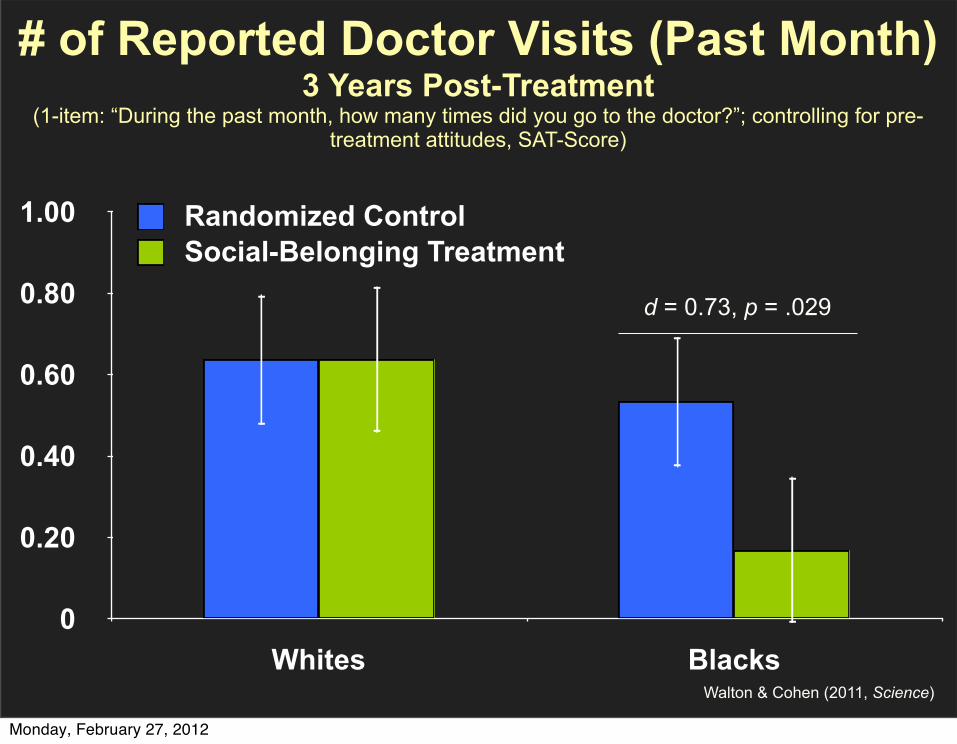
# of Reported Doctor Visits (Past Month)3 Years Post-Treatment
(1-item: “During the past month, how many times did you go to the doctor?”; controlling for pre-treatment attitudes, SAT-Score)
0
0.20
0.40
0.60
0.80
1.00
Whites Blacks
Randomized ControlSocial-Belonging Treatment
d = 0.73, p = .029
Walton & Cohen (2011, Science)
Monday, February 27, 2012

Psychological Interventions: Not Silver Bullets
(Yeager & Walton, 2011)
• Not needed everywhere– Remedy threats that exist within a given context
• Work through the context– Long-term effects depend on a chain of social,
psychological, and academic processes
Monday, February 27, 2012

Trial 2: Three Questions• Context:
– Is the belonging intervention most effective in contexts that elicit higher levels of threat?
• Social and psychological process: – Does the belonging intervention transform students’ social
and psychological lives broadly?
• Generalization to a new group: – Can the belonging intervention improve outcomes for
another negatively stereotyped group?
Monday, February 27, 2012

Women in Engineering(with Christine Logel, Jennifer Peach, Steve Spencer, and Mark Zanna)
• Men and women in an elite engineering program– Enrolled in gender diverse or male-dominated
engineering majors
Monday, February 27, 2012
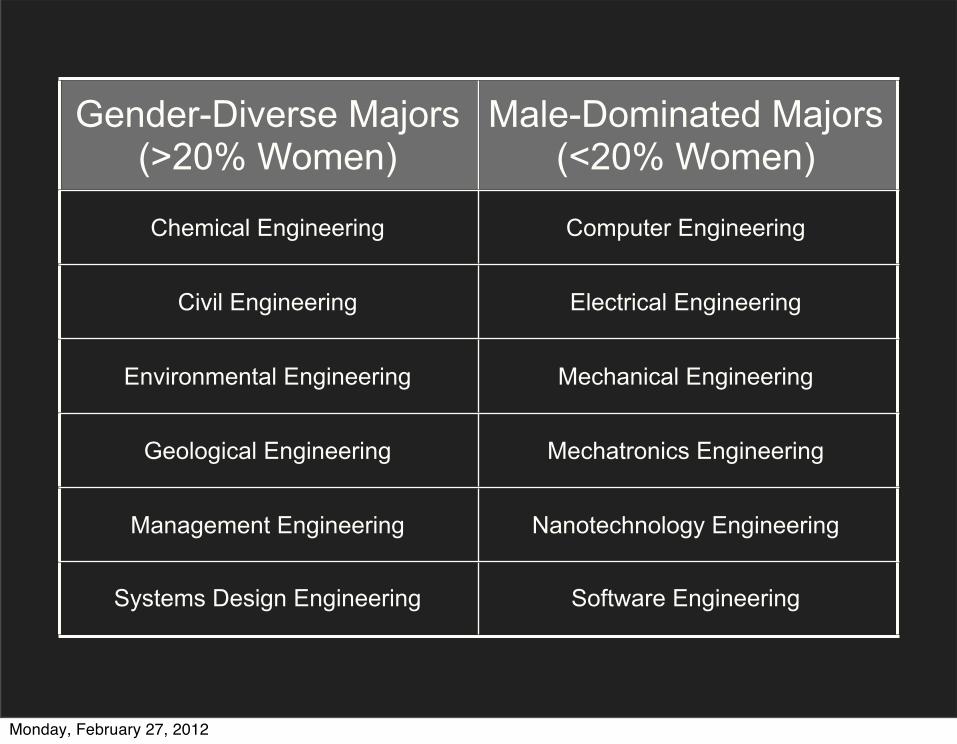
Gender-Diverse Majors (>20% Women)
Male-Dominated Majors (<20% Women)
Chemical Engineering Computer Engineering
Civil Engineering Electrical Engineering
Environmental Engineering Mechanical Engineering
Geological Engineering Mechatronics Engineering
Management Engineering Nanotechnology Engineering
Systems Design Engineering Software Engineering
Monday, February 27, 2012
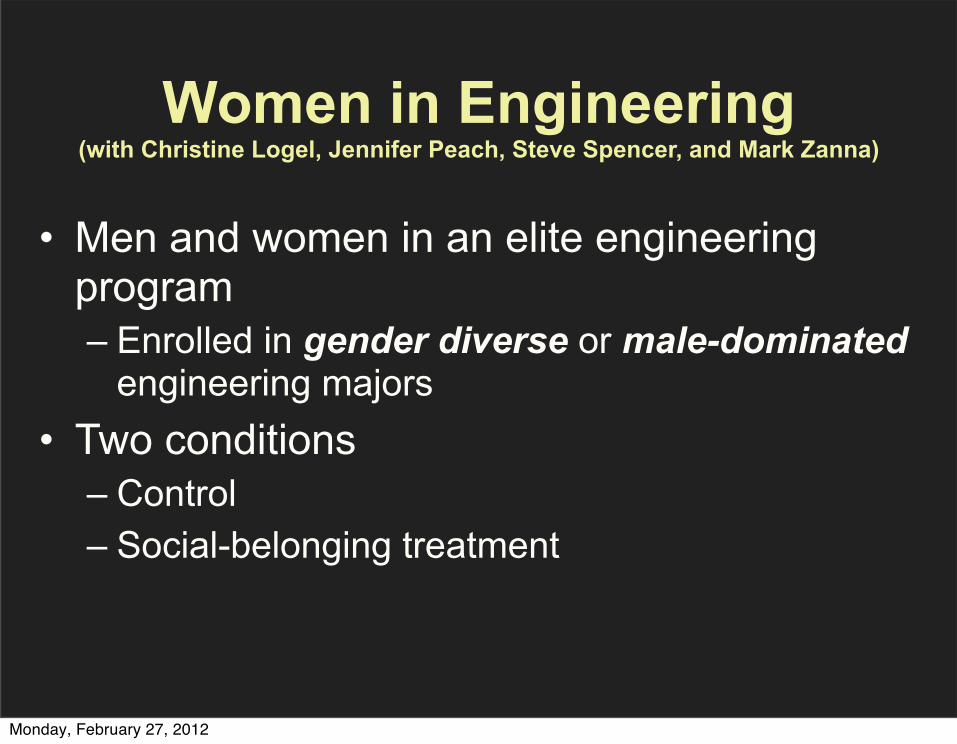
Women in Engineering(with Christine Logel, Jennifer Peach, Steve Spencer, and Mark Zanna)
• Men and women in an elite engineering program– Enrolled in gender diverse or male-dominated
engineering majors• Two conditions
– Control – Social-belonging treatment
Monday, February 27, 2012
STEP Program
Monday, February 27, 2012
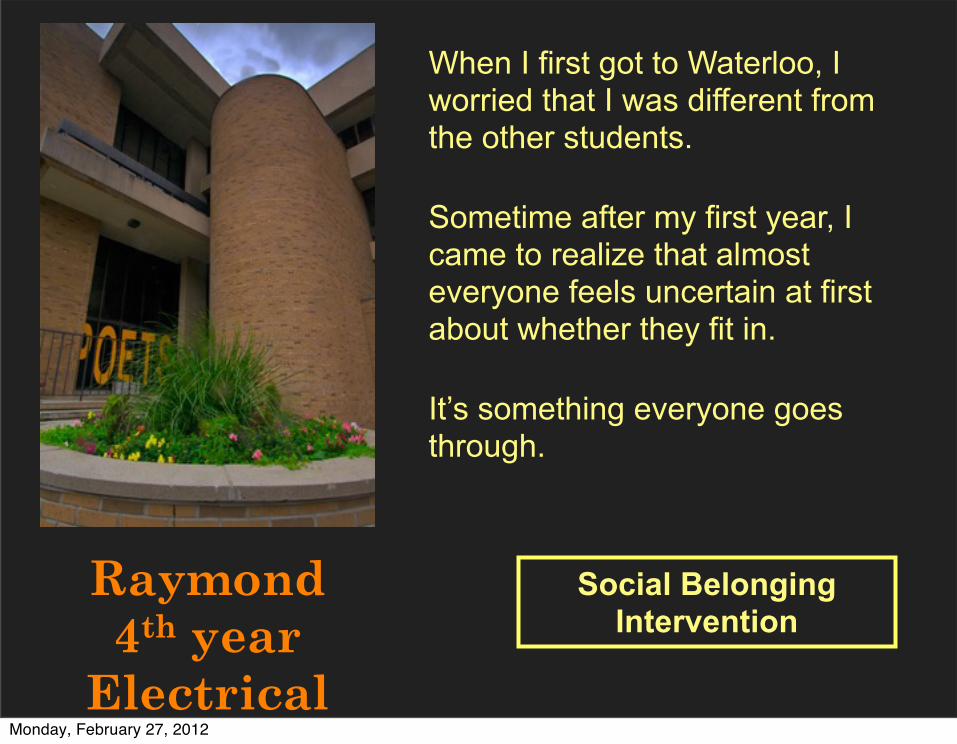
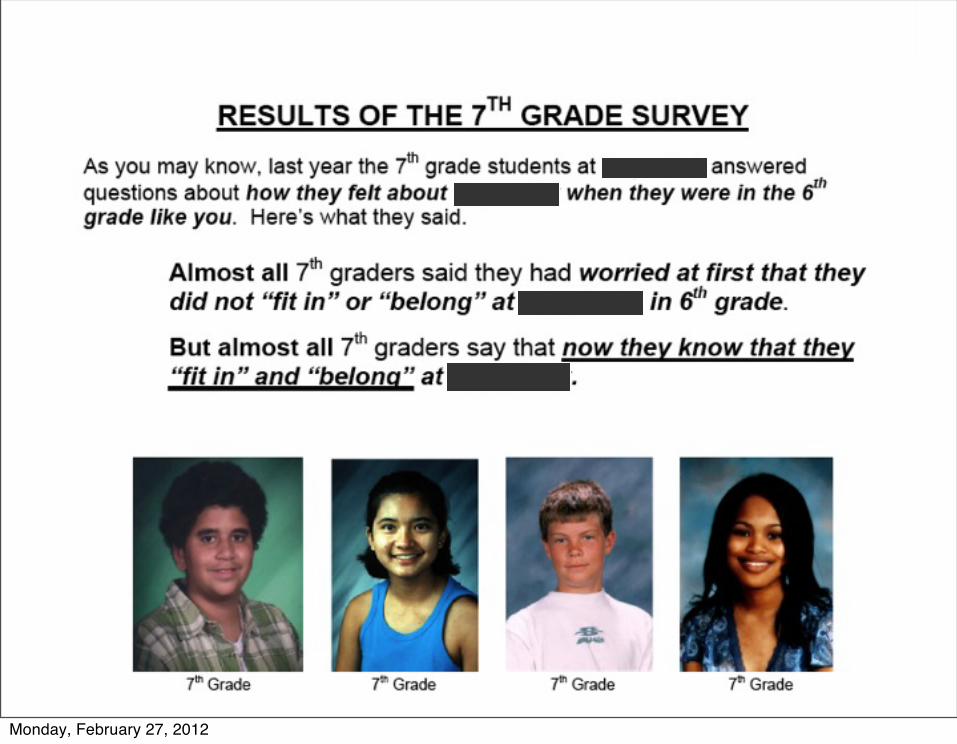
When I first got to Waterloo, I worried that I was different from the other students.
Sometime after my first year, I came to realize that almost everyone feels uncertain at first about whether they fit in.
It’s something everyone goes through.
Raymond 4th year
Electrical
Social Belonging Intervention
Monday, February 27, 2012
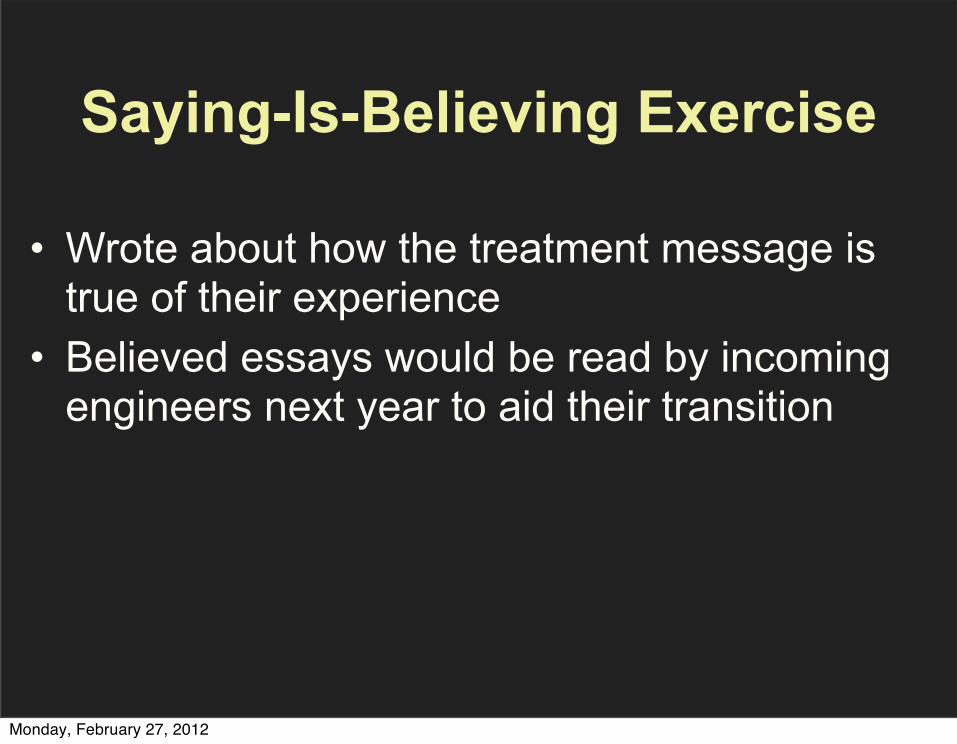
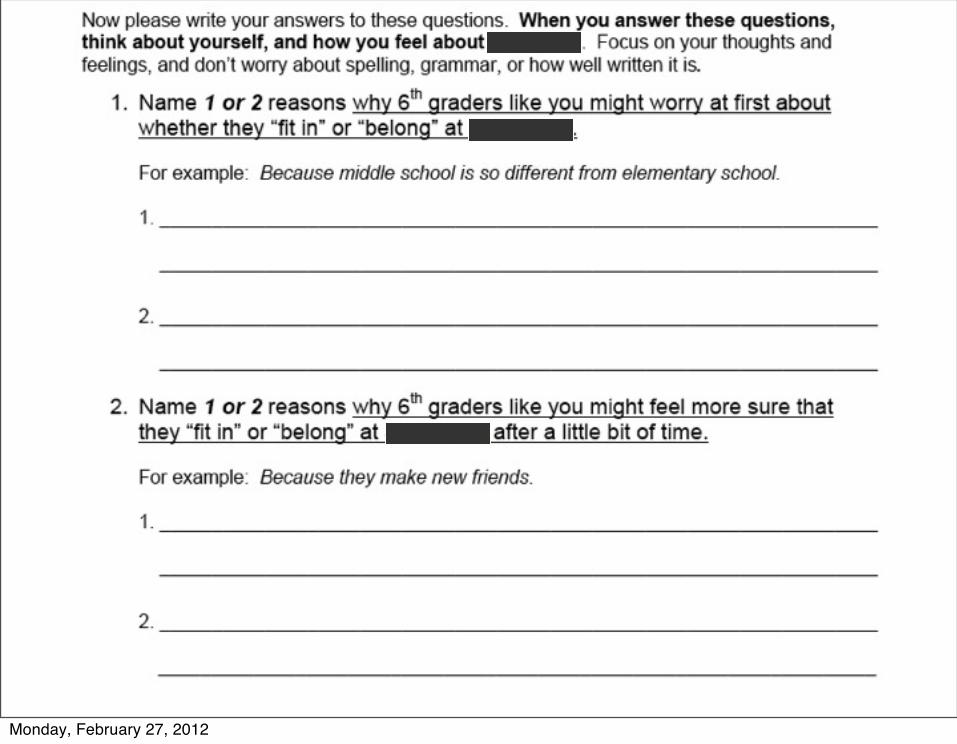
• Wrote about how the treatment message is true of their experience
• Believed essays would be read by incoming engineers next year to aid their transition
Saying-Is-Believing Exercise
Monday, February 27, 2012
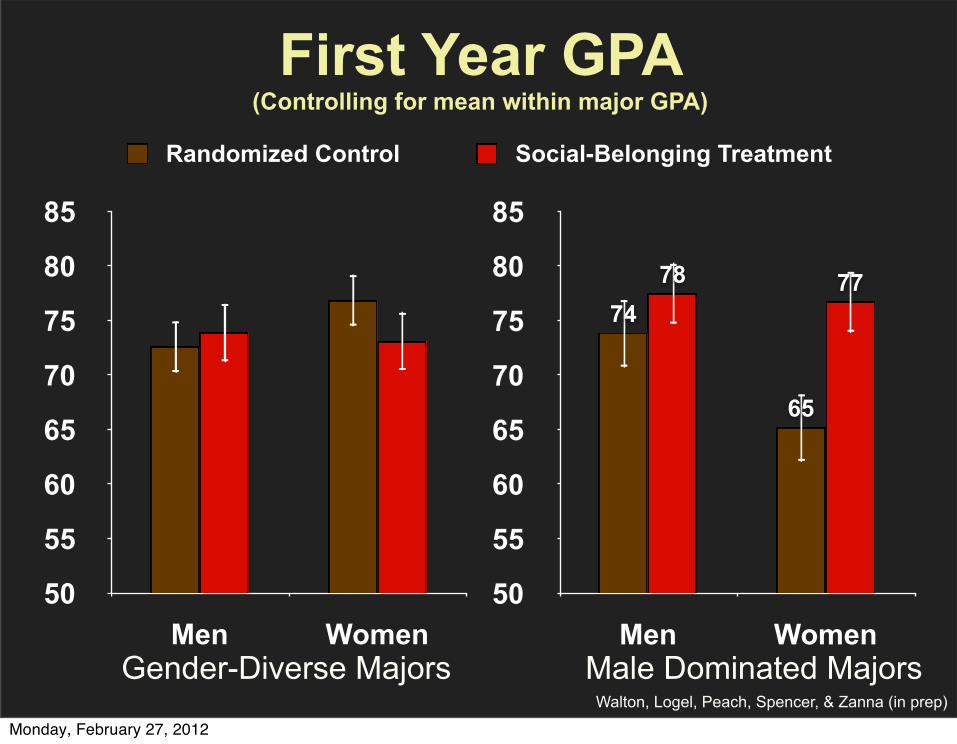
First Year GPA (Controlling for mean within major GPA)
50
55
60
65
70
75
80
85
Men Women
Randomized Control Social-Belonging Treatment
Gender-Diverse Majors
50
55
60
65
70
75
80
85
Men Women
7778
65
74
Male Dominated MajorsWalton, Logel, Peach, Spencer, & Zanna (in prep)
Monday, February 27, 2012

0%10%20%30%40%50%60%70%80%90%
100%
Control Social-Belonging
4%9% 9%10%
49%41%
38%40%
% Female Eng. % Male Eng. % Female Non-Eng. % Male Non-Eng.
Women’s Friend Networks:(% in each category among 5 closest friends, controlling for preintervention)
Walton, Logel, Peach, Spencer, & Zanna (in prep)
Gender-Diverse Majors
Monday, February 27, 2012
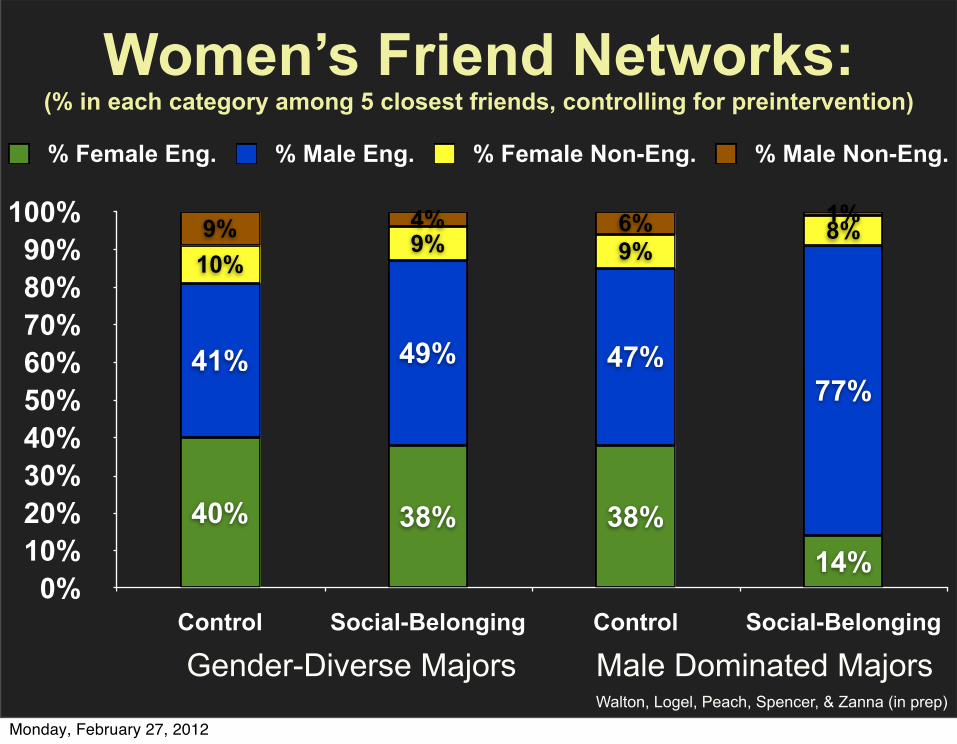
0%10%20%30%40%50%60%70%80%90%
100%
Control Social-Belonging Control Social-Belonging
1%6%4%9% 8%9%9%
10%
77%47%49%41%
14%38%38%40%
% Female Eng. % Male Eng. % Female Non-Eng. % Male Non-Eng.
Male Dominated Majors
Women’s Friend Networks:(% in each category among 5 closest friends, controlling for preintervention)
Gender-Diverse MajorsWalton, Logel, Peach, Spencer, & Zanna (in prep)
Monday, February 27, 2012
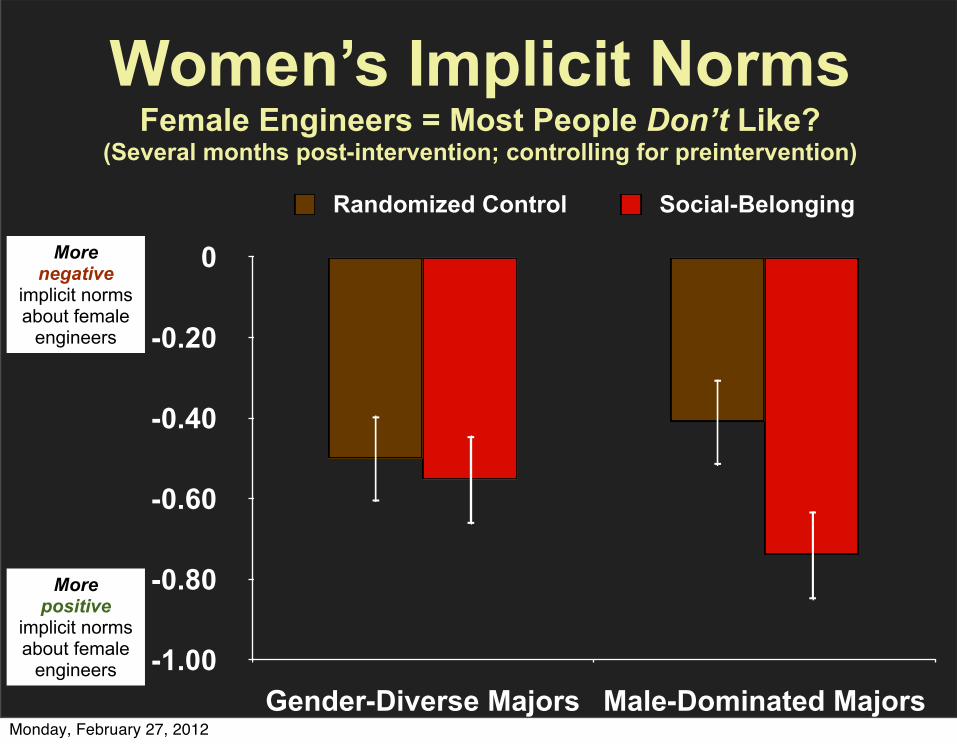
Women’s Implicit NormsFemale Engineers = Most People Don’t Like?
(Several months post-intervention; controlling for preintervention)
-1.00
-0.80
-0.60
-0.40
-0.20
0
Gender-Diverse Majors Male-Dominated Majors
Randomized Control Social-Belonging
More positive
implicit norms about female
engineers
More negative
implicit norms about female
engineers
Monday, February 27, 2012
Context Matters
• Psychological interventions remedy psychological threats that arise within specific contexts
• Can transform students’ social, psychological,and academic lives
Monday, February 27, 2012
Trial 3: Adolescents
• Black and White students entering middle school
• Randomly assigned to condition at the beginning of 6th grade– Control condition– Social-belonging treatment (2 doses, a
month apart)
Monday, February 27, 2012
57
Monday, February 27, 2012
58
Monday, February 27, 2012
59
Monday, February 27, 2012
60
Monday, February 27, 2012
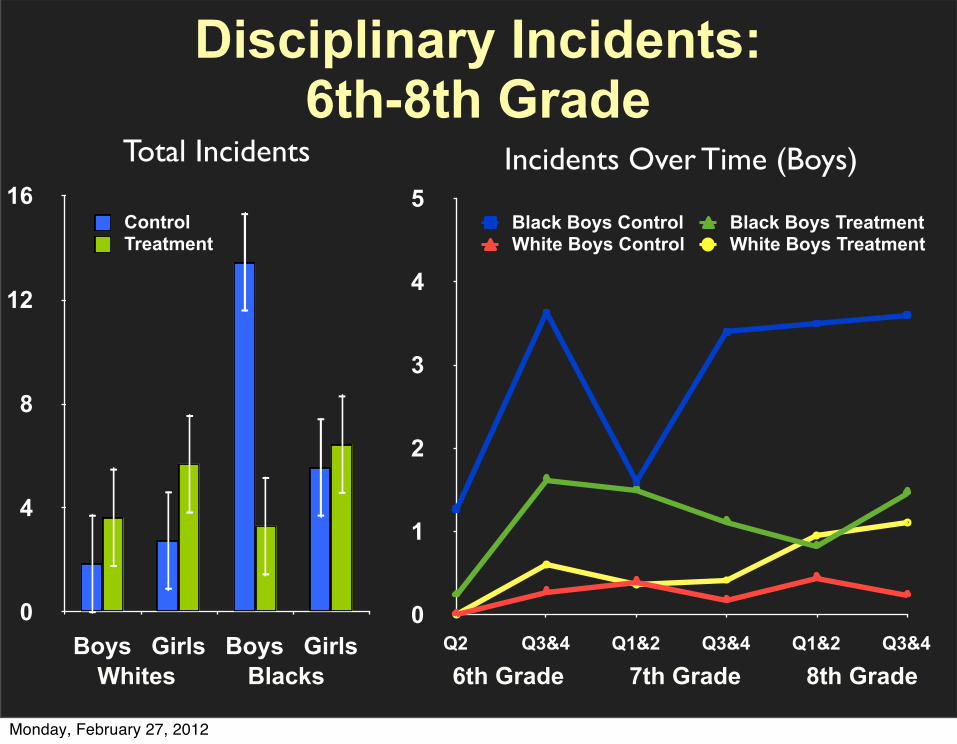
Disciplinary Incidents: 6th-8th Grade
0
4
8
12
16
Boys Girls Boys Girls
Total Incidents
ControlTreatment
Whites Blacks
0
1
2
3
4
5
Q2 Q3&4 Q1&2 Q3&4 Q1&2 Q3&4
Incidents Over Time (Boys)
Black Boys Control Black Boys TreatmentWhite Boys Control White Boys Treatment
6th Grade 7th Grade 8th Grade
Monday, February 27, 2012
Implications for Education
• Problems in education are, in part, psychological problems
• Psychological interventions work hand-in-hand with traditional education reforms
Monday, February 27, 2012
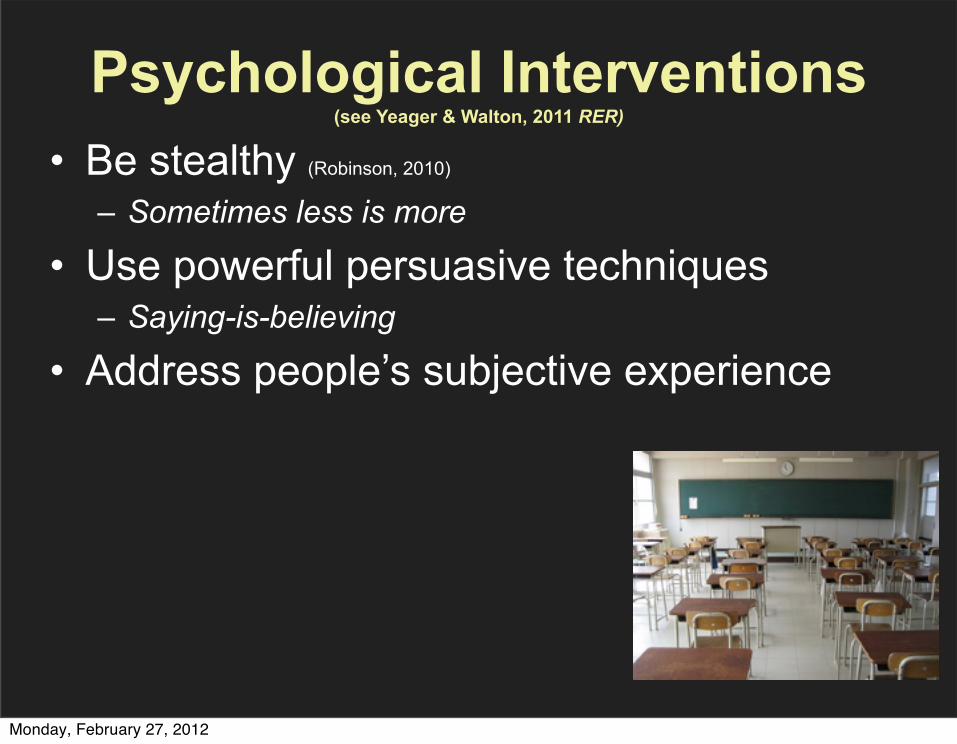
Psychological Interventions(see Yeager & Walton, 2011 RER)
• Be stealthy (Robinson, 2010)
– Sometimes less is more
• Use powerful persuasive techniques – Saying-is-believing
• Address people’s subjective experience
Monday, February 27, 2012
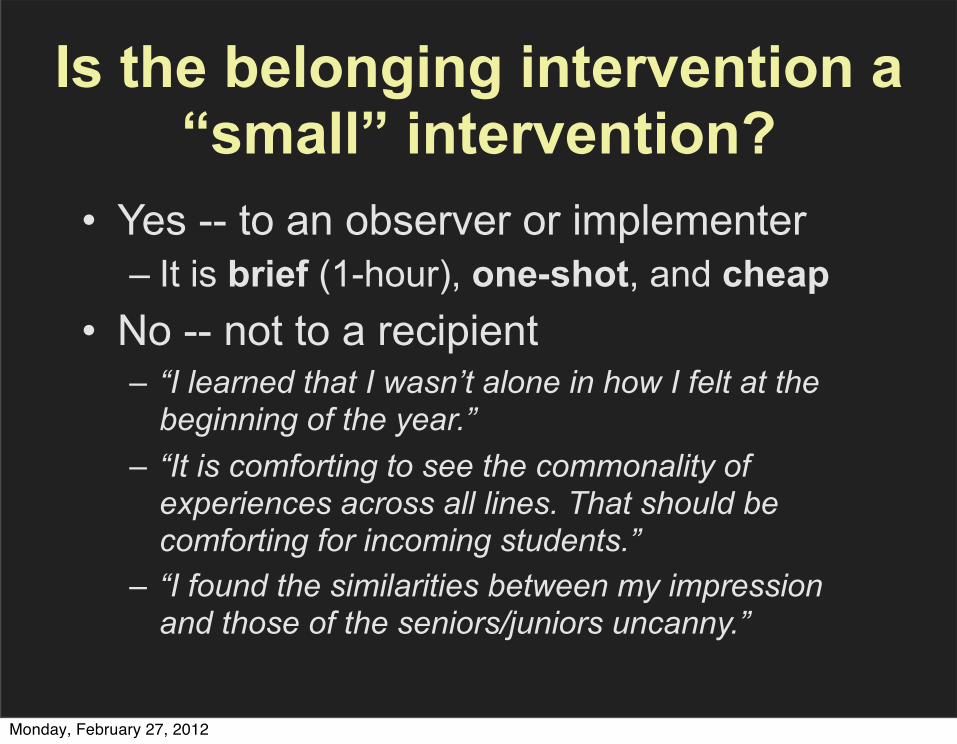
Is the belonging intervention a “small” intervention?
• Yes -- to an observer or implementer– It is brief (1-hour), one-shot, and cheap
• No -- not to a recipient– “I learned that I wasn’t alone in how I felt at the
beginning of the year.”– “It is comforting to see the commonality of
experiences across all lines. That should be comforting for incoming students.”
– “I found the similarities between my impression and those of the seniors/juniors uncanny.”
Monday, February 27, 2012

• Be stealthy (Robinson, 2010)
– Sometimes less is more
• Use powerful persuasive techniques – Saying-is-believing
• Address people’s subjective experience• Target processes that can be recursive
– Construal of and response to adversity– Development of social networks
• Target “psychological hubs”– E.g., social belonging
Psychological Interventions(see Yeager & Walton, 2011 RER)
Monday, February 27, 2012
• Need to develop ways to scale-up psychological interventions – Internet-based approaches?
• The Project for Education Research that Scales (www.perts.net)
– Teacher training approaches?– A need for “psychological engineers”?
Psychological Interventions(see Yeager & Walton, 2011 RER)
Monday, February 27, 2012
• Negatively stereotyped students confront unique psychological barriers in school that impede achievement
• A consequence: – Grades and test scores assessed in typical academic
environments underestimate the ability and potential of stereotyped students (Walton & Spencer, 2009)
• A merit-based rationale for affirmative action– Accounting for bias in measures of merit would
promote diversity and meritocracy at once– Affirmative Meritocracy
Implications for Policy: Affirmative Action
(Walton, Spencer, & Erman, in press)
Monday, February 27, 2012
Thank you!• Collaborators
– Geoff Cohen– Carol Dweck– Christine Logel– Jason Okonofua– Dave Paunesku– Jennifer Peach– Steve Spencer– David Yeager– Mark Zanna
• Funders– American Psychological
Association – Gates Foundation– The Hewlett Foundation– National Academy of Education– Raikes Foundation– Society for the Psychological
Study of Social Issues– Spencer Foundation
Monday, February 27, 2012
Top Related