


![COLORADO N S Colorado DRY B E A Dry Bean u ] v ] Àcsuag.com/cbn/CBN2902WEB.pdfSIZES TRADE AND DOMESTIC POLICY USDBC concluded a successful sum-mer meeting during the U.S. Dry Bean](https://static.fdocuments.us/doc/165x107/601b49bd786498287d23e4e6/colorado-n-s-colorado-dry-b-e-a-dry-bean-u-v-csuagcomcbn-sizes-trade-and.jpg)
Languages
Pages
Legal

1
A PROFILE OF THE SOUTH AFRICAN DRY BEAN MARKET VALUE CHAIN
2015
Directorate Marketing Tel: 012 319 8455 Private Bag X 15 Fax: 012 319 8131 Arcadia E-mail:[email protected] 0007 www.daff.gov.za
2
TABLE OF CONTENTS 1. DESCRIPTION OF THE INDUSTRY ................................................................................ 3
1.1 Production Areas ..................................................................................................... 4
1.2 Local Production ..................................................................................................... 6
2. MARKET STRUCTURE .................................................................................................. 6
2.1 Domestic Market ..................................................................................................... 6
2.2 Exports ................................................................................................................... 8
2.3 Imports ................................................................................................................... 8
3. PROCESSING ............................................................................................................. 12
3.1 Market Value Chain ............................................................................................... 12
4. MARKET INTELLIGENCE ............................................................................................ 14 4.1 Tariffs ................................................................................................................... 14
4.2 Performance of the South African dry bean industry ................................................. 16
5. ORGANIZATIONAL ANALYSIS ......................................................................................... 20 5.1 Opportunities and Challenges ................................................................................. 20
6. ROLE-PLAYERS IN THE DRY BEAN INDUSTRY .............................................................. 20 6.1. Dry Bean Traders .................................................................................................. 20
6.2. Dry Bean Packers ................................................................................................. 25
7. ACKNOWLEDGEMENTS .............................................................................................. 27

3
1. DESCRIPTION OF THE INDUSTRY Dry beans are a very good source of plant proteins, complex carbohydrates, soluble and insoluble dietary fibers have a low salt and fat content and no cholesterol. They also prevent degenerative western illnesses. Research results also indicate that with regular use, beans reduce cholesterol. The composition of cooked dry beans is shown in Figure 1 below.
Source: Dry Bean Producers Organization
In South Africa, three types of beans are mainly produced, namely Red Speckled beans, Small White canning beans and Large White Kidney beans. The Red Speckled beans command the biggest market share and are mainly sold in retail quantities in the supermarkets for preparation at home. Small White canning beans are mainly used for canning purposes and because of the increasing consumer demand for convenience foods, there is a growing market for these beans. Large White Kidney beans are mainly used for retail packaging and to a lesser extent for canning purposes. Other locally produced bean types such as the Haricot beans have a very limited domestic market. Dry beans are an ideal rotation crop and research has shown that dry beans ensure higher yields in a crop rotation system. From an economic perspective it makes sense to plant beans in a crop rotational system with maize on suitable soils. The recommendation is one year of dry beans out of every three to four years in a crop rotation system.
Carbohydrates 17%
Fibre 9%
Minerals 6%
Water 58%
Vitamins 0%
Proteins 9%
Fat 1%
Fgure 1: Composition Of Cooked Dry Beans
Carbohydrates Fibre Minerals Water Vitamins Proteins Fat

4
The contribution of the dry bean industry to the gross value of agricultural production is depicted in Figure 2 below.
Source: Statistics and Economic Analysis
Figure 2 depicts the gross value of dry bean production between the years 2005 and 2014. On average, the local dry bean industry contributes R493 million towards the gross value of agricultural production and this represents a 1% contribution towards the total field crop’s GVP. It is also clear from Figure 2 that the highest dry bean industry’s contribution to the gross value of agricultural production was experienced during the year 2014 when the value of dry beans produced locally amounted to over R700 million. The lowest value of dry beans produced in the country was experienced during the year 2005 when this amounted to only R24.41 million.
1.1 Production Areas
Dry beans in South Africa are produced in the following areas: Mpumalanga/Gauteng (Middelburg, Nigel, Delmas and Ermelo), Free State (Bethlehem, Fouriesburg, Harrismith and Kroonstad), North West (Lichtenburg, Koster, and Brits), Limpopo (Thabazimbi, Koedoeskop), Kwazulu-Natal (Kokstad, Vryheid, Bergville, and Winterton) and Northern Cape (Kimberley, Douglas). Limpopo, North West, Free State, Kwazulu-Natal and Northern Cape are commercial production areas while the Lowveld in the Mpumalanga province and the Western Cape are seed production areas. The distribution of dry bean production in South Africa for 2014/15 production season is shown in figure 3 below which indicates that during the same season, greater volumes of dry beans were produced in Free State followed by Limpopo and Mpumalanga provinces, respectively. These are followed by Kwazulu-Natal, North West and the Gauteng provinces. It is also clear from the figure that Free State, Mpumalanga and Limpopo Provinces combined accounted for about 71% of South Africa’s total dry bean production during 2014/15 production season, with the remaining six provinces contributing only 29%.
0
200000
400000
600000
800000
1000000
1200000
2005 2006 2007 2008 2009 2010 2011 2012 2013 2014
GV
P (
R'0
00
)
Marketing Year
Figure 2: Gross Value of Production for Dry beans

5
Source: Statistics and Economic Analysis
Table 1: Dry beans production trend by provinces
PROVINCE Production (tons) 2010/’11
Production (tons) 2011/’12
Production (tons) 2012/’13
Production (tons) 2013/’14
Production (tons) 2014/’15
Mean (tons) (2010/11- 2014/’15)
Western Cape
320 1000 400 400 400 360
Eastern Cape
100 240 200 1200 1000 391
Northern Cape
1000 1500 1700 2000 2200 1200
Free State 10 500 17600 19200 37700 29400 16343
Kwazulu-Natal
4 800 5200 7800 6500 7800 4586
Limpopo 9 360 6250 10890 9600 16800 9787
Mpumalanga
8 500 8500 11900 12200 10800 7414
Gauteng 1 900 2400 3400 4200 4800 3000
North-West 5 500 5000 4800 8300 6700 4323
Total 41 980 47690 60290 82100 79900 44566
Source: Statistics and Economic Analysis
Western Cape 0%
Eastern Cape 1%
Northen Cape 3%
Free State 37%
Kwazulu Natal 10%
Limpopo 21%
Mpumalanga 14%
Gautent 6%
North West 8%
Figure 3: Provincial Dry bean Production 2014/15
6
Table 1 confirms the earlier observation that Free State, Mpumalanga and Limpopo Provinces are the major producers of dry beans. The five year average dry bean production presented on the table indicates that Free Sate produces an average 16 thousand tons of dry beans per annum followed by Limpopo and Mpumalanga Provinces with average annual production of 9 000 and 7 000 tons respectively. On average, Limpopo and Gauteng provinces increased their dry bean production volume recent years while production from other provinces fluctuated over the period under analysis.
1.2 Local Production
It is estimated that there are roughly 1 200 dry bean producers in South Africa who produce an average of about 63 thousand tons of dry beans per annum. The table 2 below indicates that the area under cultivation for dry beans in South Africa is declining and this also impact negatively on the production volumes of dry bean. On average area planted for dry beans is 46 thousand hectare per year and this implies the number of hectares planted to beans is still not at a level where imports can be restricted to the essential consumption requirements. Hectares planted for dry beans in the country fluctuated between 40 and 64 hectares between 2005 and 2014. A reasonable increase in the number of hectares planted to beans will only materialize once profitable producer prices are obtained for consecutive years, which can result in several new entrants to the industry. Furthermore, it needs to be considered that producers have limited planting capacity in respect of beans within their crop rotation system and thus there is therefore little possibility of unlimited expansion in bean plantings or the maintenance of larger plantings. Table 2: Dry Beans-Areas planted and Total production
Production Year 20
05/0
6
2006
/’07
2007
/08
2008
/09
2009
/10
2010
/11
2011
/'12
2012
/13
2013
/14
2014
/15
Area Planted (1000 ha)
55
51
44
44
44
42
40
44 56 64
Total Production (1000 tons)
74
44 65 74 57
46
52
66 90 88
Source: Statistics and Economic Analysis
2. MARKET STRUCTURE
2.1 Domestic Market
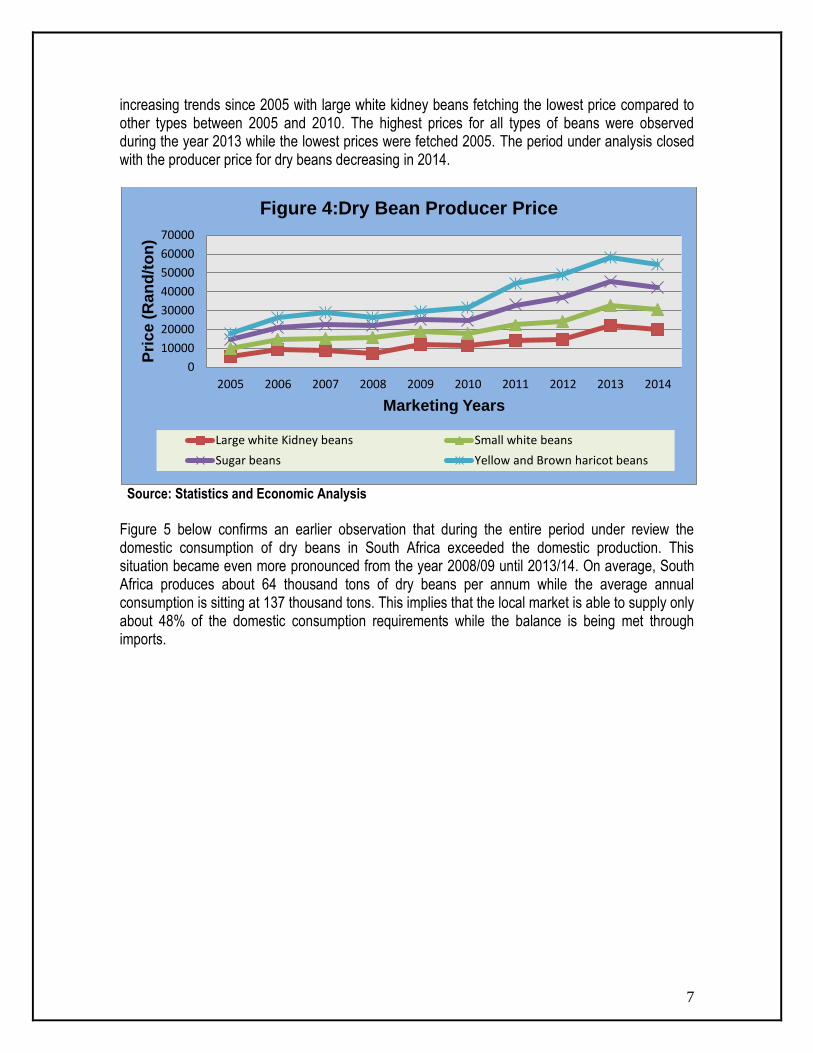
The industry has experienced fluctuations in producer prices over the past ten years as can be seen in Figure 4 below. It is also observable from Figure 4 that the period under analysis opened with lower producer price levels for all 4 types of beans available in South Africa. Generally during the period under review, large white kidney beans have always fetched higher prices in comparison to other types of beans. Furthermore, producer prices for all four types of dry beans have exhibited
7
increasing trends since 2005 with large white kidney beans fetching the lowest price compared to other types between 2005 and 2010. The highest prices for all types of beans were observed during the year 2013 while the lowest prices were fetched 2005. The period under analysis closed with the producer price for dry beans decreasing in 2014.
Source: Statistics and Economic Analysis
Figure 5 below confirms an earlier observation that during the entire period under review the domestic consumption of dry beans in South Africa exceeded the domestic production. This situation became even more pronounced from the year 2008/09 until 2013/14. On average, South Africa produces about 64 thousand tons of dry beans per annum while the average annual consumption is sitting at 137 thousand tons. This implies that the local market is able to supply only about 48% of the domestic consumption requirements while the balance is being met through imports.
0
10000
20000
30000
40000
50000
60000
70000
2005 2006 2007 2008 2009 2010 2011 2012 2013 2014
Pri
ce
(R
an
d/t
on
)
Marketing Years
Figure 4:Dry Bean Producer Price
Large white Kidney beans Small white beans
Sugar beans Yellow and Brown haricot beans

8
Source: Statistics and Economic Analysis
2.2 Exports
Approximately 3672.4 tons (on average) of dry beans are exported per annum. South Africa exports dry beans mainly to India and to neighboring African countries such as Zimbabwe, Lesotho, Mozambique and Swaziland. The export of specific types of beans depends on the demand for the type concerned, coupled with the specific quality requirements. The Dry Bean Producers Organization has, during the year 2004 established an electronic trading platform for beans, known as Beanex. Through this marketing medium, beans are traded electronically on the internet. Participating sellers offer specific quantities of beans for sale and buyers select their purchases on the strength of digital photos and a digital grading certificate in respect of the consignment on offer.
2.3 Imports
As a result of the present shortages of locally produced dry beans, imports are used to meet the ever increasing demand for beans as shown in Figure 6 below. Shortages in the domestic consumer market have been supplemented by means of imports originating mainly from Malawi (57.2%) and Mozambique (23.7%) during the year 2014. The rest of the imports originate from other countries such as China, Tanzania , and Thailand..
50 000
100 000
150 000
200 000 To
ns
Marketing Year
Figure 5: Dry Bean Production VS Consumption
Production (Tons) Consumption (Tons)
9
Source: Statistics and Economic Analysis
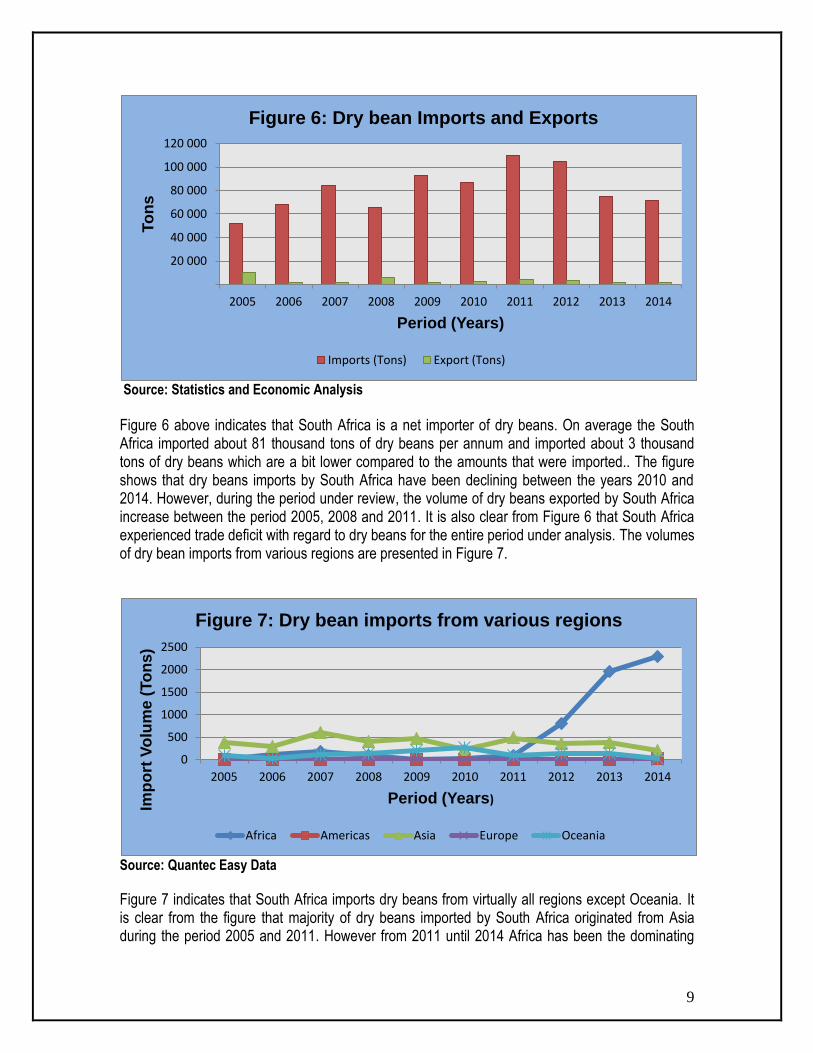
Figure 6 above indicates that South Africa is a net importer of dry beans. On average the South Africa imported about 81 thousand tons of dry beans per annum and imported about 3 thousand tons of dry beans which are a bit lower compared to the amounts that were imported.. The figure shows that dry beans imports by South Africa have been declining between the years 2010 and 2014. However, during the period under review, the volume of dry beans exported by South Africa increase between the period 2005, 2008 and 2011. It is also clear from Figure 6 that South Africa experienced trade deficit with regard to dry beans for the entire period under analysis. The volumes of dry bean imports from various regions are presented in Figure 7.
Source: Quantec Easy Data
Figure 7 indicates that South Africa imports dry beans from virtually all regions except Oceania. It is clear from the figure that majority of dry beans imported by South Africa originated from Asia during the period 2005 and 2011. However from 2011 until 2014 Africa has been the dominating
20 000
40 000
60 000
80 000
100 000
120 000
2005 2006 2007 2008 2009 2010 2011 2012 2013 2014
To
ns
Period (Years)
Figure 6: Dry bean Imports and Exports
Imports (Tons) Export (Tons)
0
500
1000
1500
2000
2500
2005 2006 2007 2008 2009 2010 2011 2012 2013 2014
Imp
ort
Vo
lum
e (
To
ns)
Period (Years)
Figure 7: Dry bean imports from various regions
Africa Americas Asia Europe Oceania
10
country in terms of imports for dry beans to South Africa. The ten year average (2005 to 2014) annual dry bean imports statistics reveal that, on average, Asia is responsible for 83% of dry beans imported by South Africa while China alone accounts for about 81%, implying that only 2% originate from other Asian countries. Other regions such as Africa, Americas and Europe (combined) contributed only 17% towards the total dry beans imports by South Africa. South Africa source only 10% of its total dry bean imports from the African continent.
Source: Quantec Easy Data
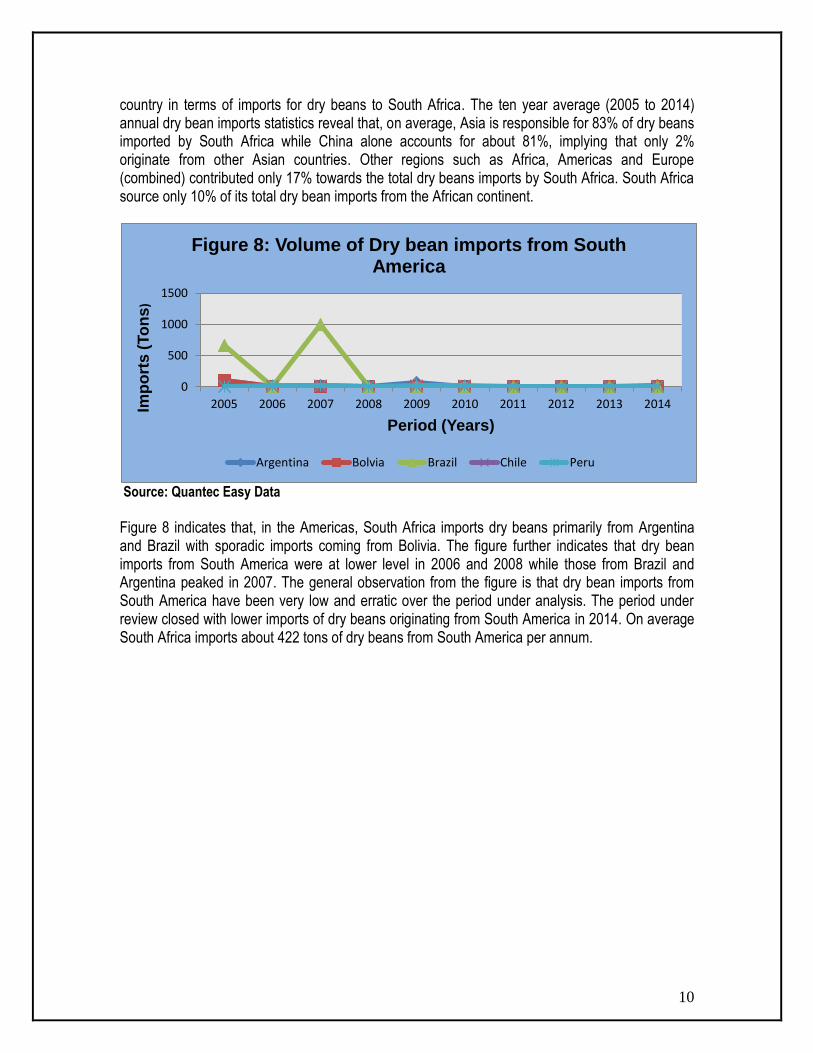
Figure 8 indicates that, in the Americas, South Africa imports dry beans primarily from Argentina and Brazil with sporadic imports coming from Bolivia. The figure further indicates that dry bean imports from South America were at lower level in 2006 and 2008 while those from Brazil and Argentina peaked in 2007. The general observation from the figure is that dry bean imports from South America have been very low and erratic over the period under analysis. The period under review closed with lower imports of dry beans originating from South America in 2014. On average South Africa imports about 422 tons of dry beans from South America per annum.
0
500
1000
1500
2005 2006 2007 2008 2009 2010 2011 2012 2013 2014 Imp
ort
s (
To
ns
)
Period (Years)
Figure 8: Volume of Dry bean imports from South America
Argentina Bolvia Brazil Chile Peru
11
Source: Quantec Easy Data
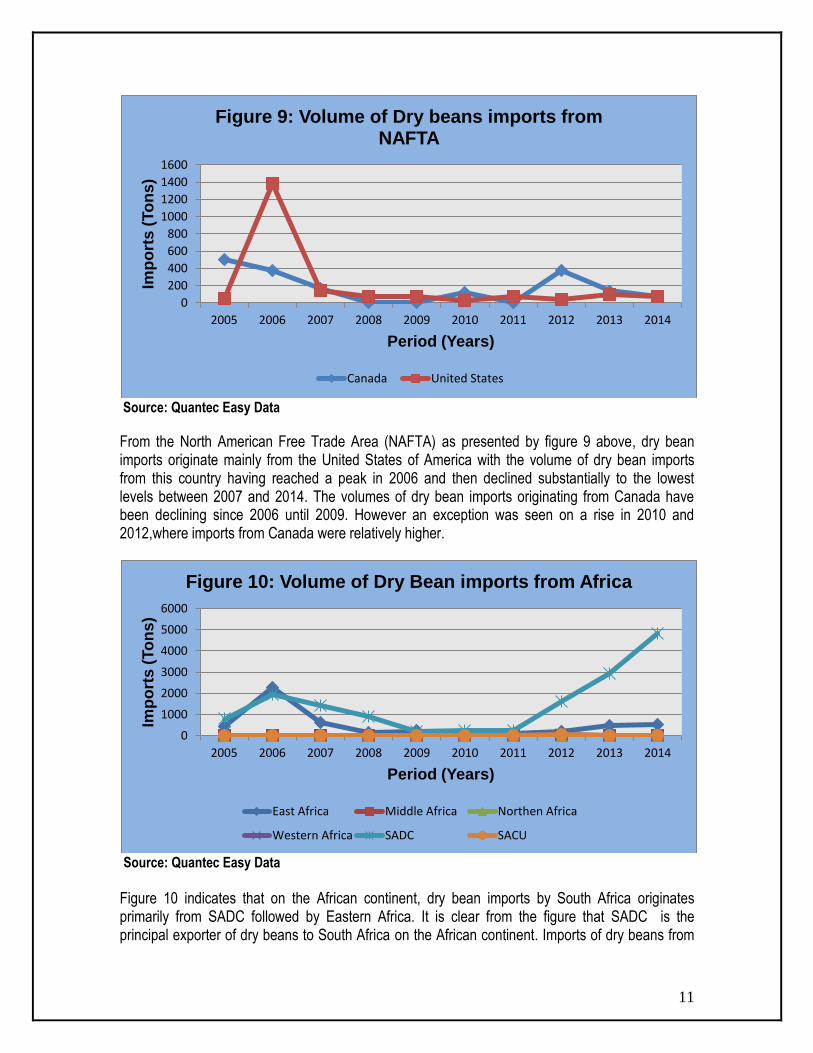
From the North American Free Trade Area (NAFTA) as presented by figure 9 above, dry bean imports originate mainly from the United States of America with the volume of dry bean imports from this country having reached a peak in 2006 and then declined substantially to the lowest levels between 2007 and 2014. The volumes of dry bean imports originating from Canada have been declining since 2006 until 2009. However an exception was seen on a rise in 2010 and 2012,where imports from Canada were relatively higher.
Source: Quantec Easy Data
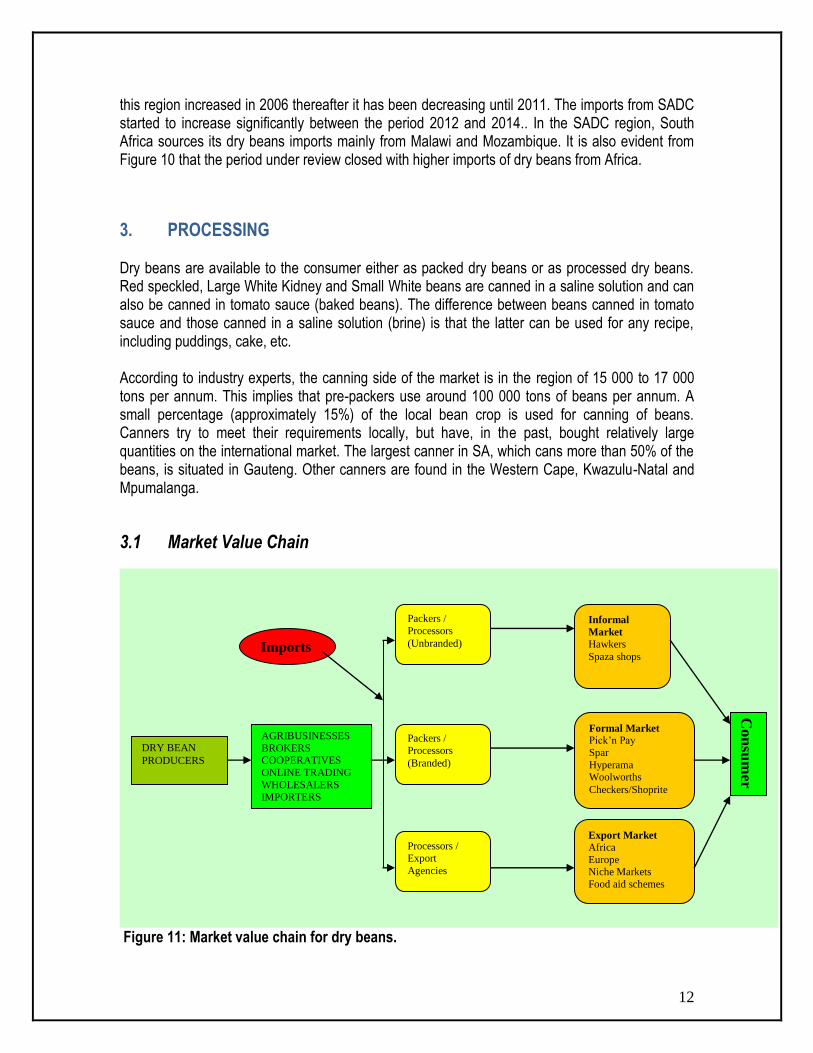
Figure 10 indicates that on the African continent, dry bean imports by South Africa originates primarily from SADC followed by Eastern Africa. It is clear from the figure that SADC is the principal exporter of dry beans to South Africa on the African continent. Imports of dry beans from
0
200
400
600
800
1000
1200
1400
1600
2005 2006 2007 2008 2009 2010 2011 2012 2013 2014
Imp
ort
s (
To
ns)
Period (Years)
Figure 9: Volume of Dry beans imports from NAFTA
Canada United States
0
1000
2000
3000
4000
5000
6000
2005 2006 2007 2008 2009 2010 2011 2012 2013 2014
Imp
ort
s (
To
ns)
Period (Years)
Figure 10: Volume of Dry Bean imports from Africa
East Africa Middle Africa Northen Africa
Western Africa SADC SACU
12
this region increased in 2006 thereafter it has been decreasing until 2011. The imports from SADC started to increase significantly between the period 2012 and 2014.. In the SADC region, South Africa sources its dry beans imports mainly from Malawi and Mozambique. It is also evident from Figure 10 that the period under review closed with higher imports of dry beans from Africa.
3. PROCESSING Dry beans are available to the consumer either as packed dry beans or as processed dry beans. Red speckled, Large White Kidney and Small White beans are canned in a saline solution and can also be canned in tomato sauce (baked beans). The difference between beans canned in tomato sauce and those canned in a saline solution (brine) is that the latter can be used for any recipe, including puddings, cake, etc. According to industry experts, the canning side of the market is in the region of 15 000 to 17 000 tons per annum. This implies that pre-packers use around 100 000 tons of beans per annum. A small percentage (approximately 15%) of the local bean crop is used for canning of beans. Canners try to meet their requirements locally, but have, in the past, bought relatively large quantities on the international market. The largest canner in SA, which cans more than 50% of the beans, is situated in Gauteng. Other canners are found in the Western Cape, Kwazulu-Natal and Mpumalanga.
3.1 Market Value Chain
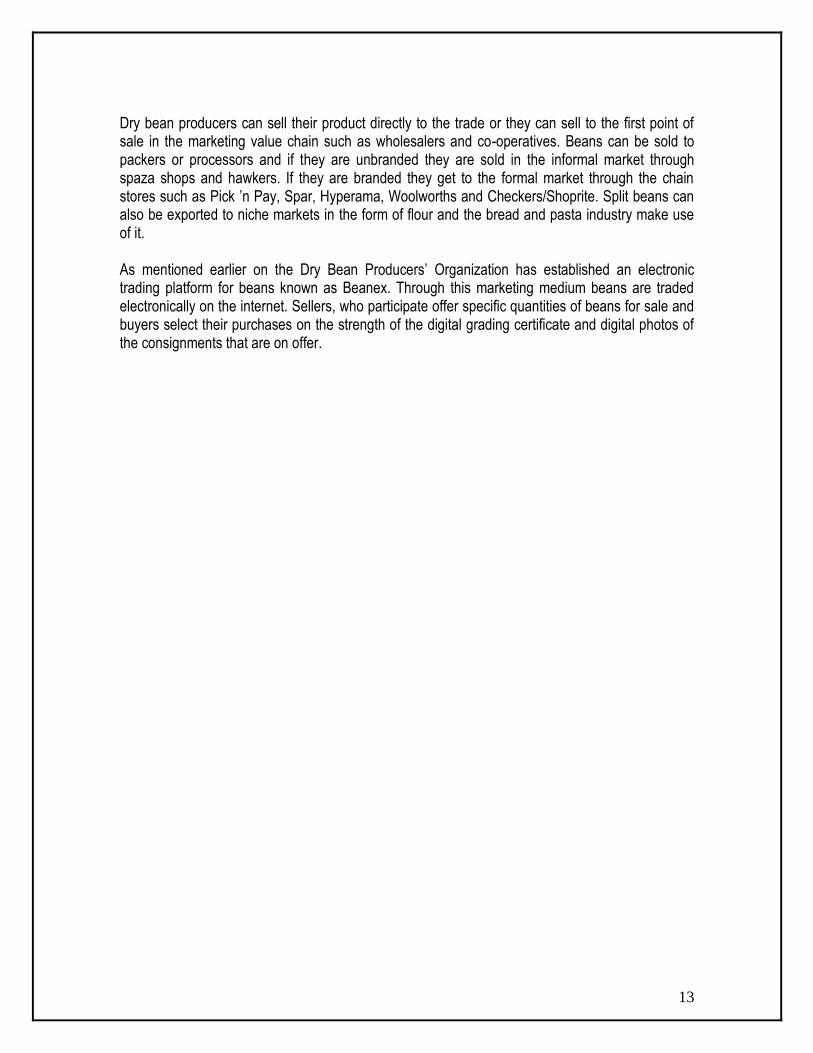
Figure 11: Market value chain for dry beans.
DRY BEAN
PRODUCERS
AGRIBUSINESSES
BROKERS COOPERATIVES
ONLINE TRADING
WHOLESALERS IMPORTERS
Packers /
Processors
(Unbranded)
Packers /
Processors
(Branded)
Processors /
Export
Agencies
Informal
Market
Hawkers
Spaza shops
Formal Market
Pick’n Pay
Spar
Hyperama Woolworths
Checkers/Shoprite
Export Market
Africa
Europe Niche Markets
Food aid schemes
Imports
Con
sum
er
13
Dry bean producers can sell their product directly to the trade or they can sell to the first point of sale in the marketing value chain such as wholesalers and co-operatives. Beans can be sold to packers or processors and if they are unbranded they are sold in the informal market through spaza shops and hawkers. If they are branded they get to the formal market through the chain stores such as Pick ’n Pay, Spar, Hyperama, Woolworths and Checkers/Shoprite. Split beans can also be exported to niche markets in the form of flour and the bread and pasta industry make use of it. As mentioned earlier on the Dry Bean Producers’ Organization has established an electronic trading platform for beans known as Beanex. Through this marketing medium beans are traded electronically on the internet. Sellers, who participate offer specific quantities of beans for sale and buyers select their purchases on the strength of the digital grading certificate and digital photos of the consignments that are on offer.

14
4. MARKET INTELLIGENCE
4.1 Tariffs
The following table below indicates the tariffs that are applied by other countries on imports of dry beans originating from South Africa: Table 3: Tariffs faced by South African exports of dry beans
COUNTRY PRODUCT DESCRIPTION
TRADE REGIME DESCRITION
APPLIED TARIFFS
(2015)
ESTIMATED TOTAL AD VALOREM EQUIVALENT TARIFF (2015)
Zimbabwe Dried Beans: 07133310
MFN duties (Applied)
5.00% 5.00%
Dried Beans: 07133390
MFN duties (Applied)
5.00% 5.00%
Lesotho Dried Beans: 07133390 07133310
MFN duties (Applied)
10.00% 10.00%
Intra SACU rate 0.00% 0.00%
Mozambique Dried Beans: 07133310 07133390
MFN duties (Applied)
2.50% 2.50%
Preferential tariff for South Africa
7.50% 7.50%
Swaziland Dried Beans: 07133390
MFN duties (Applied)
10.00% 10.00%
Intra SACU rate 0.00% 0.00%
China
Dried Beans: 07133390
MFN duties (Applied)
7.50% 7.50%
India Dried Beans: 07133300
MFN duties (Applied)
30.00% 30.00%
Pakistan
Dried Beans: 07133390
MFN duties (Applied)
0.00% 0.00%
Source: Market Access Map
Table 3 indicates that South African dry bean exports face higher export duties when exported to countries such as India, China and Zimbabwe. Although countries such as Lesotho, Mozambique and Swaziland impose import duties on dry beans originating from elsewhere, South Africa can export dry beans to these countries duty free due to the existence of Intra-SACU free trade arrangements. Pakistan does not charge any import duty on dry beans. With regard to the local situation, South Africa levies a duty of 10% on imports of dry beans originating from the rest of the world. However, dry bean imports from the European Union, SADC and SACU member states can enter South Africa free of duty due to the existence of the following trade Agreements which are currently in force: Agreement on trade, development and corporation between the European Union and South Africa; SACU agreement; and SADC Trade Protocol. In order to fulfill South Africa’s commitment under the World Trade Organization: Marrakesh Agreement regarding market access, the Directorate Marketing issues rebate permits under the
15
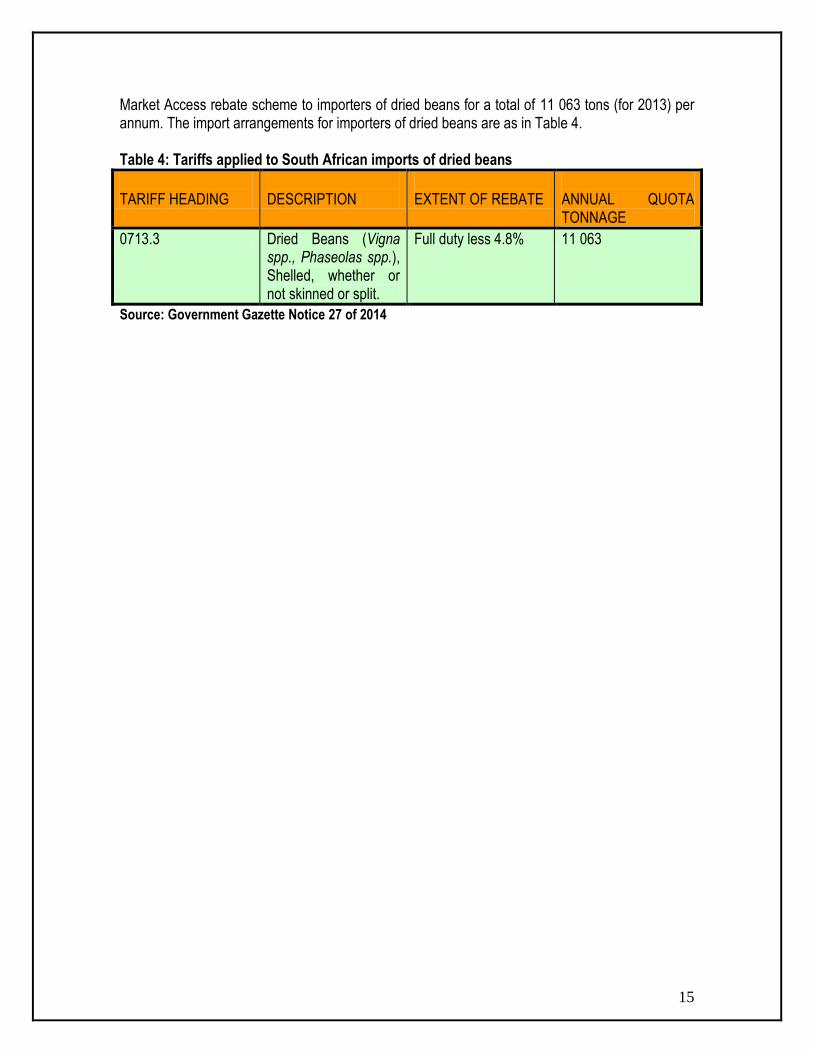
Market Access rebate scheme to importers of dried beans for a total of 11 063 tons (for 2013) per annum. The import arrangements for importers of dried beans are as in Table 4. Table 4: Tariffs applied to South African imports of dried beans
TARIFF HEADING
DESCRIPTION
EXTENT OF REBATE
ANNUAL QUOTA TONNAGE
0713.3 Dried Beans (Vigna spp., Phaseolas spp.), Shelled, whether or not skinned or split.
Full duty less 4.8% 11 063
Source: Government Gazette Notice 27 of 2014

16
4.2 Performance of the South African dry bean industry
Figure 12: Prospects for market diversification for dried beans (071333) imported by South Africa in 2014.
Source: ITC Trade Map
17
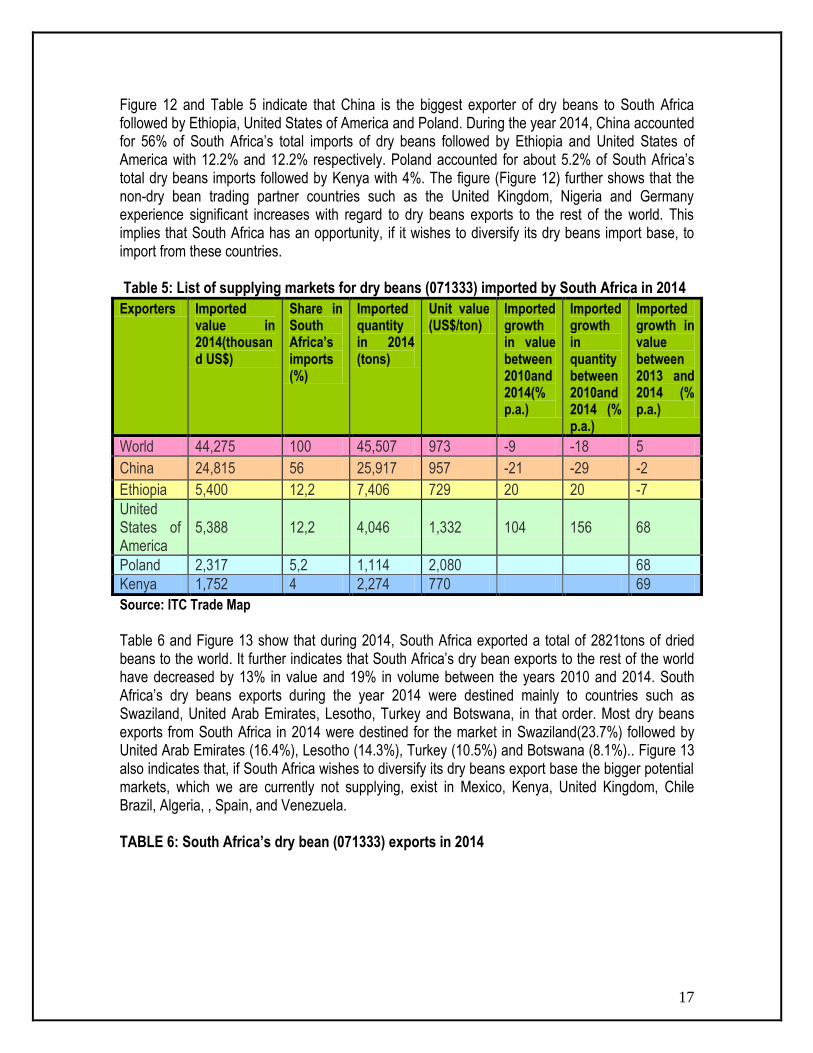
Figure 12 and Table 5 indicate that China is the biggest exporter of dry beans to South Africa followed by Ethiopia, United States of America and Poland. During the year 2014, China accounted for 56% of South Africa’s total imports of dry beans followed by Ethiopia and United States of America with 12.2% and 12.2% respectively. Poland accounted for about 5.2% of South Africa’s total dry beans imports followed by Kenya with 4%. The figure (Figure 12) further shows that the non-dry bean trading partner countries such as the United Kingdom, Nigeria and Germany experience significant increases with regard to dry beans exports to the rest of the world. This implies that South Africa has an opportunity, if it wishes to diversify its dry beans import base, to import from these countries. Table 5: List of supplying markets for dry beans (071333) imported by South Africa in 2014
Exporters Imported value in 2014(thousand US$)
Share in South Africa’s imports (%)
Imported quantity in 2014 (tons)
Unit value (US$/ton)
Imported growth in value between 2010and 2014(% p.a.)
Imported growth in quantity between 2010and 2014 (% p.a.)
Imported growth in value between 2013 and 2014 (% p.a.)
World 44,275 100 45,507 973 -9 -18 5
China 24,815 56 25,917 957 -21 -29 -2
Ethiopia 5,400 12,2 7,406 729 20 20 -7
United States of America
5,388 12,2 4,046 1,332 104 156 68
Poland 2,317 5,2 1,114 2,080 68
Kenya 1,752 4 2,274 770 69
Source: ITC Trade Map
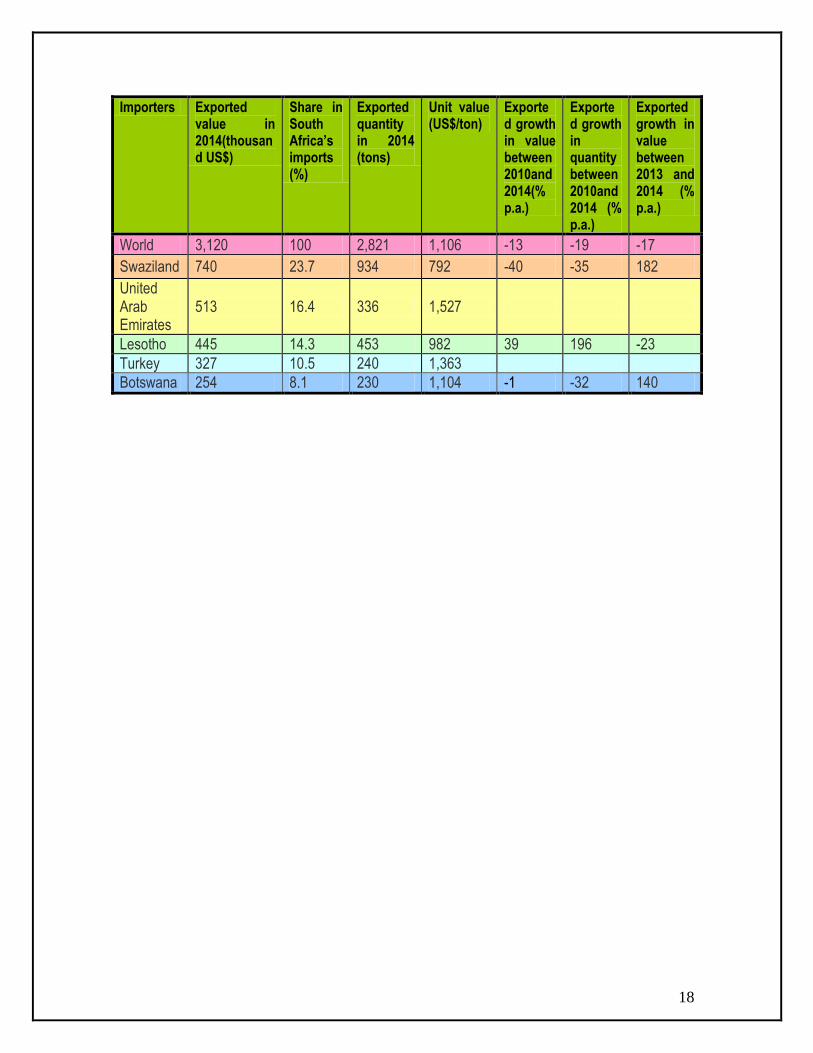
Table 6 and Figure 13 show that during 2014, South Africa exported a total of 2821tons of dried beans to the world. It further indicates that South Africa’s dry bean exports to the rest of the world have decreased by 13% in value and 19% in volume between the years 2010 and 2014. South Africa’s dry beans exports during the year 2014 were destined mainly to countries such as Swaziland, United Arab Emirates, Lesotho, Turkey and Botswana, in that order. Most dry beans exports from South Africa in 2014 were destined for the market in Swaziland(23.7%) followed by United Arab Emirates (16.4%), Lesotho (14.3%), Turkey (10.5%) and Botswana (8.1%).. Figure 13 also indicates that, if South Africa wishes to diversify its dry beans export base the bigger potential markets, which we are currently not supplying, exist in Mexico, Kenya, United Kingdom, Chile Brazil, Algeria, , Spain, and Venezuela. TABLE 6: South Africa’s dry bean (071333) exports in 2014
18
Importers Exported value in 2014(thousand US$)
Share in South Africa’s imports (%)
Exported quantity in 2014 (tons)
Unit value (US$/ton)
Exported growth in value between 2010and 2014(% p.a.)
Exported growth in quantity between 2010and 2014 (% p.a.)
Exported growth in value between 2013 and 2014 (% p.a.)
World 3,120 100 2,821 1,106 -13 -19 -17
Swaziland 740 23.7 934 792 -40 -35 182
United Arab Emirates
513 16.4 336 1,527
Lesotho 445 14.3 453 982 39 196 -23
Turkey 327 10.5 240 1,363
Botswana 254 8.1 230 1,104 -1 -32 140

19
Figure 13: Prospects for market diversification for Dry Beans (071333) exported by South Africa in 2014.
Source: ITC Trade Map

20
5. ORGANIZATIONAL ANALYSIS
5.1 Opportunities and Challenges
The demand for South African export beans to the neighboring African countries is on the increase. Annually South Africa exports on average 25 000 tons of dry beans to these countries.
There is a short term domestic market potential for the planting of up to 90 000 ha to dry beans in South Africa. During the 2005/06 production season, approximately 60 000 hectares have been planted to dry beans, mainly as a result of low producer prices obtained for maize during the 2005 marketing season. It is therefore possible to expand plantings up to 100 000 hectares to beans in 2007 depending on import volumes that arise mainly from China.
The demand for canned beans by consumers has started to increase and this provides an opportunity for the industry to expand as well as for new entrants. More and more consumers are beginning to use and prefer canned products on account of the fact that more rural South Africans are adopting Western eating habits and also due to the influx of people to the cities with the resulting preference for convenient and easy-to-prepare foods. More packers have thus begun to enter the canning industry to make the convenient canned product available.
There are two seed companies, one established by the Dry Bean Producers Organization, known as Dry Bean Seed (Pty) Ltd and one international company Pannar that supplies local producers with Red Speckled varieties established as preferential consumer choices.
6. ROLE-PLAYERS IN THE DRY BEAN INDUSTRY
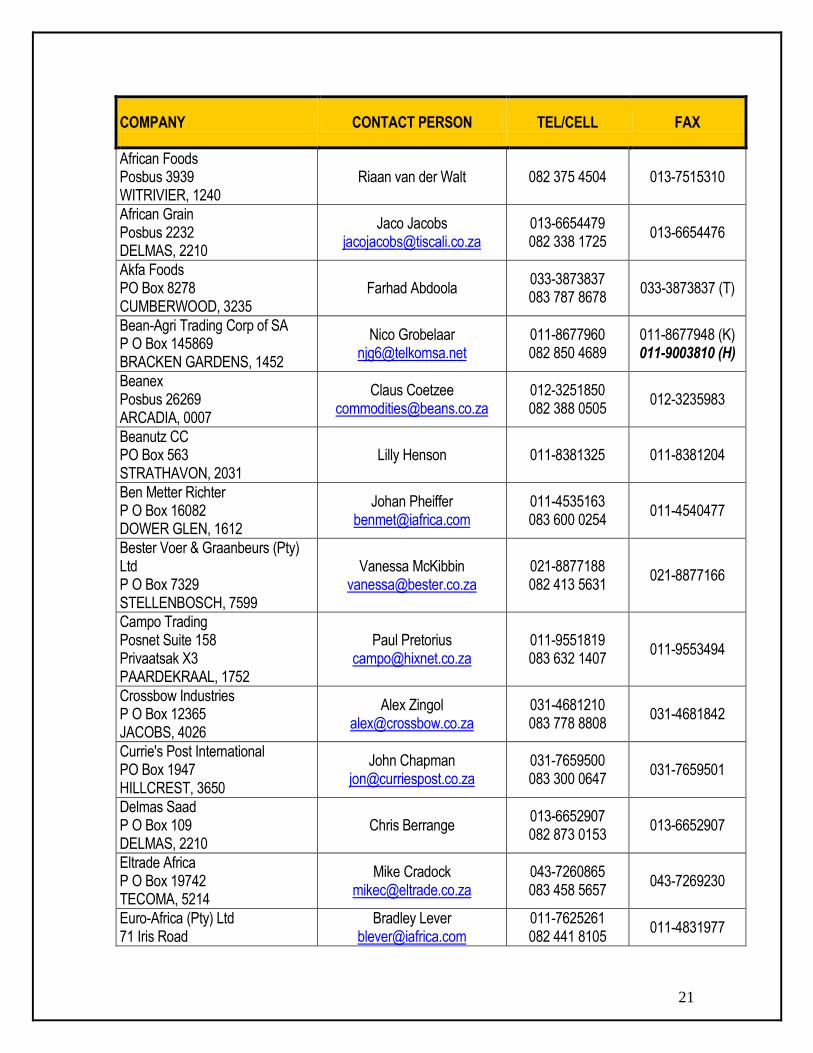
6.1. Dry Bean Traders
COMPANY CONTACT PERSON TEL/CELL FAX
AB Gani Wholesale Produce PO Box 313 CAROLINA, 1185
Ahmed Gani [email protected]
017-8431625 082 563 8767
017-8432521
Advance Grain CC PO Box 414 KRUGERSDORP, 1740
Brian Lever [email protected]
011-7625261 083 251 5631
011-7624111
Africas Own Food PO Box 51 VIRGINIA, 9430
Cecil Groenewald [email protected]
057-2151267 082 5511 749
057-2151267 (T)
21
COMPANY CONTACT PERSON TEL/CELL FAX
African Foods Posbus 3939 WITRIVIER, 1240
Riaan van der Walt 082 375 4504 013-7515310
African Grain Posbus 2232 DELMAS, 2210
Jaco Jacobs [email protected]
013-6654479 082 338 1725
013-6654476
Akfa Foods PO Box 8278 CUMBERWOOD, 3235
Farhad Abdoola 033-3873837 083 787 8678
033-3873837 (T)
Bean-Agri Trading Corp of SA P O Box 145869 BRACKEN GARDENS, 1452
Nico Grobelaar [email protected]
011-8677960 082 850 4689
011-8677948 (K) 011-9003810 (H)
Beanex Posbus 26269 ARCADIA, 0007
Claus Coetzee [email protected]
012-3251850 082 388 0505
012-3235983
Beanutz CC PO Box 563 STRATHAVON, 2031
Lilly Henson 011-8381325 011-8381204
Ben Metter Richter P O Box 16082 DOWER GLEN, 1612
Johan Pheiffer [email protected]
011-4535163 083 600 0254
011-4540477
Bester Voer & Graanbeurs (Pty) Ltd P O Box 7329 STELLENBOSCH, 7599
Vanessa McKibbin [email protected]
021-8877188 082 413 5631
021-8877166
Campo Trading Posnet Suite 158 Privaatsak X3 PAARDEKRAAL, 1752
Paul Pretorius [email protected]
011-9551819 083 632 1407
011-9553494
Crossbow Industries P O Box 12365 JACOBS, 4026
Alex Zingol [email protected]
031-4681210 083 778 8808
031-4681842
Currie's Post International PO Box 1947 HILLCREST, 3650
John Chapman [email protected]
031-7659500 083 300 0647
031-7659501
Delmas Saad P O Box 109 DELMAS, 2210
Chris Berrange 013-6652907 082 873 0153
013-6652907
Eltrade Africa P O Box 19742 TECOMA, 5214
Mike Cradock [email protected]
043-7260865 083 458 5657
043-7269230
Euro-Africa (Pty) Ltd 71 Iris Road
Bradley Lever [email protected]
011-7625261 082 441 8105
011-4831977

22
COMPANY CONTACT PERSON TEL/CELL FAX
NORWOOD, 2192
F R Waring International P O Box 681 PARKLANDS, 2121
Piers Sanford [email protected]
012-6668135 082 888 1869
011-3257192
Golden Dice Foods P O Box 1453 NIGEL, 1490
Johan Wehmeyer [email protected]
011-8141850 011-8141458
Goldkeys Prepacks P O Box 185 DURBAN, 4000
Abdulla Ally [email protected]
031-3377648 082 801 9178
031-3686695
Harvesters P O Box 903 RIVONIA, 2128
Alistair Wheatley [email protected]
011-4945170 083 643 3222
011-4945257
J F R Marketing P O Box 70334 DIE WILGERS, 0041
Koos Ras [email protected]
012-8070741 082 448 0575
012-807 1459
JLR International Services P O Box 29120 MAYDON WHARF, 4057
Lourens Retief Harry Konst
031-2055441 082 440 5069
031-2051501
Josh Levy P O Box 120 POTCHEFSTROOM, 5220
Abdul Cassim Prakash Kalanjee
018-2934300 082 891 6042
018-2948767
Tiger Food Brands P O Box 12 MAITLAND, 7405
Ivor Lamont [email protected]
Rickes v Tonder (Best) 021-5066366 021-5117286
Kapitans Packaging P O Box 16131 GELVANDALE, 6016
Keith Forgan 041-4564066 041-9911457
Kimberley Grain Commodities (Pty) Ltd P O Box 562 KIMBERLEY, 8300
Hennie Engelbrecht [email protected]
053-8314770 082 377 2417
053-8318606
Klein Karoo Koöperasie Klein Karoo Saad Posbus 241 OUDTSHOORN, 6620
David Malan Riaan v/d Westhuizen
[email protected] 044-2035259 044-2791782
L Cohen & Co P O Box 251 NIGEL, 1490
Jan Lehman 011-8143052 011-8143052 (T)
L H C Voere P O Box 12509 ONDERSTEPOORT, 0110
Mev L Moore 012-5612530/2 082 950 3826
012-5612532
MYN Trading Enterprises Mubeen Noorbhai 011-8521871 011-8524803

23
COMPANY CONTACT PERSON TEL/CELL FAX
PO Box 10400 LENASIA, 1820
[email protected] 083 327 3927
Natal Dry Beans P O Box 540 PIETERMARITZBURG, 3200
Ahmed Abdoola
PO Luxmi, 3207
033-3871594/5/6 083 786 2929
033-3876772
NWK Beperk Posbus 107 LICHTENBURG, 2746
Kobus v/d Berg [email protected]
018-6331017 018-6331902
Olam Foods Posbus 52008 Berea Road BEREA, 4000
Michael Schmidt / Marco [email protected] [email protected]
031-3121566 082 330 9743
031-3038540
Pakco P O Box 65 VERULAM, 4340
Sham Naidu [email protected]
032-5331050 083 500 3368
032-5332681
Pioneer Foods / Sasko Posbus 24 MALMESBURY, 7300
Abé van Niekerk [email protected]
022-4827237 083 628 7877
022-4872815
Popking Posbus 41 HOPETOWN, 8750
Madelein Lamley [email protected]
053-2030403 053-2030482
Pioneer Foods PO Box 24 MALMESBURY, 7300
AG van Niekerk [email protected]
022-4827237 083 628 7877
022-4872815
Pioneer Foods PO Box 9149 HUGUENOT, 7645
Elizabeth Mac Gregor (Voedseltegnoloog)
021-8075841 083 452 9524
Pride Milling Posbus 459 LESLIE, 2265
Henriette Wentzel [email protected]
017-6830050 082 449 0062
017-6830051
Progress Milling P O Box 386 PIETERSBURG, 0700
Eric Platt [email protected]
015B2973452
083 654 5991 015B2974835
Renaissance Commodity Holdings (Pty) Ltd Posbus 13413 SINOVILLE, 0129
Paul Couzyn [email protected]
012-3251853/4 082 821 1295
012-3261223
Retradco (Trademore) P O Box 95474 GRANT PARK, 2051
Ben Brasq [email protected]
011-7282729 072 236 3596
011-7838188
Rhino Props Posbus 1473 LICHTENBURG, 2740
Johan Slabbert [email protected]
018-632 0990 082 805 9362
018-632 0989

24
COMPANY CONTACT PERSON TEL/CELL FAX
Riverwalk Seed & Grain PO Box 3218 PAARL, 7620
Grant Lyons [email protected]
021-8729849 082 924 3304
021-8725936
Roodedraai Wholesalers CC P O Box 110 PERDEKOP, 2465
B Chothia [email protected]
017-7851006 017-7851306
S & K Packaging P O Box 37 LESLIE, 2265
Mr Sandler Manny Kagan
[email protected] 017-6830256 017-6830086
Solpak Distributors P O Box 10930 PORT SHEPSTONE, 4240
I Moosa [email protected]
039-682 4048 039-682 2068
Surplus Grain Traders P O Box 86153 CITY DEEP, 2049
Johan Nel [email protected]
011-613 5955 011-613 5957
Tiger Food Brands Posbus 12 MAITLAND, 7405
Rikus van Tonder [email protected]
021-5066337 082 561 9827
021-5117286
Transvaal Grain Enterprizes P O Box 60705 PHOENIX, 4068
Mohammed Vally 031-5008889 083 455 7864
031-5006668
Triotrade P O Box 39561 MORELETTAPARK, 0044
Hannes Koen
Wessel Higgs
012-8039336/8 083 627 2601 082 887 6704
012-8039337
Tswana Meule (Brennco) P O Box 1425 HAMMANSKRAAL, 0400
Koos Odendaal [email protected]
7110478 (Tswana) 7110057 (Brennco)
082 920 0283 012-711 0477
Umgeni Products P O Box 1615 BALLITO, 4420
Seelan Nair / André Swarts [email protected] [email protected]
032-9472261 083 625 8216 083 626 1400
032-9472281/78
Valbros PO Box 932 LYDENBURG, 1120
Vally (Jnr)
Vally (Snr)
013-2351258 0132354910 082 786 1258
013-2351258
Van's Prepacker P O Box 12 ARNOT, 1051
Charles van Wyk [email protected]
013-2462244 082 388 3058
013-2462244
Viking Holding Pty) Ltd 24c High Str WATERKLOOF, 0181
Robin Feldsman 012-3467496 012-3467287

25
6.2. Dry Bean Packers
COMPANY CONTACT PERSON TEL/CELL FAX
Akhalwaya's Spice Products 84 Bree Street NEW TOWN, 2001
011-8364864
Anglo American Farms P O GROOT DRAKENSTEIN, 7680
Con Costaras [email protected]
021-8704000 021-8741445
Da Wehna Mr Liberty 082 418 3693
Giants Canning Private Bag X2007 LOUIS TRICHARDT, 0929
Chantel Guruviah 011-6232929 082 927 7501
011-6232986
Gibson Foods PO Box 731115 FAIRLANDS, 2030
Henry Gibson 011-4762205 082 376 0464
011-6787228
Kausies Kitchen P O Box 6 DESAINAGAR, 4405
Dayalan Naidoo 032 - 9444114 032-9443198
Marine Products P O Box 203 VELDDRIF, 7365
Chris Geldenhuys 022-7831103 022-7830125
Narian Singh & Sons (Kama) 181 Mahatma Ghandi Street KWA DUBUZA, 4450
032-5511191
Nelstad Investments (Pty) Ltd (Just Beans) PO Box 47185 GREYVILLE, 4023
New Look Packers PO Box 405 ROODEPOORT, 1725
011-7635696
Olympic Trading 3 Smithers Road STANGER, 4450
0324-22261
Pakco Food Division P O Box 65 VERULAM, 3430
Christopher Perumal 032 - 5331050 032-5330724
RFF Foods (Pty)Ltd Agricultural Department P O GROOT DRAKENSTEIN, 7680
Willem McAlpine 021-8704190 082 784 5870
021-8741370

26
COMPANY CONTACT PERSON TEL/CELL FAX
RFF Foods (Pty)Ltd National Sales & Marketing Manager P O GROOT DRAKENSTEIN, 7680
Gerhard Kotze [email protected]
Santa Kotze
021-8704110 / 4130
082 920 3773
021-8741445
Rupa's Food Packaging 66A Bree Street NEW TOWN, 2001
011-8360391
SA Fruit & Veg Canners Ass P O Box 6175 Main Street Post Office PAARL, 7622
Terry Melone [email protected]
021B8711308 021-8725930
Savemor Products (Pty) Ltd 5 Butts Road PINETOWN, 3610
St Helena Bay Fishing Industry P O Box 1 STOMPNEUS BAY, 7382
Henk Hurter 022-7421611 022-7421848
Sugarbird P O Box 70 MALMESBURY, 7300
Mr. A du Toit 022-4821144 022-4824154
Tiger Food Brands P O Box 259 MARBLE HALL, 0450
Kobus Pieterse [email protected]
013-2612145 082 555 7948
013-2612710
Tiger Foods Brands Posbus 627 SUIDER-PAARL, 7624
Pieter Grobler 021B8601020 021-9704111
Werda Produkte Posbus 335 BONNIEVALE, 6730
Johan Wolfaardt [email protected]
023-6162140 082 414 4796
023-6162194
LABELLING
COMPANY CONTACT PERSON TEL/CELL FAX
Tag & Label SA Posbus 679 FERNDALE, 2160
Jack Vorster 011B7967925
082 851 4077 0117931281

27
7. ACKNOWLEDGEMENTS The following organizations are acknowledged: Dry Bean Producers’ Organization PO Box 26269 ARCADIA 0007 Tel: (012) 325 1850 Fax: (012) 323 5983 E-mail: [email protected] Statistics and Economic Analysis: Department of Agriculture, Forestry & Fisheries. Tel: (012) 319 8453 Fax: (012) 319 8031 www.daff.gov.za Quantec Easydata www.quantec.co.za ITC Market Access Map www.macmap.org.za ITC Trade Map www.trademap.org Food Pricing Monitoring Committee Report (2003)
Disclaimer: This document and its contents have been compiled by the Department of Agriculture, Forestry and Fisheries for the purpose of detailing the dry bean industry. Anyone who uses the information as contained in this document does so at his/her own risk. The views expressed in this document are those of the Department with regard to the industry, unless otherwise stated. The Department of Agriculture, Forestry and Fisheries therefore accepts no liability that can be incurred resulting from the use of this information.
Top Related