


Languages
Pages
Legal

A Profile of the Idle Youth in the U.S.
Ana J. Montalvo
Amy O’HaraU.S. Census Bureau
Housing and Household Economic Statistics Division
Presented at the Annual Meeting of the Population Association of America, New Orleans, LA on April 17-19, 2008
This poster is released to inform interested parties of ongoing research and to encourage discussion. The views expressed on statistical, methodological, technical, or operational issues are those of the authors and not necessarily those of the U.S. Census Bureau.
2
Purpose of analysisTo present a snapshot of the idle youth,
describing their socioeconomic, demographic, and geographic characteristics.
Idle youth definedAll people 16 to 24 years old not living in group
quarters who have not been enrolled in school for three months and are not in the labor force.
3
Background
The idle youth are people who do not finish school as well as people who finish school but cannot attach to the labor force. These could be people whose general high school background has not prepared them for the jobs available. Their ill-preparedness could be:
• job skills-based (points to lack of training programs, apprenticeships, etc.)
• social skills-based (points to lack of family or peers who have steady employment, community problems).

4
Disconnected youthOur concept of idle youth is a subset of the
disconnected youth concept in the sociology literature.
Disconnected youth:
• are often found in disadvantaged communities
• often lack adult role models
• may still be in school but are disengaged
5
The National League of Cities defines disconnected youth as those not connected to school, work or caring adults.
Urban Institute researchers limit disconnected youth to those with no post-secondary education who have not worked in a year.
A Kids Count brief by the Annie E. Casey Foundation (2005) reports that:
–Disconnected young men are more likely than other young men to go to prison
–Disconnected young women are more likely than other young women to rely on public assistance

6
Literature
The transition to full-time work is accompanied by other transitions to adulthood including:
• School departure• Moving to separate place of
residence• Geographic mobility• Marriage• Childbearing
Weak links between the school and work transition lead young people to become disconnected, resulting in:• Lower lifetime earnings• Increased poverty• Homelessness• Criminal activity
7
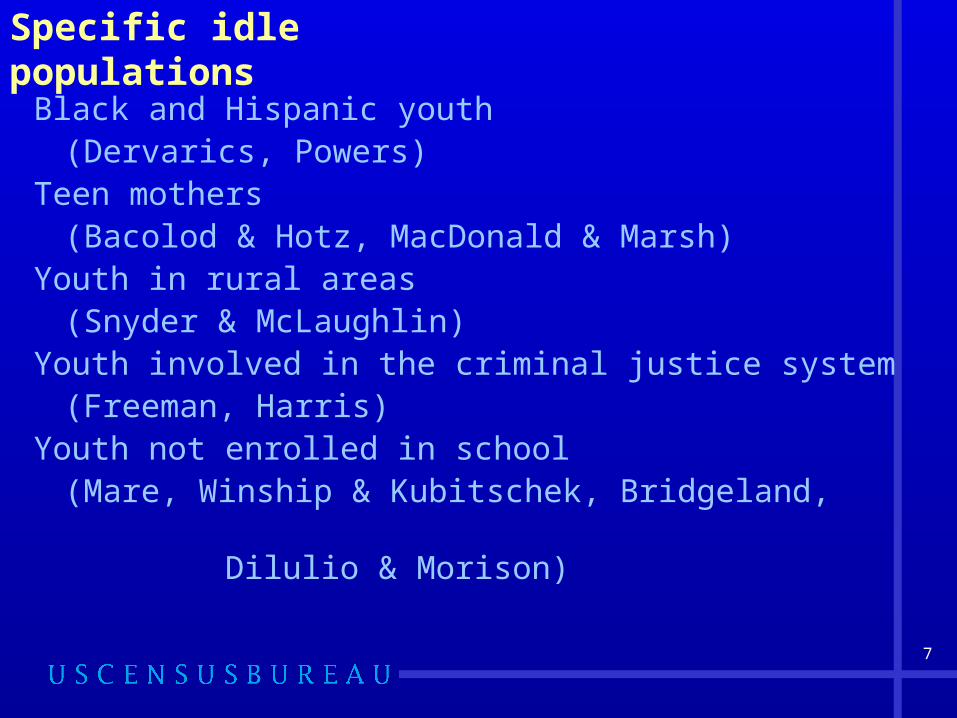
Black and Hispanic youth (Dervarics, Powers)
Teen mothers (Bacolod & Hotz, MacDonald & Marsh)
Youth in rural areas(Snyder & McLaughlin)
Youth involved in the criminal justice system(Freeman, Harris)
Youth not enrolled in school (Mare, Winship & Kubitschek, Bridgeland,
Dilulio & Morison)
Specific idle populations

8
Data2006 American Community Survey• Annual survey of approximately 3 million household
addresses• Single year estimates of detailed social, housing, economic,
and demographic data for geographic areas with populations of 65,000+
• Data collection is conducted on a monthly basis• Results are compiled and published annually• Most current source of demographic data on this scale
Limitations• Cannot identify married partners or family relationships
among non-reference people• Only collects information on regularly received income from
select sources
9
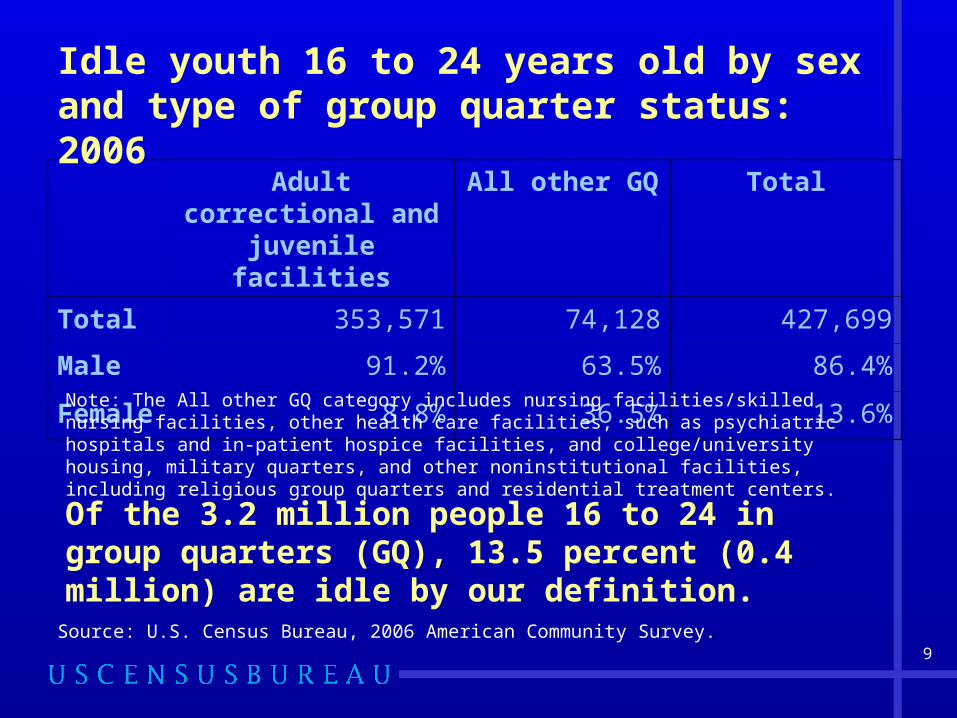
Adult correctional and juvenile facilities
All other GQ Total
Total 353,571 74,128 427,699
Male 91.2% 63.5% 86.4%
Female 8.8% 36.5% 13.6%
Idle youth 16 to 24 years old by sex and type of group quarter status: 2006
Source: U.S. Census Bureau, 2006 American Community Survey.
Note: The All other GQ category includes nursing facilities/skilled nursing facilities, other health care facilities, such as psychiatric hospitals and in-patient hospice facilities, and college/university housing, military quarters, and other noninstitutional facilities, including religious group quarters and residential treatment centers.
Of the 3.2 million people 16 to 24 in group quarters (GQ), 13.5 percent (0.4 million) are idle by our definition.
10
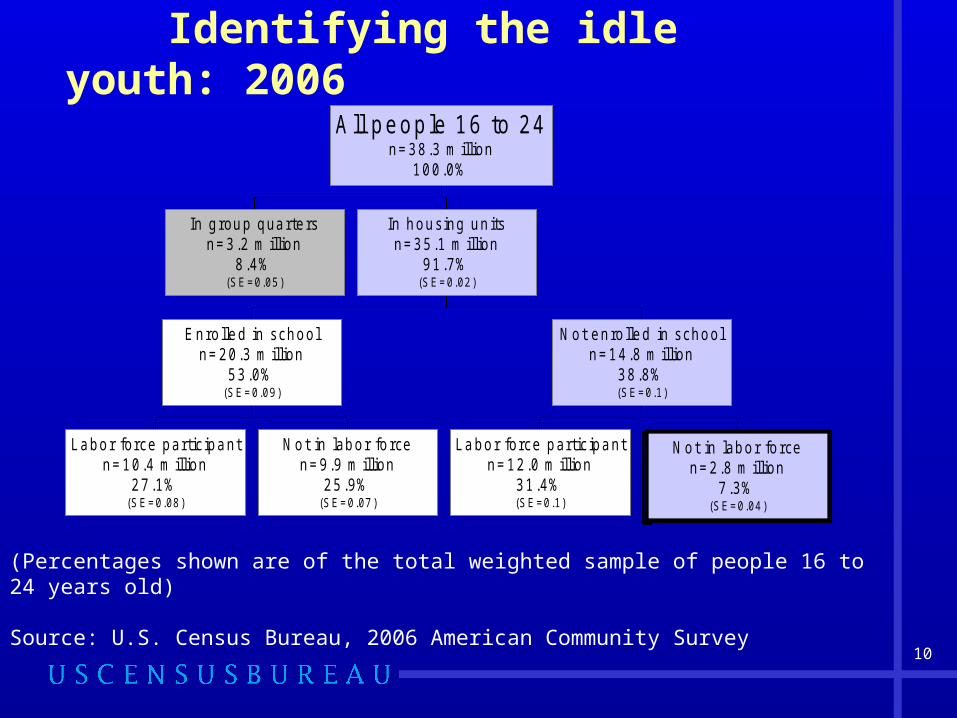
Identifying the idle youth: 2006
In g roup qua rte rsn= 3 .2 m illion
8 .4%(SE=0.05 )
Labo r force partic ipantn= 10 .4 m illion
27 .1%(SE=0.08 )
N ot in labo r fo rcen= 9 .9 m illion
25 .9%(SE=0.07 )
E nro lled in schooln= 20 .3 m illion
53 .0%(SE=0.09 )
Labo r force partic ipantn= 12 .0 m illion
31 .4%(SE=0.1)
N ot in labo r fo rcen= 2 .8 m illion
7 .3%(SE=0.04 )
N ot en ro lled in schooln= 14 .8 m illion
38 .8%(SE=0.1)
In housing un itsn= 35 .1 m illion
91 .7%(SE=0.02 )
All peop le 16 to 24n= 38 .3 m illion
100 .0%
(Percentages shown are of the total weighted sample of people 16 to 24 years old)
Source: U.S. Census Bureau, 2006 American Community Survey
11
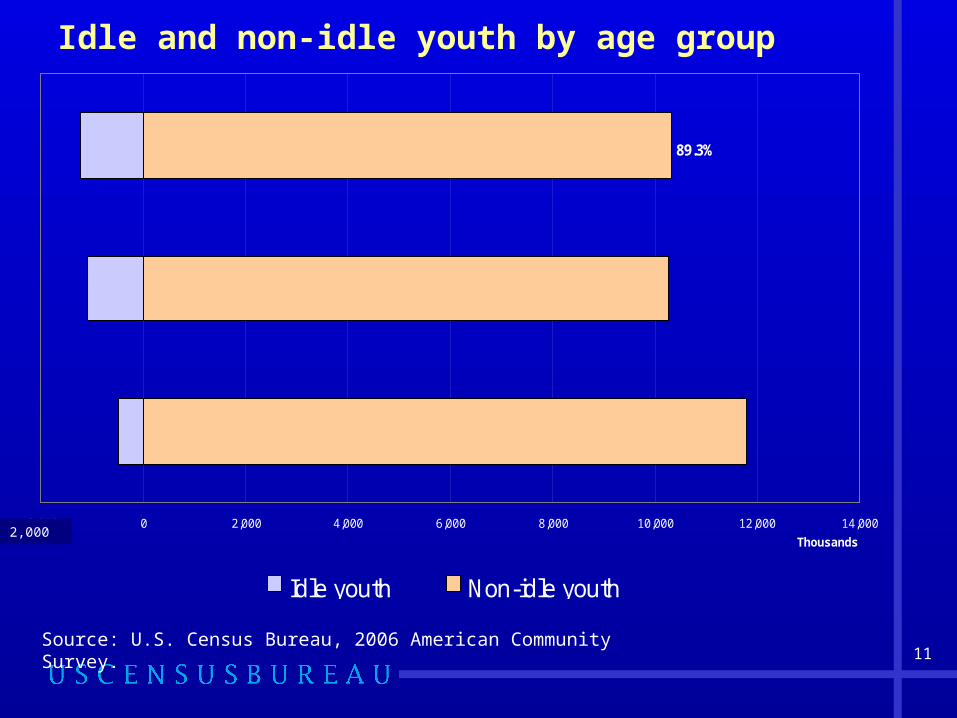
Idle and non-idle youth by age group
Source: U.S. Census Bureau, 2006 American Community Survey.
89.3%
-2,000 0 2,000 4,000 6,000 8,000 10,000 12,000 14,000
Thousands
Idle youth Non-idle youth
22 to 24
19 to 21
16 to 18
10.7%
9.6%
4.0%
90.4%
96.0%
2,000
12
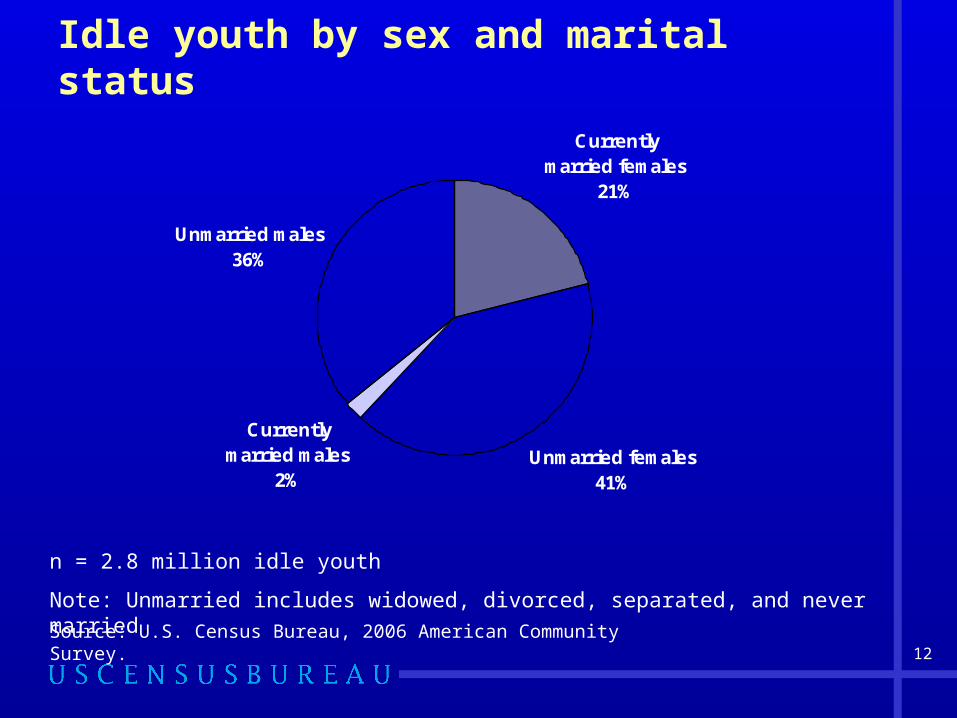
Idle youth by sex and marital status
Source: U.S. Census Bureau, 2006 American Community Survey.
n = 2.8 million idle youth
Note: Unmarried includes widowed, divorced, separated, and never married.
Unmarried females41%
Currently married males
2%
Currently married females
21%
Unmarried males36%
13
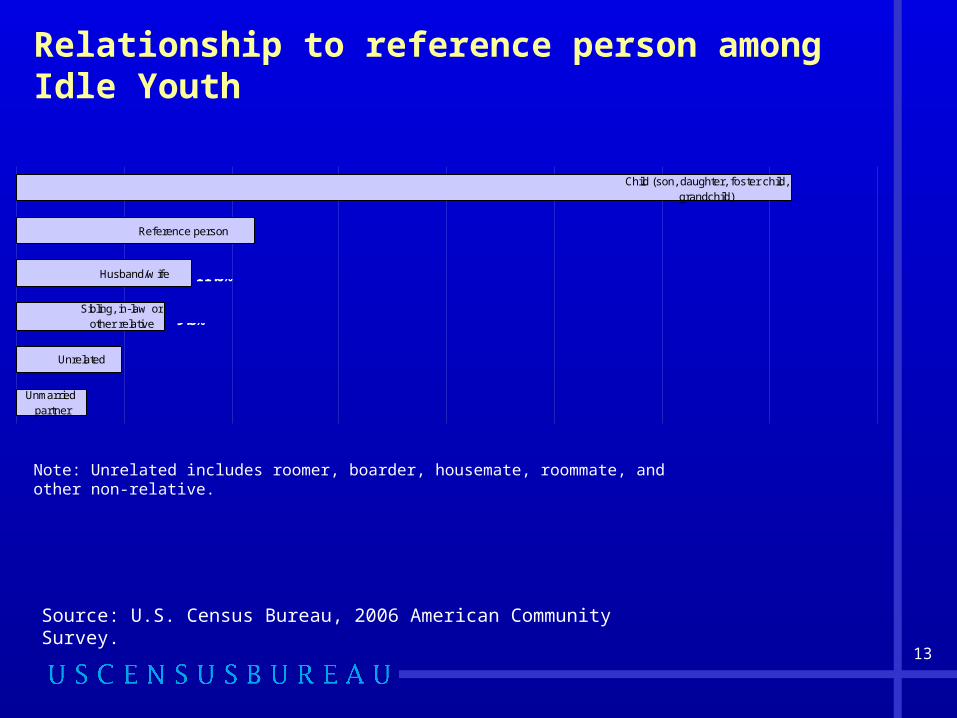
Relationship to reference person among Idle Youth
Source: U.S. Census Bureau, 2006 American Community Survey.
Sibling, in-law or other relative
Reference person
Unmarried partner
Unrelated
Child (son, daughter, foster child, grandchild)
Husband/w ife
51.3%
15.7%
11.6%
9.8%
6.9%
4.6%
Note: Unrelated includes roomer, boarder, housemate, roommate, and other non-relative.
14
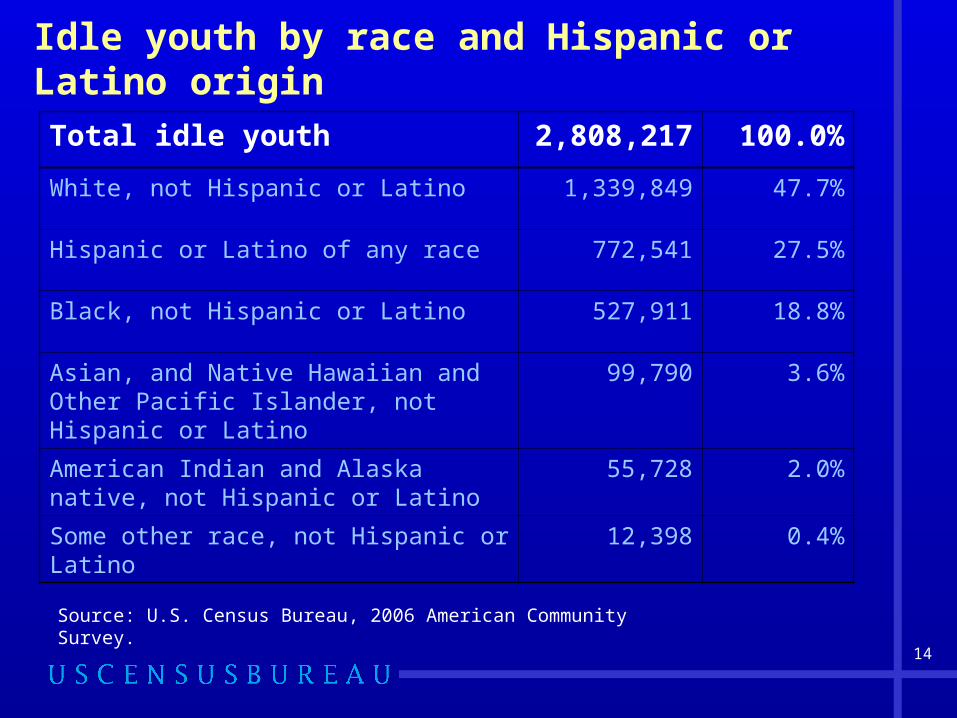
Idle youth by race and Hispanic or Latino origin
Source: U.S. Census Bureau, 2006 American Community Survey.
Total idle youth 2,808,217 100.0%
White, not Hispanic or Latino 1,339,849 47.7%
Hispanic or Latino of any race 772,541 27.5%
Black, not Hispanic or Latino 527,911 18.8%
Asian, and Native Hawaiian and Other Pacific Islander, not Hispanic or Latino
99,790 3.6%
American Indian and Alaska native, not Hispanic or Latino
55,728 2.0%
Some other race, not Hispanic or Latino 12,398 0.4%
15
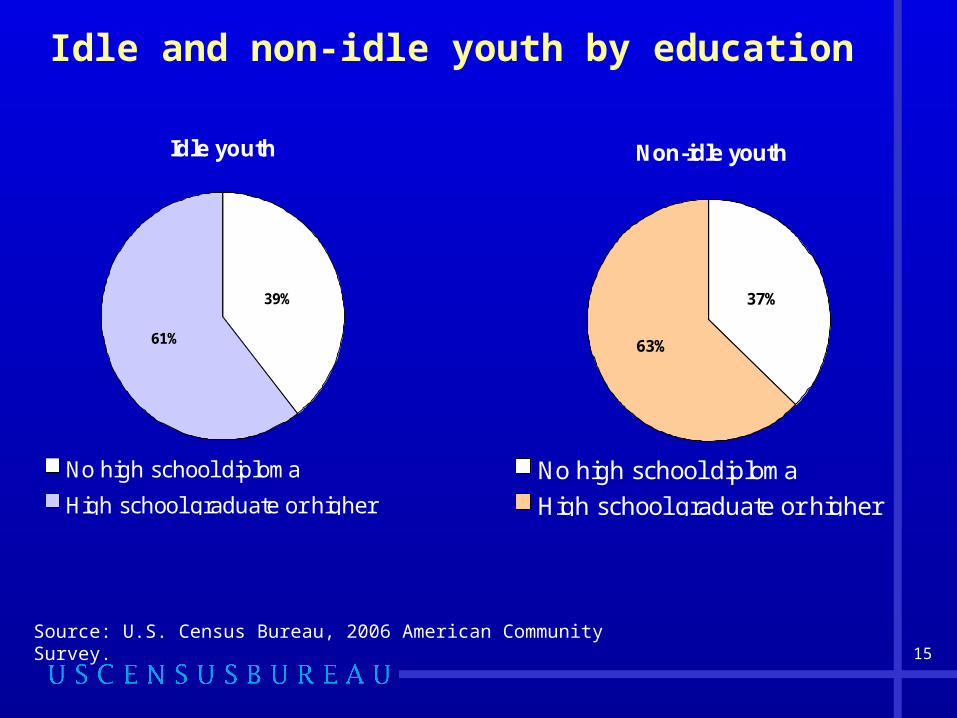
Idle and non-idle youth by education
Source: U.S. Census Bureau, 2006 American Community Survey.
Non-idle youth
37%
63%
No high school diploma
High school graduate or higher
Idle youth
39%
61%
No high school diploma
High school graduate or higher
16
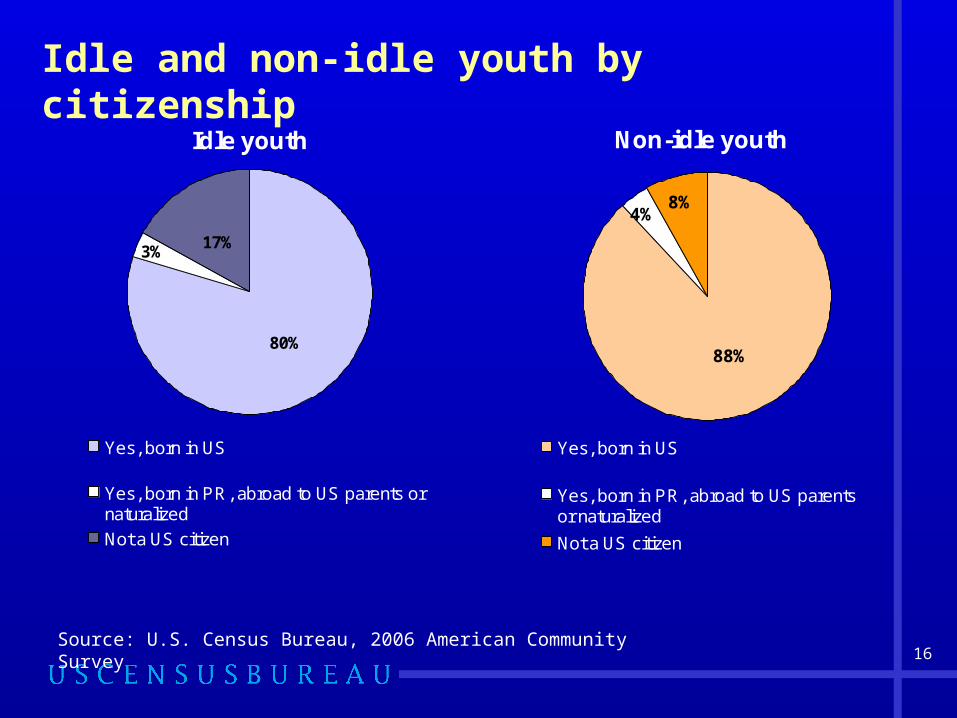
Idle and non-idle youth by citizenship
Source: U.S. Census Bureau, 2006 American Community Survey.
Idle youth
17%
80%
3%
Yes, born in US
Yes, born in PR, abroad to US parents ornaturalized
Not a US citizen
Non-idle youth
88%
4%8%
Yes, born in US
Yes, born in PR, abroad to US parentsor naturalized
Not a US citizen
17
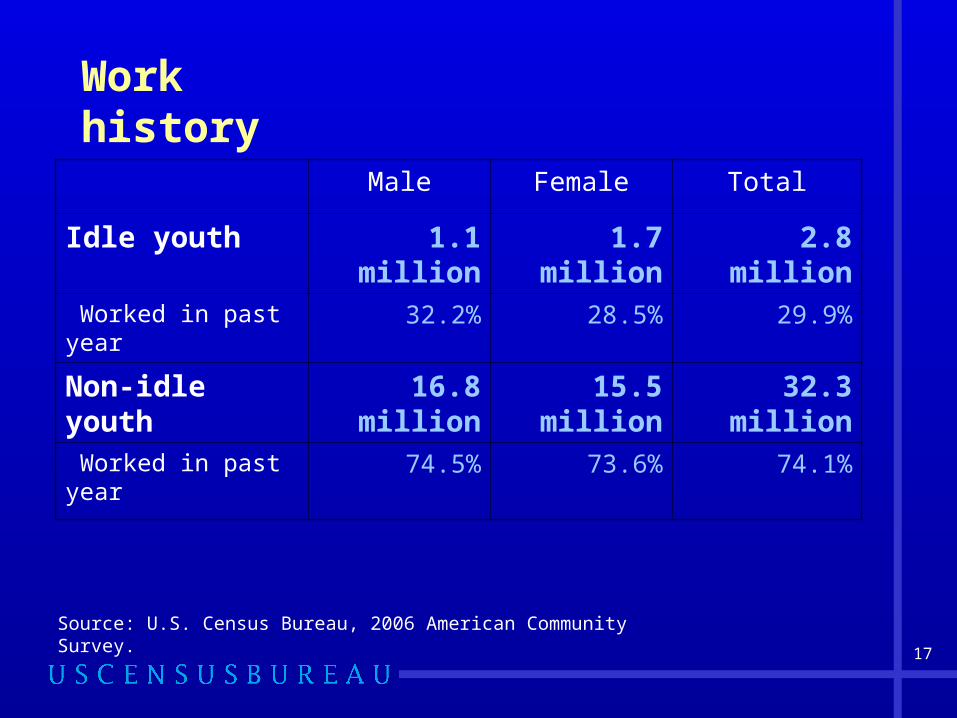
Work history
Source: U.S. Census Bureau, 2006 American Community Survey.
Male Female Total
Idle youth 1.1 million 1.7 million 2.8 million
Worked in past year 32.2% 28.5% 29.9%
Non-idle youth 16.8 million 15.5 million 32.3 million
Worked in past year 74.5% 73.6% 74.1%
18
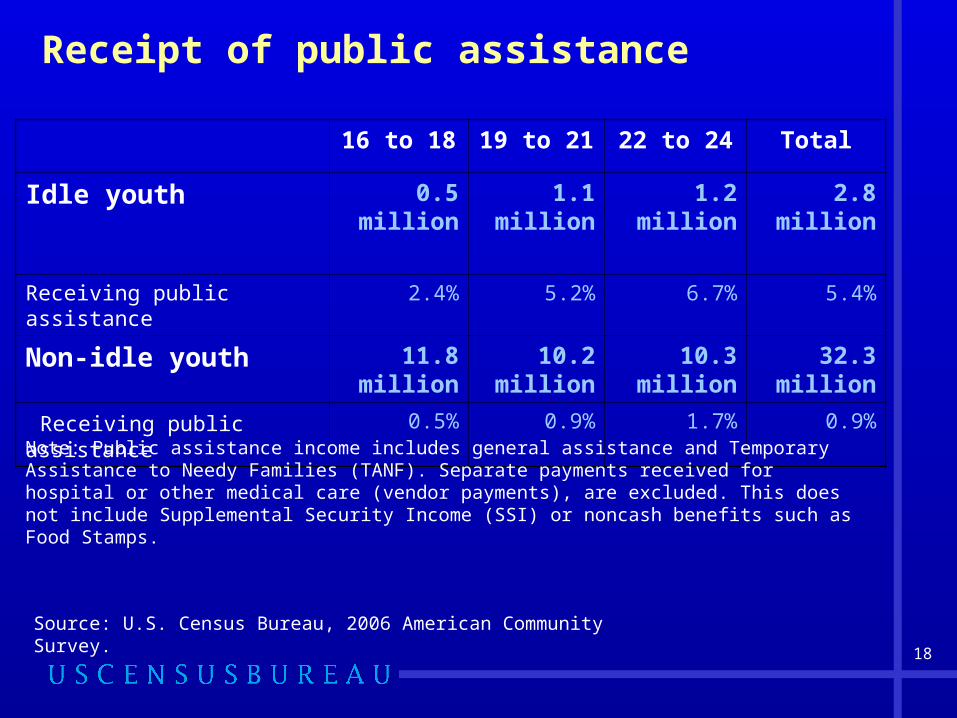
Receipt of public assistance
16 to 18 19 to 21 22 to 24 Total
Idle youth 0.5 million 1.1 million 1.2 million 2.8 million
Receiving public assistance 2.4% 5.2% 6.7% 5.4%
Non-idle youth 11.8 million
10.2 million
10.3 million
32.3 million
Receiving public assistance 0.5% 0.9% 1.7% 0.9%
Source: U.S. Census Bureau, 2006 American Community Survey.
Note: Public assistance income includes general assistance and Temporary Assistance to Needy Families (TANF). Separate payments received for hospital or other medical care (vendor payments), are excluded. This does not include Supplemental Security Income (SSI) or noncash benefits such as Food Stamps.
19
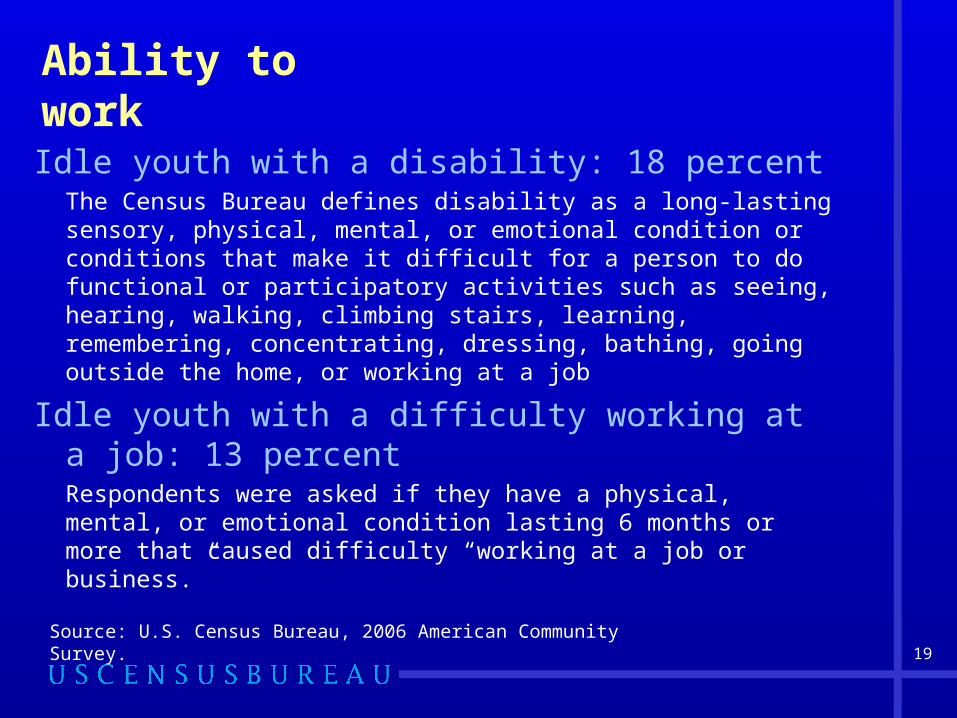
Ability to work
Idle youth with a disability: 18 percentThe Census Bureau defines disability as a long-lasting sensory, physical, mental, or emotional condition or conditions that make it difficult for a person to do functional or participatory activities such as seeing, hearing, walking, climbing stairs, learning, remembering, concentrating, dressing, bathing, going outside the home, or working at a job
Idle youth with a difficulty working at a job: 13 percent Respondents were asked if they have a physical, mental, or emotional condition lasting 6 months or more that caused difficulty “working at a job or business.”
Source: U.S. Census Bureau, 2006 American Community Survey.
20
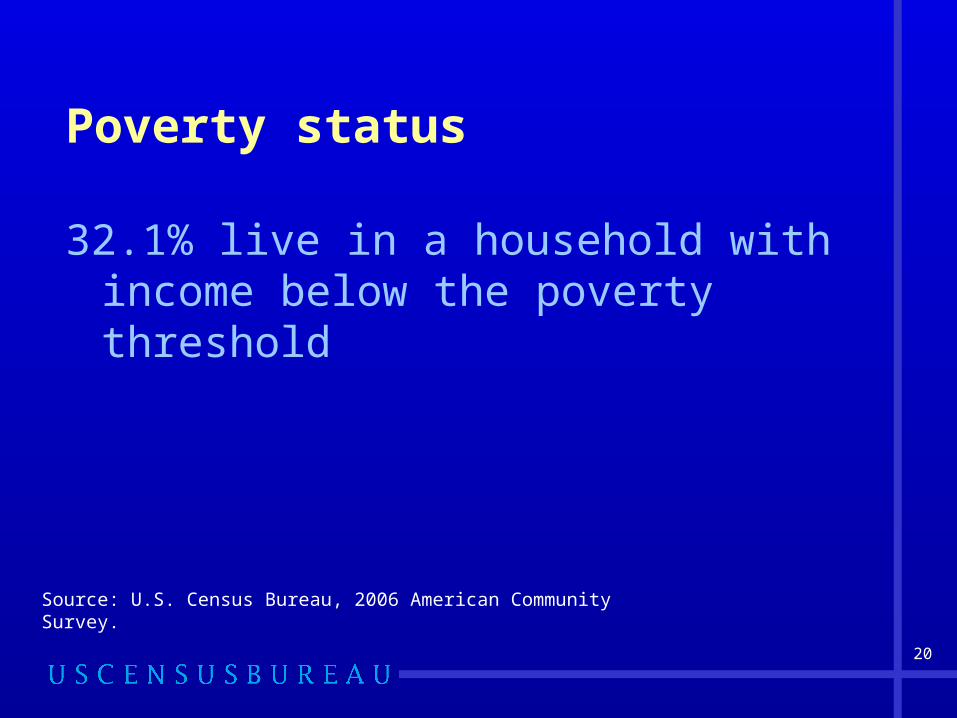
Poverty status
32.1% live in a household with income below the poverty threshold
Source: U.S. Census Bureau, 2006 American Community Survey.

21
Percent idle by state
Legend4.6 to 5.96.0 to 7.98.0 to 9.910.0 to 11.9
Source: U.S. Census Bureau, 2006 American Community Survey.

22
Idle youth by age group and region
Source: U.S. Census Bureau, 2006 American Community Survey.
22 to 24
19 to 21
16 to 18
Northeast Midwest South West
2.7% 3.1% 7.4% 4.4%
5.9% 7.1% 15.5% 10.2%
6.7% 7.9% 17.5% 11.6%
23
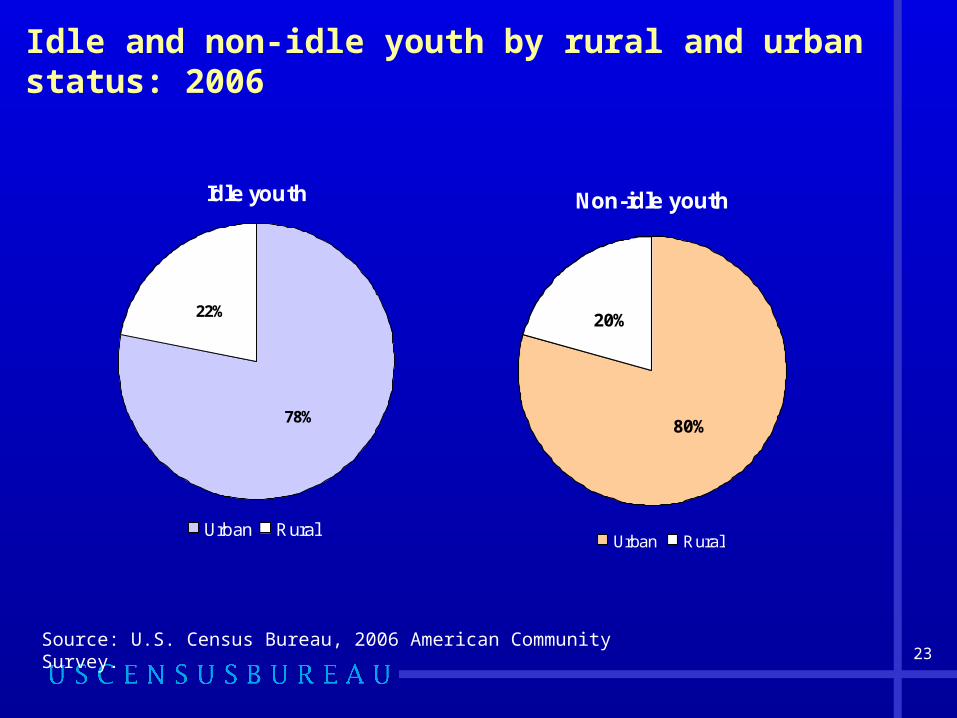
Idle and non-idle youth by rural and urban status: 2006
Non-idle youth
80%
20%
Urban Rural
Idle youth
78%
22%
Urban Rural
Source: U.S. Census Bureau, 2006 American Community Survey.
24
Summary
Transitioning to adulthood, through secondary school to the workforce, is difficult for many young adults.
Most idle youth are related to the householder; the majority are children of the householder.
Female idle youth are more likely to be married compared with male idle youth.
Male idle youth are more likely to be in correctional facilities than female idle youth.

25
Contact informationAna J. Montalvo: [email protected] Tel. 301-763-5977Amy O’Hara: [email protected]. 301-763-5757
For more detailed information on the American Community Survey (ACS), see the following website: http://www.census.gov/acs/www
To get ACS data, access American FactFinder at: http://factfinder.census.gov/home/saff/main.html?_lang=en
For the ACS Source and Accuracy Statement, access the following website: http://www.census.gov/acs/www/Downloads/ACS/accuracy2006.pdf
Top Related