


Languages
Pages
Legal


A practical model for pricing optimization in car
insurance
Prepared by Wilson Mayorga and Diego Torres
Presented to
ASTIN and AFIR/ERM Colloquia
20-24 August 2017
Panama
This paper has been prepared for the 2017 ASTIN and AFIR/ERM Colloquia. The Organizers wish it to be understood that opinions put forward herein are not those of the Organizers and the event Organizing and
Scientific Committees are not responsible for those opinions.
Wilson Mayorga and Diego Torres, FASECOLDA
The Organizers will ensure that all reproductions of the paper acknowledge the author(s) and
include the above copyright statement.

A PRACTICAL MODEL FOR OPTIMIZATION OF CAR INSURANCE RATE
Wilson Mayorga
PgD Actuarial Science (University of Leicester, UK), Msc Finance and Econometrics
(University of York, UK)
Diego David Torres
Master in Actuary and Quantitative Finance (Universidad Nacional de Colombia)
Abstract
A methodology is proposed to calculate the optimal premium for car insurance of a
hypothetical portfolio of clients. The methods use statistical tools to estimate the potential
value of car insurance customers, their price elasticity of demand and simple optimization
algorithms to simulate results. The impact of customer sensitivity to variations in the price of
the insurance policy and the outcome of applying optimal premium rates in several customer
segments are shown.
I. Introduction
The sensitivity of car insurance customers to price and how this affects their retention has
been a subject of intense analysis in the insurance market research literature. Different
methodologies have been developed to determine the most valuable customer groups in an
insurance company with the application of models for estimating the potential value of
customers, and which, given their price elasticity, it would be profitable to offer differential
rates for keeping them as clients of the insurance portfolio. Applications have been
particularly interesting in the case of car insurance.
A number of reviews have assessed these applications of statistical and actuarial
methodologies to calculate the potential value of the clients of a car insurance portfolio and
their reliability as estimates of retention. Gupta et al. (2006) reviewed the models used in the
literature to estimate the potential value of the customer as the present value of the net
benefits (income minus costs) to the company in its relationship with the customer. Harrison
and Ansell (2002) and Reinhart and Kumar (2003) used survival functions to determine the
likelihood that a car insurance customer will renew over time their policy and also to
calculate the likelihood of cross-selling for high probability client retention.
Donkers et al. (2003) propose the use of multivariate probit models to estimate the customer's
decision-making when purchasing several products, Venkatesan and Kumar (2004) use GLM
models to estimate the likelihood of purchasing several insurance products from (cross-
selling) to determine the potential value of the customer.

The use of data mining tools for client segmentation in insurance portfolios can be found in
Smith et al. (2003), Godfrey et al. (2006), Garcia and Hannabi (2002), Yeo et al. (2001),
Kamakura et al. (2003).
The relationship between price elasticity and customer retention probability has been
analysed in Pfeifer and Farris (2003), who also employ duration models. Along similar lines,
Barone and Bella (2004) apply the segmentation of customers and the calculation of price
elasticity in the car insurance market.
Once the probability of retention has been determined, the customer has purchased other
insurance products, at that point the potential value of the client is determined, the portfolio
of clients has been clustered among those clients of high potential value and of low potential
value, then the natural step is to seek retention strategies and maximize the profitability of
high potential value clients.
Given the sensitivity of car insurance customers to the price of the policy, premium rate
optimization is a tool that has been used in the car insurance markets. Price optimization uses
the economic concept of "price elasticity of demand" which is a measure of the value of the
quantity of a product or a service that changes in response to changes in the price.
Through data mining and a program of optimization of the insurance premium, Yeo et al.
(2002) proposes a model of segmentation of clients according to the probability of retention
of the customer segments or clusters and their sensitivity to changes in the price. Krikler et al.
(2004) detailed the methodology of the commercial software EARNIX. It starts from the
calculation of demand functions using GLM models to estimate the sensitivity to the price of
the customers and then applies premium optimization algorithms. With this estimated
demand function, the margin of profitability of the customer portfolio is maximised while
maintaining the retention of the customer portfolio.
Although there are different computer programs available that allow the segmentation of car
insurance customer portfolios and the optimization of its yearly renewal rate, this article
proposes the application of different statistical and actuarial tools available in a unified
framework. Allowing for the segmenting of a client portfolio according to the potential value
of these and to optimize the premium, accounting for the elasticity of the price in the different
segments, so as to maximize profitability by keeping the retention indicators fixed1.
The application of the proposed methodology is carried out on a hypothetical car insurance
client portfolio of a Colombian company.
1 The used algorithms were design in the statistical software R

Figure 1. Client Value and Optimization Methodology
II. Estimation of the Potential Value of the Client
The first step in the car insurance premium optimization methodology is to segment the
customer portfolio according to the potential value of the customer. According to the
specialized literature previously reviewed, the customer's potential value measure was
defined as the sum of the current value and the future value of the customer.
The current value of a customer corresponds to the difference between: the total sum of the
premiums paid during the entire relationship with the insurance company for all the insurance
products less the sum of the claims incurred during the same period (adjusting values by the
effect of inflation) and the acquisition and issue expenses of these same insurance policies.
Some assumptions for the calculation of the client value are: The possibility of a customer
with several insurance products, some of the customers who hold individual car coverage will
have other additional products with the same company (such as home, health, or life
policies). The present value corresponds to the sum of the value of the customer from its first
acquisition of company’s products up to the analysis period.
The future value of the customer is proposed as the expected value of the margin that the
client will leave in his future relationship with the company (premiums less expected losses,
expenses and commissions). The calculation of this future value should be based on the
following elements:
• The likelihood that the client will continue in the future with the Company
• The likelihood that the customer will purchase additional products that he/she currently has
with the Company

• Expected loss ratio of purchased insurance products
• A discount interest rate
The future value will be calculated as the expected value of the average premiums of the
customers of a specific segment multiplied by the probability that the customers will acquire
it, in addition to the car insurance coverage, any of the others considered in the analysis, each
adjusted to the likelihood that the client will maintain his relationship with the insurance
company.
Following the methods in the literature, the probability of customer retention was estimated.
For the exercise presented in this document, the historical information of the current and
cancelled individual car insurance client data base of the last 7 years was used with a Kaplan-
Meier function, the cross-sell probability is proposed to be estimated using a
MULTINOMIAL LOGIT model.
The formal equation for calculating the Customer's Potential Value for k insurance products
included in the possibility of cross-selling will be as follows:
∑( )∑(
)
(
)
III. Segmentation of Client Portfolio
Once the potential value variable for each client is calculated, to estimate several statistical
and econometric models in order to analyse which segments or relevant variables may be
used to cluster the clients with the highest potential value. Some of the models that could be
used are linear regression analysis, percentile regression, ordered probit models or clustering
models such as Correspondence Analysis, Discriminant Analysis, and Tree Analysis and
Neural Networks.
The final objective of the estimation from several of these models, with the descriptive
analysis of the Customer Value, is to find those characteristics of the clients or particular
clusters of clients that allow to determine groups of high potential value. Appropriately
through an analysis of basic statistics, to analyse the differences between the average
potential value of different interest categories. Some examples are:
• To find the differences between the average potential value of clients by sex, insured,
vehicle brand, broker or duration in customer years.
• To present graphically the proportion of customers with more than one product that has
been acquired in the Company.

• To find the proportion of customers with a high potential value per branch.
This analysis can be as extensive as the user considers appropriate and will be done in order
to present analysis tools that can approximate the ultimate goal of customer value analysis,
that is, to find those segments or characteristics that define the most valuable customers.
IV. Tariff Optimization Models
Once the potential value of each customer has been determined, it is possible to cluster and
optimize the premium for each customer segment.
Based on bibliographic references, the premium optimization model was defined in order to
estimate the optimal renewal increment that should be applied to each customer or predefined
cluster of customers. This increase will be applied to the renewal premium associated with
each client; i.e., the net of discounts or surcharges for claims factors or commercial
considerations prior to analysis.
To calculate the optimum increase it is necessary to account for two relevant factors:
• Margin, defined as the expected net premium of expected claims, commissions and
associated expenses.
• Retention rate of the client portfolio
The objective of the mathematical optimization program is to maximize the margin, subject
to two constraints:
• The portfolio retention rate should be maintained above a predefined value.
• The optimal increment for each customer (or group of customers) must be kept within a
predefined range. The minimum limit and the maximum limit of the premium increase rate
range for each customer segment is a parameter determined by the Management.
The optimization program that executes the proposed algorithms maximizes the margin of the
portfolio renewal rate, denoted as r and equivalent to the probability that the client does not
renew the policy, let r be greater than a defined value and the optimal percentage increase of
the premium (d) in a pre-established range:
( )
s.a. ̅
( ) ( ) ( )

The designed algorithms seek to maximize the margin, subject to retention of the portfolio
and to the minimum and maximum limits of premium increase. The final result of the process
will be the optimal increase to be charged on the next renewal to each car insurance
customer.
The optimal premium results from adjusting the premium offered by the optimal margin. This
optimal increase will be the one that the commercial or subscription area will offer in the
renewal of the ith client to offer to each client.
The optimization algorithm proposed in this exercise is a static optimization application by
simulation. For technical details, see Robert and Casella (2010) Chapter 5.
The first step of the premium optimization algorithm is to estimate the demand function,
which will estimate the price elasticity of the customer portfolio analysed. The demand
function corresponds to a GAM-LOGIT2 model that estimates the probability that the
customer renews with the company, according to relevant explanatory variables. It is
mandatory that one of these explanations be the premium issued to be paid by the client.
The GAM models correspond to an extension of the GLM models. A GLM model is defined
by specifying two components: the response function that must be a member of the
exponential distribution and the link function that describes how the mean response is related
and a linear combination of predictors.
In a GLM the distribution of the variable y belongs to the exponential family of distributions
that takes the following general form:
( ) [ ( )
( ) ( )]
In this equation, is the canonical parameter and represents the location, while is the
scatter parameter and represents the scale. Exponential family distributions have mean and
variance as follows:
( ) ( )
( ) ( ) ( )
2 See details in Jong and Zeller (2008), and Wood (2012).

The mean is a function that depends only on while the variance depends on the product of
two functions, localization and scale ones.
The link function g, describes how the average response ( ) to the covariables is linked
through the linear predictor:
( )
We can express the effect of predictors on the response through a linear predictor of the form:
Some link functions and its family function are as follows:
Family Function Link Variance function Normal 1
Poisson Binomial
⁄
( )
Gama Inverse Gauss
The parameters of a GLM can be estimated using maximum likelihood, the logarithm of
the maximum likelihood function for a single observation, where ( ) ⁄ is:
( ) [ ( )
] ( )
In this way, for independent observations, the logarithm of the likehood function will be:
.
In the case of the GAM model, a non-parametric approach is applied, estimated as:
( )
Once the demand function (or demand functions by client cluster) is estimated, the proposed
static optimization algorithm is applied, so that each customer or segment of customers will
have an increase in their renewal premium rate considered optimal, given the above
considerations.

The optimization algorithm by simulation can be constructed such that it is correlated with
the company's probability of renewal; the optimal premium increase is greater when the
client's turnover probability is higher (otherwise, the average probability of the client cluster,
according on model variation). In this way, customers with lower price sensitivity will have a
greater increase in their premium.
However, it is possible that the optimization algorithm allocates the optimum rate increase
differentially for each segment, keeping the renewal rate constant between segments. The
utility of this second alternative is that the user may consider it relevant to analyse different
classifications of the client portfolio. For example, to create client cluster according to their
Potential Value, the first segment incorporates those customers with Lower Potential Value
and the last segment those of Higher Potential Value. By applying this algorithm, the impact
of applying differentiated premium increases is quantifiable with a portfolio characteristic, or
in general, by a desired user characteristic.
From a theoretical viewpoint, the optimization model seeks to affect the retention rate of a
client portfolio.
In general terms, the optimization algorithm starts from generating random numbers (for each
individual or each cluster) with the distribution chosen by the user (by default, uniform)
between the lower limit and upper limit of the defined premium increase ranges.
With the ith iteration of premium growth rates, the proposed renewal premium is estimated,
when this is used the estimated demand function is evaluated. The result of evaluating the
demand function will be the probability of renewal for each individual in the given segment.
If the probability of the portfolio renewal or that of the determined estimated clusters by the
demand function is lower than that required by the model, the algorithm passes to the next
iteration. In case that the renewal rate exceeds the required threshold, this renewal premium
evaluates the objective function, which is the sum of the margin of all policyholders in all
segments of the insurance portfolio.
This procedure is repeated n times. The optimal renewal premium results from multiplying
the current premium by the optimal increased premium, such that it generates the highest
margin value of all iterations of the algorithm. (For computational details of the algorithm see
Robert and Casella (2010), Chapter 5).
Finally, the user could assign a retention rate, which will be used as a constraint of the
optimization algorithm. In particular, the proposed algorithm evaluates in each replicate the
increment assigned to clients. If, when the optimal increment is applied, the retention rate is
less than the predefined value, this increment vector is rejected and a new increment vector is
evaluated.

If the user does not choose a target retention rate, the algorithm will take as an evaluation
threshold the estimated retention rate as the average of the probability of renewing the policy
for the set of clients in the analysed database.
When using the algorithm of optimization for determined segments, the same optimum
increase will be assigned for the clients that belong to the segment, while different optimum
increments will be assigned for different customer segments.
V. Application of the Methodology
Theoretically, the potential customer value model seeks to find those customer groups, or
which characteristics of these clients can be used to identify clusters, where there is greater
average potential value.
A portfolio of 57,246 clients of car insurers, of which some had household products or
compulsory civil liability insurance (SOAT), was taken in the following proportion3:
Chart 2. Proportion of Insurance Products Acquired in Client Portfolio
The result of this section is the estimation of the potential value per client insured. Initially,
the customer retention function was estimated by means of a survival function with
information on car customers (current and cancelled) for the last 7 years.
3 Some of the variables that are included in the built database have vehicle class, vehicle brand, customer
assigned broker, bonus-malus discount assigned, branch or city, insured's gender, number of years in the company, among other categories.

Table 1. Customer Survival Function
The second step was to estimate the probability of purchasing additional products to car
insurance using a LOGIT MULTINOMIAL model.
Table 2. Estimated Odds of Cross Selling
Graph 3. Average Probability of Cross-Selling by Broker

Table 3. Average Probability of Cross Selling - By Vehicle Mark
The third step was to estimate the potential value for each current customer. Once the
customer's value was estimated, they were clustered into groups of high, medium and low
potential value.
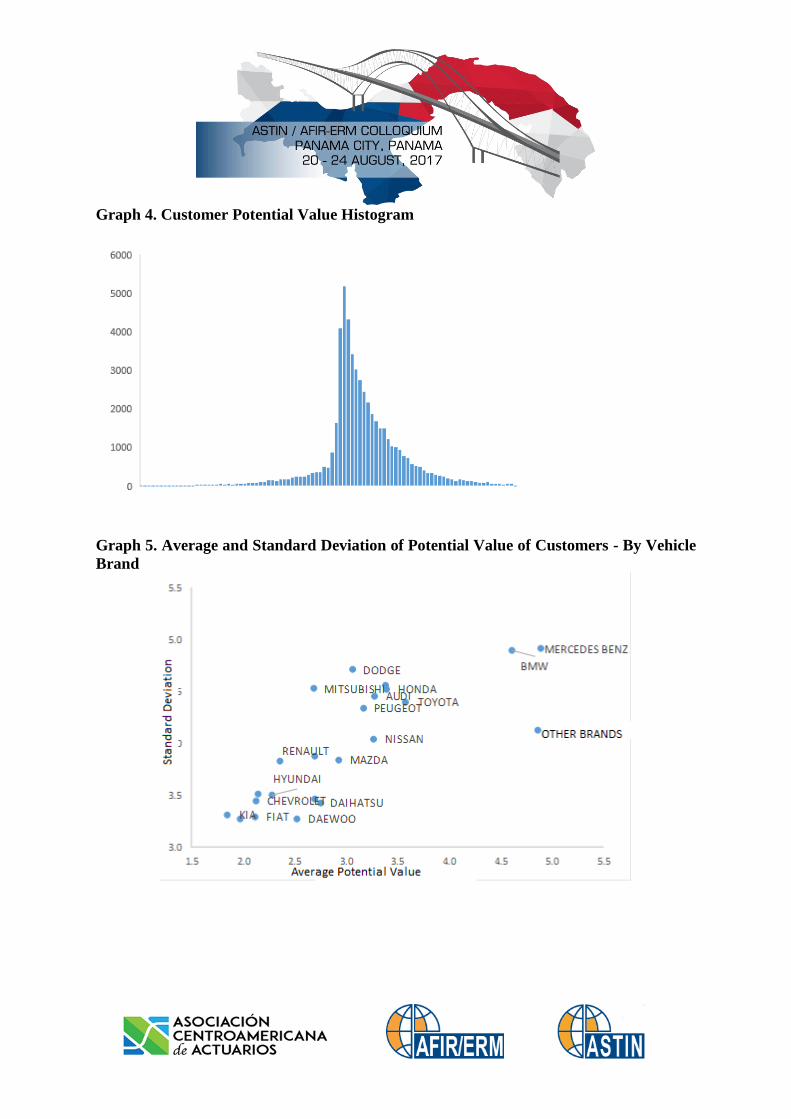
Graph 4. Customer Potential Value Histogram
Graph 5. Average and Standard Deviation of Potential Value of Customers - By Vehicle
Brand

Graph 6. Average and Standard Deviation of Potential Customer Value - By Broker
The clients were separated into four clusters of analysis, according to the quartiles of the
empirical distribution of the estimated potential value. When estimating the demand function
using a GAM-LOGIT model, where the dependent variable is 1: if the customer is in effect
and 0: if the customer has cancelled the policy in the last 24 months, and one of the
independent variables is the premium of his or her last renewal.
The results show that the cluster of customers with the highest potential value proved to be
those with lower price elasticity of demand function, while the segment of customers in the
second quartile of potential value proved to be the ones with the highest elasticity.

Graph 7. Estimated Elasticity of Retention (GAM-LOGIT Model Coefficient)
Finally, the rate optimization algorithm was applied for each segment of potential customer
value, based on the following parameters:
The applied algorithm allowed estimates of the optimal increase for each customer cluster.
The algorithm was restricted to generate optimal increments between 3% and 13% and a
renewal rate that was at least 75%. The optimization algorithm by simulation was constructed
to allocate the largest increase in the renewal premium to customers of lower potential value
(first quartile).
Table 4. Optimum Rate Increase by Clients Cluster
-0.25
-0.39
-0.24
-0.09
-0.45
-0.40
-0.35
-0.30
-0.25
-0.20
-0.15
-0.10
-0.05
0.00
Cuantil1 Cuantil2 Cuantil3 Cuantil4

Figure 8. Probability of renewal - Optimized customer portfolio
By construction, the retention rate is maintained constant in customer clusters and the optimal
growth in the premium is decreasing for the different clusters chosen.
VI. CONCLUSIONS
Models of client potential value estimation and rate optimization are becoming standard
models in car insurance pricing. Based on the applications described, a methodology for
estimating the potential value of customers and premium optimization is presented. The
methodology accounts for the likelihood that customers will maintain the current relationship
with the company and the cases where there are cross-selling options and, through the
estimation of a demand function for different client clusters, estimates the optimal increase of
the renewal premium issued for these clusters.
Through simulation optimization tools it is possible to generate different optimization
algorithms for client clusters that are correlated with the potential value of the customer or
that maintain the expected renewal rate of the portfolio under analysis.
75%

VII. BIBLIOGRAPHIC REFERENCES
Barona, G. and Bella, M (2004) Price-elasticity based customer segmentation in the Italian
car insurance market. Journal of Targeting, Measurement and Analysis for Marketing. Vol 13
(1), pp. 21-31.
Donkers, B. et al. (2003) Modeling CLV: A test of competing models in the insurance
industry. Quantitative Marketing Economics, Vol 5, pp, 163–190.
Garcia, M. and Hannabi, H (2002) Customer Knowledge Management. The Journal of the
Operational Research Society, Vol. 53 (8), pp. 875-884.
Gupta, S. et al (2006) Modeling Customer Lifetime Value. Journal of Service Research,
Volume 9 (2), pp. 139-155.
Harrison, T. and Ansell, J (2002) Customer retention in the insurance industry: Using
survival analysis to predict cross-selling opportunities. Journal of Financial Services
Marketing, Vol. 6 (3), pp. 229–239.
Jong, P. and Zeller, Z (2008) Generalized Linear Models for Insurance Data. Cambridge
University Press.
Krikler, S. et al. (2004) Method and tools for insurance price and revenue optimisation.
Journal of Financial Services Marketing. Vol 9(1), pp. 68-79.
Reinhartz, W. and Kumar, V (2003) The Impact of Customer Relationship Characteristics on
Profitable Lifetime Duration. Journal of Marketing, No. 67, pp. 77–99.
Robert, C. and Casella, G (2010) Introducing Monte Carlo Methods with R. Springer.
Smith, K. et al. (2003) An Analysis of Customer Retention and Insurance Claim Patterns
Using Data Mining: A Case Study. The Journal of the Operational Research Society, Vol. 51
(5), pp. 532-541.
Venkatesan, R. and Kumar, V (2004) A Customer Lifetime Value Framework for Customer
Selection and Resource Allocation Strategy. Journal of Marketing, Vol. 68 (October 2004),
pp. 106–125.
Wood, S (2012) Generalized Addtive Models: An Introduction with R. Chapman and Hall.
Yeo, A et al.(2002) A Mathematical Programming Approach to Optimise Insurance Premium
Pricing within a Data Mining Framework. The Journal of the Operational Research Society,
Vol. 53, No 11, pp. 1197-1203.

Yeo, A. et al.(2001) Clustering Technique for Risk Classification and Prediction of Claim
Costs in the Automobile Insurance Industry. International Journal of Intelligent Systems in
Accounting, Finance & Management. No. 10, pp.39-50.
Top Related