


Languages
Pages
Legal


A NEW MULTI-SPECTRAL THRESHOLD NORMALIZED DIFFERENCE WATER
INDEX (MST-NDWI) WATER EXTRACTION METHOD -- A CASE STUDY IN YANHE
WATERSHED
Ying Zhou1, 2, Hongrui Zhao1, 2, , Han Hao3, Chaojun Wang1, 2
1Department of Civil Engineering, Tsinghua University, Beijing 10084, China - ([email protected],
[email protected], [email protected]) 23S Center, Tsinghua University, Beijing 10084, China
3Beijing Institute of Remote Sensing, Beijing 100192, China - ([email protected])
Commission III, WG III/1
KEY WORDS: Water Extraction, MST-NDWI, Small Linear River, Remote Sensing, Yanhe Watershed
ABSTRACT:
Accurate remote sensing water extraction is one of the primary tasks of watershed ecological environment study. Since the Yanhe
water system has typical characteristics of a small water volume and narrow river channel, which leads to the difficulty for
conventional water extraction methods such as Normalized Difference Water Index (NDWI). A new Multi-Spectral Threshold
segmentation of the NDWI (MST-NDWI) water extraction method is proposed to achieve the accurate water extraction in Yanhe
watershed. In the MST-NDWI method, the spectral characteristics of water bodies and typical backgrounds on the Landsat/TM
images have been evaluated in Yanhe watershed. The multi-spectral thresholds (TM1, TM4, TM5) based on maximum-likelihood
have been utilized before NDWI water extraction to realize segmentation for a division of built-up lands and small linear rivers. With
the proposed method, a water map is extracted from the Landsat/TM images in 2010 in China. An accuracy assessment is conducted
to compare the proposed method with the conventional water indexes such as NDWI, Modified NDWI (MNDWI), Enhanced Water
Index (EWI), and Automated Water Extraction Index (AWEI). The result shows that the MST-NDWI method generates better water
extraction accuracy in Yanhe watershed and can effectively diminish the confusing background objects compared to the conventional
water indexes. The MST-NDWI method integrates NDWI and Multi-Spectral Threshold segmentation algorithms, with richer
valuable information and remarkable results in accurate water extraction in Yanhe watershed.
Corresponding author should be addressed to Hongrui Zhao, Email: [email protected].
1. INTRODUCTION
Water is the key factor to characterize the health condition and
stability of the watershed ecosystem. To study the ecological
environment of the watershed, the first priority is to accurately
analyzing the spatial distribution of water, as well as river
length, water area and water amount. Remote sensing
technology has the advantages of obtaining a wide range of
ground object information simultaneously. With the vigorous
development of remote sensing technology, more and more
information can be acquired. The water information accurately
extracted from remote sensing data can provide decision
support for the monitoring and evaluation of the ecological
environment, and the investigation and management of water
resources. Therefore, the research of water extraction based on
remote sensing images is of great significance.
Remote sensing data can be classified in accordance with the
spatial resolution, temporal resolution and spectral resolution.
Landsat image has been widely recognized as the most widely
used medium-resolution, multi-spectral remote sensing data,
boasting a spatial resolution that is suitable for ecological
environment research at watershed scales, and its spectral
resolution can provide efficient support for remote sensing
thematic information extraction and classification (Wang et al.,
2016). For medium and low-resolution remote sensing images,
water extraction methods based on spectral characteristics of
ground objects are often used, which can be generally divided
into single band method and multi-band method (Xu, H., 2005).
Single band method uses the near-infrared band in the remote
sensing data for threshold segmentation (Rundquist et al., 1987)
to extract water. While the multi-band methods use the
difference, ratio or operational relation of reflectivity between
two to four bands to enhance water and suppress background
for water extraction (Mcfeeters, 1996; Xu, 2005; Pei et al., 2007;
Feyisa et al., 2014). For multi band methods, the water index
method is relatively convenient and applicable.
In 1996, McFeeters proposed the Normalized Difference Water
Index (NDWI), which used the reflection characteristics in the
green band and the near-infrared band of the ground objects to
distinguish water from vegetation with similar spectral
characteristics (Mcfeeters, S. K., 1996); In 2006, Xu proposed
the Modified NDWI (MNDWI), in which the near-infrared
band of NDWI was replaced by the medium-infrared band, in
purpose to reduce the influence of soil/built-up land on water
extraction and improve water extraction accuracy in the urban
area (Xu, 2005). In 2007, Yan et al. proposed the Enhanced
Water Index (EWI) to adopt the green band, near infrared band
and medium-infrared band for calculation simultaneously,
effectively eliminating the confusion between semi-dry river
channels and background objects and improving the extraction
of water systems in semi-arid areas (Pei et al., 2007). In 2013,
Gudina et al. proposed the Automated Water Extraction Index
(AWEI) which utilized five bands including red band, green
The International Archives of the Photogrammetry, Remote Sensing and Spatial Information Sciences, Volume XLII-3, 2018 ISPRS TC III Mid-term Symposium “Developments, Technologies and Applications in Remote Sensing”, 7–10 May, Beijing, China
This contribution has been peer-reviewed. https://doi.org/10.5194/isprs-archives-XLII-3-2557-2018 | © Authors 2018. CC BY 4.0 License.
2557

band, near-infrared band, medium-infrared band and far-
infrared band for the construction of the water index, taking full
advantage of the information provided by Landsat data to
efficiently eliminate the confusion of water extraction due to the
deep shadow caused by topography in the mountainous area
(Feyisa et al., 2014).
The above methods of water extraction are effective for facial
water (such as reservoirs, lakes, etc.) and wide rivers, but
cannot separate the background and the water body completely
for small linear rivers in Yanhe watershed, and results in low
accuracy of water extraction. In this study, a new Multi-Spectral
Threshold water extraction method based on Normalized
Difference Water Index (MST-NDWI) using Landsat TM image
is proposed, which performs better for spatial explicit analysis
of small linear rivers over the conventional NDWI method in
Yanhe watershed.
2. STUDY AREA AND DATA SOURCES
2.1 Test Sites
Yanhe River originates from Jingbian County, and it flows from
northwest to southeast through Jingbian County, Zhidan County,
Ansai District, Baota District and Yanchang County, and finally
into the Yellow River near the bank of Liangshui in Yanchang
County (Wang, 2014). With a total length of about 286.9km,
the Yanhe watershed is located in the hinterland of the Loess
Plateau in northern Shaanxi Province. Its geographical location
is 36°23′ to 37°17′N and 108°45′ to 110°28′E with a total area
of approximately 7,725 km2.
Figure 1. The location and administrative division of the study
area.
The topography of the study area is undulating, with the high
terrain in northwest and low in southeast. Its water system
structure is dendrimer (Chilie et al., 2005), especially in the
upper and middle reaches with a river network density of 3.4
km/km2. The larger tributaries are distributed in this section.
The downstream tributaries are short and pinnate.
2.2 Data Sources
Remote sensing data used in this paper is the Landsat5 TM
image, which was obtained from the Geospatial Data Cloud
website (http://www.gscloud.cn/). The product type of all data
is L1T, which went through system radiometric correction,
ground control point (GCP) geometric correction and
topographic correction by DEM. The data projection is UTM-
WGS84. In view of the relatively limited amount of water in the
study area, the TM images of wet periods on the 17th of June,
2010 were selected.
3. METHODS
3.1 Image Pre-processing
In this study, the fundamental method is to analyze the
reflection characteristics of different objects on the TM images.
Therefore, obtaining accurate spectral information of ground
objects from the images is of vital importance. In order to
acquire the spectral information from the image requires
atmospheric correction, the Atmospheric correction was applied
to the two images using the Fast Line-of-Sight Atmospheric
Analysis of Spectral Hypercubes (FLAASH) module in ENVI
5.1. During preprocessing, mosaic and cutting images are also
necessary steps to obtain the experimental data.
TM image
Radiometric calibration
FLAASAAtmospheric
correction
Imagemosaic
Regional cutting
ExperimentalData
Figure 2. The pre-processing flow chart
3.2 Water Extraction
Based on the spectral analysis of remote sensing data, the
physical basis of water extraction is the electromagnetic wave
reflection characteristics of the ground objects. Considering the
inherent nature of the objects, different objects have different
reflectivity in different bands. Objects can be classified based
on the difference of spectrum characteristic extracted from
remote sensing images.
Due to the strong absorbency for incidental energy (solar light),
the reflectivity of water is weak, with a tendency to further
weaken as the wavelength increases (Xu, 2005). This
phenomenon can be clearly seen in Figure 3 that the reflectivity
of the spectral curve of water on the TM2 band reaches a
maximum, which is significantly higher than that on the TM4
band, that meet the typical spectral characteristics of water
(Mcfeeters, 1996). However, for vegetation and built-up land,
the reflectivity on the TM4 band is greater than that on the TM2
band, especially for vegetation, and the reflectivity on the near-
infrared band is far greater than that on the green band.
Figure 3. The spectrum extracted from pure pixel samples of
built-up land, vegetation and water in the study area, showing
the reflection characteristics of different bands on typical
objects.
McFeeters (1996) constructed the NDWI water extraction index
by using the reflectivity differences of ground objects on the
The International Archives of the Photogrammetry, Remote Sensing and Spatial Information Sciences, Volume XLII-3, 2018 ISPRS TC III Mid-term Symposium “Developments, Technologies and Applications in Remote Sensing”, 7–10 May, Beijing, China
This contribution has been peer-reviewed. https://doi.org/10.5194/isprs-archives-XLII-3-2557-2018 | © Authors 2018. CC BY 4.0 License.
2558
green band and near-infrared band. The index is calculated as
follows:
GREEN NIRNDWI
GREEN NIR (1)
In the formula (1), GREEN refers to the green band, i.e. TM2
band; NIR refers to the near-infrared band, i.e. TM4 band.
(Mcfeeters, 1996)
The NDWI index indicates the difference of the variation trend
of the spectral curves of different objects, which can be used to
distinguish water body and background objects. The
conventional method is to judge from the NDWI value, while
it’s positive, the pixel shall be determined as water, conversely
as non-water. In this way, water was extracted.
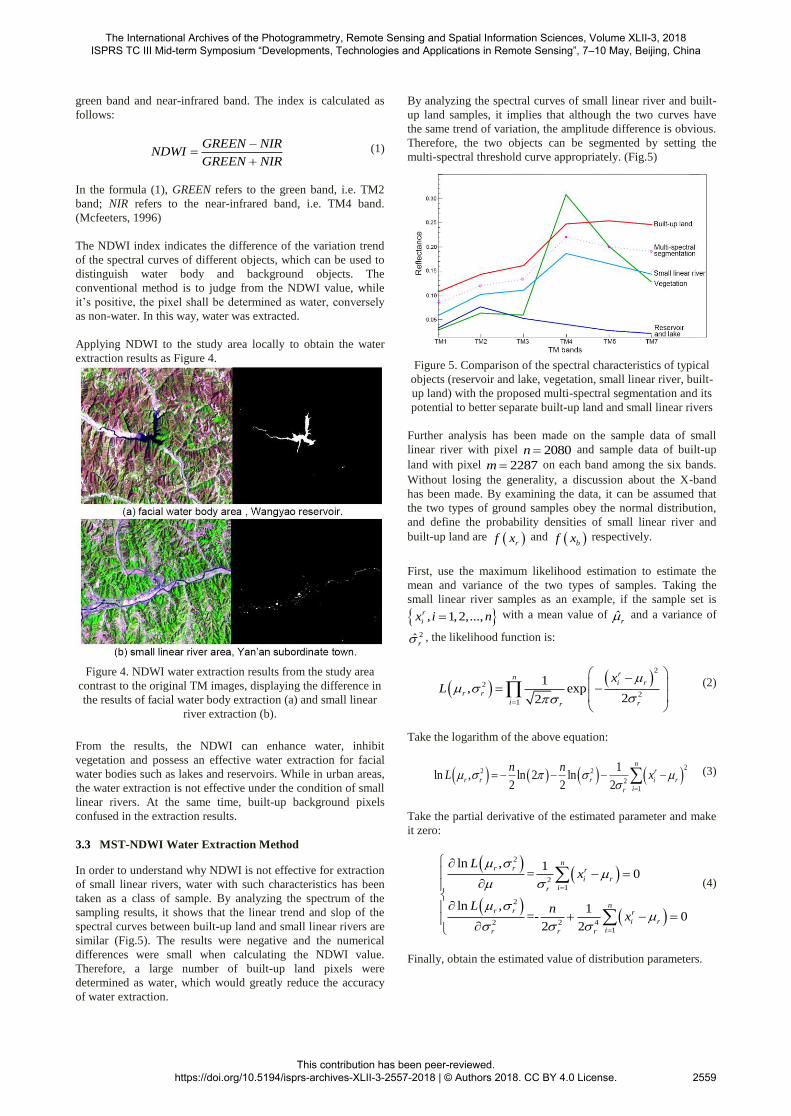
Applying NDWI to the study area locally to obtain the water
extraction results as Figure 4.
Figure 4. NDWI water extraction results from the study area
contrast to the original TM images, displaying the difference in
the results of facial water body extraction (a) and small linear
river extraction (b).
From the results, the NDWI can enhance water, inhibit
vegetation and possess an effective water extraction for facial
water bodies such as lakes and reservoirs. While in urban areas,
the water extraction is not effective under the condition of small
linear rivers. At the same time, built-up background pixels
confused in the extraction results.
3.3 MST-NDWI Water Extraction Method
In order to understand why NDWI is not effective for extraction
of small linear rivers, water with such characteristics has been
taken as a class of sample. By analyzing the spectrum of the
sampling results, it shows that the linear trend and slop of the
spectral curves between built-up land and small linear rivers are
similar (Fig.5). The results were negative and the numerical
differences were small when calculating the NDWI value.
Therefore, a large number of built-up land pixels were
determined as water, which would greatly reduce the accuracy
of water extraction.
By analyzing the spectral curves of small linear river and built-
up land samples, it implies that although the two curves have
the same trend of variation, the amplitude difference is obvious.
Therefore, the two objects can be segmented by setting the
multi-spectral threshold curve appropriately. (Fig.5)
Figure 5. Comparison of the spectral characteristics of typical
objects (reservoir and lake, vegetation, small linear river, built-
up land) with the proposed multi-spectral segmentation and its
potential to better separate built-up land and small linear rivers
Further analysis has been made on the sample data of small
linear river with pixel 2080n and sample data of built-up
land with pixel 2287m on each band among the six bands.
Without losing the generality, a discussion about the X-band
has been made. By examining the data, it can be assumed that
the two types of ground samples obey the normal distribution,
and define the probability densities of small linear river and
built-up land are rf x and bf x respectively.
First, use the maximum likelihood estimation to estimate the
mean and variance of the two types of samples. Taking the
small linear river samples as an example, if the sample set is
, 1, 2,...,r
ix i n with a mean value of ̂r and a variance of
2̂ r, the likelihood function is:
2
2
21
1, exp
22
r
ni r
r r
i rr
xL
(2)
Take the logarithm of the above equation:
2
2 2
21
1ln , ln 2 ln
2 2 2
n
r
r r r i r
ir
n nL x (3)
Take the partial derivative of the estimated parameter and make
it zero:
2
21
2
2 2 41
ln , 1= 0
ln , 1=- 0
2 2
nr r r
i r
ir
nr r r
i r
ir r r
Lx
L nx
(4)
Finally, obtain the estimated value of distribution parameters.
The International Archives of the Photogrammetry, Remote Sensing and Spatial Information Sciences, Volume XLII-3, 2018 ISPRS TC III Mid-term Symposium “Developments, Technologies and Applications in Remote Sensing”, 7–10 May, Beijing, China
This contribution has been peer-reviewed. https://doi.org/10.5194/isprs-archives-XLII-3-2557-2018 | © Authors 2018. CC BY 4.0 License.
2559
1
2
2
1
1ˆ
1ˆ ˆ
nr
r i
nr
r i r
xn
xn
(5)
According to the above method, the mean value ̂b and the
variance ̂ r
b on the X-band of built-up land samples can be
estimated. Then search the segmentation threshold TX within
the band interval of ˆ ˆ, r b ,
arg max
T
TT
X
r bXX
f x dx f x dx (6)
The segmentation threshold on each band can be obtained by
the same method. The following table shows the threshold
results obtained through search calculations (Table 1)
band object Mean Segmentation
threshold
TM1 small linear river 0.0634
0.0867 built-up land 0.1093
TM2 small linear river 0.1016
0.1224 built-up land 0.1431
TM3 small linear river 0.1104
0.1358 built-up land 0.1606
TM4 small linear river 0.1822
0.2169 built-up land 0.2443
TM5 small linear river 0.1642
0.2043 built-up land 0.2546
TM7 small linear river 0.1411
0.1926 built-up land 0.2475
Table 1 Segmentation threshold calculated by the two types of
object samples from each band.
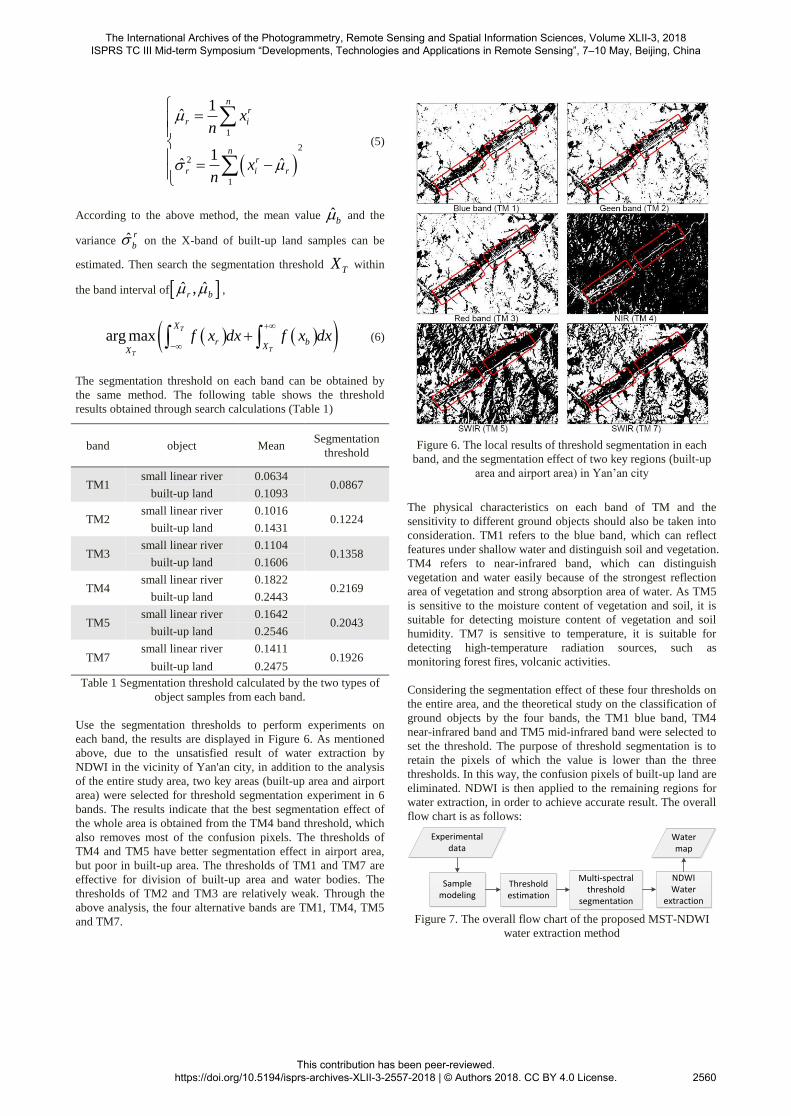
Use the segmentation thresholds to perform experiments on
each band, the results are displayed in Figure 6. As mentioned
above, due to the unsatisfied result of water extraction by
NDWI in the vicinity of Yan'an city, in addition to the analysis
of the entire study area, two key areas (built-up area and airport
area) were selected for threshold segmentation experiment in 6
bands. The results indicate that the best segmentation effect of
the whole area is obtained from the TM4 band threshold, which
also removes most of the confusion pixels. The thresholds of
TM4 and TM5 have better segmentation effect in airport area,
but poor in built-up area. The thresholds of TM1 and TM7 are
effective for division of built-up area and water bodies. The
thresholds of TM2 and TM3 are relatively weak. Through the
above analysis, the four alternative bands are TM1, TM4, TM5
and TM7.
Figure 6. The local results of threshold segmentation in each
band, and the segmentation effect of two key regions (built-up
area and airport area) in Yan’an city
The physical characteristics on each band of TM and the
sensitivity to different ground objects should also be taken into
consideration. TM1 refers to the blue band, which can reflect
features under shallow water and distinguish soil and vegetation.
TM4 refers to near-infrared band, which can distinguish
vegetation and water easily because of the strongest reflection
area of vegetation and strong absorption area of water. As TM5
is sensitive to the moisture content of vegetation and soil, it is
suitable for detecting moisture content of vegetation and soil
humidity. TM7 is sensitive to temperature, it is suitable for
detecting high-temperature radiation sources, such as
monitoring forest fires, volcanic activities.
Considering the segmentation effect of these four thresholds on
the entire area, and the theoretical study on the classification of
ground objects by the four bands, the TM1 blue band, TM4
near-infrared band and TM5 mid-infrared band were selected to
set the threshold. The purpose of threshold segmentation is to
retain the pixels of which the value is lower than the three
thresholds. In this way, the confusion pixels of built-up land are
eliminated. NDWI is then applied to the remaining regions for
water extraction, in order to achieve accurate result. The overall
flow chart is as follows:
Experimental data
Sample modeling
Threshold estimation
Multi-spectral threshold
segmentation
NDWIWater
extraction
Water map
Figure 7. The overall flow chart of the proposed MST-NDWI
water extraction method
The International Archives of the Photogrammetry, Remote Sensing and Spatial Information Sciences, Volume XLII-3, 2018 ISPRS TC III Mid-term Symposium “Developments, Technologies and Applications in Remote Sensing”, 7–10 May, Beijing, China
This contribution has been peer-reviewed. https://doi.org/10.5194/isprs-archives-XLII-3-2557-2018 | © Authors 2018. CC BY 4.0 License.
2560
4. RESULTS
4.1 Water Extraction Maps
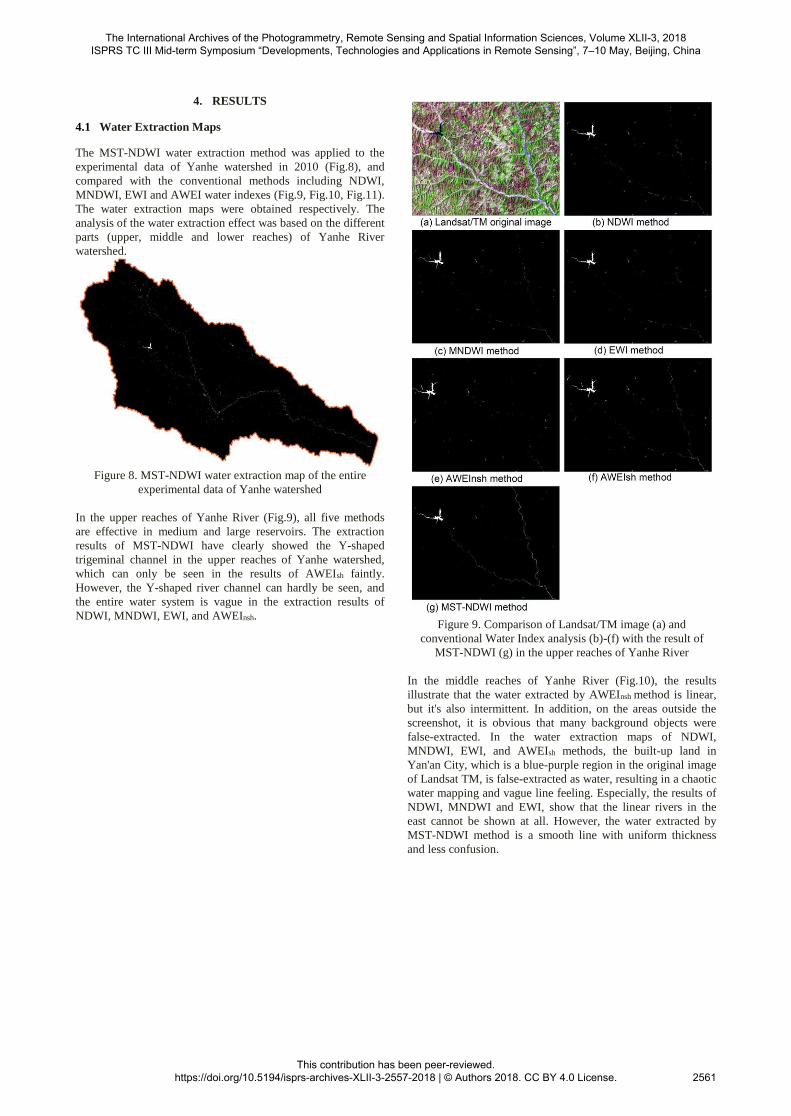
The MST-NDWI water extraction method was applied to the
experimental data of Yanhe watershed in 2010 (Fig.8), and
compared with the conventional methods including NDWI,
MNDWI, EWI and AWEI water indexes (Fig.9, Fig.10, Fig.11).
The water extraction maps were obtained respectively. The
analysis of the water extraction effect was based on the different
parts (upper, middle and lower reaches) of Yanhe River
watershed.
Figure 8. MST-NDWI water extraction map of the entire
experimental data of Yanhe watershed
In the upper reaches of Yanhe River (Fig.9), all five methods
are effective in medium and large reservoirs. The extraction
results of MST-NDWI have clearly showed the Y-shaped
trigeminal channel in the upper reaches of Yanhe watershed,
which can only be seen in the results of AWEIsh faintly.
However, the Y-shaped river channel can hardly be seen, and
the entire water system is vague in the extraction results of
NDWI, MNDWI, EWI, and AWEInsh.
Figure 9. Comparison of Landsat/TM image (a) and
conventional Water Index analysis (b)-(f) with the result of
MST-NDWI (g) in the upper reaches of Yanhe River
In the middle reaches of Yanhe River (Fig.10), the results
illustrate that the water extracted by AWEInsh method is linear,
but it's also intermittent. In addition, on the areas outside the
screenshot, it is obvious that many background objects were
false-extracted. In the water extraction maps of NDWI,
MNDWI, EWI, and AWEIsh methods, the built-up land in
Yan'an City, which is a blue-purple region in the original image
of Landsat TM, is false-extracted as water, resulting in a chaotic
water mapping and vague line feeling. Especially, the results of
NDWI, MNDWI and EWI, show that the linear rivers in the
east cannot be shown at all. However, the water extracted by
MST-NDWI method is a smooth line with uniform thickness
and less confusion.
The International Archives of the Photogrammetry, Remote Sensing and Spatial Information Sciences, Volume XLII-3, 2018 ISPRS TC III Mid-term Symposium “Developments, Technologies and Applications in Remote Sensing”, 7–10 May, Beijing, China
This contribution has been peer-reviewed. https://doi.org/10.5194/isprs-archives-XLII-3-2557-2018 | © Authors 2018. CC BY 4.0 License.
2561
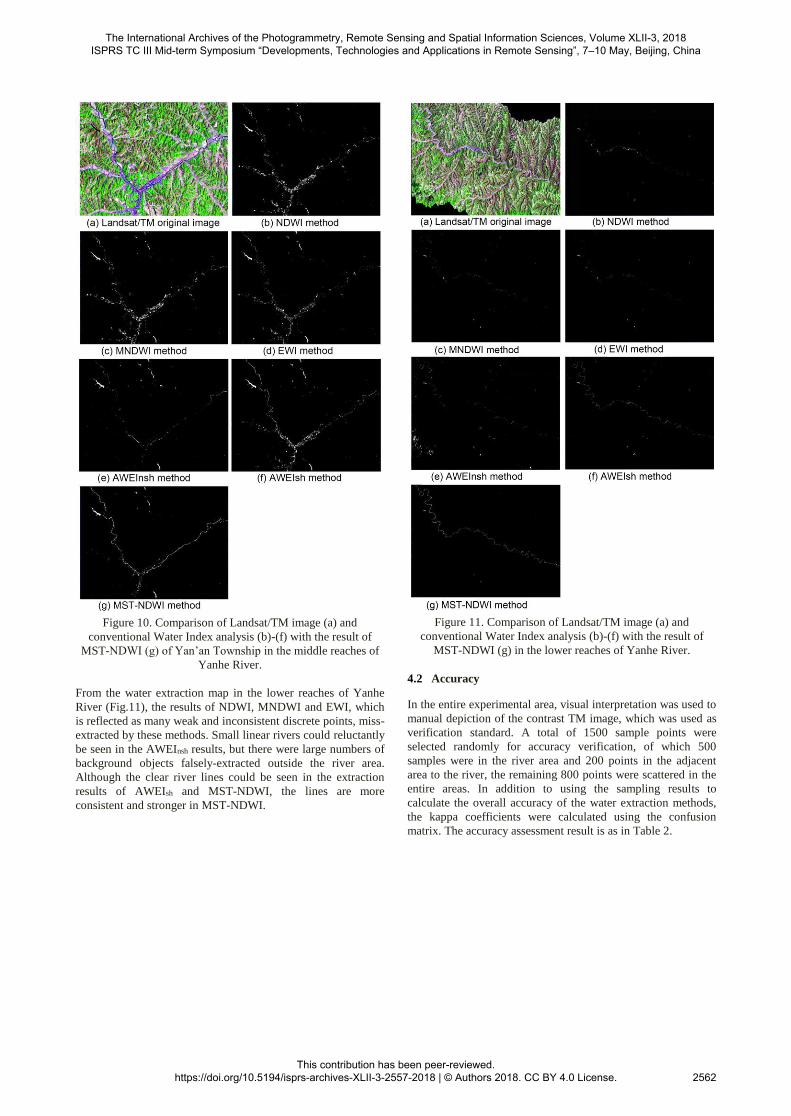
Figure 10. Comparison of Landsat/TM image (a) and
conventional Water Index analysis (b)-(f) with the result of
MST-NDWI (g) of Yan’an Township in the middle reaches of
Yanhe River.
From the water extraction map in the lower reaches of Yanhe
River (Fig.11), the results of NDWI, MNDWI and EWI, which
is reflected as many weak and inconsistent discrete points, miss-
extracted by these methods. Small linear rivers could reluctantly
be seen in the AWEInsh results, but there were large numbers of
background objects falsely-extracted outside the river area.
Although the clear river lines could be seen in the extraction
results of AWEIsh and MST-NDWI, the lines are more
consistent and stronger in MST-NDWI.
Figure 11. Comparison of Landsat/TM image (a) and
conventional Water Index analysis (b)-(f) with the result of
MST-NDWI (g) in the lower reaches of Yanhe River.
4.2 Accuracy
In the entire experimental area, visual interpretation was used to
manual depiction of the contrast TM image, which was used as
verification standard. A total of 1500 sample points were
selected randomly for accuracy verification, of which 500
samples were in the river area and 200 points in the adjacent
area to the river, the remaining 800 points were scattered in the
entire areas. In addition to using the sampling results to
calculate the overall accuracy of the water extraction methods,
the kappa coefficients were calculated using the confusion
matrix. The accuracy assessment result is as in Table 2.
The International Archives of the Photogrammetry, Remote Sensing and Spatial Information Sciences, Volume XLII-3, 2018 ISPRS TC III Mid-term Symposium “Developments, Technologies and Applications in Remote Sensing”, 7–10 May, Beijing, China
This contribution has been peer-reviewed. https://doi.org/10.5194/isprs-archives-XLII-3-2557-2018 | © Authors 2018. CC BY 4.0 License.
2562
Methods MST-
NDWI NDWI MNDWI EWI AWEInsh AWEIsh
Correct
water points 402 270 303 285 317 370
Correct
non-water
points
1012 1014 1014 1015 1010 1011
False-
extract
water points
4 2 2 1 6 5
Miss-extract
water points 82 214 181 199 167 114
Overall
accuracy
(%)
94.3 85.6 87.8 86.7 88.5 92.1
KAPPA 0.86 0.63 0.69 0.66 0.71 0.81
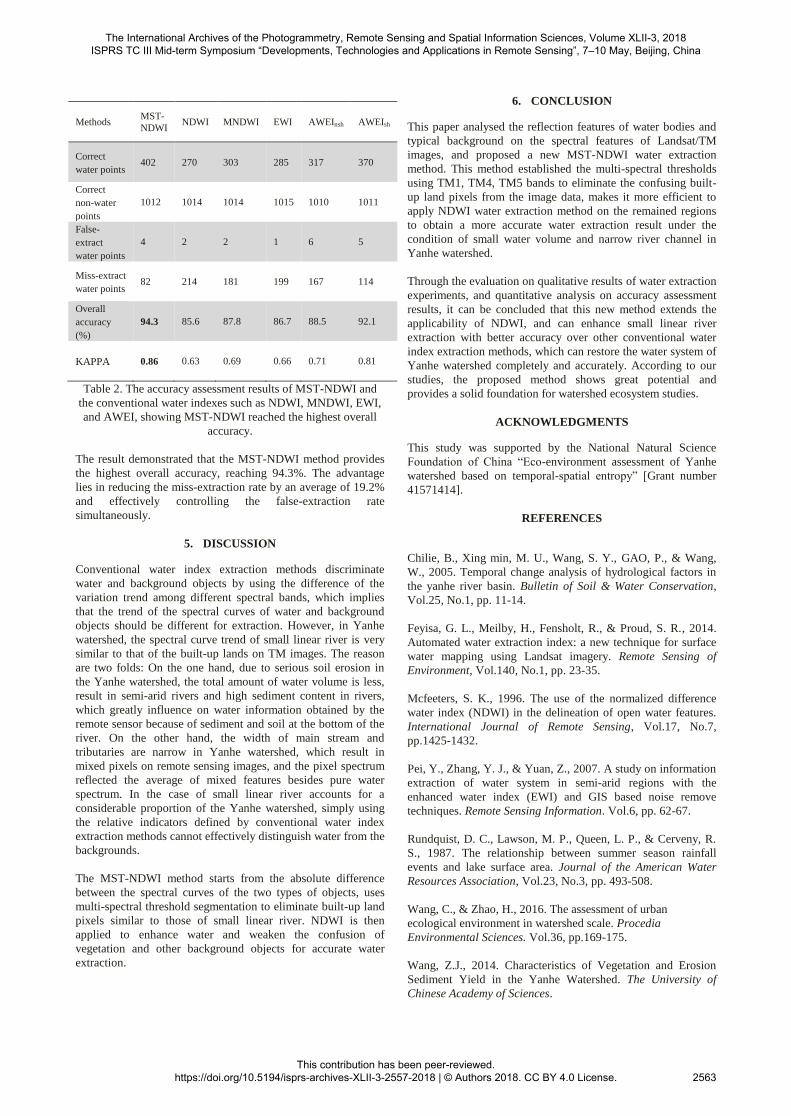
Table 2. The accuracy assessment results of MST-NDWI and
the conventional water indexes such as NDWI, MNDWI, EWI,
and AWEI, showing MST-NDWI reached the highest overall
accuracy.
The result demonstrated that the MST-NDWI method provides
the highest overall accuracy, reaching 94.3%. The advantage
lies in reducing the miss-extraction rate by an average of 19.2%
and effectively controlling the false-extraction rate
simultaneously.
5. DISCUSSION
Conventional water index extraction methods discriminate
water and background objects by using the difference of the
variation trend among different spectral bands, which implies
that the trend of the spectral curves of water and background
objects should be different for extraction. However, in Yanhe
watershed, the spectral curve trend of small linear river is very
similar to that of the built-up lands on TM images. The reason
are two folds: On the one hand, due to serious soil erosion in
the Yanhe watershed, the total amount of water volume is less,
result in semi-arid rivers and high sediment content in rivers,
which greatly influence on water information obtained by the
remote sensor because of sediment and soil at the bottom of the
river. On the other hand, the width of main stream and
tributaries are narrow in Yanhe watershed, which result in
mixed pixels on remote sensing images, and the pixel spectrum
reflected the average of mixed features besides pure water
spectrum. In the case of small linear river accounts for a
considerable proportion of the Yanhe watershed, simply using
the relative indicators defined by conventional water index
extraction methods cannot effectively distinguish water from the
backgrounds.
The MST-NDWI method starts from the absolute difference
between the spectral curves of the two types of objects, uses
multi-spectral threshold segmentation to eliminate built-up land
pixels similar to those of small linear river. NDWI is then
applied to enhance water and weaken the confusion of
vegetation and other background objects for accurate water
extraction.
6. CONCLUSION
This paper analysed the reflection features of water bodies and
typical background on the spectral features of Landsat/TM
images, and proposed a new MST-NDWI water extraction
method. This method established the multi-spectral thresholds
using TM1, TM4, TM5 bands to eliminate the confusing built-
up land pixels from the image data, makes it more efficient to
apply NDWI water extraction method on the remained regions
to obtain a more accurate water extraction result under the
condition of small water volume and narrow river channel in
Yanhe watershed.
Through the evaluation on qualitative results of water extraction
experiments, and quantitative analysis on accuracy assessment
results, it can be concluded that this new method extends the
applicability of NDWI, and can enhance small linear river
extraction with better accuracy over other conventional water
index extraction methods, which can restore the water system of
Yanhe watershed completely and accurately. According to our
studies, the proposed method shows great potential and
provides a solid foundation for watershed ecosystem studies.
ACKNOWLEDGMENTS
This study was supported by the National Natural Science
Foundation of China “Eco-environment assessment of Yanhe
watershed based on temporal-spatial entropy” [Grant number
41571414].
REFERENCES
Chilie, B., Xing min, M. U., Wang, S. Y., GAO, P., & Wang,
W., 2005. Temporal change analysis of hydrological factors in
the yanhe river basin. Bulletin of Soil & Water Conservation,
Vol.25, No.1, pp. 11-14.
Feyisa, G. L., Meilby, H., Fensholt, R., & Proud, S. R., 2014.
Automated water extraction index: a new technique for surface
water mapping using Landsat imagery. Remote Sensing of
Environment, Vol.140, No.1, pp. 23-35.
Mcfeeters, S. K., 1996. The use of the normalized difference
water index (NDWI) in the delineation of open water features.
International Journal of Remote Sensing, Vol.17, No.7,
pp.1425-1432.
Pei, Y., Zhang, Y. J., & Yuan, Z., 2007. A study on information
extraction of water system in semi-arid regions with the
enhanced water index (EWI) and GIS based noise remove
techniques. Remote Sensing Information. Vol.6, pp. 62-67.
Rundquist, D. C., Lawson, M. P., Queen, L. P., & Cerveny, R.
S., 1987. The relationship between summer season rainfall
events and lake surface area. Journal of the American Water
Resources Association, Vol.23, No.3, pp. 493-508.
Wang, C., & Zhao, H., 2016. The assessment of urban
ecological environment in watershed scale. Procedia
Environmental Sciences. Vol.36, pp.169-175.
Wang, Z.J., 2014. Characteristics of Vegetation and Erosion
Sediment Yield in the Yanhe Watershed. The University of
Chinese Academy of Sciences.
The International Archives of the Photogrammetry, Remote Sensing and Spatial Information Sciences, Volume XLII-3, 2018 ISPRS TC III Mid-term Symposium “Developments, Technologies and Applications in Remote Sensing”, 7–10 May, Beijing, China
This contribution has been peer-reviewed. https://doi.org/10.5194/isprs-archives-XLII-3-2557-2018 | © Authors 2018. CC BY 4.0 License.
2563
Xu, H., 2005. A study on information extraction of water body
with the modified normalized difference water index (MNDWI).
Journal of Remote Sensing. Vol.9, No.5, pp. 589-595.
The International Archives of the Photogrammetry, Remote Sensing and Spatial Information Sciences, Volume XLII-3, 2018 ISPRS TC III Mid-term Symposium “Developments, Technologies and Applications in Remote Sensing”, 7–10 May, Beijing, China
This contribution has been peer-reviewed. https://doi.org/10.5194/isprs-archives-XLII-3-2557-2018 | © Authors 2018. CC BY 4.0 License.
2564
Top Related