


Languages
Pages
Legal


1
A MODEL FOR THE PREDICTION OF THE PUNCHING RESISTANCE OF
STEEL FIBRE REINFORCED CONCRETE SLABS CENTRICALLY
LOADED
Bernardo N. Moraes Neto 1, Joaquim A.O. Barros 2, Guilherme S.S.A. Melo 3
1 University of Minho/University of Brasília-UnB, Dep. Civil Eng., School of Eng., Guimarães, Portugal,
2 University of Minho, ISISE, Dep. Civil Eng., School of Eng., Campus de Azurém, Guimarães, Portugal,
3 University of Brasília-UnB, Dep. Civil Eng., Campus of Darcy Ribeiro, Brasília, Brasil, [email protected].
Abstract
With the aim of contributing for the development of design guidelines capable of predicting with high
accuracy the punching resistance of steel fibre reinforced concrete (SFRC) flat slabs, a proposal is presented
in the present paper and its predictive performance is assessed by using a database that collects the
experimental results from 154 punching tests. The theoretical fundaments of this proposal are based on the
critical shear crack theory proposed by Muttoni and his co-authors. The proposal is capable of predicting the
load versus rotation of the slab, and attends to the punching failure criterion of the slab. The proposal takes
into account the recommendations of the most recent CEB-FIP Model Code for modelling the post-cracking
behaviour of SFRC. By simulating the tests composing the collected database, the good predictive
performance of the developed proposal is demonstrated.
Keywords: Reinforced concrete, Flat concrete slab, Punching, Steel fibre reinforced concrete, Analytical
models.
1. INTRODUCTION

2
In recent years the use of steel fibres to increase of the punching resistance, and mainly, to convert brittle
punching failure mode into ductile flexural failure mode of reinforced concrete (RC) flat slabs has been
explored. In fact, available research [1-3] showed that, if proper mix compositions of steel fibre reinforced
concrete (SFRC) are used, steel fibres can be suitable shear reinforcement for RC flat slabs, by improving the
load carrying capacity and the energy absorption performance of the column-slab connection. These benefits
are derived from the fibre reinforcement mechanisms provided by fibres bridging the micro-cracks that arrest
the crack propagation, favouring the occurrence of large number of cracks of small width.
The resisting tensile stresses supported by the steel fibres in a cracked concrete have also the favourable
effect of delaying the yield initiation of longitudinal and transversal conventional steel reinforcement, which
contributes to increase the ultimate load carrying capacity of RC structures or to a partial suppression of
conventional reinforcements.
By testing prototypes of real [4, 5] or smaller scale [6], the use of steel fibres has been investigated as,
practically, the unique reinforcement of the flat slabs for residential and commercial buildings. This type of
slabs, generally designated by Elevated Steel Fibre Reinforced Concrete (ESFRC) slabs, is reinforced with a
steel fibre volume percentage, Vf, of about 1%, and it includes a minimum continuity bars, also referred as
anti-progressive collapse bars, placed in the bottom of the slab in the alignment of the columns [7]. In spite
of the promising results obtained in these tests, reliable design models capable of predicting, with high
accuracy, the load carrying capacity, the deformational response and the failure modes possible to occur in
ESFRC slabs are not yet available, which is a considerable resistance for a comprehensive acceptation of this
structural concept that apparently has several technical and economic advantages. Due to the brittle character
of punching failure mode, the existence of a design model capable of predicting correctly the punching
resistance and the deformation capacity of SFRC flat slabs is of paramount importance in this context. Some
analytical models were proposed for the evaluation of the punching resistance of SFRC slabs, some of them
with an eminent empirical nature, but the predictive performance of these models was, in general, limited to
the simulation of a relatively small number of tests carried out by the authors [8-11]. In the present work a
database collecting 154 punching tests with SFRC slabs was developed to appraise the predictive
performance of these models and the one proposed by the authors of the present work. This model is based
on the Critical Shear Crack Theory (CSCT) proposed by Muttoni [12], being possible to determine the

3
punching resistance of SFRC slab by intersecting a curve corresponding to the load versus rotation (V-ψ) of
the column-slab connection, with a curve that defines the failure criterion. This model integrates the
contribution of fibre reinforcement mechanisms using the recommendations of the most recent CEB-FIP
Model Code 2010 [13]. The present paper describes the proposed formulation and compares its predictive
performance using the aforementioned database.
2. LOAD VERSUS ROTATION APPROACH
2.1. Refined formulation
The load versus rotation proposed in the present work is based on the recommendations of Muttoni [12] that
are applied to a column-slab connection assuming axisymmetric conditions for this structural component
(Figure 1). The crack pattern of the slab at ultimate loading conditions can be assumed as divided into radial
segments (Figure 1a). Each radial segment is delimited by a tangential crack formed close to the column, by
two radial cracks, and by the edge considered as a free boarder of the slab.
According to some authors [14-16], it is admissible to assume that these radial segments rotate as free bodies
in turn of the point localized at the bottom of the punching failure surface (Figure 1b). Therefore, it is
accepted that a radial segment has constant rotation ψ between the critical shear crack and its edge.
According to Muttoni and Schwartz [17], in the column/slab connection the shear force V is transmitted
through a compression strut formed at the external region to the punching failure surface (Figure 1b). In
Figure 1b the variables rc, r0, rq and rs represent, respectively, the radius of column’s cross section, the
distance to the axis of the column of the punching failure surface (r0=r c+d/2, where d is the internal arm of
the longitudinal reinforcement), the distance of the circumferential loading line and the radius of the slab.
The stresses and the corresponding internal forces formed in the radial segment are indicated in Figure 2,
where Fcr and Fsr represent the resultant force in the concrete in compression and in the reinforcement in
tension, both in the radial direction, while Fct and Fst are the resultant force in the concrete in compression
and in the reinforcement in tension, both in the tangential direction. The stress components σf,r and σf,t
represent the post cracking tensile strength of SFRC in radial and tangential direction, respectively. Finally,
V and VR represent the acting and the resisting shear force, respectively. The force components Fcr and Fsr,
and the stresses σf,r generate the radial bending moment mr, while force components Fct and Fst, and the

4
stresses σf,t produce the tangential bending moment mt (Figures 2a and 2b). For the evaluation of the mr, the
vertical component of the resisting force due to dowel effect provided by the longitudinal reinforcement was
neglected, as well as the vertical component of the resultant stresses due to fibre reinforcement mechanisms.
The representation shown in Figure 2c corresponds to a column/slab connection assumed in an axisymmetric
conditions. When the slab has square geometry (Figure 3a), it can be converted into an equivalent circular
slab (Figure 3b) by adopting the following transformations [18]:
πe
r eq,c⋅= 2
(1)
,,
,
for circular edge conditions
for rectangular edge conditionsq c
q eqq q
br
b
=
(2)
( ) ( )[ ]eeLr eq,s +−⋅−⋅⋅= 1222
π (3)
where e is the edge of the cross section of the column, and L is the edge of the slab, both assumed of square
geometry.
According to Guandalini [19] and Muttoni [12], the load versus rotation of a slab in axisymmetric structural
conditions can be directly obtained from the quadrilinear (4L) or bilinear (2L) moment-curvature diagram
(m-χ) represented in Figure 4a. In this figure, the mcr and mR represents, respectively, the bending moment at
crack initiation and the resisting bending moment (plastic bending moment) of the slab’s cross section. The
E·I0 and E·I1 represent the flexural stiffness of the slab’s cross section before and after crack initiation,
respectively. The rcr, r1 and ry is the distance from the axis of the column of the cross section where the
curvature χcr, χ1 and χy is installed, respectively. In these variables, the subscripts, cr, 1, and y represent the
crack initiation, the stabilization of the cracking process and the yield initiation of the longitudinal tensile
reinforcement, respectively.
The equilibrium of bending moments in O’ (Figure 2c) yields:
∑ ='O
M 0 (4)
( ) ( ) ( ) ( ) drrmrmrr
Vsr
rtr
cq ⋅+⋅=⋅
−⋅ ∫
0
02ψ
πψ (5)

5
where mt is dependent of the distance r, which has justified the transformation of the 4L m-χ diagram (Figure
4a) into the m-r diagram depicted in Figure 4b. Adopting the following assumption:
( )r
ψψχ = (6)
the transformation of m(ψ) into m(r) is executed by performing a simple procedure of changing the variable:
( )
( ) ( )( )
( )[ ] ( )( )
>≤<+⋅⋅≤<
≤⋅⋅
=
yR
yts
crcr
cr
ifm
ifIE
ifm
ifIE
m
χψχχψχχχψχχψχχ
χψχψχ
ψ11
1
0
(7)
( )
≤<⋅⋅
≤<
≤<
+⋅⋅
≤<
=
scr
crcr
yts
yR
rrrifr
IE
rrrifm
rrrifr
IE
rrrifm
rm
ψ
χψ
0
1
11
0
(8)
Adopting the diagram of Figure 4b and considering Eq. (8), the integral of Eq. (5) can be decomposed into:
( ) drr
IEdrmdrIEdrr
IEdrmdrrms
cr
cr
yy
ys r
r
r
rcr
r
rts
r
r
r
rR
r
rt ⋅⋅⋅+⋅+⋅⋅⋅+⋅⋅⋅+⋅=⋅ ∫∫∫∫∫∫
ψχψ011
1
11
00
(9)
Introducing Eq. (9) into (5) and solving the integrals yields:
( ) ( )( ) ( ) ( )( ) ( ) ( )
( )( ) ( )( ) ( ) ( )( )
−⋅
+−⋅⋅⋅+−⋅⋅⋅+−⋅+−⋅⋅⋅+⋅
⋅−⋅=
0
1111
1002
rrm
rrIErlnrlnIE
rrmrlnrlnIErm
rrV
yR
ytsy
crcrcrsr
cq ψ
ψψχψψψψψψψψ
πψ (10)
which is the equation that establishes the relationship between the rotation and the load carrying capacity of
the slab. In this equation mr(ψ) is the radial bending moment for the rotation ψ, evaluated at r=r0, and the
mathematical operator ‹x›=x if x≥0 and ‹x›=0 if x<0. To evaluate the plastic bending moment, mR, the
recommendations of CEB-FIP Model Code 2010 [13] for the simulation of the contribution of fibre
reinforcement are adopted in the present work (Figure 5). A detailed description on the evaluation of mR is
available elsewhere [18]. The bending moment at crack initiation, mcr, is obtained from the following
equation:

6
6
2hfm ct
cr⋅
= (11)
where fct is the concrete tensile strength that can be estimated according to the recommendations of CEB-FIP
Model Code 2010.
The rcr(ψ), r1(ψ) and ry(ψ) in Eq. (10) is the position, from the axis of the column, of the section of the slab
that develops the curvature χcr(ψ), χ1(ψ) and χy(ψ), respectively. These curvatures can be determined from the
following relationships:
( ) scr
crcr
cr rrIE
m≤=⇒
⋅=
χψψχ
0 (12)
( ) stscr rrIE
m ≤=⇒−⋅
=1
11
1 χψψχχ (13)
( ) sy
ytsR
y rrIE
m ≤=⇒−⋅
=χψψχχ
1 (14)
For the evaluation of the uncracked flexural stiffness, E·I0, the contribution of the reinforcement is neglected:
12
3
0h
EIE ⋅=⋅ (15)
The evaluation of the flexural stiffness of SFRC cracked cross section, E·I1, was executed following the
procedures adopted for RC members [18], and assuming a stabilized cracking phase:
⋅−⋅
−⋅⋅⋅⋅=⋅d
x
d
xdEIE s 3
1131 βρ (16)
The contribution of fibre reinforcement for the E·I1 is only indirectly taken in the evaluation of the neutral
axis, x, Figure 5 (η and λ parameters are evaluated according to [13], and fFtu is introduced in next section).
In Eq. (16) β is a factor intending to take into account the arrangement of the reinforcement, since the
deduction of Eq. (10) was supported on the principle of axisymmetric structural conditions, but the majority
of the built and tested RC flat slabs have orthogonal arrangement of the reinforcement [19]. According to
Muttoni [12], β=0.6 yields to satisfactory results. The evaluation of the position of the neutral axis, x, was
made according to the recommendations of CEB-FIP Model Code 2010 [13], see Figure 5.

7
The χts factor in Eq. (8) simulates the post-cracking tensile strength of cracked concrete (tension stiffening
effect) that according to Muttoni [12] it can be determined from the following equation:
150
6
1
IE
m.
hE
f cr
s
ctts ⋅
⋅≅⋅
⋅⋅⋅
=βρ
χ (17)
This means that the fibre reinforcement was not taken into account for the evaluation of χts. Enhancements in
this respect can be adopted by using the closed form solution proposed by Taheri et al. [20] for determining
the moment-curvature relationship of FRC of strain softening or strain hardening character, but this approach
increases significantly the complexity of the model aimed to be proposed in the present work.
2.2. Simplified formulation
Instead of using the quadrilinear (4L) m-χ diagram to derive the load versus rotation relationship, in the
present section the simpler bilinear (2L) m-χ diagram (or m-r) is adopted, since it provides a formulation
more suitable for design purposes. To derive the load versus rotation relationship supported on the 2L m-r
diagram, it is necessary to assume the slab decomposed in two regions: elastic (ry<r 0) and elasto-plastic
(r0<r y<r s), as represented in Figure 6b.
Establishing the bending moment equilibrium in O’ point, and considering the elastic hypothesis (ry<r 0), it is
obtained Eq. (5). In this equation:
( ) 00
10 rr
IErmr ⋅⋅⋅=⋅ ψψ (18)
and
( ) ( )[ ]
⋅⋅⋅=⋅⋅⋅=⋅⋅=⋅⋅⋅=⋅ ∫∫∫
01111
0
000r
rlnIErlnIE
r
drIEdr
rIEdrrm sr
r
r
r
r
r
r
rt
ssss
ψψψψ (19)
Replacing Eqs. (18) and (19) into Eq. (5) it is obtained:
( ) ( )
+⋅⋅⋅⋅
−⋅=
01 1
2
r
rlnIE
rrV s
cqψπψ for ry ≤ r0 (elastic regime) (20)
Analogously, for the elasto-plastic case, r0<r y ≤ rs, the following equilibrium equation is derived:

8
( ) ( ) ( ) drrmrmrr
Vsr
rtR
cq ⋅+⋅=⋅−
⋅ ∫0
02 πψ (21)
where
( ) ( )
⋅⋅⋅+−⋅=⋅⋅⋅+⋅=⋅ ∫∫∫
y
syR
r
r
r
rR
r
rt r
rlnIErrmdr
rIEdrmdrrm
s
y
ys
ψψ101
00
(22)
Replacing Eq. (22) into Eq. (21) it is obtained:
( ) ( )
+⋅⋅⋅⋅
−⋅=
y
s
cq r
rlnIE
rrV 1
21 ψπψ for r0<r y<r s (elasto-plastic regime) (23)
Based on experimental results [3, 21, 22], it was verified that the slab’s rotation is proportional to (V/Vflex)3/2,
where V and Vflex is, respectively, the actuating shear force and the load corresponding to the flexural failure
of the slab:
23 /
flexV
V
ψα (24)
To obtain Vflex the equilibrium Eq. (21) is considered with:
( )0
0
rrmdrm sR
r
rR
s
−⋅=⋅∫ (25)
and assuming ry=r s, see Figure 6b, results:
( )cq
sRflex rr
rmV
−⋅⋅⋅= π2 for ry=r s (flexural failure load) (26)
Combining Eqs. (23) and (26), and assuming ry=0.35·rs that was determined from experimental evidence
[18], the following relationship between load and rotation was derived [18]:
⋅
⋅⋅⋅=
flex
sR
V
V
IE
rm.
150ψ (27)
Eq. (24) can get the following configuration

9
23 /
flexV
V
⋅∆=ψ (28)
where ∆ is the constant relating ψ and (V/Vflex)3/2, whose value was determined by dimensional analysis [18].
In this analysis the same parameters of Eq. (27) were considered, mR, rs, E·I1, having resulted the following
equation [18]:
23
1
/
flex
sR
V
V
IE
rm
⋅
⋅⋅⋅∆=ψ (29)
where ∆ =0.65 for regular concrete and ∆ =1.625 for concrete of lightweight aggregates. For slabs in
axisymmetric structural conditions, Vflex is obtained from Eq. (26), while for square slabs the yield line theory
leads to: Vflex=8·mR. Eq. (29) is the simplified expression for the load versus rotation that is recommended to
be used in the design practice.
If the contribution of the reinforcement in compression is neglected, and concrete crushing is assumed to
occur simultaneously with the yield of the longitudinal reinforcement, Eq. (29) gets the following
configuration, whose deduction is described in detail elsewhere [18]:
( ) ( )[ ] 2341
4
/
flex
uFtusy
s
s
V
Vd/'cwff
Ed
r
⋅
⋅+⋅+⋅⋅
⋅⋅∆=
ρψ (30)
where
( ) ( ) 0205052 13 ≥⋅+⋅−⋅−= RRFtsu
FtsuFtu f.f.f.
wfwf ; 1450 RFts f.f ⋅= (31)
80
1 57
.
f
ffR d
lV.f
⋅⋅= (32)
70
3 06
.
f
ffR d
lV.f
⋅⋅= (33)
In Eq. (30) ∆ =0.358 for regular concrete and ∆ =0.894 for concrete of lightweight aggregates, and ρ, fsy and
Es represents, respectively, the reinforcement ratio, the yield stress and the modulus of elasticity of the

10
flexural reinforcement. The parameter c’ in Eq. (30) is the distance of the flexural reinforcement to the
concrete tensile surface (∆·d in Figure 5).
In Eqs. (30) and (31), fFtu(wu) is the post-cracking residual strength of SFRC at ultimate limit conditions,
where wu is the maximum acceptable crack width imposed by design conditions. According to the CEB-FIP
Model Code 2010 [13], fFtu(wu) should be evaluated for wu=1.5 mm. In Eq. (31) fR1 and fR3 are the residual
flexural tensile strength parameters, whose evaluation is carried out according to the recommendations of
CEB-FIP Model Code 2010, by performing three point notched beam bending tests [13]. In Eqs. (32) and
(33) Vf and l f/df and the fibre volume percentage and fibre aspect ratio (quotient between fibre length, l f, and
fibre diameter, df).
2.3. Prediction of the residual flexural tensile strength parameters of SFRC by using a database
As already mentioned, the predictive performance of the proposed models will be assessed by comparing the
estimated results with those available in a database (DB) that collects 154 punching tests. In these models,
the contribution of fibre reinforcement is simulated by using the concept of residual flexural tensile strength
parameters, fRi, whose values, in the majority of the works composing the DB, are not available. Therefore, to
apply the proposed models to the tests composing the DB, another database was built by collecting results
(fRi) of the characterization of the post-cracking flexural behaviour of SFRC according to the
recommendations of CEB-FIP Model Code 2010. Since the fibre volume percentage, Vf, and fibre aspect
ratio, l f/df, are practically the unique common information available in the works forming the DB of the
punching tests, the statistical analysis performed with the collected data for the characterization of the post-
cracking behaviour of SFRC was governed by the criterion of deriving equations for the fRi dependent on the
Vf and l f/df. The authors are aware that this is a quite simple approach to simulate the fibre reinforcement
mechanisms, since other variables like the fibre-matrix bond strength, fibre inclination and fibre embedment
length influence the values of fRi, but this information is not available in those works. Therefore, a relatively
large scatter of results is naturally expected for the relationships fRi –(Vf, l f/df), but actually this is the unique
possibility of considering the fibre reinforcement mechanisms according to the CEB-FIP Model Code 2010
for the prediction of the punching failure load of the slabs collected in the DB by applying the proposed

11
models. The authors are doing an effort to increase this database and, therefore, deriving more reliable fRi –
(Vf, l f/df) relationships. Eqs. (32) and (33) were obtained according to the described methodology [18].
In a design context of a SFRSC slab, three point notched SFRSC beam bending tests should be executed
according to the recommendations of CEB-FIP Model Code 2010 in order to obtain the fRi of the SFRSC, and
these values should be directly used in the proposed model for the evaluation of the punching failure load of
a SFRSC slab supported on columns.
3. FAILURE CRITERION
3.1. Fundamental formulation
In the present approach it is assumed that the punching resistance of a RC slab can be estimated according to
the critical section concept, e.g., the nominal shear stress, νR, is defined as the ratio between the punching
failure load (Vu) and an area considered as representative of the punching failure surface (b0·d):
db
VuR ⋅
=0
ν (34)
where b0 represents the punching critical perimeter at a distance α·d from the external surface of the column
(Figure 7). It is also assumed that the contribution of fibre reinforcement can be integrated in Eq. (34) by
using a kf factor:
1
1
0a
f
uR
kdb
V ⋅⋅
=ν (35)
where this factor simulates the influence of the most important steel fibre reinforcement mechanism, namely:
fibre volume percentage (Vf), fibre aspect ratio (l f/df) and fibre-matrix bond strength (τb). The a1 factor aims
to simulate the degree of influence of these fibre characteristics on the punching resistance of SFRC slab. In
order to integrate these new aspects in the Critical Shear Crack Theory (CSCT) proposed by Muttoni [12],
the 1afk was included in the equation of the CSCT, resulting:
( )00
1d,wf
kdb
Vca
f
u ⋅=⋅⋅
ν (36)

12
where f(w,d0) is a function dependent on crack width, w, and on the roughness of the punching failure surface
that was assumed correlated to the diameter of the aggregates, d0. If the proposal of Muttoni and Schwartz
[17] for the determination of w from the rotation of the slab (ψ·d) is now considered, yields:
daakdb
V ca
f
u
⋅⋅+=
⋅⋅ ψν
3201
(37)
According to Muttoni [12], and in agreement with the results from Walraven [24], and Vecchio and Collins
[25], the contribution of the aggregate interlock for the concrete shear resistance can be estimated by
multiplying ψ·d by kdg, where kdg=1/(dg0+dg), being dg0=16 mm the reference diameter, and dg the maximum
diameter of the aggregates. In concrete of lightweight aggregates it is assumed dg=0, since the fracture
progresses through the aggregates resulting a relatively smooth surface. Therefore, the following equation
governs the punching failure criterion of SFRC slabs:
dg
ca
f
u
kdaakdb
V
⋅⋅⋅+=
⋅⋅ ψν
3201
(38)
being νc the concrete nominal shear strength [26], which will be determined in the next section, as well as the
ai (i=1 to 3) and kf parameters.
3.2. Proposal
The values of ai parameters that define Eq. (38) were determined by fitting as much as possible the Vu-ψ
response recorded in experimental punching tests with RC slabs. According to ACI 318 [26], the parameter
b0, which defines the perimeter of the punching failure surface, is localized at a distance d/2 from the
external surface of the column. This parameter and νc are obtained from the following equations:
deb ⋅+⋅= π40 (for column of square cross section) (39)
cc f. ⋅= 330ν (40)
being e the edge of the column’s cross section. For the reasons indicated at the end of the previous chapter,
the kf factor was assumed dependent on the Vf and l f/df fibre parameters:

13
f
fff d
lVk ⋅= (41)
To determine the ai parameters, the value of a1 was varied between 0 and 1 with small increments of a1, and
for each a1, the values of a2 and a3 that best fit the experimental results (smallest R2) were obtained. A
preliminary parametric study in this context has indicated that values of a1 outside of the aforementioned
interval conduct to worst predictions of the experimental results. The following optimized ai parameters were
those corresponding to the smallest R2 of the performed analysis: a1=1/3, a2=1.33, a3=1.82. Replacing these
values in Eq. (38) results:
dg/
f
ffc
u
kd..
d
lVfdb
V
⋅⋅⋅+=
⋅⋅⋅⋅
ψ821331
131
0
(42)
3.3. Assessment of the predictive performance of the proposal
In this section the predictive performance of equation (42), as representative of the punching failure criterion
of SFRC flat slabs, is assessed. For this purpose, the λ=νexp/νthe parameter, comparing the experimental (νexp)
and the theoretical (νthe) values, is determined. The values of λ are evaluated according to a modified version
of the Demerit Points Classification (DPC) proposed by Collins [27], where a penalty (PEN) is assigned to
each range of λ parameter according to Table 1, and the total of penalties determines the performance of the
proposal. The theoretical results were obtained from the following equation:
dgthe kd ⋅⋅⋅+
=ψ
υ82.133.1
1 (43)
while the experimental results were determined from the following equation:
3/1
0
exp
⋅⋅⋅⋅
=
f
ffc
u
d
lVfdb
Vυ (44)
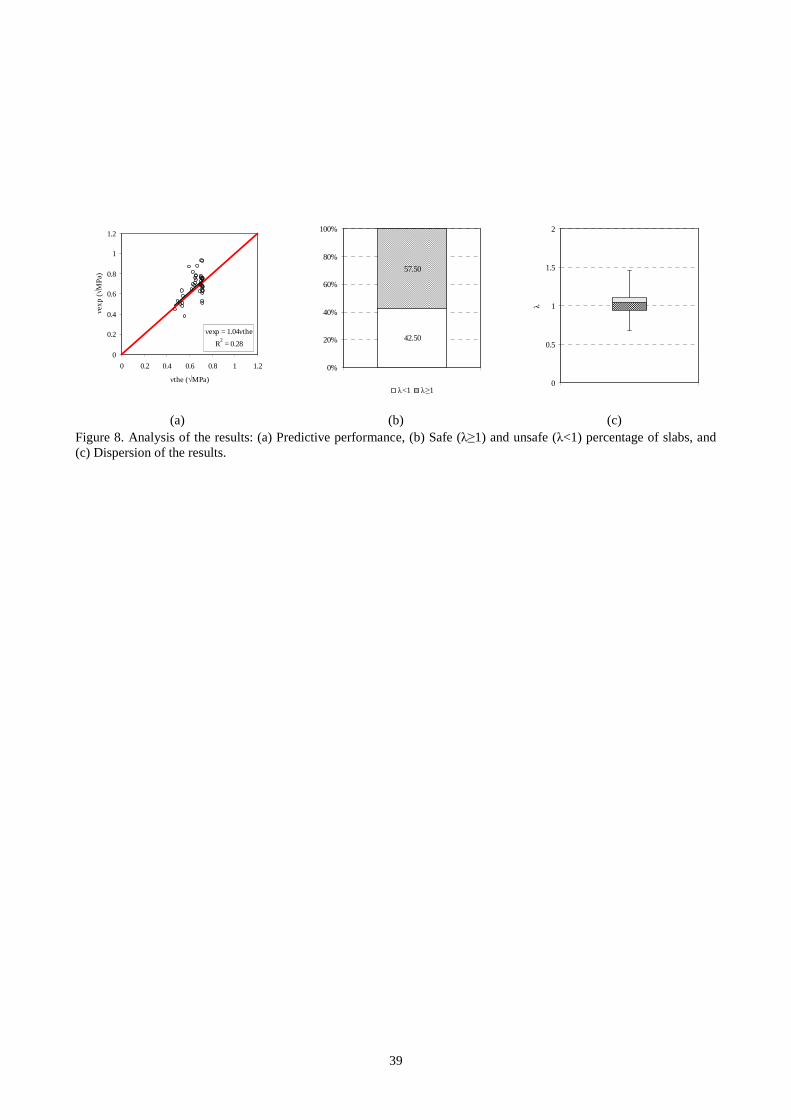
Figure 8a shows the predictive performance of the proposal, while Figures 8b and 8c present the safe (λ≥1)
and unsafe (λ<1) results (in percentage) and a “box and whiskers” plot of the λ parameter, respectively. The
box plot diagram graphically depicts the statistical five-number summary, consisting of the minimum and

14
maximum values, and the lower (Q1), median (Q2) and upper (Q3) quartiles. The obtained results are
included in Table 2, where the number of samples, the penalty for each range of λ parameter, and the total of
penalties (Total PEN) are indicated, as well as the average (AVG), the standard deviation (STD) and the
coefficient of variation (COV). The number of samples was limited to 40 because, in the majority of the
slabs composing the DB the ultimate deflection was not provided, whose value if fundamental for the
evaluation of the ultimate rotation of the slab to be introduced in Eq. (42). Figure 8 shows that R2 of the νexp-
νthe is quite small. However, Table 2 reveals that the average of λ is close to the unit value, and its COV is
relatively low. Therefore, the assumptions subjacent to this proposal for representing the punching failure
criterion of SFRC flat slabs are acceptable:
+=
⋅=
⋅+⋅=
⋅⋅⋅+=
⋅⋅⋅
ggdg
f
fff
dg/
fc
u
ddk
d
lVk
) sectioncross squareof column for( deb
kd..kfdb
V
0
0
310 1
4
821331
1
π
ψ
(45)
This equation, in spite of describing satisfactorily the punching failure criterion for SFRC flat slabs, has the
inconvenient of do not being generalized for the cases of plain concrete (Vf=0). To overcome this deficiency,
the parameters λf and µf are introduced into Eq. (45) resulting:
[ ] dgf/
ffc
u
kd.kfdb
V
⋅⋅⋅⋅+=
+⋅⋅⋅ ψµλ 20331
131
0
(46)
where
=
≠=
01
00
f
ff V fi
V fi λ (47)
=
≠=
01
01
f
ff V fi
V fi /11µ (48)
When Vf=0, Eq. (46) becomes the one proposed by Muttoni [12] for RC slabs:
dgdgc
u
kd
/
kd.fdb
V
⋅⋅⋅+=
⋅⋅⋅+=
⋅⋅ ψψ 151
43
20331
1
0
(49)

15
Taking experimental results found in the bibliography, Figure 9 evidences that Eq. (46) assures a satisfactory
predictive performance for the punching failure criterion. In this figure the ν symbol of the ordinate axis
represents the left term of Eq. (46).
4. APPRAISAL OF THE PREDICTIVE PERFORMANCE OF THE PROPOSALS
4.1. Database (DB)
A database (DB) composed by 154 slabs submitted to punching test configuration was built, 137 of them
were reinforced with longitudinal steel bars/grids in order to avoid the occurrence of flexural failure mode.
None of these slabs has conventional shear/punching reinforcement. However, 105 slabs composing the DB
were made by SFRC. In terms of concrete average compressive strength, fcm, the DB is composed of slabs
with fcm in the range of 14 to 93 MPa, so a quite high interval exists for a parameter that has a relevant impact
on the punching resistance of concrete slabs. For the slabs that were flexurally reinforced with steel bars, the
internal arm of this reinforcement (d, Figure 1) has varied from 13 mm to 180 mm, while the reinforcement
ratio (ρ) is in the interval 0.4 to 2.75%. In the SFRC slabs, “hooked”, “ twisted”, “ crimped”, “ corrugated”,
“paddle” and “Japanese” type of fibres were used, with an aspect-ratio that varied from 20 to 100, and in a
volume percentage ≤2%. In some of the SFRC slabs (6 specimens), the SFRC was only applied in a region
around the loaded area (that represents the position of the column), considered the region where punching
failure could occur. In terms of loading conditions, all the slabs of the DB were submitted to a load
distributed in a certain area of the slab without transferring any bending moments from the loading device to
the slab. In the tests of the DB, the columns were simulated by a RC element monolithically connected to the
slab, or applying steel plates, or even introducing a semi-spherical device in between the piston of the
actuator and the tested slab. The cross section of the columns and steel plates was square or circular. To
avoid results that can compromise the reliability of this statistical analysis, the slabs with a thickness lower
than 80 mm were discarded, since an eventual influence of size effect can have a detrimental consequence on
this study. Furthermore, the slabs where the concrete compressive strength has decreased more than 15% in
consequence of the addition of fibres were also neglected, since this decrease reveals that the SFRC mix
composition was not properly designed.

16
4.2. General statistical analysis procedures
The performance of the proposals for the prediction of the punching resistance of SFRC slabs is appraised
using the collected data registered in the DB. For each proposal, the obtained values of Vthe are compared
with Vexp, and a λ factor corresponding to the Vexp/Vthe ratio is evaluated. The values of λ were classified
according to the modified version of the DPC (Table 1).
4.3. Results
The performance of the proposals corresponding to Eqs. (10), (29) and (30) for the prediction of the load
versus rotation, with Eq. (46) that represents the failure criterion, is presented in Figure 10, where
experimental and theoretical results are compared. In this figure and in the following analyses, the proposal
corresponding to Eq. (10), (29) and (30) is designated as Refined, Simple and Balanced, respectively. The ν
symbol of the ordinate axis represents the left term of Eq. (46). Figure 10 shows that the three approaches
have satisfactory predictive performance in terms of load versus rotation, and when conjugated with the
proposed failure criteria can estimate with good accuracy the punching failure load. The performance of the
three proposals for the prediction of the punching failure load of the slabs composing the DB is assessed in
Figures 11a, 11b and 11c, by comparing Vexp and Vthe. Figure 11d shows the minimum and maximum values,
and the lower (Q1), median (Q2) and upper (Q3) quartiles of the λ=Vexp/Vthe values predicted by the three
proposals. Table 3 includes the analysis of λ according to the modified version of DPC (see also Table 1).
Figure 11 and Table 3 reveal that the proposals corresponding to Eqs. (10), (29) and (30) with the failure
criteria represented by Eq. (46) predict with good accuracy the results registered experimentally, with a
relatively small dispersion of results (the COV varied between 12% and 13%), being the Refined model the
one that conducts to the higher R2, smallest number of total penalties, and largest number of samples with
proper safety margin.
5. COMPARISON TO THE PREDICTIVE PERFORMANCE OF OTHER MODELS

17
In this section the predictive performance of the developed model is compared to the one of the formulations
proposed by: Narayanan and Darwish [8], Shaaban and Gesund [29], Harajli et al. [9], Holanda [22], Choi et
al. [30], Muttoni and Ruiz [10] and Higashiyama et al. [31]. A detailed description of these formulations can
be found elsewhere [32], but a resume is in the appendix. Like in the previous sections, the predictive
performance is appraised in terms of the λ=Vexp/Vthe factor and considering the modified version of DPC
(Table 1). The obtained results are indicated in Table 4 and represented in Figure 12. Each of the models in
comparison is designated by MODi (i=1 to 7) and its corresponding reference is indicated in the footnote of
Table 4 and in the caption of Figure 12. From the obtained results it can be concluded that the model
proposed in the present work, regardless of the three levels sophistication, together with the model of
Muttoni and Ruiz [10], are those that assure the highest performance for the prediction of the punching
failure load of SFRC flat slabs. In terms of the modified version of DPC, Table 4 shows that the proposed
Refined model provides the lowest total penalties, with the highest number of predictions of λ in the intervals
[0.85-1.15[ and [1.15-2.0] (37+11), to which correspond the lowest penalty values, being consequently the
more reliable model.
6. CONCLUSIONS
In the present work three proposals were described for the prediction of the punching failure of steel fibre
reinforced concrete (SFRC) flat slabs submitted to centrically loading conditions. The proposals are based on
the critical shear crack theory, and only diverge on the level of sophistication adopted to define the load
versus rotation for the slabs. The punching failure criterion adopted in these proposals is based on the
experimental results collected in a database and on the recommendations of ACI 318. The database is
composed of 154 experimental punching tests with flat slabs. This database was also used to appraise the
predictive performance of developed proposals, by performing a statistical analysis of the λ=Vexp/Vthe, where
Vexp and Vthe is the punching failure load registered experimentally and predicted analytically, respectively.
The predictive performance of the model was also assessed by applying a modified version of the Demerit
Points Classification. All the three versions of the proposal predict satisfactorily the load versus rotation of
the slabs of the database, and estimates λ values in the interval 1.0 to 1.04 with a coefficient of variation less

18
than 13%, which is relatively small considering the complexity of the punching phenomenon. By comparing
the performance of the developed proposal to the another seven models for the prediction of the Vexp, it was
also verified that the more refined version of the proposed model assured the highest predictive performance
with the largest number of predictions in the intervals considered proper for safety design.
7. ACKNOWLEDGEMENTS
The study presented in this paper is a part of the research project titled “SlabSys-HFRC - Flat slabs for multi-
storey buildings using hybrid reinforced self-compacting concrete: an innovative structural system”, with
reference number of PTDC/ECM/120394/2010. The first author acknowledges the support provided by the
CAPES and CNPq grant, and the grant provided by the project SlabSys.
REFERENCES
[1] Tan, K-H.; Paramasivam, P. Punching shear strength of steel fiber reinforced concrete slabs. Journal of
Materials in Civil Engineering, 6(2), 240-253, May 1994.
[2] Prisco, M.; Felicetti, R. Some results on punching shear in plain and fibre-reinforced micro-concrete
slabs. Magazine of Concrete Research, 49(180), 201-219, September 1997.
[3] Nguyen-Minh, L.; Rovňák M.; Tran-quoc T.; Nguyen-Kim, K. Punching shear resistance of steel fiber
reinforced concrete flat slabs, “Punching shear resistance of steel fiber reinforced concrete flat slabs”,
Proceedings of The Twelfth East Asia-Pacific Conference on Structural Engineering and Construction
(EASEC-12), Hong Kong Special Administrative Region, China, 535-536 (with CD-rom), 24-26th January
2011.
[4] Destrée, X., Free suspended elevated slabs of steel fibre reinforced concrete: full scale test results and
design, 7th International Symposium of Fiber-Reinforced Concrete: Design and Applications BEFIB 2008,
Editor: R. Gettu, pp. 941-950, Sept. 2008.
[5] Destrée, X.; Mandl, J. Steel fibre only reinforced concrete in free suspended elevated slabs: Case studies,
design assisted by testing route, comparison to the latest SFRC standard documents. Tailor Made Concrete
Structures – Walraven & Stoelhorst (eds), Taylor & Francis Group, 437-443, London 2008.

19
[6] Barros, J.A.O.; Salehian, H.; Pires, N.M.M.A; Gonçalves, D.M.F. Design and testing elevated steel fibre
reinforced self-compacting concrete slabs. BEFIB2012–Fibre reinforced concrete, 2012.
[7] Sasani, M.; Sagiroglu, S. Progressive collapse of reinforced concrete structures: a multihazard
perspective. ACI Structural Journal, 105(1), 96-105, January/February 2008.
[8] Narayanan, R., Darwish, I.Y.S. Punching Shear Tests on Steel Fibre Reinforced Microconcrete Slabs.
Magazine of Concrete Research, 39(138), 42-50, 1987.
[9] Harajli, M.H.; Maalouf D.; Khatib H. Effect of fibers on the punching shear strength of slab-column
connections. Cement & Concrete Composites, 17(2), 161-170, 1995.
[10] Muttoni, A.; Ruiz, M.F. The critical shear crack theory as mechanical model for punching shear design
and its application to code provisions. Fédération Internationale du Béton, Bulletin 57, Lausanne,
Switzerland, 31-60, 2010.
[11] Michels, J.; Waldmann, D.; Maas, S.; Zürbes, A. Steel fibers as only reinforcement for flat slab
construction – Experimental investigation and design. Construction and Building Materials, 26, 145-155,
2012.
[12] Muttoni, A. Punching shear strength of reinforced concrete slabs without transverse reinforcement. ACI
Structural Journal, 105(4), 440-450, July/August 2008.
[13] CEB-FIP. Model Code 2010: Final Draft. Model Code prepared by Special Activity Group 5, Lausanne,
September 2011.
[14] Kinnunen, S.; Nylander, H. Punching of Concrete Slabs without Shear Reinforcement, Transactions of
the Royal Institute of Technology, 158, Stockholm, Sweden, 112 pgs, 1960.
[15] Shehata, I. A. E. M. Punching of prestressed and non-prestressed reinforced concrete flat slabs. PhD
Thesis – The Polytechnic of Central London, London, 1985.
[16] Alexander, S.D.B.; Simmonds, S.H. Bond model for strength of slab-column joints. Department of Civil
Engineering, Structural Engineering Report no 174, University of Alberta, 1991.
[17] Muttoni, A.; Schwartz, J. Behaviour of Beams and Punching in Slabs without Shear Reinforcement.
IABSE Colloquium, 62, 703-708, Zurich, Switzerland, 1991.

20
[18] Moraes Neto, B.N. Punching behaviour of steel fibre reinforced concrete slabs submitted to symmetric
loading. PhD in Civil Engineering, Department of Civil and Environmental Engineering, University of
Brasília, Brasília, DF, January, 2013. (in Portuguese)
[19] Guandalini, S. Poinçonnement symétrique des dalles en béton armé. PhD Thesis 3380, Ecole
Polytechnique Fédérale de Lausanne, Switzerland, 2005. (in French)
[20] Taheri, M.; Barros, J.A.O.; Salehian, H.R., “A parametric study on the use of strain softening/hardening
FRC for RC elements failing in bending”, ASCE Materials in Civil Engineering Journal, 24(3), 259-274,
2012.
[21] Azevedo, A.P., “Resistance and ductility of column-slab connections in slabs of high strength steel fibre
reinforced concrete and including steel studs”, MSc Thesis. EESC-USP, Brazil, 1999. (in Portuguese)
[22] Holanda, K.M.A., “Analysis of resistant mechanisms and similarities of the adition effect of steel fibers
on strength and ductility to both punching shear of flat and the shear of concrete beams”, PhD Thesis. São
Carlos, Brazil, 2002. (in Portuguese)
[23] Cunha, V.M.C.F.; Barros, J.A.O.; Sena-Cruz, J.M., “Pullout behaviour of steel fibres in self-compacting
concrete”, ASCE Materials in Civil Engineering Journal, 22(1), 1-9, January 2010.
[24] Walraven, J.C. Fundamental Analysis of Aggregate Interlock. Journal of Structural Engineering,
ASCE, 107(11), 2245-2270, 1981.
[25] Vecchio, F.J.; Collins, M.P. The Modified Compression-Field Theory for Reinforced Concrete
Elements Subjected to Shear. ACI JOURNAL, Proceedings 83(2), 219-231, 1986.
[26] ACI 318. Building Code Requirements for Structural Concrete, American Concrete Institute,
Farmington Hills, Michigan, 2008.
[27] Collins, M.P. Evaluation of shear design procedures for concrete structures. A Report prepared for the
CSA technical committee on reinforced concrete design, 2001.
[28] Alexander, S.; Simmonds, S. Punching shear tests of concrete slabs-column joints containing fiber
reinforcement. ACI Structural Journal, 89(4), 425-332, Jul/Aug 1992.
[29] Shaaban, A.M.; Gesund, H. Punching shear strength of steel fiber reinforced concrete flat plates. ACI
Structural Journal, 91(4), 406-414, Jul/Aug 1994.

21
[30] Choi, K-K.; Taha, M.M.R.; Park, H-G.; Maji, A.K. Punching shear strength of interior concrete slab-
column connections reinforced with steel fibers. Cement & Concrete Composites, 29, 409-420, 2007.
[31] Higashiyama, H.; OTA, A.; Mizukoshi, M. Design equation for punching shear capacity of SFRC slabs.
International Journal of Concrete Structures and Materials, 5(1), 35-42, 2011.
[32] Moraes-Neto, B.N.; Barros, J.A.O.; Melo, G.S.S.A. The predictive performance of design models for
the punching resistance of SFRC slabs in inner column loading conditions. 8th RILEM International
symposium on fibre reinforced concrete: challenges and opportunities (BEFIB 2012), September, 2012.
[33] Cheng, M-Y.; Parra-Montesinos, G.J. Evaluation of steel fiber reinforcement for punching shear
resistance in slab-column connections – Part I: Monotonically increased load. ACI Structural Journal,
107(1), 101-109, Jan/Feb 2010.
[34] Mcharg, P. J. Effect of fibre-reinforced concrete on the performance of slab-column specimens.
Montreal-Canada. Master thesis. McGill University, 1997.
[35] Theodorakopoulos, D.D.; Swamy, N. Contribution of steel fibers to the strength characteristics of
lightweight concrete slab-column connections falling in punching shear. ACI Structural Journal. 90(4), 342–
355, Jul/Aug 1993.
[36] Özden, S.; Ersoy, U.; Ozturan, T. Punching shear tests of normal- and high-strength concrete flat plates.
Can. J. Civ. Eng., 33, 1389-1400, 2006.

22
NOTATION
A’s Area of compression reinforcement
As Area of tension reinforcement
b Width of a isolated slab element
b0 Critical perimeter for punching shear
bq,c Loaded line for square slabs in circular edge conditions
bq,q Loaded line for square slabs in rectangular edge conditions
c’ Distance of the flexural reinforcement to the concrete tensile surface
d Internal arm of the slab
d0 Diameter of the aggregates
df Diameter of fibre
dg Maximum diameter of the
dg0 Reference diameter of the aggregates
e Edge of the column’s cross section
E Modulus of elasticity of concrete
Es Modulus of elasticity of reinforcement
F’ s Internal compressive force of compressive reinforcement
fc Average compressive strength of concrete in cylinder specimens
Fcr Internal compressive force of concrete in radial direction
Fct Internal compressive force of concrete in tangential direction
fct Average tensile strength of concrete (Brazilian test)
fFts Post-cracking strength for serviceability crack opening
fFtu Post-cracking strength for ultimate crack opening
fRi Residual flexural tensile strength of fibre reinforced concrete corresponding to CMODi
Fs Internal compressive force of tensile reinforcement
Fsr Internal tensile force of reinforcement in radial direction
Fst Internal tensile force of reinforcement in tangential direction
fsy Yield strength of reinforcement
h Slab thickness
I0 Second moment of area of uncracked concrete cross-section
I1 Second moment of area of cracked concrete cross-section
L Span of slab
l f Length of fibre
mcr Bending moment at crack initiation
mr Radial moment per unit width
mR Resisting bending moment (plastic bending moment)
mt Tangential moment per unit width
r Radial orientation
r0 Radius of the critical shear crack
r1 Radius of the zone in which cracking is stabilized
rc Radius of a circular column
rc,eq Radius of a circular column in an equivalent slab of circular geometry
rcr Radius of cracked zone
rq Radius of the load introduction at the perimeter
rq,eq Radius of the load introduction at the perimeter in an equivalent slab of circular geometry
rs Radius of circular isolated slab element
rs,eq Radius of circular isolated slab element in an equivalent slab of circular geometry
ry Radius of yielded zone
t Tangential orientation

23
V Shear force
Vexp Experimental punching shear strength
Vf Fibre volume percentage
Vflex Shear force associated with flexural capacity of the slab
VR Nominal punching shear strength
VR,cd Design concrete contribution to punching shear strength
VR,d Design punching shear strength
VR,fd Design fibre contribution to punching shear strength
VR,sd Design shear reinforcement contribution to punching shear strength
Vthe Theoretical punching shear strength
Vu Punching failure load
w Shear crack opening
wu Maximum acceptable crack width imposed by design conditions
x Neutral axis of slab
z Axis orthogonal to the slab with origin at the bottom surface of the slab
β Efficiency factor of the bending reinforcement for stiffness calculation
∆φ Angle of a cracked radial segment of slab
ε’ s Compressive steel reinforcement strain
εc Concrete strain
εcu Ultimate strain of concrete in compression zone
εfu Ultimate strain of fibre in tensile zone
εs Strain of steel reinforcement in tensile zone
εsu Ultimate strain of steel reinforcement in tensile zone
εt,bot Concrete tensile strain at the bottom surface of the slab
νR, Nominal shear stress
νc Concrete nominal shear strength
ρ Tensile reinforcement ratio
ρ' Compressive reinforcement ratio
σf,r Post cracking tensile strength of SFRC in radial direction
σf,t Post cracking tensile strength of SFRC in tangential direction
τb Average interracial bond strength of fibre matrix
χ1 Curvature in stabilized cracking
χcr Curvature at cracking
χts Tension stiffening parameter
χy Yielding curvature
ψ Rotation of slab

24
APPENDIX: Theoretical Models
1. Narayanan and Darwish [8]:
dud
laV.f.V bs
f
fffbspR ⋅⋅⋅
⋅⋅⋅⋅+⋅+⋅= ξτρ 41016240 [MPa, mm] (1)
( )hed
laV.u
f
fffb ⋅⋅+⋅⋅
⋅⋅⋅−= π345501 [mm] (2)
=fibres uoformd orf.1
fibres crimped orf.0
fibres round orf.0
a f
0
75
5
(3)
where fsp is the indirect cylinder tensile strength of fibre reinforced concrete (FRC), τb=4.15 MPa is the average fibre-
matrix interfacial bond stress, af is a factor depending of the fibre geometry, ( )h..s ⋅−= 002061ξ is an empirical factor
depending of the slab’s thickness, h, and ub is the critical perimeter.
2. Shaaban and Gesund [29]:
( ) cfR fdb.W..V ⋅⋅⋅+⋅⋅= 05670025060 [MPa, mm] (4)
( )deb +⋅= 40 (5)
ff
c
ff V.
V
w
VW ⋅=
⋅=
⋅= 273
2400
78507850 (6)
where Wf is the weight fibre percentage, and wc is the specific weight of plain concrete.
3. Harajli et al. [9]:
( ) cff,R fdbV..V ⋅⋅⋅⋅+= 007500330 [MPa, mm] (7)
4. Holanda [22]:
( ) cfc
sy
c
sycR f.V.
f
f
f
ffded.V ⋅+⋅⋅
⋅−⋅
⋅⋅⋅⋅⋅⋅= 51015017000350
ρρ [MPa, cm, %] (8)

25
5. Choi et al. [30]:
( ) φβαα cosAfd/l.A'ff.f.d
V TcffCcfccR ⋅⋅⋅⋅⋅+⋅
⋅
−+⋅⋅⋅⋅= 1050
326302630
400 2
4 (9)
001960.cof =⋅εα (10)
⋅+
⋅⋅=
c
cf
f
ffcof f
'f.
d
lV. 00410000790ε (11)
( ) cfffcf fd/lV.'f +⋅⋅⋅= β91 [MPa] (12)
( ) ( )φ
φsin
cddcoteeA u
T
−⋅⋅⋅+⋅+⋅=
422 21 (13)
( ) uuC cccoteeA ⋅⋅⋅+⋅+⋅= φ422 21 (14)
=concrete tlightweigh withfibres steeloundr or plain orf3/4
concrete normal withfibres steeloundr or plain orf2/3
fibres steelcrimped ro hooked rof1
β
where f’ cf is the compressive strength of FRC, fc is the compressive strength of an equivalent concrete without fibres, β
accounts for the effect of fibre shape, φ=30o is the average value of the angle formed by the punching failure crack with
the slab’s plan, α·εcof is the compressive strain at the extreme compression fiber of the cross section, and εcof is the
compressive strain corresponding to the compressive strength of FRC, cu is the neutral axis position, e1 and e2 are the
edges of the column’s cross section and AT and AC are, respectively, the failure surfaces of tension and compression
zones.
6. Muttoni and Ruiz [10]:
f,Rc,RR VVV += (15)
ptfptff,R Ad
A)w(V ⋅
⋅=⋅=6
ψσσ (16)
bff
f
fftf V
d
l
l
w
l
warctan)w( τ
απσ ⋅⋅⋅
⋅−⋅
⋅⋅=
2
1
21
1 (17)
f
f
l.
d
⋅=
531α (18)
⋅⋅⋅
=fibres straightforf.
fibres crimped forf.
fibres ends hooked forf.
.c
.c
.c
b50
50
50
40
60
80
τ (19)
where VR,c is the concrete contribution to the punching shear resistance, σtf is the post-cracking tensile strength of FRC
for a crack width w, and Ap is the horizontal projection of failure surface.

26
7. Higashiyama et al. [31]:
( ) dufV pbpcdrpdR ⋅⋅+⋅⋅⋅= νβββ (20)
MPa.f.f cpcd 2120 <⋅= (21)
511000
4 .dd <=β (22)
511003 .p <⋅= ρβ (23)
( )d/u.r ⋅++=
2501
11β (24)
MPa. ithw F. bbb 154410 =⋅⋅= ττν (25)
( ) ( ) 3201 .K ithw FKduu p =⋅−⋅⋅+= π (26)
fff
f aVd
lF ⋅⋅= , with Vf in percentage (27)
=fibres uoformd orf.1
fibres crimped orf.0
fibres round orf.0
a f
0
75
5
(28)
where u is the perimeter of the loaded area, up is the perimeter of the critical section located at a distance of d/2 from the
contour of the loaded area.

27
LIST OF TABLE CAPTIONS
Table 1. Modified version of the Demerit Points Classification (DPC) [27]
Table 2. Prediction of νexp: classification of the proposals according to the modified version of the DPC
Table 3. Prediction of Vexp: classification of the proposals according to the modified version of the DPC
Table 4. Performance of several models to predict Vexp: classification of the models according to the modified version of the DPC
Table 1. Modified version of the Demerit Points Classification (DPC) [27]
λ=νexp /νthe Classification Penalty (PEN)
< 0.50 Extremely Dangerous 10
[0.50-0.85[ Dangerous 5
[0.85-1.15[ Appropriate Safety 0
[1.15-2.00[ Conservative 1
≥ 2.00 Extremely Conservative 2

28
Table 2. Prediction of νexp: classification of the proposals according to the modified version of the DPC
λ=νexp /νthe N° samples PEN
< 0.50 0 0
[0.50-0.85[ 3 15
[0.85-1.15[ 28 0
[1.15-2.00[ 9 9
≥ 2.00 0 0
Total PEN 40 24
Statistical resume
Average (AVG) 1.04
STD 0.17
COV (%) 15.97

29
Table 3. Prediction of Vexp: classification of the proposals according to the modified version of the DPC Proposals Refined Simple Balanced
λ=Vexp/Vthe N° samples PEN N° samples PEN N° samples PEN
< 0.50 0 0 0 0 0 0
[0.50-0.85[ 2 10 5 25 4 20
[0.85-1.15[ 37 0 38 0 39 0
[1.15-2.00[ 11 11 7 7 7 7
≥ 2.00 0 0 0 0 0 0
Total PEN 50 21 50 32 50 27
Statistical resume
Proposal Refined Simple Balanced
Average (AVG) 1.04 1.00 1.01
STD 0.13 0.13 0.13
COV (%) 12.72 13.22 12.74

30
Table 4. Performance of several models to predict Vexp: classification of the models according to the modified version of the DPC
λ=Vexp/Vthe < 0.50 [0.50-0.85[
[0.85-1.15[
[1.15-2.00[
≥ 2.00 Total PEN
Average (AVG)
STD COV (%)
MOD1 N° samples 0 21 21 8 0 50
0.92 0.23 25.29 PEN 0 105 0 8 0 113
MOD2 N° samples 0 2 18 29 1 50
1.24 0.26 20.89 PEN 0 10 0 29 2 41
MOD3 N° samples 0 5 18 20 7 50
1.42 0.62 43.38 PEN 0 25 0 20 14 59
MOD4 N° samples 0 0 8 42 0 50
1.32 0.20 15.47 PEN 0 0 0 42 0 42
MOD5 N° samples 0 6 17 27 0 50
1.20 0.29 24.03 PEN 0 30 0 27 0 57
MOD6 N° samples 0 6 37 7 0 50
0.99 0.13 13.26 PEN 0 30 0 7 0 37
MOD7 N° samples 0 20 24 6 0 50
0.92 0.18 19.45 PEN 0 100 0 6 0 106
Refined N° samples 0 2 37 11 0 50
1.04 0.13 12.72 PEN 0 10 0 11 0 21
Simple N° samples 0 5 38 7 0 50
1.00 0.13 13.22 PEN 0 25 0 7 0 32
Balanced N° samples 0 4 39 7 0 50
1.01 0.13 12.74 PEN 0 20 0 7 0 27
MOD1= Narayanan and Darwish [8]; MOD2= Shaaban and Gesund [29]; MOD3= Harajli et al. [9]; MOD4= Holanda [22]; MOD5= Choi et al. [30]; MOD6= Muttoni and Ruiz [10]; MOD7= Higashiyama et al. [31].

31
LIST OF FIGURE CAPTIONS
Figure 1. Column-slab connection: (a) Assumed crack pattern and reinforcement arrangement, (b) Slab configuration at
ultimate condition.
Figure 2. Internal forces acting in a radial segment: (a) Stresses and resultant forces, (b) Bending moments (c) Free
body diagram.
Figure 3. Transformation of a square slab (a) into an equivalent slab of circular geometry (b).
Figure 4. (a) 2L and 4L moment curvature (m-χ) diagrams, (b) m-r diagram corresponding to 4L m-χ diagram.
Figure 5. Adopted approach to evaluate the ultimate bending moment, mR (adapted from the CEB-FIP Model Code
2010 [13]).
Figure 6. Hypotheses adopted to derive the simplified load-rotation formulation: (a) Free body diagram of a radial
segment, (b) bilinear (2L) m-r relationship.
Figure 7. Punching critical perimeter adopted for the evaluation of the punching resistance in column of: (a) circular, (b)
square cross section.
Figure 8. Analysis of the results: (a) Predictive performance, (b) Safe (λ≥1) and unsafe (λ<1) percentage of slabs, and
(c) Dispersion of the results.
Figure 9. Assessment of the predictive performance of the proposed punching failure criterion (Eq. (46)).
Figure 10. Experimental versus theoretical results in terms of the relationship between normalized load and slab’s
rotation for slab: (a) L6 [22], (b) A1 [3] and (c) P11F31 [28].
Figure 11. Performance in terms of predicting the punching failure load of the proposals: (a) Refined, (b) Simple, (c)
Balanced; (d) Dispersion of the predictions.
Figure 12. Performance of several models to predict Vexp: MOD1= Narayanan and Darwish [8]; MOD2= Shaaban and
Gesund [29]; MOD3= Harajli et al. [9]; MOD4= Holanda [22]; MOD5= Choi et al. [30]; MOD6= Muttoni and Ruiz
[10]; MOD7= Higashiyama et al. [31]; Refined; Simple; Balanced.

32
r
V
V V
q
s
r
R
rc
Radial crack
Tangential crack
Radial segment
Edge of the slabTangential
reinforcement
Radial reinforcement
(a)
ψ
Centre of rotation
Punching failure surface
(Root of shear crack)
d
Compression
Tension Compression strut
rr
r
r
s
q
0
c
(b)
Figure 1. Column-slab connection: (a) Assumed crack pattern and reinforcement arrangement, (b) Slab configuration at ultimate condition.

33
F
∆ϕ V⋅∆ϕ/2⋅π
V⋅∆ϕ/2⋅π
F
FF
F
F
σ
σ st
cr
ctct
st
sr
f,t
f,r
V⋅∆ϕ/2⋅π
V⋅∆ϕ/2⋅π
mm
m
∆ϕ
t
t
r
V⋅∆ϕ/2⋅π
V⋅∆ϕ/2⋅π
t
z
rO'
m m
rr
rr
r t
q
s
0
c
r dr
(a) (b) (c) Figure 2. Internal forces acting in a radial segment: (a) Stresses and resultant forces, (b) Bending moments (c) Free body diagram.

34
Circularedge condition
Rectangularedge condition
L
e
L e
b
b
q,c
q,q
Circularedge condition
r
r
r
c,eq
s,eq
q,eq
(a) (b)
Figure 3. Transformation of a square slab (a) into an equivalent slab of circular geometry (b).

35
m
χcr 1 y
R
cr
EI
EI
(4L) (2L)1
1
χ
m
m
χ χ χ
1
0
ts
m
rr r r rr
R
cr
m
m
y 1 cr s0
(a) (b)
Figure 4. (a) 2L and 4L moment curvature (m-χ) diagrams, (b) m-r diagram corresponding to 4L m-χ diagram.

36
d∆⋅
d
b∆'
⋅d
h
A = ρ⋅b⋅d
A' = ρ'⋅b⋅d
x=k⋅
d
ε ≤ε
ε'
ε ≤ε
ε ≤ε
η⋅f
f
F'
F
y
λ⋅x
s
s
t,bot fu
s su
Ftu
s
c cu
s
s
c
Figure 5. Adopted approach to evaluate the ultimate bending moment, mR (adapted from the CEB-FIP Model Code 2010 [13]).

37
V⋅∆ϕ/2⋅π
V⋅∆ϕ/2⋅π
t
z
rO'
m m
rr
rr
r t
q
s
0
c
r dr
m
r
r
rrrr
r
rr
rr
R
R
R
(r <r )
(r <r <r )
(r =r )
m
m
m
y
y
y
sq0c
0
y s
sy
y 0
(a) (b)
Figure 6. Hypotheses adopted to derive the simplified load-rotation formulation: (a) Free body diagram of a radial segment, (b) bilinear (2L) m-r relationship.

38
α⋅d
2⋅rc
e
α⋅d
(a) (b)
Figure 7. Punching critical perimeter adopted for the evaluation of the punching resistance in column of: (a) circular, (b) square cross section.
39
νexp = 1.04νthe
R2 = 0.28
0
0.2
0.4
0.6
0.8
1
1.2
0 0.2 0.4 0.6 0.8 1 1.2
νthe (√MPa)
νexp
(√M
Pa
)
42.50
57.50
0%
20%
40%
60%
80%
100%
λ<1 λ≥1
0
0.5
1
1.5
2
λ
(a) (b) (c) Figure 8. Analysis of the results: (a) Predictive performance, (b) Safe (λ≥1) and unsafe (λ<1) percentage of slabs, and (c) Dispersion of the results.

40
0
0.4
0.8
1.2
1.6
2
0 0.1 0.2 0.3 0.4 0.5 0.6
ψ·d·kdg (rad)
ν (√
MP
a)
[21] [22] [3] [33] [34] [28] [35] [36] [31]
Figure 9. Assessment of the predictive performance of the proposed punching failure criterion (Eq. (46)).

41
0
0.3
0.6
0.9
1.2
0 0.01 0.02 0.03 0.04
ψ (rad)
ν (√
MP
a)
Exp Refined Simple Balanced
0
0.2
0.4
0.6
0.8
1
0 0.01 0.02 0.03 0.04
ψ (rad)
ν (√
MP
a)
Exp Refined Simple Balanced
0
0.2
0.4
0.6
0.8
0 0.02 0.04 0.06 0.08
ψ (rad)
ν (√
MP
a)
Exp Refined Simple Balanced (a) (b) (c)
Figure 10. Experimental versus theoretical results in terms of the relationship between normalized load and slab’s rotation for slab: (a) L6 [22], (b) A1 [3] and (c) P11F31 [28].

42
Vexp = 1.03Vthe
R2 = 0.87
0
200
400
600
800
0 200 400 600 800
Vthe (kN)
Ve
xp (
kN)
Vexp = 0.98Vthe
R2 = 0.82
0
200
400
600
800
0 200 400 600 800
Vthe (kN)
Ve
xp (
kN)
Vexp = 0.99Vthe
R2 = 0.83
0
200
400
600
800
0 200 400 600 800
Vthe (kN)
Ve
xp (
kN)
0
0.5
1
1.5
2
Refined
Simple
Balance
d
λ
(a) (b) (c) (d)
Figure 11. Performance in terms of predicting the punching failure load of the proposals: (a) Refined, (b) Simple, (c) Balanced; (d) Dispersion of the predictions.

43
Vexp = 0.93Vthe
R2 = 0.45
0
200
400
600
800
0 200 400 600 800
Vthe (kN)
Ve
xp (
kN)
Vexp = 1.19Vthe
R2 = 0.60
0
200
400
600
800
0 200 400 600 800
Vthe (kN)
Ve
xp (
kN)
Vexp = 1.21Vthe
R2 = 0.04
0
200
400
600
800
0 200 400 600 800
Vthe (kN)
Ve
xp (
kN)
Vexp = 1.31Vthe
R2 = 0.79
0
200
400
600
800
0 200 400 600 800
Vthe (kN)
Ve
xp (
kN)
(a.1) MOD1 (a.2) MOD2 (a.3) MOD3 (a.4) MOD4
Vexp = 1.10Vthe
R2 = 0.64
0
200
400
600
800
0 200 400 600 800
Vthe (kN)
Ve
xp (
kN)
Vexp = 0.98Vthe
R2 = 0.86
0
200
400
600
800
0 200 400 600 800
Vthe (kN)
Ve
xp (
kN)
Vexp = 0.94Vthe
R2 = 0.68
0
200
400
600
800
0 200 400 600 800
Vthe (kN)
Ve
xp (
kN)
Vexp = 1.03Vthe
R2 = 0.87
0
200
400
600
800
0 200 400 600 800
Vthe (kN)
Ve
xp (
kN)
(a.5) MOD5 (a.6) MOD6 (a.7) MOD7 (a.8) Refined
Vexp = 0.98Vthe
R2 = 0.82
0
200
400
600
800
0 200 400 600 800
Vthe (kN)
Ve
xp (
kN)
Vexp = 0.99Vthe
R2 = 0.83
0
200
400
600
800
0 200 400 600 800
Vthe (kN)
Ve
xp (
kN)
0
1
2
3
4
MO
D1
MO
D2
MO
D3
MO
D4
MO
D5
MO
D6
MO
D7
Refine
d
Sim
ple
Balanc
ed
λ
(a.9) Simple (a.10) Balanced (b)
Figure 12. Performance of several models to predict Vexp: MOD1= Narayanan and Darwish [8]; MOD2= Shaaban and Gesund [29]; MOD3= Harajli et al. [9]; MOD4= Holanda [22]; MOD5= Choi et al. [30]; MOD6= Muttoni and Ruiz [10]; MOD7= Higashiyama et al. [31]; Refined; Simple; Balanced.
Top Related