


Languages
Pages
Legal

A LabVIEW BASED DATA ACQUISITION SYSTEM FOR MONITORING
AND ANALYSIS OF VIBRATION SIGNAL
A Thesis Submitted in Partial Fulfillment of the Requirements
For the Award of the Degree of
Master of Technology
In
Electronics and Communication Engineering
By
Sunita Mohanta
Roll No: 211EC3095
Department of Electronics and Communication Engineering
National Institute of Technology
Rourkela, Odisha-769008
2011 – 2013
A LabVIEW BASED DATA ACQUISITION SYSTEM FOR MONITORING
AND ANALYSIS OF VIBRATION SIGNAL
A Thesis Submitted in Partial Fulfillment of the Requirements
For the Award of the Degree of
Master of Technology
In
Electronics and Communication Engineering
(Specialization: Electronics and Instrumentation Engineering)
By
Sunita Mohanta
Roll No: 211EC3095
Under the guidance of
Dr. Umesh Chandra Pati
Department of Electronics and Communication Engineering
National Institute of Technology
Rourkela, Odisha-769008
2011 – 2013
Department of Electronics & Communication Engineering
National Institute of Technology, Rourkela
CERTIFICATE
This is to certify that the thesis entitled “A LabVIEW BASED DATA ACQUISITION
SYSTEM FOR MONITORING AND ANALYSIS OF VIBRATION SIGNAL” submitted by
Mrs. Sunita Mohanta in partial fulfillment of the requirements for the award of Master of
Technology Degree in Electronics and Communication Engineering specializing in
“Electronics and Instrumentation Engineering ” at the National Institute of Technology,
Rourkela (Deemed University) is an authentic work carried out by her under my supervision and
guidance.
To the best of my knowledge, the matter embodied in the thesis has not been submitted to any
other University / Institute for the award of any Degree or Diploma.
Dr. Umesh Chandra Pati
Place: Associate Professor Date: Dept. of Electronics and Comm. Engineering National Institute of Technology
Rourkela-769008

Dedicated to Parents, husband and friends
Page i
ACKNOWLEDGEMENT
I have taken efforts in this project; it would not have been possible without the kind support and
help of many individuals. I would like to extend my sincere thanks to all of them.
I would like to express my deep sense of profound gratitude to my honorable, esteemed guide,
Dr. Umesh Chandra Pati for his guidance and enthusiastic support. His valuable discussions
without which my work may not be in present form.
The discussions held with the friends of my branch and with Smruti Dash are worth to mention
especially for all the thoughtful and mind stimulating discussions we had, which prompted us to
think beyond the obvious.
My due thanks to Prof. S.Meher, Prof. S. K. Patra, Prof. K. K. Mahapatra, Prof. T. K. Dan,
Prof. S. K. Das, Prof. Poonam Singh and Prof. Samit Ari for teaching me and also helping me
how to learn They have been great sources of inspiration to me and I thank them from the bottom
of my heart.
I mention my indebtedness to my father and mother for their love and affection and their
constant support which made me believe in me. I mention my love towards my husband who has
been a constant support throughout.
I would like to thank to all those who are a part of this project whose names could have not been
mentioned here.
Sunita Mohanta Roll No. 211EC3095 Department of ECE National Institute of Technology Rourkela, 769008

Page ii
ABSTRACT
Machine plays a vital role in the plant. Machine maintenance process is a very
important factor for a plant, which is required regularly. Various maintenance
techniques such as breakdown maintenance, preventive maintenance and predictive
maintenance are performed for maintenance of a machine. Vibration monitoring and
analysis is a predictive maintenance technique by which the faults can be detected in
the machines.
In this work, the vibration fault simulation system is developed for vibration signal
monitoring. The structure of vibration monitoring system is discussed. The important
components of vibration monitoring system are accelerometer transducer, charge
amplifier, data acquisition card (DAQ) and computer. Data acquisition system (usually
hardware module9234), signal analysis and LabVIEW (Laboratory Virtual Instrumentation
Engineering Workbench) are used to detect various faults which occur in the machine. As
a result, the necessary control action can be taken on the machine in advance. When
vibration occurs in machine three parameters are changed. These are displacement, velocity and
acceleration of machine. Accelerometer transducer is directly proportional to the velocity,
displacement, acceleration and frequency of signal. By using above factors, the machinery
condition can be accurately diagnosed. For processing and analysis of vibration signal, time
domain and frequency domain analysis of vibration signal is implemented in LabVIEW.
Time domain analysis is done by first and second integration of acceleration of vibration
signal. From time domain analysis it is difficult to find the exact fault of the vibration signal. It is
also difficult to locate the faults region and fault type. For avoiding the difficulties in time
domain analysis, frequency domain analysis is performed. Velocity which is in time domain is
converted to frequency domain using FFT algorithm.
Spectrum analysis has provided more accurate information about the vibration
signal type, signal fault region and fault extent as compared to time domain analysis.
After finding the fault region and fault extent of vibration signal, preventive control action has
taken. The control action for a faulty vibration signal is implemented using PID controller with
different modes such as manually, automatically, using generator sine and using generator
square. Automatic controller has provided better response than other controller. This controller
has taken very less time to complete the control action.
Page iii
TABLE OF CONTENTS Acknowledgements i
Abstract ii
Table of Contents iii
List of Figures v
List of Abbreviations vi
CHAPTER 1 1 1 INTRODUCTION ................................................................................................................... 2
1.1 Overview .......................................................................................................................... 2
1.2 Literature Review ............................................................................................................. 3
1.3 Motivation ........................................................................................................................ 4
1.4 Objective .......................................................................................................................... 5
1.5 Organisation of the Thesis................................................................................................ 5
CHAPTER 2 7
2 STRUCTURE OF VIBRATION MONITORING SYSTEM ................................................. 8
2.1 Introduction ...................................................................................................................... 8
2.2 Various Maintenance Techniques .................................................................................... 9
2.2.1 Breakdown maintenance ................................................................................... 10
2.2.2 Preventive maintenance .................................................................................... 10
2.2.3 Predictive maintenance ..................................................................................... 10
2.3 Components of Vibration Monitoring System ............................................................... 13
2.3.1 Machine ............................................................................................................. 13
2.3.2 Acceleration transducer .................................................................................... 14
2.3.3 Charge amplifier ................................................................................................ 15
2.3.4 Data acquisition system .................................................................................... 15
2.3.5 PC -Based data acquisition system ................................................................... 17
2.3.6 DAQ software ................................................................................................... 21
2.4 Methodology .................................................................................................................. 22
2.5 Result and Discussion .................................................................................................... 23
Page iv
CHAPTER 3 25
3 VIBRATION SIGNAL PROCESSING ................................................................................ 26
3.1 Introduction .................................................................................................................... 26
3.1.1 Sampling ............................................................................................................ 26
3.1.2 Sampling rate..................................................................................................... 27
3.2 Time Domain Signal Processing .................................................................................... 28
3.3 Frequency Domain Signal Processing............................................................................ 28
3.3 .1 Discrete Fourier Transform ............................................................................. 29
3.4 Methodology .................................................................................................................. 36
3.4.1 Description of the flow chart ............................................................................ 38
3.5 Simulation Result and Discussion .................................................................................. 38
3.5.1 Time domain analysis of vibration signal ........................................................ 39
3.5.2 Frequency domain analysis of the vibration signal .......................................... 42
CHAPTER 4 44
4 CONTROL STRATEGY FOR FAULTY VIBRATION SIGNAL ................................. 45
4.1 Introduction .................................................................................................................... 45
4.2 Control Strategy ............................................................................................................. 46
4.2.1 LabVIEW implementation vibration control system ....................................... 47
4.3 Result and Discussion .................................................................................................... 47
4.3.1 Control action using manual controller ............................................................ 47
4.3.2 Control action using automatic controller ........................................................ 49
4.3.3 Control action using sine generator controller ................................................. 49
4.3.4 Control action using square generator controller ............................................. 50
CHAPTER 5 52
5 CONCLUSION .................................................................................................................... 53
5.1 Future Work ................................................................................................................... 54
Page v
LIST OF FIGURES Figure 2.1:Block diagram for various maintenance technique .................................................................... 9
Figure 2.2:Component of vibration monitoring system ............................................................................ 13
Figure 2.3:Block diagram of single channel data acquisition system ........................................................ 16
Figure 2.4:Block diagram of Multichannel data acquisition system ......................................................... 17
Figure 2.5:A pc- based data acquisition system for vibration monitoring ................................................. 22
Figure 2.6:Block diagram of double integration of acceleration ............................................................... 23
Figure 2.7:Front panel of double integration acceleration ......................................................................... 24
Figure 3.1:Sampling process ...................................................................................................................... 26
Figure 3.2:Spectrum of sampling process with different frequency range ................................................ 27
Figure 3.3:Block diagram for frequency domain signal processing .......................................................... 29
Figure 3.4:Block diagram for a FIR filter .................................................................................................. 36
Figure 3.5:Flow chart for vibration signal analysis ................................................................................... 37
Figure 3.6:The block diagram of vibration signal processing in time domain .......................................... 39
Figure 3.7: Front Panel of time domain analysis with sampling rate250KHz ........................................... 40
Figure 3.8:Front Panel of time domain analysis with sampling rate550KHz ............................................ 41
Figure 3.9: Front Panel of time domain analysis with displacement exceeded the upper limit. ............. 41
Figure 3.10:Block diagram of spectrum analysis ....................................................................................... 42
Figure 3.11:Front panel of power spectrum analysis ................................................................................. 43
Figure 4.1: Block diagram for controlling the vibration of a motor. ......................................................... 46
Figure 4.2:Block diagram for faulty vibration signal controller. ............................................................... 47
Figure 4.3:Front panel for control of a vibration signal using manual controller. (b): Faulty vibration
signal, (c) control action after 4 min and 12 sec (d) after 5 and 35 sec (e) 7 min and 23 sec. ................. 48
Figure 4.4:Front panel for control of a vibration signal using automatic controller. (b): Initial control
action. (c): After 2 min and 12 sec. ............................................................................................................. 49
Figure 4.5: Front panel for control of a vibration signal using generator sine controller. (b): Initial control
action, (c): After 2 min and 10 sec, (d) After 9 min and 26 sec. ................................................................. 50
Figure 4.6:Front panel for control of a vibration signal using generator square controller. (b): Initial
control action, (c): After 2 min and 01 sec. ................................................................................................ 51
Page vi
LIST OF ABBREVIATIONS
DAQ Data acquisition
DAS Data acquisition system
PC Personal computer
VI Virtual instrumentation
LabVIEW Laboratory virtual instrument engineering workbench
FFT Fast Fourier transforms
AR Autoregressive model
VFSS Vibration Faults Simulation System
PE Piezoelectric
ICP Integrated Circuit Piezoelectric
IEPE Internal amplifier Piezoelectric
S/H Sample and hold
I/O Input Output
ADC Analog to Digital Converter
DAC Digital to Analog Converter
A/D Analog to Digital
MUX Multiplexer
RTSI Real-Time System Integration
Page 1
CHAPTER1
INTRODUCTION
Overview
Literature Review
Objective
Motivation
Organisation of Thesis
Chapter-1 Introduction
Page 2
1 INTRODUCTION This chapter reflects the general overview of the project work. This comprises of a brief
description of vibration testing system and vibration signal processing followed by literature
review. The objective, motivation and organization of the thesis are mentioned in this chapter.
1.1 Overview Vibration occurs in machine in different plant or in daily life. Vibration can be a good indicator
of machine monitoring system. Vibration can produce noise to harm the human health. The
vibrations are very much negative and harmful. The effect of vibration can be reduced or
eliminated using vibration testing system.
The nature of acquired signal from the sensor to be measured and scrutinized dictates the
degree of erudition required in the acquisition system. Numerous ways are available to transfer
the data into a computer .Data acquisition (DAQ) card is one of the module that interfaces the
physical performance in the real world to the digital computation of artificial world. It is easy to
use, multifunctional and less costly than other data transfer device. Data acquisition is a process
in which the analog signals originated from physical parameter like temperature, pressure, flow
rate, force, and vibration are converted to digital signal. Simultaneously the analog signals are
conditioned by appropriate signal conditioner. With rapid advancement of personal computer
(PC) hard ware and software technologies, it is easy to adopt the PCs efficiently in various
precise measurement and complex control application. A PC- based data acquisition system can
be easily configured to cope with the changing requirements of the user. So PC-based DAQ
system is used as a combination of hardware and flexible software to transform in standard
computer into a user defined control or measurement unit.
Earlier GPIB was the most popular interfacing for test and measurement instruments as
prior to virtual instrumentation (VI). VI has emerged into a multifaceted technique that
encompassed the entire area of computer based instrumentation. To a large extent, hardware is
also reduced. For these advantages, VI has made as the dominant tool for the expansion and
contrivance of instrumentation applications and systems. LabVIEW (Laboratory Virtual
Instrumentation Engineering Workbench) may be interfaced with many hardware such as data
acquisition card, instrument control, and industrial automation as the driver software which is
easily available. LabVIEW is a system design platform and development environment based on
Chapter-1 Introduction
Page 3
the concept of data flow programming. It also allows creating programs with graphics instead of
text code. Many applications like data acquisition, data analysis, signal occurrence, signal
processing, controlling and monitoring are done by LabVIEW. Hence, LabVIEW is used to
simulate the vibration testing system and also vibration signal processing.
Vibration occurs when a machine runs. It is an important technique in which internal faults
of the machine can be easily detected. There are various causes for which vibration occurs.
These are repeating force, looseness, resonance etc. By vibration monitoring, the preventive
action can be taken on the machine. Different control actions like manual, automatic, sine wave
generation, square wave generation can be done on the machine in advance. Vibration signal
processing and monitoring are performed by two processes. One is time domain signal
processing. This signal analysis gives the real time signal and extracts the signal characteristics
like value of amplitude, time & phase characteristics. Another one is frequency domain analysis.
The various information like amplitude, phase, power spectrum, Fast Fourier transforms (FFT), a
windowing action, filtering are obtained by this signal analysis. Spectrum domain analysis
provides more information about the signal system & signal by which it is generated. It is good
as compared to time domain analysis.
1.2 Literature Review The literature study on application and fundamentals of data acquisition system is very wide in
nature. Now a day in various types of computer aided developed project or in many laboratory
test, Data acquisition system, accuracy and consistency of instrumentation causes major effect on
result. Hence a comprehensive knowledge of data acquisition system is very important for
obtaining the signal in manufacturing, test and measurement system. The literature study begins
with data acquisition system. “PC-Based Instrumentation” Concepts and practice by
N.Mathivanan is a very good book for learning the fundamentals of data acquisition
system[1].In the book “PC-based instrumentation and control” Mike Tooley has described
about the selection of the necessary hardware and software to implement in a wide range of
practical PC-based instrumentation and control systems [2].Several measurement books have
provided satisfactory information about different instruments and basic measuring units like
different sensors, controller, actuator, instrumentation amplifier etc [3-6].All fundamental
aspects of LabVIEW and the interfacing of instruments like GPIB,RS232,DAS card etc. to
Chapter-1 Introduction
Page 4
the computer [7] are widely covered by this given book ,i.e. “Virtual instrumentation using
LabVIEW”, Principle and Practices of graphical programming, second Edition by Sanjay
gupta and Joseph john. The material “LabVIEW analysis and concept” (National Instrument
2004) provides a deep knowledge about the concept of LabVIEW [8-11].Different design of
DAS using LabVIEW has been followed by various materials, and proceedings [12-20].Some
books regarding study of LabVIEW programming has been followed [21,22].In the paper title
“Vibration Faults Simulation System (VFSS): A System for Teaching and Training on Fault
Detection and Diagnosis” Asan Gani and M. J. E. Salam have described different types of
maintenance method of a machine [23].In this paper vibration fault simulation system is suitably
explain.M. J. E. Salam and Asan Gani have properly explained the vibration signal monitoring
and analysis in the paper title “A LabVIEW based Data Acquisition System for Vibration
Monitoring and Analysis” [24]. In this given paper, the design process of spectrum analyzer,
regarding vibration transducer and data acquisition board are explained briefly. A brief
introduction of signal processing is also discussed here. Gao Bingkun, Li Yanjia, Song Zhaoyun,
Xu Mingzi have discussed about the vibration testing and analysis of a motor [25].Here vibration
signal is processed in cepstrum analysis algorithms based on autoregressive model (AR)
[26].The over view of control system is briefly described in this given book, i.e.“Process
Control”, Principle and algorithm, Oxford publication by Surekha Bhanot [27]. The control
strategy for motor using LabVIEW has been discussed in various proceedings [29-31].
1.3 Motivation Machine plays a vital role in the plants. Maintenance is a very significant factor for a machine,
which is required regularly. Various faults are occurred in the machine. Vibration monitoring
and analysis is a predictive maintenance technique by which the faults can be detected in the
machines. So the main purpose of this work is to find out the error extent and error region of the
vibration signal and taking the necessary control action to stop the machine. We have got the
idea about vibration signal processing. It has done and by using spectrum analyzer and
piezoelectric transducer and it is processed in time domain form. It has several problems for
finding the exact error of vibration signal. Hence the necessary control action can be taken to
stop the machine. It causes a greater loss to plant. Previously all simulations for vibration signal
monitoring are done in MATLAB programming language. It is very difficult to write the code
Chapter-1 Introduction
Page 5
for every step and it takes a large memory space. The given above reasons have motivated me to
search for an alternative method to overcome the above problem.
1.4 Objective The primary objectives of the thesis are given in the following steps
To develop a vibration fault simulation system.
To display the vibration signal in time domain and frequency domain with the help of
LabVIEW as a application software.
To analyze the vibration signal in power spectrum.
Comparison of vibration signal in time domain and frequency domain.
To detect the presence of various faults in the acquired vibration signal of the machine.
To apply the various control action to avoid the various faults in the vibration signal.
1.5 Organisation of the Thesis This thesis constitutes five chapters including introductory chapter. The organization of the
thesis is described below in a précised manner.
Chapter 1: This chapter includes introduction, literature review, motivation and objective of
the project. It also contains the organisation of the thesis.
Chapter 2: In this chapter the structure of vibration fault simulation system is explained. The
basic concept behind the vibration transducer is discussed here. Data acquisition system,
different types of data acquisition, software requirement in DAS system, DAS hardware, signal
conditioning requirement are discussed in details. The amplification of vibration signal is
described briefly.
Chapter 3: Flow chart for vibration signal monitoring system is presented here. The algorithm
for vibration signal monitoring and analysis is discussed. The vibration signal processing and
analysis are done in different domain. Error detection in the acquired vibration signal is done in
this chapter. Basic concept behind time domain signal processing ,frequency domain signal
frequency, Fast Fourier Transform(FFT),Discrete Fourier Transform(DFT),different digital filter,
different windowing function are described broadly.

Chapter-1 Introduction
Page 6
Chapter 4: In this chapter the control action is performed in the faulty vibration signal. The
theoretical background for control system of a vibrator machine is briefly explained. The
LabVIEW implementation of different mode of controller for a vibrating motor is presented in
this chapter.
Chapter 5: This chapter presents the overall conclusion of the thesis. It also describes the
further future work in this domain which needs further attention and investigation.
Page 7
CHAPTER 2
STRUCTURE OF VIBRATION MONITERING SYSTEM
Introduction
Accelerometer Transducer
Charge amplifier
Data acquisition card
DAQ Software
Methodology
Result and Discussion

Chapter-2 Structure of vibration monitoring system
Page 8
2 STRUCTURE OF VIBRATION MONITORING SYSTEM
2.1 Introduction Machine plays a vital role in the plant. Vibration occurs in machine in different plants. The risk
of machine faults can remarkably create serious danger to day to day life and productive activities
of the people. Vibration can produce the noise as well as energy, which are very much harmful to
human health. It also can affect the equipment life and operation stability of machine. It causes
great losses to the plant. So maintenance is a very important factor for a machine, which is
essential. The effect of vibration can be eliminated or reduced from the machine by using
vibration signal monitoring and analysis. Vibration is considered as a good indicator of machine
monitoring system. The monitoring and analysis of vibration signals is the one of the area of
application of LabVIEW. The monitoring and analysis of vibration signal are concern for
implementing the predictive maintenance and fault detection. Various information about the
states change of vibration signal and faults feature of the machine are displayed in the vibration
signal. So the measurement and analysis of vibration signal are necessary for reducing the effect
of vibration. Sufficient training is required to familiarize with different parameter. So that, given
analysis method can be effectively applied for eliminating the effect of vibration. The
performance of the rotating machine can also be determined by measurement and analysis of
vibration signal. Vibration fault simulation system (VFSS) is developed to achieve a better
understanding about the faults of machine. A LabVIEW application based data acquisition
system is used to analyze fault signal.
VFSS is used for the following purposes:
• To study the pattern of vibration signal in various faults.
• To study the performance of a machine condition.
• To apply the control action for preventing the influence of vibration.
• For development and further research purpose.
There are different types of components used to construct the VFSS. The traditional vibration
test system consists of different types of independent measurement system, single result function,
very poor testing result and expensive are all its demerits. Therefore, it has limited application in
practical field. So VFSS is greatly used in practical field. It is developed with computer
technology and virtual instrumentation. It is different from traditional instrument. Virtual
Chapter-2 Structure of vibration monitoring system
Page 9
instrumentation has effective functions like data acquisition, signal occurrence, data analysis,
signal processing, input and output control etc. Virtual instrumentation is considered as standard
software of instrument control and data acquisition.
In manufacturing industry maintenance is considered as a important factor. In a industry Various
types of maintenance techniques are applied to the machine. Before we will discuss about the
predictive maintenance method, other maintenance methods are discussed briefly.
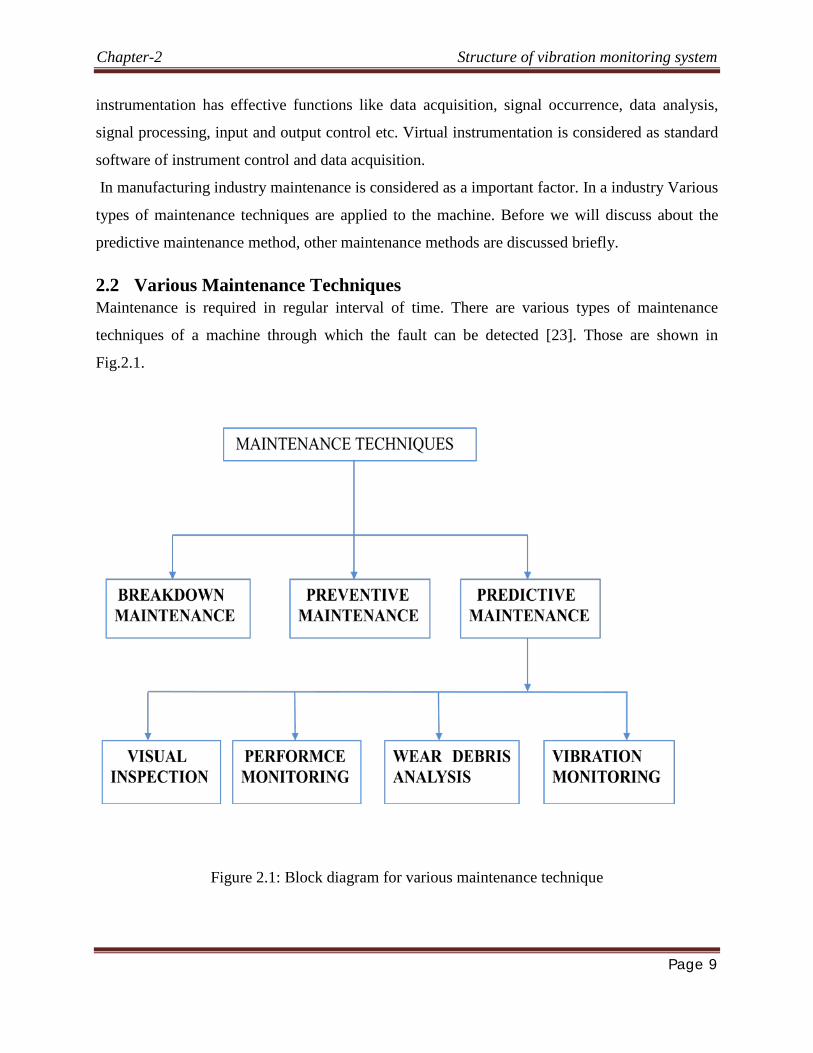
2.2 Various Maintenance Techniques Maintenance is required in regular interval of time. There are various types of maintenance
techniques of a machine through which the fault can be detected [23]. Those are shown in
Fig.2.1.
Figure 2.1: Block diagram for various maintenance technique
Chapter-2 Structure of vibration monitoring system
Page 10
2.2.1 Breakdown maintenance In break down maintenance, regular servicing of machine is not done until the machine breaks
down. Essentially, there is no maintenance technique is performed in the machine until and
unless it produces unaccepted product. So this method is not a good one for maintenance.
2.2.2 Preventive maintenance Preventive maintenance, method is a further improvement of the breakdown maintenance
method. In this method machine requires regular maintenance after stipulated time period
whether the machine runs or not. At that particular period, the work of machine has been stopped
and the plant is removed from the production. At that period the entire machine is trained. For
careful inspection of the machine, routine replacements of specific parts are done. It is costly due
to waste of production time and replacement of parts of machine.
2.2.3 Predictive maintenance In predictive maintenance, the performance & relative data of machinery have been collected.
This helps for planning the maintenance of machinery in advance that results less maintenance
cost. Due to smooth efficiency and productivity, the operating cost can be reduced. It is called on
line condition monitoring of the system. An extensive range of techniques can be applied to
extract features that specify the machine performance and conditions. Therefore an accurate
measure of the machine condition is obtained successfully. By comparing these features,
probable faults conditions and machine’s conditions is predicted. There various common
techniques involve in predictive maintenance technique. These are described shortly in following
steps.
• Visual inspection
• Performance monitoring
• Wear debris analysis
• Vibration monitoring
2.2.3.1 Visual inspection Visual inspection is the most cost effective and simple technique for machine condition
monitoring. Basically this technique consists of the visual inspection of machine, using either by
optical support or the unaided eye. The main advantage of this procedure is that an immediate
and direct signal of machinery condition is available. This is implemented by technician who

Chapter-2 Structure of vibration monitoring system
Page 11
has a great level of skill or experience. The disadvantages of this technique are that it may be
restricted to stationary equipment and direct optical access is required.
2.2.3.2 Performance monitoring In performance monitoring, the collection of data that relate to the performance of the
machine is encompassed. The following two pre conditions are required for this technique.
Firstly, machinery which is steady in normal operation and whose stability reflect in the
parameter under supervision. Secondly, availability of an instrumentation device whose
measurements with respect to equipment is recorded on a periodic continuous mode. By
considering these two preconditions, any change in the normal operation of the machine can be
easily detected. A most important advantage of this technique is that, it has a great ability to
provide a indication of efficiency of the process during normal operation. Some disadvantages
associated with this technique are, in some cases it is very much difficult to relate the out
deviations with the specific component failures and also it is very much necessary to
"fingerprint" the machine performance under normal operating conditions of the machine.
2.2.3.3 Wear debris analysis This technique is used, when it is required to observe components in contact with a fluid and
which are probable to be affected with progressive wear. The quantity and nature of the wear
debris is revealed by the periodic analysis of the fluid. Henceforth the allowed rate, the type and
degree of wear on critical machine components is determined.
2.2.3.4 Vibration monitoring Vibration occurs when a machine runs. Vibration of equipment is normally not good for its
operation. Excessive wear of bearings, electric relays tend to malfunction, cracking, fasteners
become loose, electronic malfunctions through the fracture of solder joints, abrade insulation
around electrical conductors causing short-circuits are caused by the vibration. There are various
causes for which vibration occurs. These are repeating force, looseness, resonance etc. This
technique has been successfully and broadly applied for monitoring t h e operating condit ion
of rotating machinery. It is an important technique in which internal faults of the machine
can be easily detected. Typical components like shafts, rotors, bearings, gears, and drive belts
are monitored using this method. Different types of failure modes like imbalance, misalignment,
wear, rubbing, looseness distortion, resonance, damage and mismatching are easily detected.
Vibration measurements are superior indication of failure of a plant. These are obtained easily
via suitable transducers. Vibration is a very sensitive factor. Gradually developing defects and

Chapter-2 Structure of vibration monitoring system
Page 12
catastrophic failures are detected by vibration monitoring. It offers the advantages of simple and
reliable analysis compared to other methods. There are two common types of machine
monitoring system using vibration. These are Predictive maintenance and machine diagnostic.
Vibration is the excellent indicator of overall machinery condition and the earlier indicator of
developing failure Vibration and other parameters related to the machinery failures [24] are
shown in table 1.This table describes that Vibration is the excellent indicator of machine
monitoring system .
Table 1: Parameters of machinery failures
MODE OF
FAILURES
PARAMETERS
Temperature Pressure Flow Oil analysis vibration
Out of balance x
Misalignment
shaft
x
x
Damaged rolling
element bearing
x
x
x
Damaged
journal bearing
x
x
x
x
x
Damaged or
worn gear
x
x
Mechanical
looseness
x
Noise x
Cracking x
Chapter-2 Structure of vibration monitoring system
Page 13
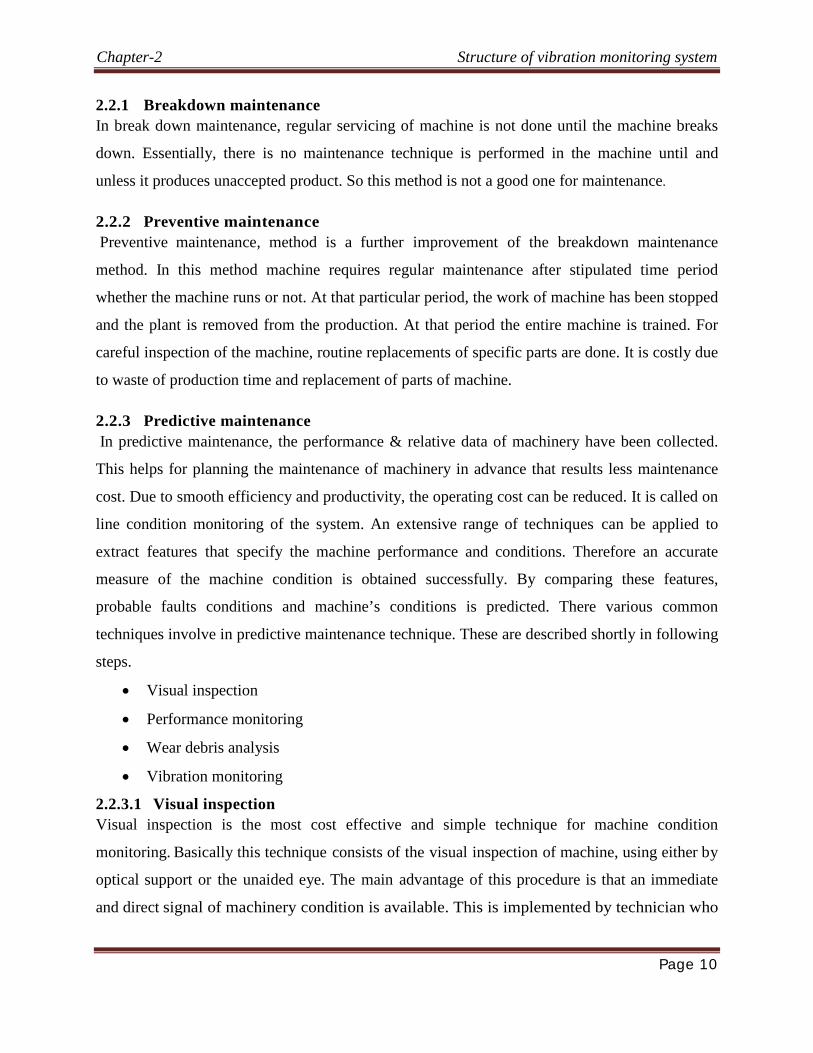
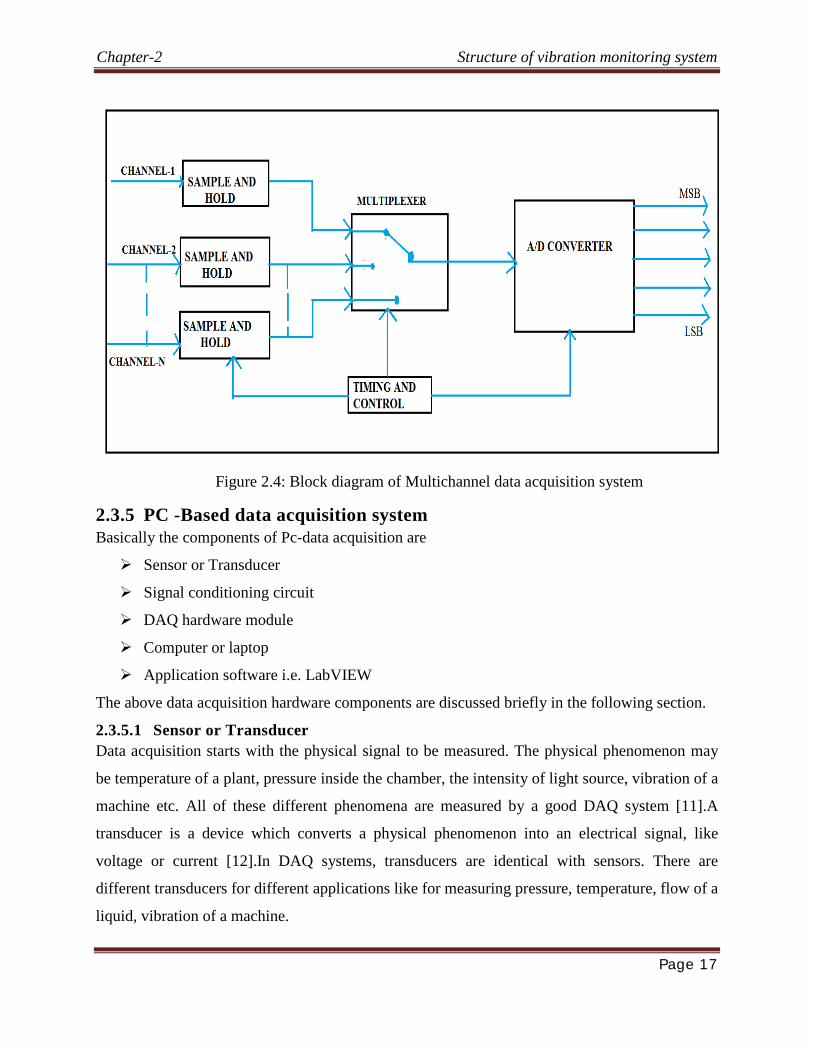
2.3 Components of Vibration Monitoring System Vibration monitoring and Analysis system consists of following components: sensor system,
vibration signal acquisition, vibration signal analysis, vibration signal processing, vibration
signal display and recording [25].The structure of the vibration monitor system is shown in
Fig.2.2.In vibration monitoring system, different components like accelerometer transducer,
amplifier, data acquisition card, and computer are required. For controlling of machine, motor
control unit is required. In this system, data acquisition is considered as hardware of the system.
The LabVIEW software is installed in the computer for processing of the vibration signal.
Figure 2.2: Component of vibration monitoring system
2.3.1 Machine Machine condition monitoring is very significant role in many plants as any blackout can lead to
both materials and financial losses. For example motor is the one of the important equipment to
convert electrical energy to mechanical energy in the modern production, and it plays an
important role in the recent industrial plants. Typical components of a machine like shafts,
bearing, gears, rotors, drive belts are monitored. Common problem associated with the machine
components are Imbalance, misalignment, ball bearing, looseness, bent shaft, journal bearing,
gear problem, impeller blade problem, motor problem etc. In this work, Virtual instrumentation
and vibration analysis are applied to motor to monitor and detect various failures. When a
Vibration Signal
MACHINE (MOTOR, FAN)
ACCELEROMETER TRANSDUCER
COMPUTER (ANALYSIS AND DISPLAY)
CHARGE AMPLIFIER
DATA ACQUISITION CARD
Analog Signal
Digital Signal
Chapter-2 Structure of vibration monitoring system
Page 14
machine runs, it creates vibration .this vibration give a vibration signal which is sensed by an
acceleration transducer. Acceleration transducer mounted on the machine.
2.3.2 Acceleration transducer Transducer converts a signal in one form to another form of energy. There are various types of
energy are available the nature, these are electrical, mechanical, electromagnetic, light, chemical,
acoustic or thermal energy. Transducers are generally used in measuring instruments [1-3].The
selection of sensors and the ways they are mounted on a machine are very critical factors in
determining the success of any monitoring program. Some cases, poor quality sensors can easily
give misleading data and also cause a critical machine condition to be absolutely overlooked. So
selection of sensors for vibration monitoring is an important factor. In vibration monitoring and
analysis system, vibration transducer is a machine mounted sensor. Mainly piezoelectric
accelerometer is broadly used transducer for vibration monitoring system. The three constraints
such as displacement, velocity, and acceleration are representing the perceived motion by
vibration monitoring and analysis technique. These parameters can be measured by
accelerometer transducer. The selection procedure of a piezoelectric accelerometer is directly
proportional to displacement, velocity and acceleration of a vibrating machine. This relationship
is depending on the frequencies of interest and the involvement of signal level. Accurate sensor
selection and installation is considered as the determining factor of precise diagnoses of
machinery condition [8].
2.3.2.1 Piezoelectric accelerometer Mostly Piezoelectric (PE) accelerometer is widely used transducer for vibration monitoring and
analysis system. Piezoelectric accelerometer contains piezoelectric crystal element. It is
preloaded by a mass of certain value. The whole assembly is enclosed in a strong protective
covering. An electrical output (low voltage or charge) is generated by the piezoelectric crystal,
when the crystal is physically stressed by the vibration of machine. The crystal is stressed due to
the variable inertial force of the mass and produces an electrical signal proportional to
acceleration of that mass. For acceleration measurement, this small acceleration signal can be
amplified to a standard unit. This acceleration signal is converted (electronically integrated) into
a velocity or displacement signal within the sensor. This is commonly considered as the ICP
(Integrated Circuit Piezoelectric) type transducer or sensor. The piezoelectric accelerometer is
Chapter-2 Structure of vibration monitoring system
Page 15
rockier than a coil magnet sensor. It has an extensive frequency range. It can be performed well
in accurate phase measurements and also in wider temperature range. It resists damage due to
sever vibrations and shocks. Now a days internal amplifier is included in most of the PE
accelerometers (IEPE).It has some advantages, these are; it has provision for providing relative
immunity to the effects of poor cable insulation and high output to weight ratio.
Specifications of the PE accelerometer are given below [24].
i.Flat frequency range(HZ):20-1500HZ or 20-5000HZ
ii.Temperature limitation(°C): -50to +120°C
iii.Sensitivity range(mV/g):100mV/g
2.3.3 Charge amplifier Piezoelectric transducer gives an analog output which is pass throw a charge amplifier .It gives a
moderate output analog signal .That analog signal is satisfied for the data acquisition card. The
instrument amplifier AD629A is adopted for composing charge amplifier with low power
consumption and a high precision [10].
2.3.4 Data acquisition system A data acquisition system is defined as the process in which physical signals are transformed
into electrical signals which are then measured and converted to digital signal for processing,
collection, and storage by a computer. It is the hard ware part of virtual instrumentation. The
analog signal from the charge amplifier goes to data acquisition card. A DAQ system consists of
various components. These are incorporated to following points:
• DAQ system senses the physical variable.
• Conditioning of electrical signal to make it understandable by an A/D converter board.
• It converts the electrical signals into digital signals which are acceptable by computer.
• Process, analyze, and display the acquired digital data with the help of LabVIEW
software.
Data acquisition system can be broadly classified as two types
• Single channel data acquisition system
• Multichannel data acquisition system
Chapter-2 Structure of vibration monitoring system
Page 16
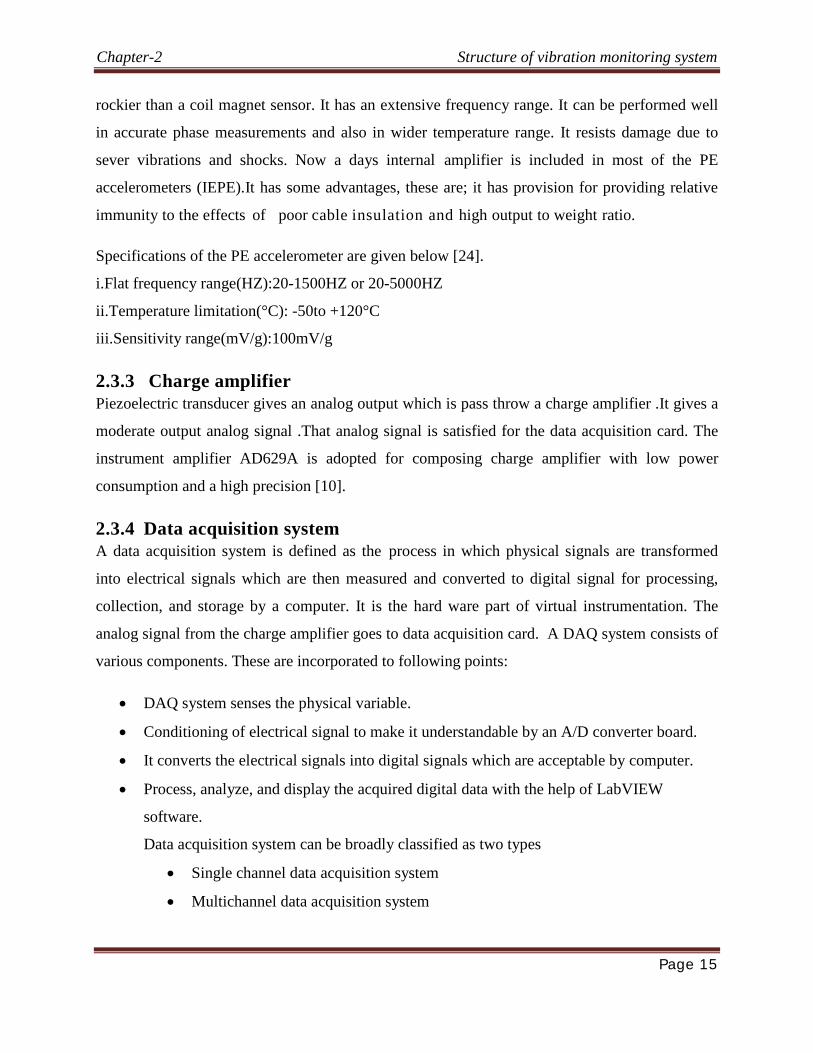
2.3.4.1 Single channel data acquisition system
In single channel data acquisition system, only one type of physical parameter can be sensed at a
time. The basic components of the single channel DAQ are shown in Fig 2.3.
Figure 2.3: Block diagram of single channel data acquisition system
These are mainly are a signal conditioning circuit, a sample and hold circuit and most
significantly an A/D converter circuit [8-10].But when our necessity will be more we don’t want
to lock up within a single channel single channel data acquisition system. Sometimes we need to
acquire multi parameter at a time. At that time we have to adopt multichannel data acquisition
system.
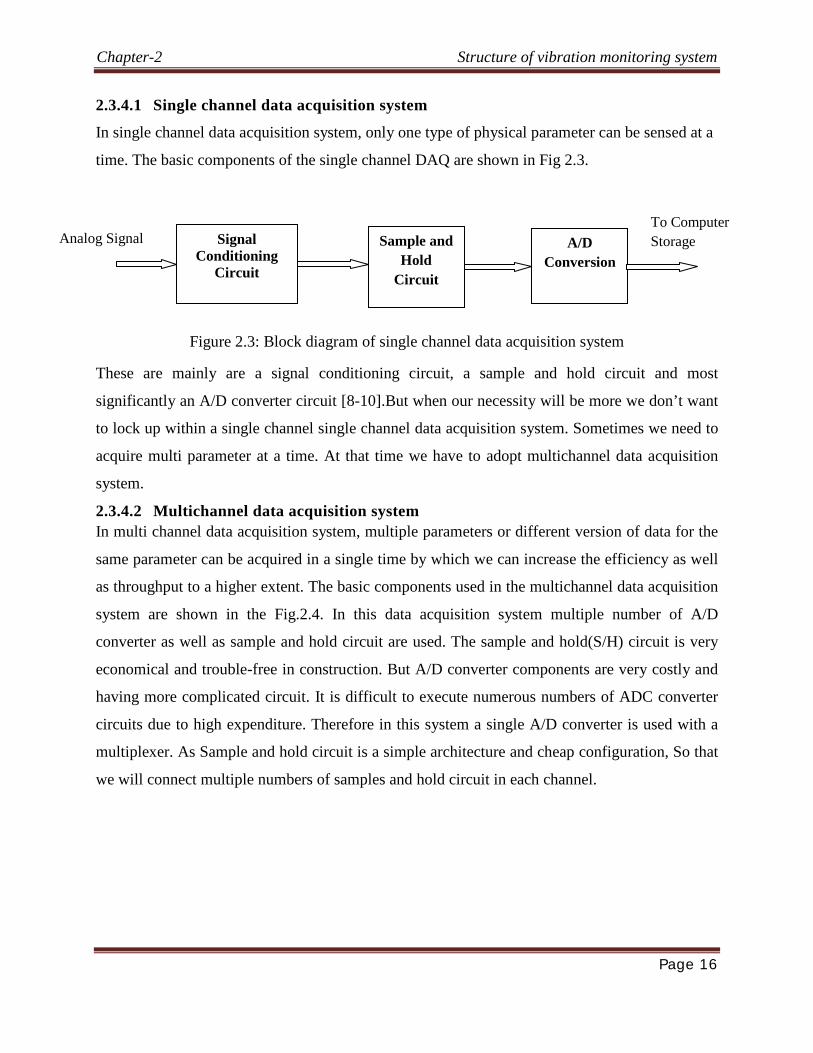
2.3.4.2 Multichannel data acquisition system In multi channel data acquisition system, multiple parameters or different version of data for the
same parameter can be acquired in a single time by which we can increase the efficiency as well
as throughput to a higher extent. The basic components used in the multichannel data acquisition
system are shown in the Fig.2.4. In this data acquisition system multiple number of A/D
converter as well as sample and hold circuit are used. The sample and hold(S/H) circuit is very
economical and trouble-free in construction. But A/D converter components are very costly and
having more complicated circuit. It is difficult to execute numerous numbers of ADC converter
circuits due to high expenditure. Therefore in this system a single A/D converter is used with a
multiplexer. As Sample and hold circuit is a simple architecture and cheap configuration, So that
we will connect multiple numbers of samples and hold circuit in each channel.
Signal Conditioning
Circuit
Sample and Hold
Circuit
A/D Conversion
Analog Signal
To Computer Storage
Chapter-2 Structure of vibration monitoring system
Page 17
Figure 2.4: Block diagram of Multichannel data acquisition system
2.3.5 PC -Based data acquisition system Basically the components of Pc-data acquisition are
Sensor or Transducer
Signal conditioning circuit
DAQ hardware module
Computer or laptop
Application software i.e. LabVIEW
The above data acquisition hardware components are discussed briefly in the following section.
2.3.5.1 Sensor or Transducer Data acquisition starts with the physical signal to be measured. The physical phenomenon may
be temperature of a plant, pressure inside the chamber, the intensity of light source, vibration of a
machine etc. All of these different phenomena are measured by a good DAQ system [11].A
transducer is a device which converts a physical phenomenon into an electrical signal, like
voltage or current [12].In DAQ systems, transducers are identical with sensors. There are
different transducers for different applications like for measuring pressure, temperature, flow of a
liquid, vibration of a machine.
Chapter-2 Structure of vibration monitoring system
Page 18
2.3.5.2 Signal conditioning circuit The signals are generated by transducers are very difficult to measure directly with a DAQ
device hard ware. When we are dealing with noisy environments, high voltages, and extreme
high and low signals, signal conditioning is very essential for an efficient data acquisition
system. It will increase the accuracy of the system. The design procedures of signal conditioning
circuit are different for different application. Various performances of Signal conditioning
accessories are
Amplification of low level signal
Attenuation
Filtration
Isolation
Signal conditioning elements amplify the low-level signals, attenuate and then isolate and filter
them for more precise measurements. In some transducers, voltage or current excitation are used
to generate the output voltage.
2.3.5.3 Data acquisition hardware module The data acquisition hardware module is sandwiched between signal conditioning element and
the laptop or computer. The most important function of this device is that it digitizes the
incoming analog signal to measurable digital signal. Following operations are performed by the
DAQ system hardware
Analog input
Analog output
Timing input /output(I/O)
Digital input/output(I/O)
Counter
Multifunction
The basic components of DAQ hard ware module are given below:
Multiplexer
Sample and Hold circuit
Signal conditioning circuit
ADC(Analog to Digital converter)
DAC(Digital to Analog converter)
Chapter-2 Structure of vibration monitoring system
Page 19
Driver and application software
A. Multiplexer Multiplexer is a switching device in which only one channel from several input channels are
connected to the instrumentation amplifier circuit at a time. When the signals are acquired from
several input channels, the multiplexer rotates through the channels by connecting them one by
one to the amplifier. The order of the multiplexer is controlled by LabVIEW software [1-2].
B. Sample and Hold circuit
In many systems, sample and hold circuit(S/H) is used on the input to the ADC circuit for
freezing the signal while the ADC circuit digitizes the input signal. The errors are prevented due
to changes in the signal throughout the digitization process. In some implementations, as soon as
the signals have been grabbed by the sample and hold circuit the multiplexer is switched to the
next channel in a sequence. The digitization process is allowed to proceed in corresponding with
the settling time of the amplifier and multiplexer. This process is enhancing throughput. Sample
and hold circuits are also used to capture transient signals.
C. Signal conditioning circuit
The function of signal conditioning circuit is same as it was explained in the previous section.
The only variation in this section is that the signal conditioning circuit is used inside the DAQ
hardware module. Generally an Instrumentation amplifier is employed as a signal conditioning
circuit in a DAQ module [8].The function of the amplifier is that it amplifies the analog signal
which is suitable for ADC circuit.
D. Filtering
A filter is used to remove the unwanted signals from the acquired signal which is to be measured.
If the noise signals are not removed, they will imprecisely appear in the acquired signals within
the input bandwidth of the measuring vibrator device. Filtering can be implemented in both in
software and hard ware. In most of the cases noise is created by overhead lights and AC power
like computer power supply. Noise is occurred at around 60 Hz. A low pass filter can be used to
remove noise having a cut-off frequency less than 60 Hz.
E. ADC (Analog to Digital converter)
An analog to digital converter (ADC) converts the analog signal to into digital signal which is
then sent to the computer for processing analyzing the signal. The analog input circuitry merges
Chapter-2 Structure of vibration monitoring system
Page 20
with the A/D converter to acquire analog signal, so that the shape, level, frequency of the signal
can be analyzed and measured [10].There are three types of A/D converter are there like flash
converter, dual ramp, successive approximation. Generally in industrial application, successive
approximation is used as an effective DAC.
F. DAC (Digital to Analog converter)
Digital to analog converter converts the digital signal to analog signal. Digital numbers are
acquired from the computer through an I/O interface circuitry. The output analog signal is
acquired through an I/O connector. A DAC is essential for generating DC signals with specific
level, frequencies and shapes.
G. Driver and application software
The entire system is transformed into a single integrated module through DAQ software. As a
result a control action can be taken over the DAQ hardware module. The DAQ module will not
perfectly work without applying any software to drive or control the hardware module [13,
14].Driver software is software which is easily communicated with the data acquisition hardware
module. The intermediate layer is formed by the driver software between hard ware module and
application software. The application layer is a development environment in which application
are build to meet a specific criteria. It is also a configuration-based program having preset
functionality. Application software includes analysis and presentation capability to driver. Using
application software, analysis and presentation abilities are added to the driver software.
Generally there are three interfaces of DAQ system for sending and receiving the signals [20].
I/O connector
Computer I/O interface circuitry & Real-Time System Integration (RTSI) Bus There are various factors, which are affecting the performance of data acquisition system. These
are signal conditioning requirement, resolution, range, gain, sampling frequency and connection
to ground terminal. The analog to digital conversion is followed by various steps like sampling,
quantization and encoding. Sampling is a process in which the data is acquired by an ADC. An
analog signal is sampled at discrete time periods. Sampling frequency is defined as the rate by
which the signal is sampled. The sampling process generates the signal values as a function of
time. The sampling frequency determines the superiority of the analog signal conversion process.
Chapter-2 Structure of vibration monitoring system
Page 21
Higher sampling frequency realizes better conversion of the analog signal to digital signal. The
sampling frequency must be always satisfied Nyquist Theorem [21].
2.3.6 DAQ software In the vibration monitoring system, computer acts as a software of virtual instrumentation. From
the data acquisition card the digital signal is going to the computer. Here the analysis of the
vibration signal is done by LabVIEW software. The signal processing is done in terms of time
domain and frequency domain .The failure analysis of the vibration signal is done here. And at
last the actual result will be displayed by the computer. For which we can take the control action
in the machine. All the processes like signal processing, analysis, storage, display are done by
using the LabVIEW software. There is other different programmable software are available for
signal analysis and monitoring, such as
• C, C++, Visual C++
• Fortran
• Visual Lab with VTX
• Matlab
But all the above software has many disadvantages, such as they occupy large memory, difficult
to write an error less lengthy code. These are very complex and time consuming. To avoid the
above disadvantages LabVIEW software is used as graphical programming language. Here icons
are used to create application instead of line of text. For this reason LabVIEW is very popular. It
has verity of application such as data acquisition, signal processing, signal analysis, signal
monitoring and control.
Chapter-2 Structure of vibration monitoring system
Page 22
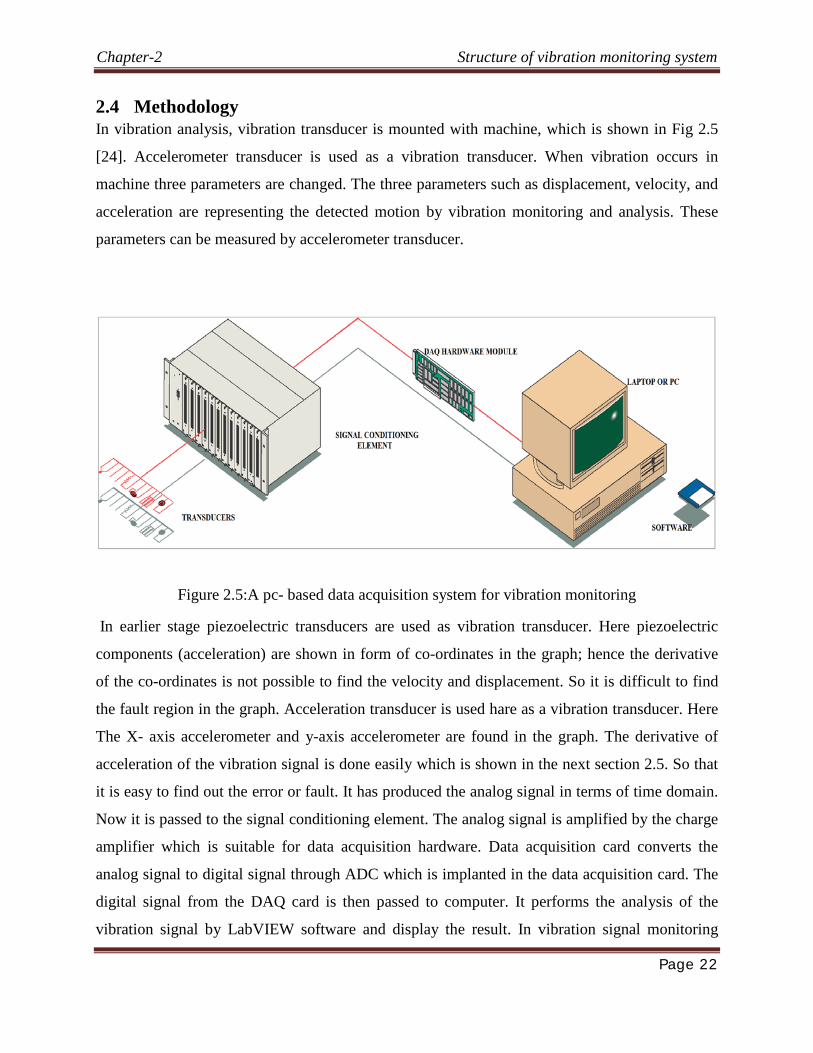
2.4 Methodology In vibration analysis, vibration transducer is mounted with machine, which is shown in Fig 2.5
[24]. Accelerometer transducer is used as a vibration transducer. When vibration occurs in
machine three parameters are changed. The three parameters such as displacement, velocity, and
acceleration are representing the detected motion by vibration monitoring and analysis. These
parameters can be measured by accelerometer transducer.
Figure 2.5:A pc- based data acquisition system for vibration monitoring
In earlier stage piezoelectric transducers are used as vibration transducer. Here piezoelectric
components (acceleration) are shown in form of co-ordinates in the graph; hence the derivative
of the co-ordinates is not possible to find the velocity and displacement. So it is difficult to find
the fault region in the graph. Acceleration transducer is used hare as a vibration transducer. Here
The X- axis accelerometer and y-axis accelerometer are found in the graph. The derivative of
acceleration of the vibration signal is done easily which is shown in the next section 2.5. So that
it is easy to find out the error or fault. It has produced the analog signal in terms of time domain.
Now it is passed to the signal conditioning element. The analog signal is amplified by the charge
amplifier which is suitable for data acquisition hardware. Data acquisition card converts the
analog signal to digital signal through ADC which is implanted in the data acquisition card. The
digital signal from the DAQ card is then passed to computer. It performs the analysis of the
vibration signal by LabVIEW software and display the result. In vibration signal monitoring

Chapter-2 Structure of vibration monitoring system
Page 23
system, the hard ware module of 9234 is used as a data acquisition card. This hardware module
has the maximum voltage of +10v. The maximum voltage range is -10v to+10v.The ADC
resolution of this module is 16 bit.
2.5 Result and Discussion In this section, the LabVIEW implementation for generating the vibration signal in terms of
acceleration is explained briefly. When machine is vibrated, its acceleration, velocity and
displacement have been changed proportionately. The velocity and displacement of the vibration
signal is designed by doing single and double derivation of acceleration of vibration signal
respectively. The block diagram of double integration of acceleration is shown in Fig.2.5.The
front panel of double integration of acceleration is displayed in Fig.2.6.
Figure 2.6: Block diagram of double integration of acceleration
Using the block diagram which shown in Fig.2.5, the acceleration of a vibrator machine is
simulated. Many sub VIs are implemented for finding the velocity and displacement using single
and double derivative of acceleration respectively. As circular motion is produced by vibrating of
machine, XY plotter is implemented to find the X-axis and Y-axis of circular motion.

Chapter-2 Structure of vibration monitoring system
Page 24
Figure 2.7: Front panel of double integration acceleration
The acceleration signal and double integration of it are clearly shown in the front panel which is
displayed in Fig.2.6. It is clearly shown that the acceleration signal has some fluctuation on its
graph. Because some noise are added while the machine is vibrated. It is eliminated using the
digital filter like Butterworth, Chebyshev while integration has been done. Now the noise free
vibration signal is got in terms of acceleration and displacement. It is time domain form. For
finding the machine fault, vibration signal processing is performed which is explained in the next
chapter.

Page 25
CHAPTER 3 MONITORING AND ANALYSIS OF VIBRATION SIGNAL
Vibration Signal Processing
Time Domain Signal Processing
Frequency Domain Signal Processing
Methodology
Result and Discussion
Chapter-3 Monitoring and analysis of vibration signal
Page 26
3 VIBRATION SIGNAL PROCESSING
3.1 Introduction Signal processing is a very important process for monitoring and analysis of signal. To use the
digital signal processing technique, the acquired analog signal must be converted to digital
signal. It is performed by using an analog to digital converter (ADC).The most significant
parameter for processing of acquired analog signal is sampling rate. The quality of analog signal
conversion is determined by sampling rate.
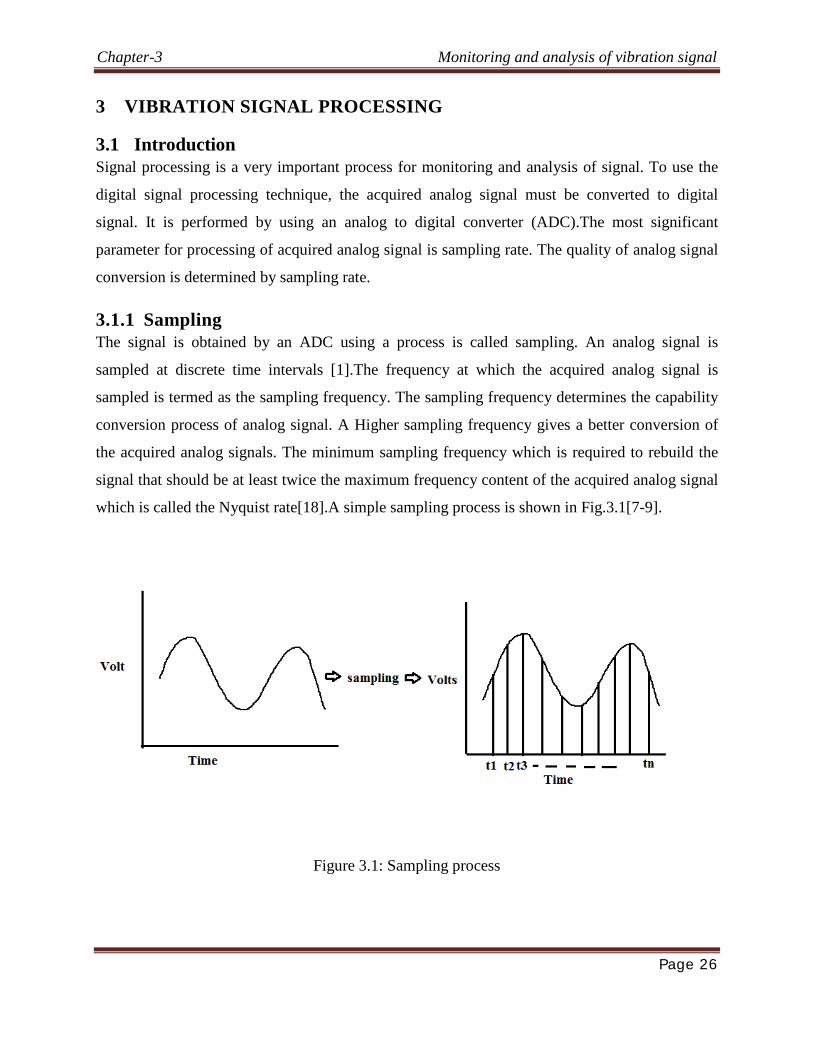
3.1.1 Sampling The signal is obtained by an ADC using a process is called sampling. An analog signal is
sampled at discrete time intervals [1].The frequency at which the acquired analog signal is
sampled is termed as the sampling frequency. The sampling frequency determines the capability
conversion process of analog signal. A Higher sampling frequency gives a better conversion of
the acquired analog signals. The minimum sampling frequency which is required to rebuild the
signal that should be at least twice the maximum frequency content of the acquired analog signal
which is called the Nyquist rate[18].A simple sampling process is shown in Fig.3.1[7-9].
Figure 3.1: Sampling process
Chapter-3 Monitoring and analysis of vibration signal
Page 27
3.1.2 Sampling rate One of the most important elements of an analog input or analog output measurement system is
the frequency or rate at which the ADC samples an acquired analog signal and generates the
output signal in digitize form. Sampling rate determines the rate of A/D or D/A conversion
process. If sampling process is very slow, it will result the aliasing of the signal. It is a
misrepresentation of the analog signal. For complete recovering of the continuous signal, the
sampling rate must be satisfied the Shannon’s sampling theorem. The sampling theorem is given
in the following equation 3.1.
𝑓𝑠 > 2𝑓𝑚𝑎𝑥 (3.1)
Where 𝑓𝑠- sampling frequency
𝑓𝑚𝑎𝑥 -maximum frequency present in the signal
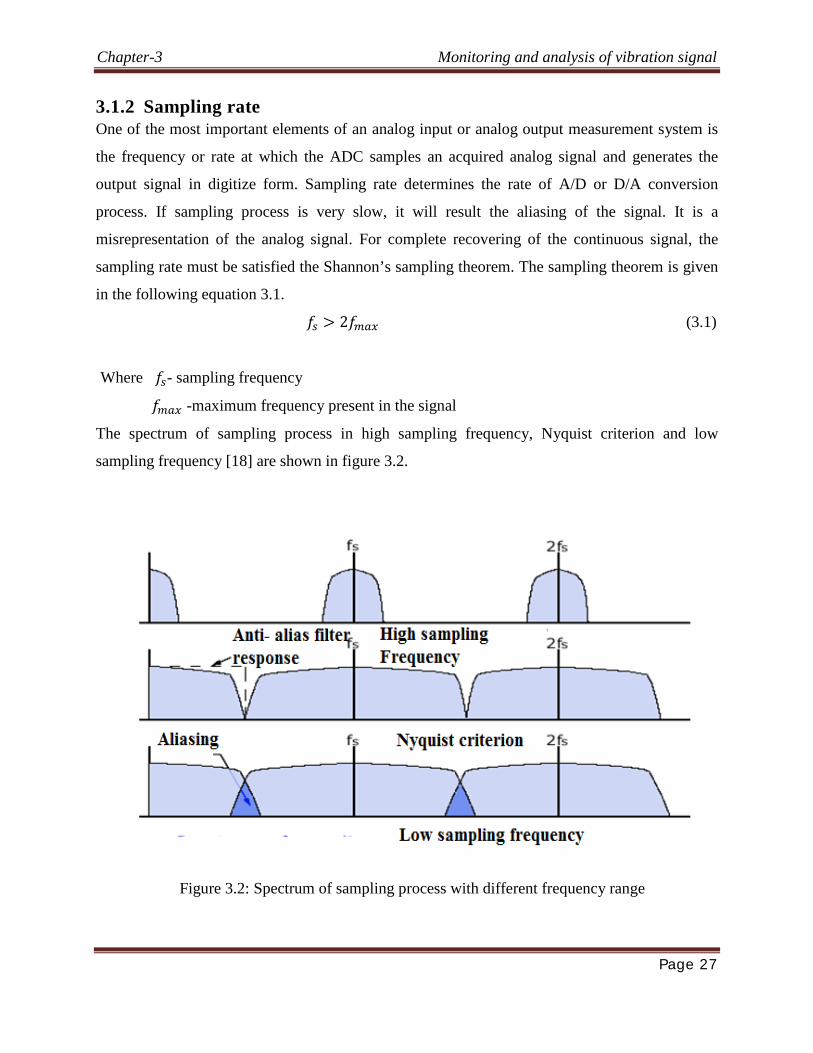
The spectrum of sampling process in high sampling frequency, Nyquist criterion and low
sampling frequency [18] are shown in figure 3.2.
Figure 3.2: Spectrum of sampling process with different frequency range
Chapter-3 Monitoring and analysis of vibration signal
Page 28
If the sampling frequency is equal to or less than twice the maximum frequency present in the
input signal then a signal having a lower frequency is generated. This is called aliasing effect of
the process. Resolution is also an important factor for analog signal conversion process.
Resolution of a converted signal is defined as the function of the number bits the A/D converter
is used to represent the digital signal.
3.2 Time Domain Signal Processing Time domain signal processing is defined as the storage, detection and manipulation of the
sampled analog information by using time difference variable. Time domain signal processing
offers a means to execute analog signal processing functions in any technology using the most
important basic element i.e. propagation delay. In spite of voltage or current, time is considered
as the effective variable for all the computations. The time-domain signal analysis extract the
signal characteristics of the value and contain the display of real-time signal, including the time
characteristics of the value, amplitude characteristics of the value and phase characteristics of the
value. In this chapter the characteristics of the value of the cycle signal and amplitude
characteristics of the signal are discussed. Amplitude characteristics of the signal are generally
described by peak, average, RMS etc. Time characteristics of the value of the signal are
normally described by the frequency and cycle of the signal. In engineering test, phase
characteristics of the value of the signal are generally described by the relative phase angle of
the two cycle signal and initial phase angle of the signals with the same frequency [26].
The samples of the signals are acquired from the DAQ device. These are in the form of time
domain representation. This representation provides the amplitude signal, at that instant of time
the signal has been sampled. It does not provide the better signal processing, which is discussed in
the next section.
3.3 Frequency Domain Signal Processing Signals are converted from space domain or time to the frequency domain generally through the
Fourier transform i.e. Discrete Fourier Transform (DFT) or Fast Fourier Transform (FFT). The
signal information is transformed to a magnitude and phase component of each frequency using
the Fourier transform.
The signal used frequency as the x-axis variable is to describe phase and frequency spectrum as
well as amplitude spectrum. The signal’s frequency is studied by spectrum analysis where in
Chapter-3 Monitoring and analysis of vibration signal
Page 29
spectrums of structures such as amplitude and phase is the important features. In research and
development in addition to engineering technology, spectrum analyzer is a very important
analysis of the test apparatus. The analysis involves signal’s phase spectrum and amplitude
spectrum, power spectrum, FFT transform, filtering etc.
The representation of a signal in terms of its individual frequency components is known as the
frequency domain representation of the acquired signal. The frequency domain representation
gives more information about the signals and the system by which the signal has been generated.
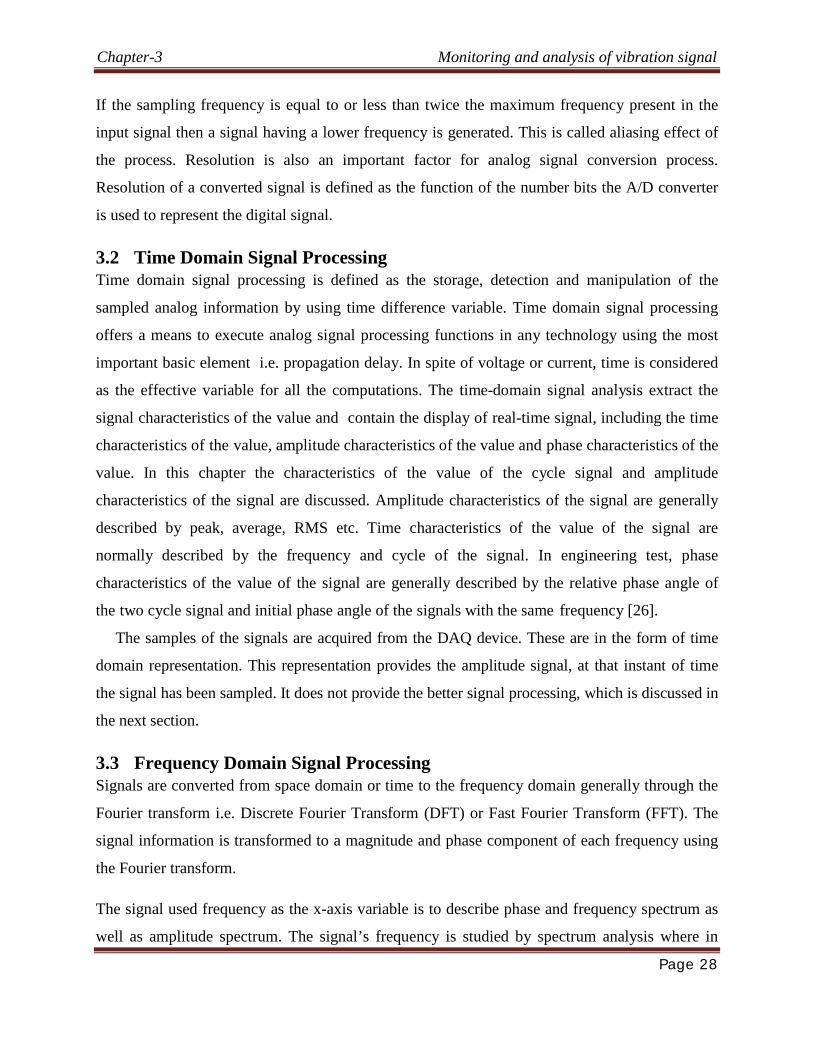
The Frequency domain signal processing and analysis of a vibration signal is performed by
following steps which is shown in Fig.3.3.
Figure 3.3: Block diagram for frequency domain signal processing
3.3 .1 Discrete Fourier Transform The discrete-time Fourier transform (DTFT) gives an alternative depictions for discrete-time (DT)
sequence. By using DTFT, a DT sequence x[k] is transford into a function X(Ω) in that DTFT frequency
domain.The independent variable Ω(=wT) is confined to the range –π ≤ Ω <π. It is also contineuous in
nature.The use of digital computers and specialized hardwares are increased in different applications like
signal processing, monitoring,control of different machines.Hence now a days the signal transformation
has focused which is appropriate for digital computations. As the signal is continuous in nature, direct realization of the DTFT is not appropriate for such a digital devices. The discrete Fourier transform
(DFT) is introduced for this reason. DFT can be implimented efficiently on digital computers. The DTFT
Frequency domain signal processing
DFT/FFT
Windowing
Digital Filter
Chapter-3 Monitoring and analysis of vibration signal
Page 30
of the signal x (k) is a continuous function of “w”. It is discretized for storing on the digital
computer. The DTFT 𝑋2𝜋(w) of signal x (k) is written as the following equation 3.2
𝑋2𝜋(𝑤)=∑ 𝑥(𝑘)𝑒−𝑗𝑤𝑘∞𝑘=−∞ (3.2)
For k=all integers
Using the discrete Fourier transform (DFT), a finite list of samples of a function which is
equally-spaced is converted into a finite combination of complex sinusoidal signals. That
organized by their frequencies which have same sample values. It can convert the sampled
function of its original domain (time or position) to the frequency domain. The DFT is the most
important discrete transform (DT) which is used to perform Fourier analysis in various practical
applications. In digital signal processing, the function is a signal or any quantity that varies over
time, such as the pressure of a sound wave, a radio signal, or daily temperature readings,
vibration monitoring of a machine sampled over a finite time intervals (often defined by a
window function).The DFT is also used to efficiently solve partial differential equation,
convolution or multiplying large integers.
As DFT is dealing with a finite amount of data, DFT is implemented in computers by various
numerical algorithms and in the dedicated hardware. These implementations are also employed
efficiently by using the fast Fourier transform (FFT) algorithms. So that, the terms "DFT" and
"FFT" are used interchangeably. The terminology is further known by the synonym finite Fourier
transform of the DFT.
The series of N complex numbers x0, 𝑥1 ..., xN−1 is transformed into an N-periodic series of
complex numbers .It is performed using the DFT formula which is given in the following
equation 3.3.
𝑋𝑘=∑ 𝑥𝑛𝑁−1𝑛=0 𝑒−𝑗2𝜋𝑛𝑘/𝑁 (3.3)
From the DFT of a signal, the time domain signal is rebuild by using the inverse Fourier transfer (IDFT) which is given in the following equation 3.4.
𝑥𝑛=1/𝑁∑ 𝑋𝐾𝑁−1𝑘=0 𝑒𝑗2𝜋𝑛𝑘/𝑁 (3.4)

Chapter-3 Monitoring and analysis of vibration signal
Page 31
3.3.1.1 Windowing In practical application only a finite number of samples of the signal are obtained. When
the DFT or FFT is used to extract the frequency content of a signal, it is intrinsically assumed
that the data is a single period of a periodically repeating waveform. Leakage exists because of
the finite time record of the input signal. An appropriate window is usually selected so as to
reduce the spectral leakage. That is by applying a smoothing window function to the data
before it is discrete-time Fourier transformed can greatly minimize spectral leakage.
Types of windowing: Many different types of windows are available in the LabVIEW analysis
library. Some of these windows are Rectangular, Hanning, Hamming, Blackman-Harris,
Triangle, Flat Top and Exponential. The above windows are explained briefly in the following
sub section.
1. Rectangular window The rectangular window (sometimes known as the boxcar or Dirichlet window) is the simplest
window, equivalent to replacing all but N values of a data sequence by zeros, making it appear as
though the waveform suddenly turns on and off .The rectangular windowing function is given by
the following equation i.e.3.5.
W (n) =1 (3.5)
Other windows are designed to moderate these sudden changes because discontinuities have
undesirable effects on the discrete-time Fourier transform (DTFT) and/or the algorithms that produce
samples of the DTFT. The rectangular window is the 1st order B-spline window as well as the 0th
power cosine window
2. Hanning window The Hann window named after Julius von Hann and also known as the Hanning (for being
similar in name and form to the Hamming window), von Hann and the raised cosine window is
defined by the following equations 3.6 and 3.7
W (n) =0.5(1-cos (2πn/N-1)) (3.6)
The unlagged version is given by
𝑊0(n)=0.5(1+cos (2πn/N-1)) (3.7)
Chapter-3 Monitoring and analysis of vibration signal
Page 32
3. Hamming window The window with these particular coefficients was proposed by Richard W. Hamming. This
window is optimized to reduce the maximum side lobe for providing it a height of about one-fifth
that of the Hann window. The hamming window function is expressed by the following equation
3.8.
W(n)=α-β(2πn/N-1) (3.8)
Where, α=0.54
β =1-α=0.46
The unlagged version is given by
𝑊0(n)=W(n+N-1/2) (3.9)
=0.54+o.46cos (2πn/N-1)
4. Blackman window
Blackman windows are defined as:
W (n) =𝑎0-𝑎1cos (2πn/N-1)+𝑎2 cos (4πn/N-1) (3.10)
Where, 𝑎0 =1-α/2; 𝑎1 = ½; 𝑎2 =α/2
By common convention, the unqualified term Blackman window refers to α = 0.16, as this most
closely approximates the "exact Blackman", with 𝑎0= 0.42659, a1 = 0.49656, and a2 = 0.076849.
These exact values place zeros at the third and fourth side lobes.
5. Blackman-Harris window
The Blackman-Harris window function is given by the following equation
W (n)=𝑎0-𝑎1cos(2πn/N-1)+𝑎2cos(4πn/N-1)+𝑎3cos(6πn/N-1) (3.11)
Where, 𝑎0=0.35875; 𝑎2=0.48829; 𝑎3=0.14128; 𝑎4=0.01168
6. Triangle window
The triangular window is defined as
W (n)=1-|𝑛 − (𝑁 − 1)/2/𝑁 − 1| (3.12)
The triangular window is the 2nd order B-spline window.
Chapter-3 Monitoring and analysis of vibration signal
Page 33
3.3.1.2 Digital filters Filtering is the process by which the frequency content of a signal is altered. It is one of the most
commonly used signal processing techniques. In modem digital signal processing the analog
filters are replaced to digital filters by using various signal processing tools. It has applied in
many applications that involve flexibility and programmability. Digital filters have the
following advantages over their analog equivalent:
They are programmable
They are stable and predictable
They do not drift with temperature or humidity and do not require precision components
They have a superior performance-to-cost ratio
Digital filters in LabVIEW have features to control parameter such as filter order, cutoff
frequencies, amount of ripple, and stop band attenuation. LabVIEW offers wide range of
Infinite Impulse Response (IIR) and Finite Impulse Response (FIR) filters such as
Butterworth, Chebyshev , Chebyshev II or Inverse Chebyshev , Bessel, and Elliptic. The
IIR and FIR filters are described briefly.
I. Infinite Impulse Response Infinite impulse response (IIR) is a property of digital signal processing systems. Systems having
this property are identified as IIR systems. IIR system has an impulse response function which is
non-zero through an infinite length of period. The IIR filters are different to finite impulse
response (FIR) filters. FIR filters have fixed duration of impulse responses. The easiest analog
IIR filter is an RC filter which is made up of a single resistor(R) supplied to a node then it is
shared with a only one capacitor(C). These filters have an exponential impulse response
distinguished by an RC time constant. Because the exponential function is asymptotic to a limit,
and thus never settles at a fixed value, the response is considered infinite [26].
In digital IIR filters, the output feedback of the filter is immediately traceable in the equations
which are defining the output. It is very obvious that unlike FIR filters, it is mandatory to
carefully judge the "time zero" case in which the outputs of the filter have not clearly explained.
Design of digital IIR filters is usually dependent on their analog equivalents because there are
ample of works, resources, and straightforward design techniques regarding analog feedback
Chapter-3 Monitoring and analysis of vibration signal
Page 34
filter design. In general, when a digital IIR filter is be implemented, an analog filter(e.g.
Chebyshev filter, butterworth filter, Elliptic filter) is first implemented and then it is converted to
digital filter by applying discretization techniques such as Impulse invariance or bilinear
transform. The Chebyshev filter, Butterworth filter, and the Bessel filter are all included in IIR filters.
These filters are explained with a precise manner in the following sections.
A. Chebyshev filters
Chebyshev filters are analog or digital filters having a steeper roll-off and more pass
band ripple(type I) or stop band ripple (type II) than Butterworth filters. Chebyshev filters have
the property that they minimize the error between the idealized and the actual filter characteristic
over the range of the filter, but with ripples in the passband. This type of filter is named
after Pafnuty Chebyshev because its mathematical characteristics are consequent
from Chebyshev polynomials.Because of the passband ripple inherent in Chebyshev filters; the
ones that have a smoother response in the pass band but a more irregular retort in the stopband
are favored for some applications.
These are the most frequent Chebyshev filters. The gain (or amplitude) response as a function of
angular frequency ω of the nth-order low-pass filter is given by following equation 3.13.
𝐺𝑛(ω)=|𝐻𝑛(𝑗𝜔)|=1/√1 +∈2 𝑇𝑛2(𝜔/𝜔0) (3.13)
Where, ∈=ripple factor.
𝜔0=cut-off frequency
𝑇𝑛( )= Chebyshev polynomial of the nth order.
B. Butterworth filter
The Butterworth filter is a form of signal processing filter considered to have as flat a frequency
response as possible in the passband. It is also referred to as a maximally flat magnitude filter.
An ideal electrical filter should have uniform sensitivity for the wanted frequencies and also
completely reject the redundant frequencies. Such an ideal filter cannot be achieved but it is
shown in succession closer approximations were obtained with increasing numbers of filter
elements of the right values. At the time, filters generated considerable ripple in the passband,
and the choice of component values was highly interactive. Butterworth showed that a low pass
Chapter-3 Monitoring and analysis of vibration signal
Page 35
filter could be designed whose cutoff frequency was normalized to 1 radian per second and
whose frequency response (gain) is given the following equation3.14.
Gain=G(ω)=1/1 + 𝜔2𝑛 (3.14)
Where, ω=Angular frequency
N=Number poles in the filter
C. Bessel filter
A Bessel filter is a category of linear filter with a maximally flat group delay (maximally
linear phase response). An audio crossover system is used based on the Bessel filters. The entire
passband of Analog Bessel filters are characterized by almost constant group delay across, the
wave shape of filtered signals in the pass band is preserved. The Bessel filter is very similar to
the Gaussian filter, and tends towards the same shape as filter order increases. The Bessel filter
has better shaping factor, flatter phase delay, and flatter group delay than a Gaussian of the same
order, though the Gaussian has lower time delay.
Bessel low-pass filter is characterized by its transfer function which shown in the following
equation 3.15.
H(s)=𝜃𝑛(0)/𝜃𝑛(s/𝜔0) (3.15)
Where 𝜃𝑛(s)=Reverse Bassel polynomial
𝜔0=Frequency chosen to give the desired cut-off frequency
II. Finite Impulse Response
In a signal processing system, as finite impulse response (FIR) filter settles to zero in finite
duration of time, the impulse response of the filter is of finite duration. This is opposite
to infinite impulse response (IIR) filters because it has internal feedback and may persists to
respond indefinitely.FIR filters can be analog or digital and discrete-time or continuous-time in
nature. The term digital filter is introduced because these filters are operated on discrete-time
signals. The term finite impulse response is introduced as the filter output is computed with a
weighted, finite sum of present, past, and anticipative values of the filter input, i.e.
Y (n) =∑ 𝑏𝑘𝑀2𝑘=−𝑀1
x[n-1] ( 3.16)
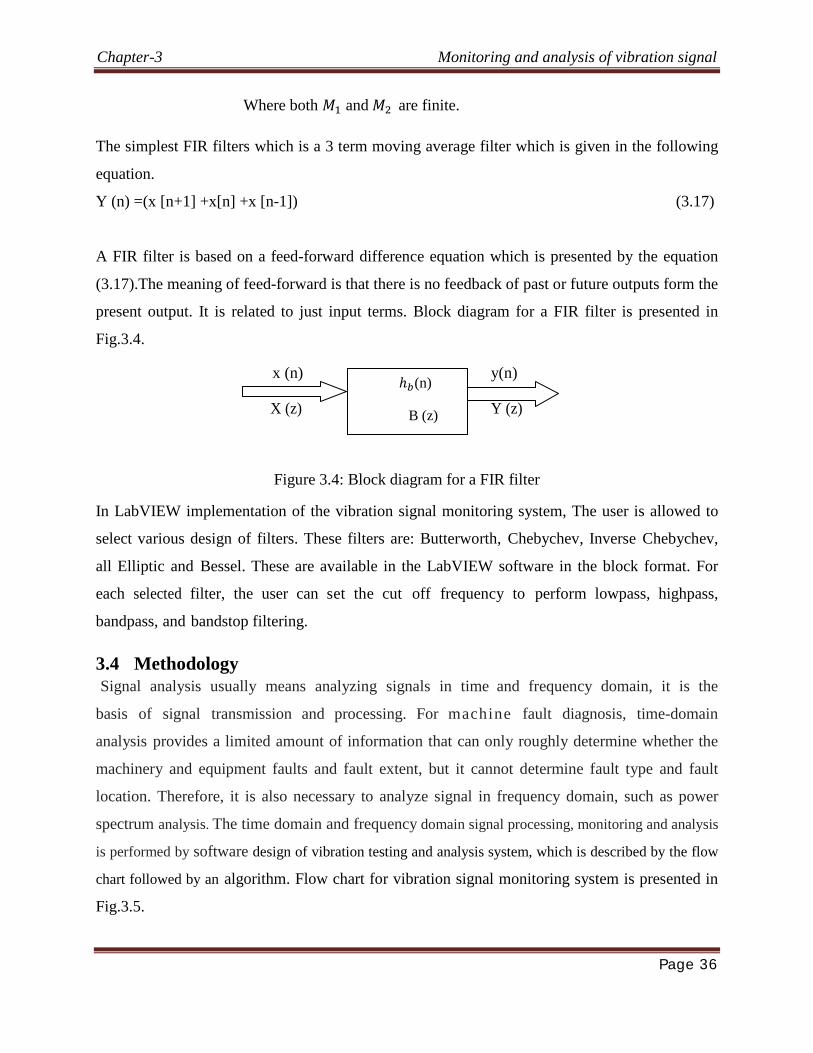
Chapter-3 Monitoring and analysis of vibration signal
Page 36
Where both 𝑀1 and 𝑀2 are finite.
The simplest FIR filters which is a 3 term moving average filter which is given in the following
equation.
Y (n) =(x [n+1] +x[n] +x [n-1]) (3.17)
A FIR filter is based on a feed-forward difference equation which is presented by the equation
(3.17).The meaning of feed-forward is that there is no feedback of past or future outputs form the
present output. It is related to just input terms. Block diagram for a FIR filter is presented in
Fig.3.4.
x (n) y(n)
X (z) Y (z)
Figure 3.4: Block diagram for a FIR filter
In LabVIEW implementation of the vibration signal monitoring system, The user is allowed to
select various design of filters. These filters are: Butterworth, Chebychev, Inverse Chebychev,
all Elliptic and Bessel. These are available in the LabVIEW software in the block format. For
each selected filter, the user can set the cut off frequency to perform lowpass, highpass,
bandpass, and bandstop filtering.
3.4 Methodology Signal analysis usually means analyzing signals in time and frequency domain, it is the
basis of signal transmission and processing. For machine fault diagnosis, time-domain
analysis provides a limited amount of information that can only roughly determine whether the
machinery and equipment faults and fault extent, but it cannot determine fault type and fault
location. Therefore, it is also necessary to analyze signal in frequency domain, such as power
spectrum analysis. The time domain and frequency domain signal processing, monitoring and analysis
is performed by software design of vibration testing and analysis system, which is described by the flow
chart followed by an algorithm. Flow chart for vibration signal monitoring system is presented in
Fig.3.5.
ℎ𝑏(n)
B (z)
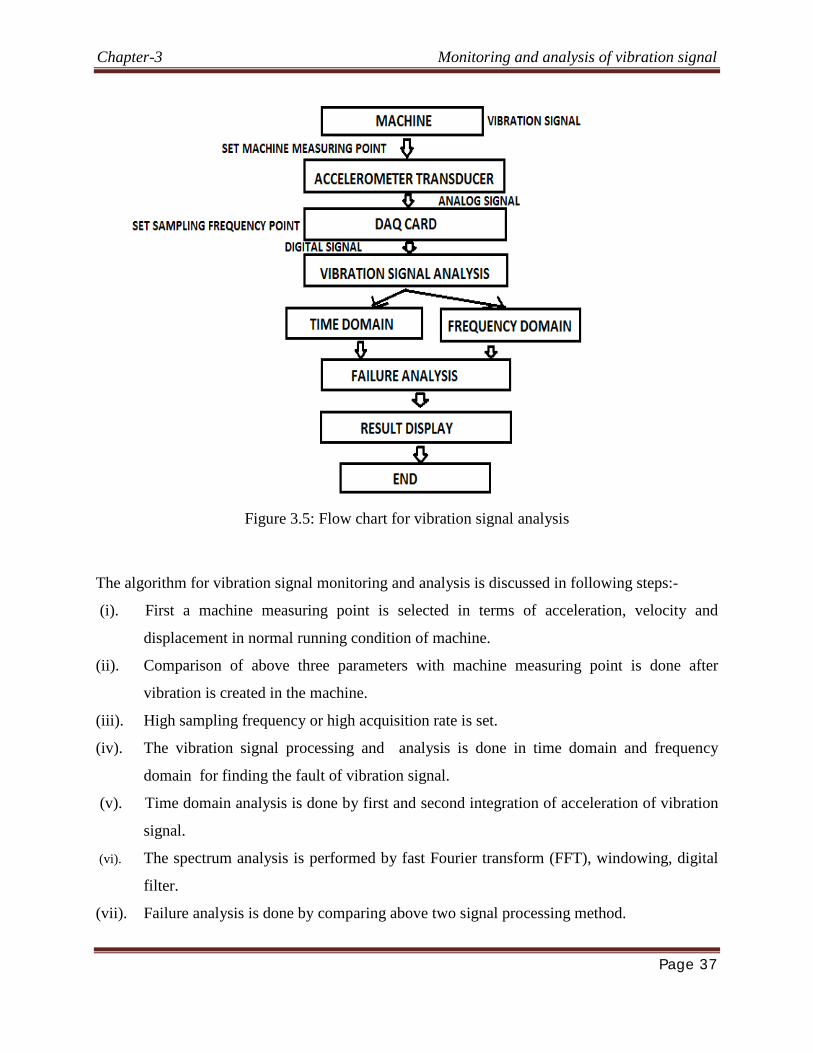
Chapter-3 Monitoring and analysis of vibration signal
Page 37
Figure 3.5: Flow chart for vibration signal analysis
The algorithm for vibration signal monitoring and analysis is discussed in following steps:-
(i). First a machine measuring point is selected in terms of acceleration, velocity and
displacement in normal running condition of machine.
(ii). Comparison of above three parameters with machine measuring point is done after
vibration is created in the machine.
(iii). High sampling frequency or high acquisition rate is set.
(iv). The vibration signal processing and analysis is done in time domain and frequency
domain for finding the fault of vibration signal.
(v). Time domain analysis is done by first and second integration of acceleration of vibration
signal.
(vi). The spectrum analysis is performed by fast Fourier transform (FFT), windowing, digital
filter.
(vii). Failure analysis is done by comparing above two signal processing method.
Chapter-3 Monitoring and analysis of vibration signal
Page 38
(viii). Fault regions are obtained and result is displayed. Hence the control action can be taken.
By following the above steps the vibration monitoring can be implemented by LabVIEW
simulation system which is discussed in the next section.
3.4.1 Description of the flow chart The flow chart which is shown in Fig.3.5 is described briefly by which the vibration monitoring system is
easy to perform. In the normal condition of the machine, motor measuring point is selected. In the
running condition of the machine, vibration signal is created. When vibration occurs in machine
three parameters are changed. These are displacement, velocity and acceleration of machine.
Accelerometer transducer is directly proportional to the velocity, displacement, acceleration and
frequency of signal. By above factors, the machinery condition can be accurately diagnosed.
Then the control action can be taken on the machine. The techniques for controlling of vibration
signal are discussed in the next chapter.
Accelerometer transducer converts the physical signal that is vibration signal into analog
signal. The analog signal will go to data acquisition card. Here the sampling rate or acquisition
rate has to set. Data acquisition card must have high acquisition rate. Data acquisition card must
have high acquisition rate, because if the vibration of the machine increases, consequently
velocity of the machine also increases. The acquisition rate must also be increased to prevent
aliasing effect of the wave form and to calculate the component frequency of the displacement.
So data acquisition card must be taken, which have high acquisition rate. Data acquisition card
gives the digital signal. It converts analog signal to digital signal. The digital signal from the data
acquisition card is in time domain form.
Firstly, interfering signals among vibration signal is filtered out by band-pass filter in
testing motor; and then to get speed signal and displacement signal through first integral and
quadratic integral, and it is available to calculate speed RMS and peak-peak of displacement;
finally, frequency information can be obtained by means of power spectral analysis. The all the
above methods are implemented using the LabVIEW software which discussed in the simulated
result and discussion chapter.
3.5 Simulation Result and Discussion From the second chapter, the vibration signal in form of time domain is generated .For diagnosis
of machine faults ,the vibration signal which is acquired from the data acquisition system is
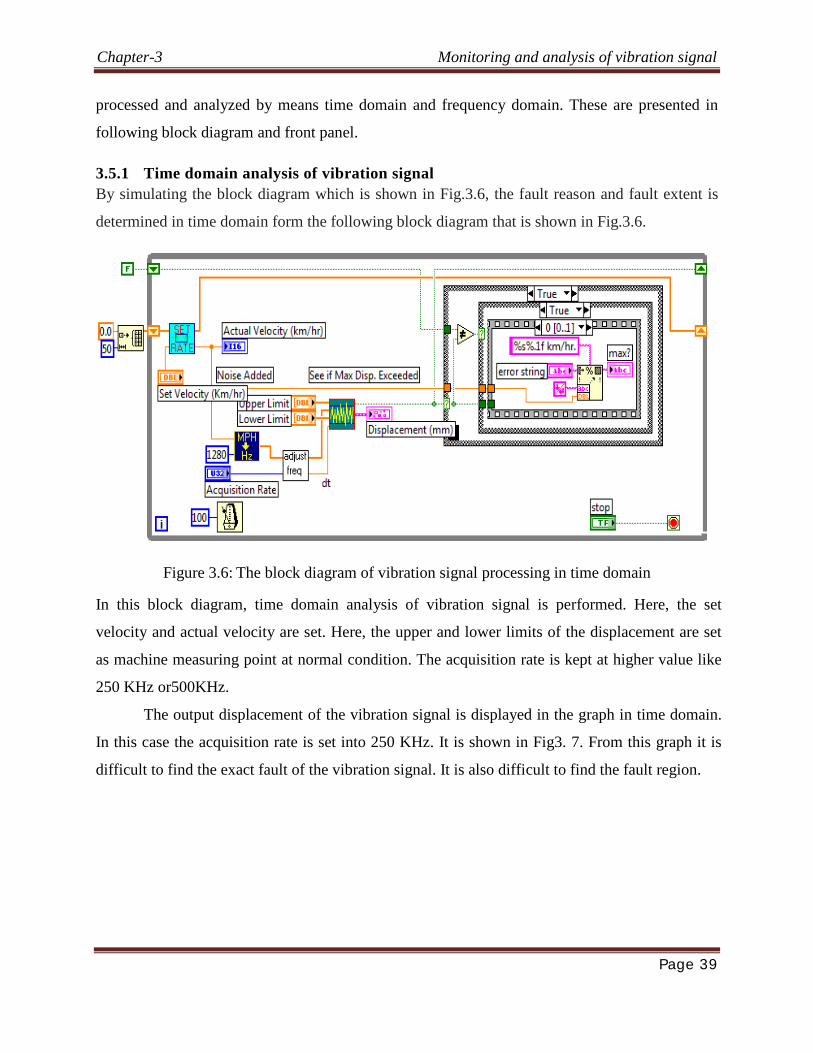
Chapter-3 Monitoring and analysis of vibration signal
Page 39
processed and analyzed by means time domain and frequency domain. These are presented in
following block diagram and front panel.
3.5.1 Time domain analysis of vibration signal By simulating the block diagram which is shown in Fig.3.6, the fault reason and fault extent is
determined in time domain form the following block diagram that is shown in Fig.3.6.
Figure 3.6: The block diagram of vibration signal processing in time domain
In this block diagram, time domain analysis of vibration signal is performed. Here, the set
velocity and actual velocity are set. Here, the upper and lower limits of the displacement are set
as machine measuring point at normal condition. The acquisition rate is kept at higher value like
250 KHz or500KHz.
The output displacement of the vibration signal is displayed in the graph in time domain.
In this case the acquisition rate is set into 250 KHz. It is shown in Fig3. 7. From this graph it is
difficult to find the exact fault of the vibration signal. It is also difficult to find the fault region.
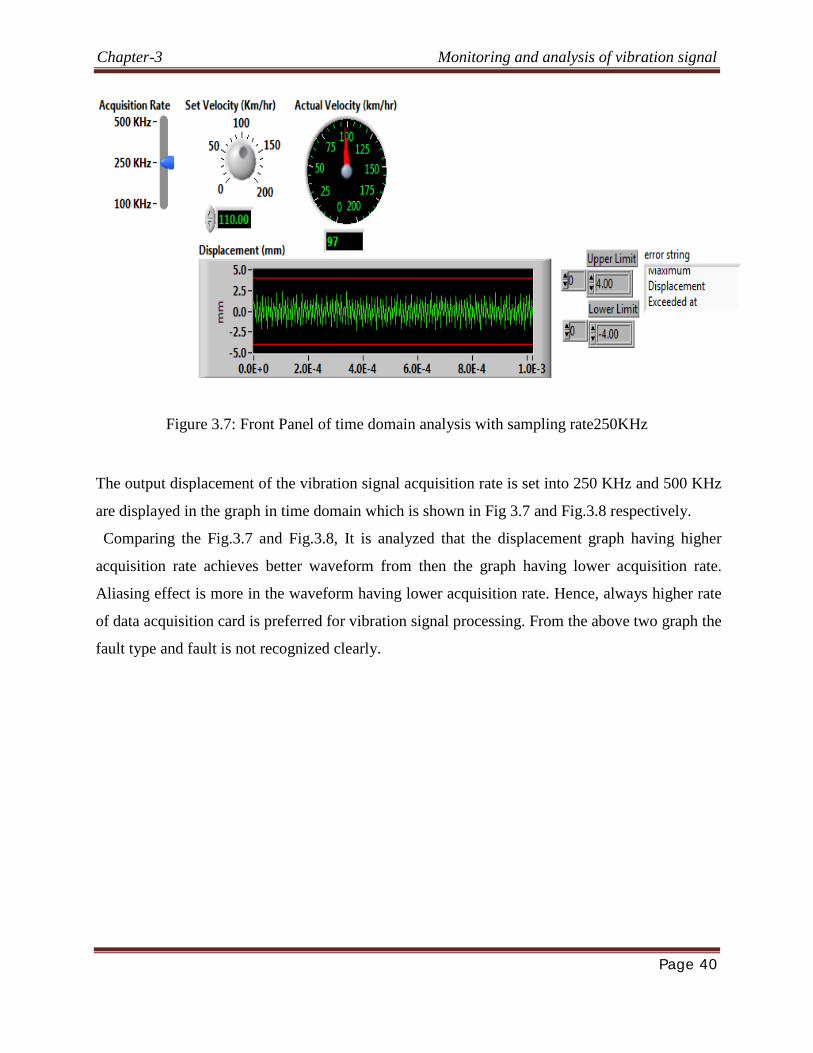
Chapter-3 Monitoring and analysis of vibration signal
Page 40
Figure 3.7: Front Panel of time domain analysis with sampling rate250KHz
The output displacement of the vibration signal acquisition rate is set into 250 KHz and 500 KHz
are displayed in the graph in time domain which is shown in Fig 3.7 and Fig.3.8 respectively.
Comparing the Fig.3.7 and Fig.3.8, It is analyzed that the displacement graph having higher
acquisition rate achieves better waveform from then the graph having lower acquisition rate.
Aliasing effect is more in the waveform having lower acquisition rate. Hence, always higher rate
of data acquisition card is preferred for vibration signal processing. From the above two graph the
fault type and fault is not recognized clearly.
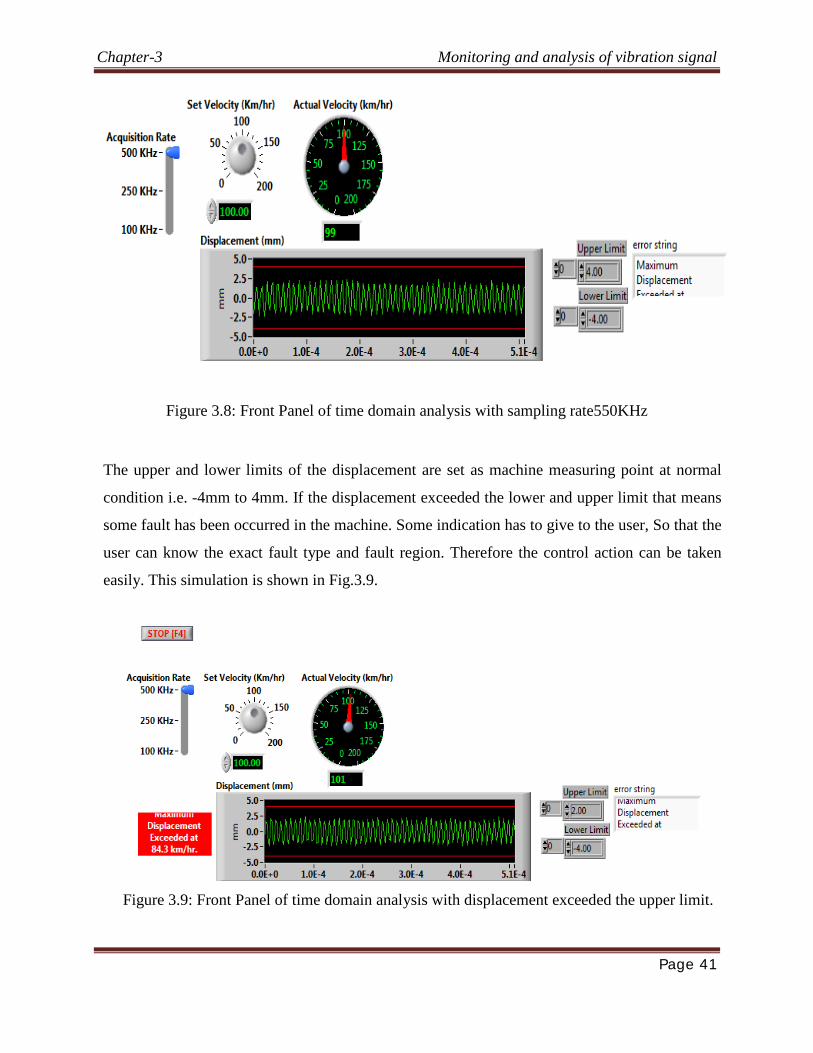
Chapter-3 Monitoring and analysis of vibration signal
Page 41
Figure 3.8: Front Panel of time domain analysis with sampling rate550KHz
The upper and lower limits of the displacement are set as machine measuring point at normal
condition i.e. -4mm to 4mm. If the displacement exceeded the lower and upper limit that means
some fault has been occurred in the machine. Some indication has to give to the user, So that the
user can know the exact fault type and fault region. Therefore the control action can be taken
easily. This simulation is shown in Fig.3.9.
Figure 3.9: Front Panel of time domain analysis with displacement exceeded the upper limit.
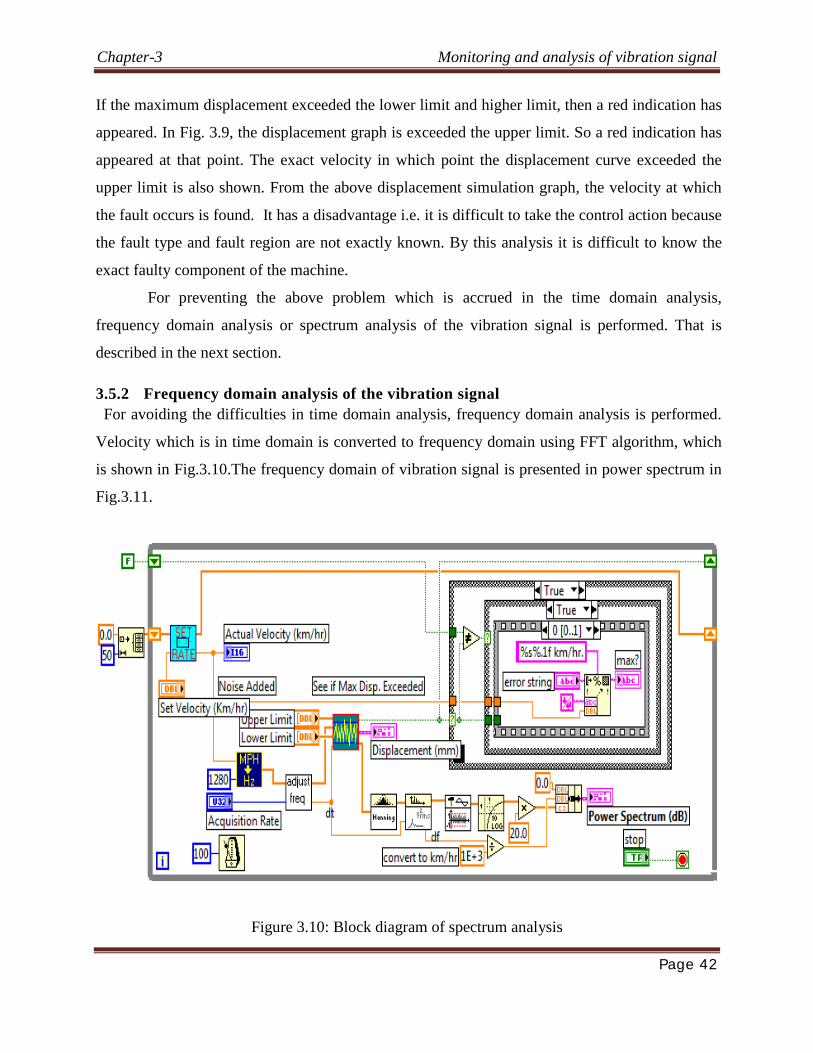
Chapter-3 Monitoring and analysis of vibration signal
Page 42
If the maximum displacement exceeded the lower limit and higher limit, then a red indication has
appeared. In Fig. 3.9, the displacement graph is exceeded the upper limit. So a red indication has
appeared at that point. The exact velocity in which point the displacement curve exceeded the
upper limit is also shown. From the above displacement simulation graph, the velocity at which
the fault occurs is found. It has a disadvantage i.e. it is difficult to take the control action because
the fault type and fault region are not exactly known. By this analysis it is difficult to know the
exact faulty component of the machine.
For preventing the above problem which is accrued in the time domain analysis,
frequency domain analysis or spectrum analysis of the vibration signal is performed. That is
described in the next section.
3.5.2 Frequency domain analysis of the vibration signal For avoiding the difficulties in time domain analysis, frequency domain analysis is performed.
Velocity which is in time domain is converted to frequency domain using FFT algorithm, which
is shown in Fig.3.10.The frequency domain of vibration signal is presented in power spectrum in
Fig.3.11.
Figure 3.10: Block diagram of spectrum analysis
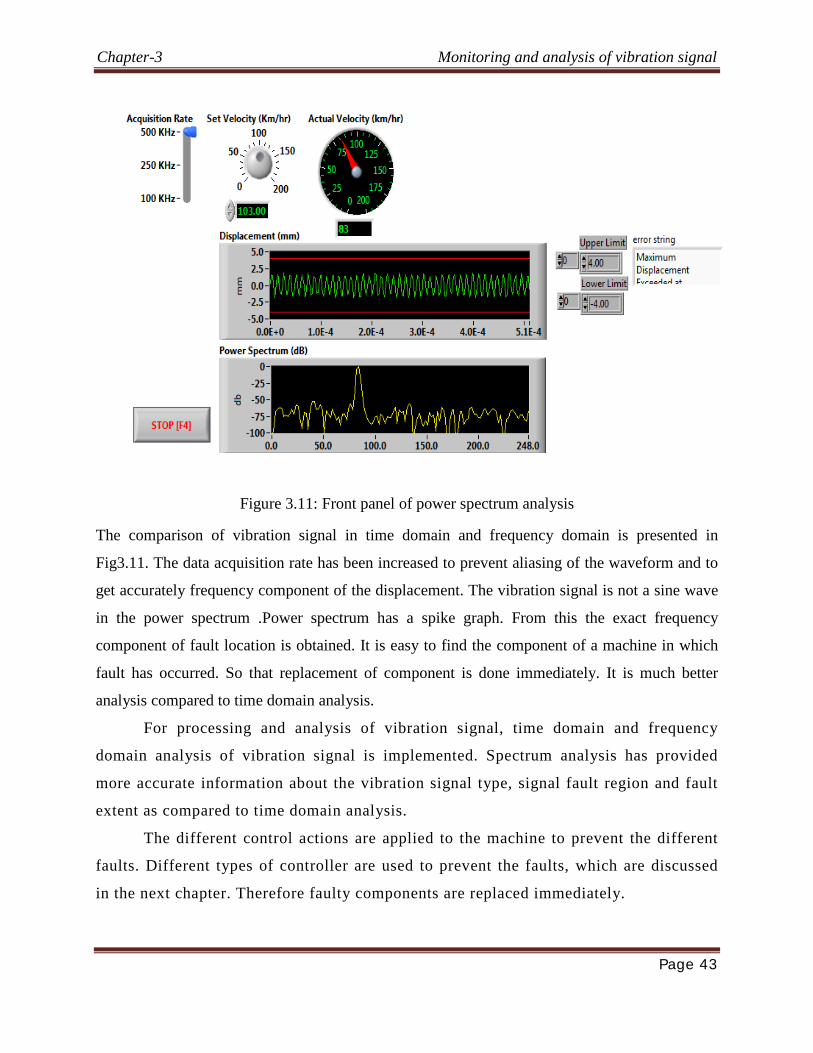
Chapter-3 Monitoring and analysis of vibration signal
Page 43
Figure 3.11: Front panel of power spectrum analysis
The comparison of vibration signal in time domain and frequency domain is presented in
Fig3.11. The data acquisition rate has been increased to prevent aliasing of the waveform and to
get accurately frequency component of the displacement. The vibration signal is not a sine wave
in the power spectrum .Power spectrum has a spike graph. From this the exact frequency
component of fault location is obtained. It is easy to find the component of a machine in which
fault has occurred. So that replacement of component is done immediately. It is much better
analysis compared to time domain analysis.
For processing and analysis of vibration signal, time domain and frequency
domain analysis of vibration signal is implemented. Spectrum analysis has provided
more accurate information about the vibration signal type, signal fault region and fault
extent as compared to time domain analysis.
The different control actions are applied to the machine to prevent the different
faults. Different types of controller are used to prevent the faults, which are discussed
in the next chapter. Therefore faulty components are replaced immediately.
Page 44
CHAPTER4
CONTROL STRATEGY FOR FAULTY VIBRATION SIGNAL
Introduction
Control Strategy
Result and Discussion

Chapter-4 Control strategy for faulty vibration signal
Page 45
4 CONTROL STRATEGY FOR FAULTY VIBRATION SIGNAL
4.1 Introduction Machine plays a vital role in the plant .In large industrial plants; several thousand machines
have to provide the necessary motion. A sudden or unexpected machine break can lead to various
faults in the process series, which can be very expensive in nature. Any fault occurred in the
machine components provides a great loss to the plant. Hence consistent management of the
machines is very essential for making sure that the production cycle is controlled in advance.
Machine controller is an instrument or group of instruments that provides a
predetermined approach in the performance of an electric machine .A machine controller may
provide a manual or automatic means for controlling the motor such as for starting or stopping
the machine, regulating and selecting the speed, limiting or regulating the torque, selecting
forward or backward rotation, and protecting against the faults and overloads [27, 28].
Every electric machine has some manual or automatic controller. The machine controller
has different features and complication depending upon the task .The simplest case is that
a switch is connected between a machine and a power source. In this situation, either the switch
is manually operated or a relay or contactor is connected to a sensor for starting and stopping the
machine automatically. The switch has several positions to select different connections of the
machine. This may allow the reduced voltage for starting the machine, selection of multiple
speeds or reversing control. Over current protection and overload may be excluded in very small
machine controllers. Small machine have integrated overload devices to open the circuit
automatically. Larger machines have temperature sensing relay or a protective overload relay
which are included in the fuses or circuit breakers and controller for over current protection. An
automatic machine controller includes the limit switches to protect the rotating machine.
Various machine controllers are used to precisely control the acceleration, speed and
torque of the connected machines. It is a part of the closed loop control systems for accurate
positioning of a driven machine. Machine controllers are manually, remotely or automatically
operated.
In an Intelligent machine Controller (IMC), a microprocessor is used for controlling the
electronic devices which are used for machine control. IMCs examine the load on machine and
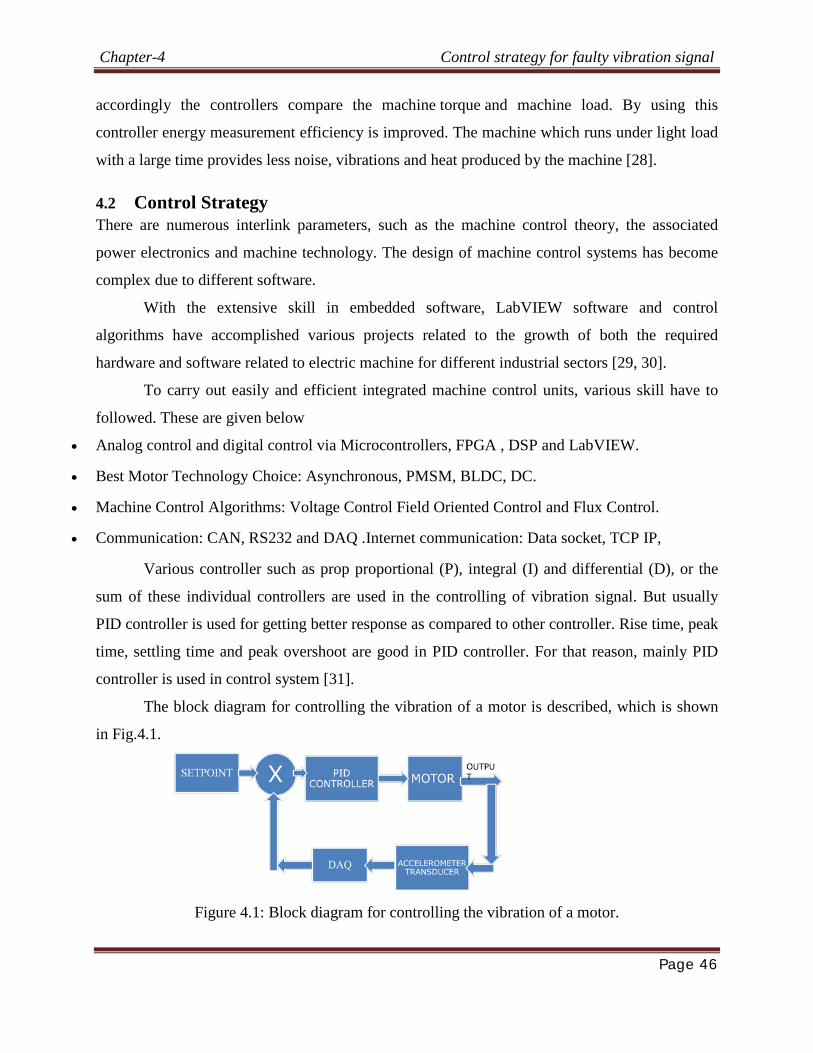
Chapter-4 Control strategy for faulty vibration signal
Page 46
accordingly the controllers compare the machine torque and machine load. By using this
controller energy measurement efficiency is improved. The machine which runs under light load
with a large time provides less noise, vibrations and heat produced by the machine [28].
4.2 Control Strategy There are numerous interlink parameters, such as the machine control theory, the associated
power electronics and machine technology. The design of machine control systems has become
complex due to different software.
With the extensive skill in embedded software, LabVIEW software and control
algorithms have accomplished various projects related to the growth of both the required
hardware and software related to electric machine for different industrial sectors [29, 30].
To carry out easily and efficient integrated machine control units, various skill have to
followed. These are given below
• Analog control and digital control via Microcontrollers, FPGA , DSP and LabVIEW.
• Best Motor Technology Choice: Asynchronous, PMSM, BLDC, DC.
• Machine Control Algorithms: Voltage Control Field Oriented Control and Flux Control.
• Communication: CAN, RS232 and DAQ .Internet communication: Data socket, TCP IP,
Various controller such as prop proportional (P), integral (I) and differential (D), or the
sum of these individual controllers are used in the controlling of vibration signal. But usually
PID controller is used for getting better response as compared to other controller. Rise time, peak
time, settling time and peak overshoot are good in PID controller. For that reason, mainly PID
controller is used in control system [31].
The block diagram for controlling the vibration of a motor is described, which is shown
in Fig.4.1.
Figure 4.1: Block diagram for controlling the vibration of a motor.
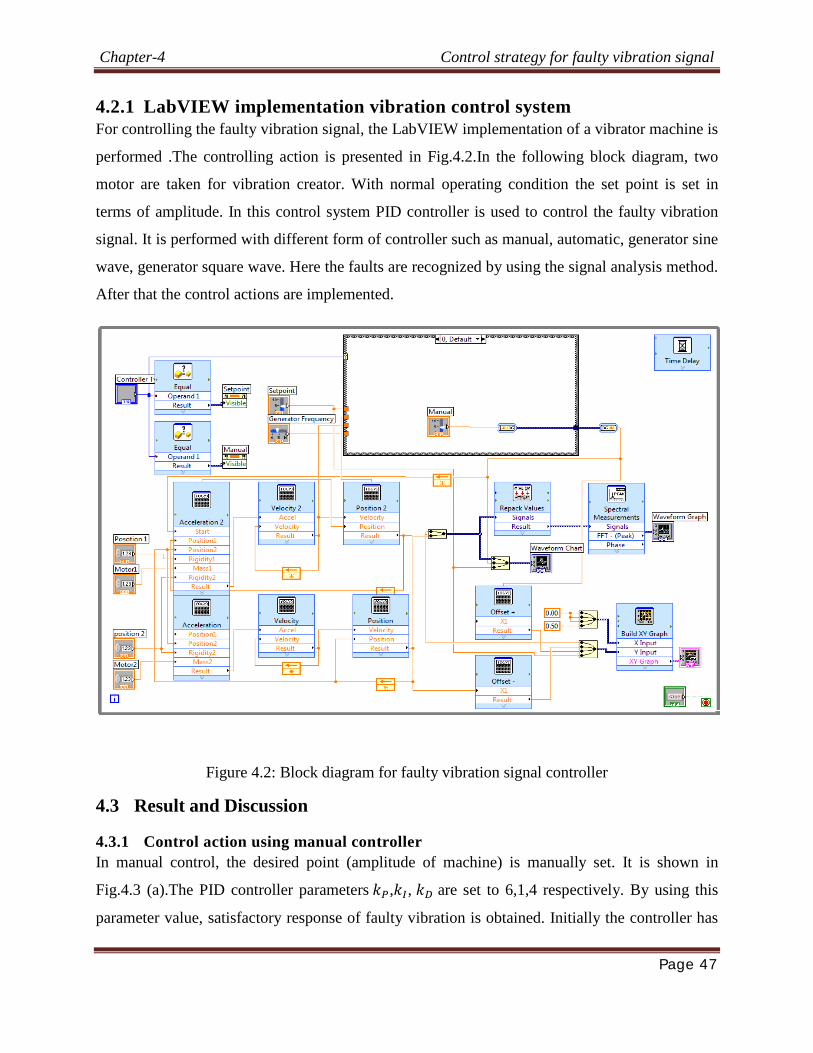
Chapter-4 Control strategy for faulty vibration signal
Page 47
4.2.1 LabVIEW implementation vibration control system For controlling the faulty vibration signal, the LabVIEW implementation of a vibrator machine is
performed .The controlling action is presented in Fig.4.2.In the following block diagram, two
motor are taken for vibration creator. With normal operating condition the set point is set in
terms of amplitude. In this control system PID controller is used to control the faulty vibration
signal. It is performed with different form of controller such as manual, automatic, generator sine
wave, generator square wave. Here the faults are recognized by using the signal analysis method.
After that the control actions are implemented.
Figure 4.2: Block diagram for faulty vibration signal controller
4.3 Result and Discussion
4.3.1 Control action using manual controller In manual control, the desired point (amplitude of machine) is manually set. It is shown in
Fig.4.3 (a).The PID controller parameters 𝑘𝑃,𝑘𝐼, 𝑘𝐷 are set to 6,1,4 respectively. By using this
parameter value, satisfactory response of faulty vibration is obtained. Initially the controller has
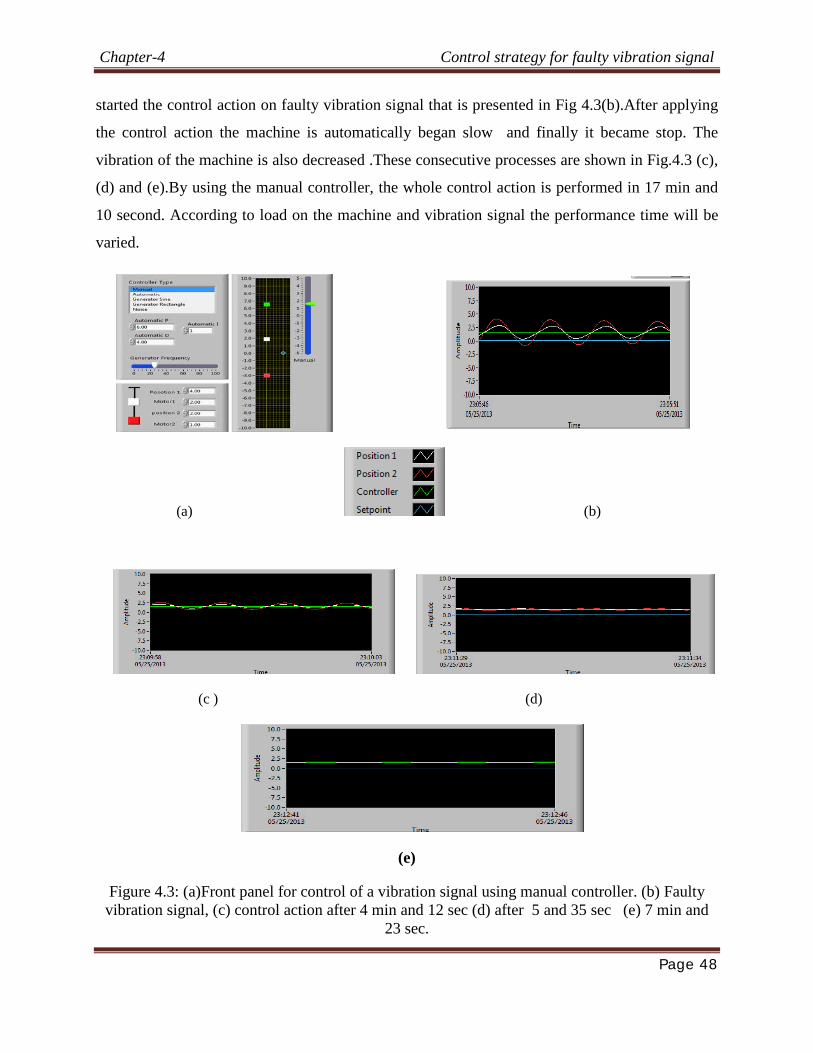
Chapter-4 Control strategy for faulty vibration signal
Page 48
started the control action on faulty vibration signal that is presented in Fig 4.3(b).After applying
the control action the machine is automatically began slow and finally it became stop. The
vibration of the machine is also decreased .These consecutive processes are shown in Fig.4.3 (c),
(d) and (e).By using the manual controller, the whole control action is performed in 17 min and
10 second. According to load on the machine and vibration signal the performance time will be
varied.
(a) (b)
(c ) (d)
(e)
Figure 4.3: (a)Front panel for control of a vibration signal using manual controller. (b) Faulty vibration signal, (c) control action after 4 min and 12 sec (d) after 5 and 35 sec (e) 7 min and
23 sec.
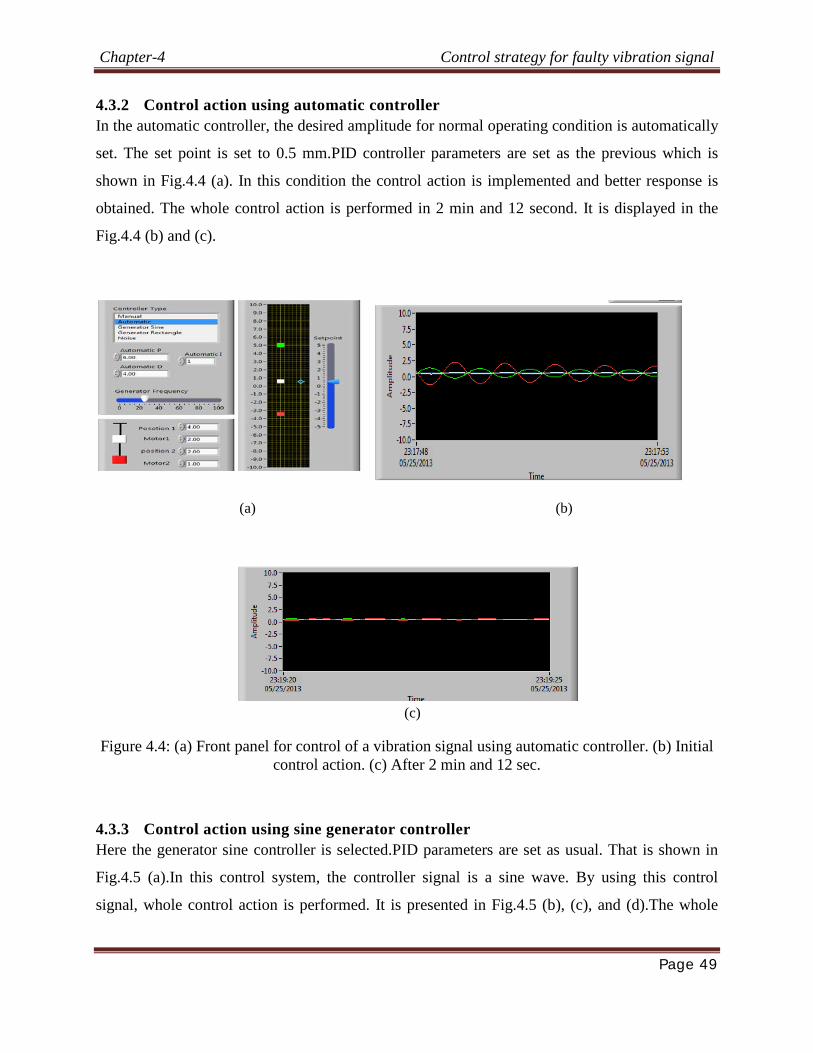
Chapter-4 Control strategy for faulty vibration signal
Page 49
4.3.2 Control action using automatic controller In the automatic controller, the desired amplitude for normal operating condition is automatically
set. The set point is set to 0.5 mm.PID controller parameters are set as the previous which is
shown in Fig.4.4 (a). In this condition the control action is implemented and better response is
obtained. The whole control action is performed in 2 min and 12 second. It is displayed in the
Fig.4.4 (b) and (c).
(a) (b)
(c)
Figure 4.4: (a) Front panel for control of a vibration signal using automatic controller. (b) Initial control action. (c) After 2 min and 12 sec.
4.3.3 Control action using sine generator controller Here the generator sine controller is selected.PID parameters are set as usual. That is shown in
Fig.4.5 (a).In this control system, the controller signal is a sine wave. By using this control
signal, whole control action is performed. It is presented in Fig.4.5 (b), (c), and (d).The whole
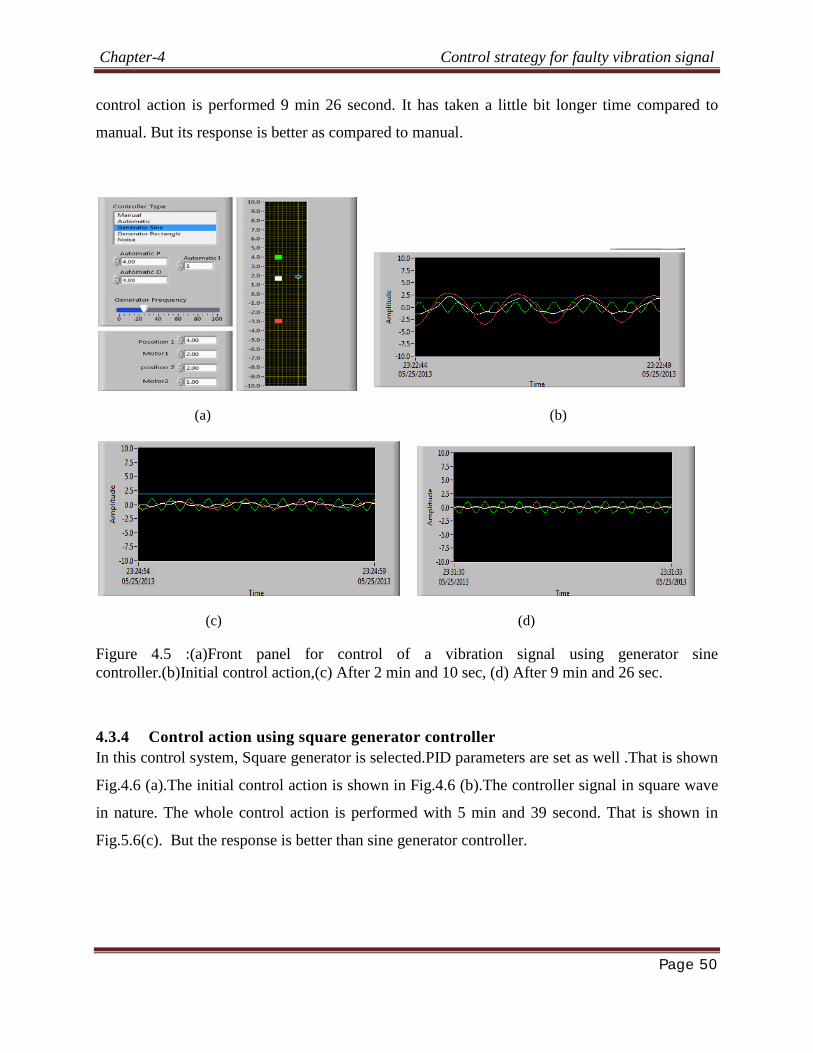
Chapter-4 Control strategy for faulty vibration signal
Page 50
control action is performed 9 min 26 second. It has taken a little bit longer time compared to
manual. But its response is better as compared to manual.
(a) (b)
(c) (d)
Figure 4.5 :(a)Front panel for control of a vibration signal using generator sine controller.(b)Initial control action,(c) After 2 min and 10 sec, (d) After 9 min and 26 sec.
4.3.4 Control action using square generator controller In this control system, Square generator is selected.PID parameters are set as well .That is shown
Fig.4.6 (a).The initial control action is shown in Fig.4.6 (b).The controller signal in square wave
in nature. The whole control action is performed with 5 min and 39 second. That is shown in
Fig.5.6(c). But the response is better than sine generator controller.
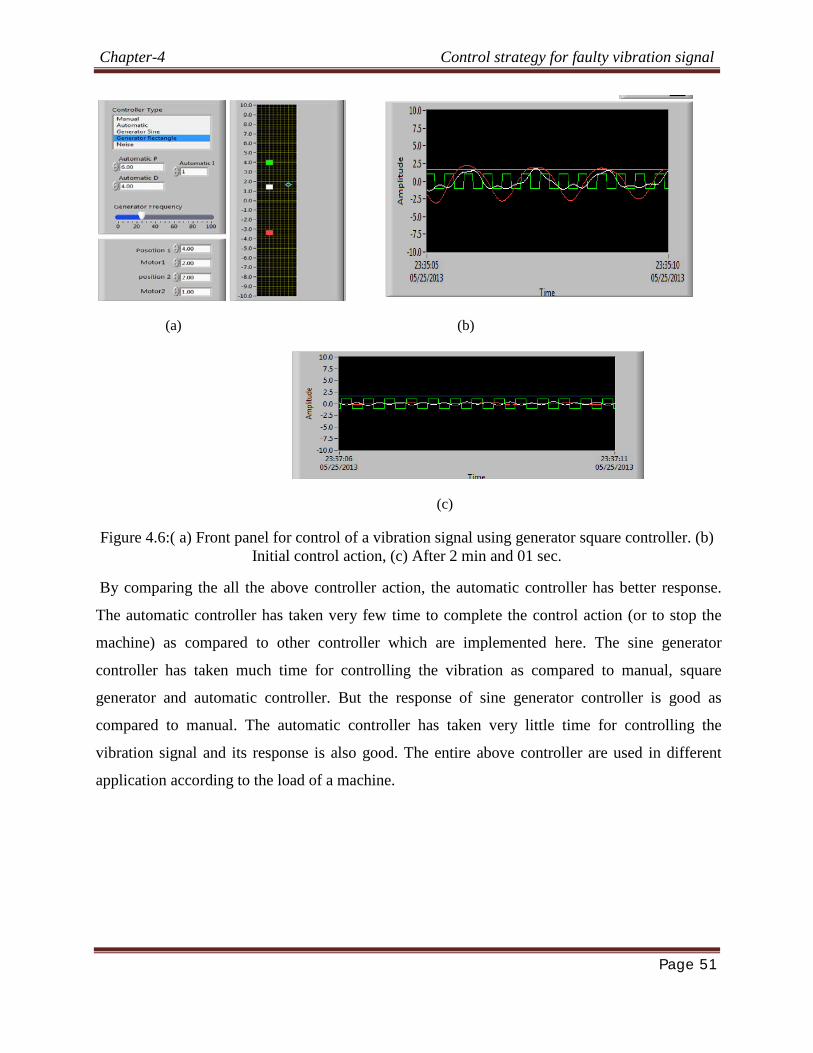
Chapter-4 Control strategy for faulty vibration signal
Page 51
(a) (b)
(c)
Figure 4.6:( a) Front panel for control of a vibration signal using generator square controller. (b) Initial control action, (c) After 2 min and 01 sec.
By comparing the all the above controller action, the automatic controller has better response.
The automatic controller has taken very few time to complete the control action (or to stop the
machine) as compared to other controller which are implemented here. The sine generator
controller has taken much time for controlling the vibration as compared to manual, square
generator and automatic controller. But the response of sine generator controller is good as
compared to manual. The automatic controller has taken very little time for controlling the
vibration signal and its response is also good. The entire above controller are used in different
application according to the load of a machine.

Page 52
CHAPTER 5
CONCLUSION AND FUTURE WORK

Chapter 5 Conclusion
Page 53
5 CONCLUSION In this project a VFSS (Vibration fault simulation system) is implemented using virtual
instrumentation virtual instrumentation (VI). VI has emerged into a multifaceted technique that
encompassed the entire area of computer based instrumentation. To a large extent, hardware is
also reduced. For these advantages, VI has made as the dominant tool for the expansion and
contrivance of instrumentation applications and systems. LabVIEW software is used as graphical
programming language. Here icons are used to create application instead of line of text. It has
verity of application such as data acquisition, signal processing, signal analysis, signal
monitoring and control. This software has many advantages, such as it occupies less memory,
easy to write the program an error less code. This software is very simple and less time
consuming as compared to other conventional language software.
This project presents analysis, monitoring and control of vibration signal in terms of time
domain and frequency domain. The vibration signal is integrated twice for getting the amplitude
(time domain) of vibration signal from acceleration of the acquired signal. The integration is
done electronically. In time domain analysis, it is difficult to find the fault region and fault type.
The fault of vibration signal is not clearly obtained from displacement graph which is in time
domain. By using the red indicator on the time domain analysis, the exact velocity in which point
the displacement curve exceeded the upper limit is also shown. From the displacement
simulation graph, the velocity at which the fault occurs is found.
As the fault of vibration signal is not clearly obtained from displacement graph which is in time
domain, hence frequency domain or power spectrum analysis of vibration signal is performed
and the fault type and fault region are easily detected by this analysis. By comparing the two
analysis, it is obtained more information about the type of vibration signal, type of signal fault,
fault region from the spectrum analysis. It helps in taking preventive control action immediately.
For controlling the faulty vibration signal, various controllers are used such as PID controller in
terms of manual, automatic mode, sine generator mode, and square generator mode. The control
action on faulty machine is performed using these controller modes. By comparing all the
controller action, it is drawn that automatic mode has given better control action and response as
Chapter 5 Conclusion
Page 54
compared to other controller modes. Therefore the proposed control technique can be used as a
powerful tool for controlling any faulty vibrator machines.
5.1 Future Work The future work of this project can be made as follows
Hardware implementation of vibration monitoring system and control unit of the
machine.
Online monitoring system can be implemented to the data acquisition vibration
monitoring system, using which the data acquisition process can be controlled and
monitor remotely from office.
In addition to that fault detection process can be improved by implementing some recent
classifier methods such as vibration signal analysis based on Auto regressive model and
based on wavelet transfer.
Page 55
.
REFERENCES
References
Page 56
[1] N. Mathivanan,“PC-Based Instrumentation: Concepts And Practice”, PHI publication,
3rd Edition, India,pp. 139-210,2011.
[2] Mike Tooley, “PC-Based instrumentation and control,” Newnes Publication, 2nd
Edition, 2003.
[3] Kevin James, “PC interfacing and data acquisition techniques for measurement
instrumentation and control,” Newnes Publication.
[4] Bentley John P., “Principle of Measurement system,” Pearson education, 3rd Edition,
2005.
[5] HelfrickAlbet D. and Cooper William D., “Modern electronics Instrumentation and
measurement system,” PHI Private Limited, 2nd edition, 2007.
[6] R.A. Gayakward, “Opamps& Linear Integrated Circuits,” PHI Publication.
[7] Sanjay gupta and Joseph john,”Vitual instrumentation using LabVIEW”,
Principle and Practices of graphical programming. Second Edition.India,pp.1-
21,2010.
[8] Analog-to-digital Converter Design Guide, Microchip Technology Inc., Chandler,
AZ, 2004.
[9] T. Naqvi, Introduction to SyDe data acquisition systems and LabVIEW, Oct. 29,
2004.
[10] G. W¨ostenk¨uhler, “Data Acquisition Systems (DAS) in General,” Hochschule Harz,
Wernigerode, Germany. and LabVIEW, Oct. 29, 2004.
[11] Transaction in Measurement and Control, vol. 2, Data Acquisition, Omega, Putman
Publishing Company and Omega Press LLC, 1998.
[12] S. Li et al., “Continuous and real-time data acquisition embedded system for EAST,”
IEEE Trans. Nuclear Science, vol. 57, pp. 696-699, April 2010.
[13] Z. Hua, “Application of LabVIEW in the design of data acquisition and signal
processing system of mechanical vibration,” Proceedings International Conference
on Mechatronic Science, Electric Engineering and Computer, Jilin, China, Aug. 19-
22 ,2011.
[14] X. Wenyue and Y. Haiwen, “A development platform for complex data acquisition
system,” Proceedings International Conference on Education and Management
Technology ( ICEMT), 2011.
References
Page 57
[15] Conway, Jon, and Watts Steve, “A Software Engineering Approach to LabVIEW,”
Prentice Hall, 2003.
[16] Essick, John, “Hands on Introduction to LabVIEW for Scientist and engineers,
Oxford University Press, 2008.
[17] Travis, Jeffery, Kring, and Jim, “LabVIEW for Everyone Graphical Programming
Made Easy and Fun,” Prentice Hall PTR, 3rd Edition, 2006.
[18] Data Acquisition and Signal Conditioning Course Manual, National Instruments
Corporation, North Mopac Expressway, Austin, Texas, USA, Aug. 2003.
[19] “LabVIEW- Graphical Programming for Instruments, User Manual”, National
Instruments. Availaible http://www.ni.com/pdf/manuals/320999e.pdf.
[20] Application Notes 007, Data Acquisition Fundamentals, National Instrument.
[21] Lab-VIEW Analysis Concept, North Mopac Expressway, Austin, Texas, USA, March
2004.
[22] Data Acquisition Fundamentals, National Instruments Corporation, April 2002.
[23] Asan Gani and J.E. Salami, Department of Mechatronics, “Vibration Faults
Simulation System (VFSS): A System for Teaching and Training on Fault Detection
and Diagnosis.”Proceedings of student conference on research and development,
SCOReD, pp.15, 16, February 2002.
[24] Asan Gani and M.J.E salami, “A LabVIEW based Data Acquisition System for
Vibration Monitoring And Analysis", Proceedings of student conference on
research and development (SCOReD).pp.62-65,February 2002.
[25] Gao Bingkun; Li Yanjia;Song Zhayun;Xu Mingzi, “Vibration Testing and Analysis
of Motor Based on Virtual Instrument” , Proceedings International Conference on
Topic(s) : Communication ,Networking & Broadcasting, pp.2373-2375,2010.
[26] Jhon G.proakis and Dimitris G.Manokis. “Digital signal processing” Principle,
algorithms and Application.Third edition, Prentice Hall Publication, India, pp.195-
250, 1995.
[27] Surekha Bhanot, “Process Control”,Principle and algorithm .Oxford publication,
India, pp.87-120,2011.
References
Page 58
[28] Jianying Liu; Pengju Zhang; Fei Wang, “Real –time DC servo motor position control
by PID controller using LabVIEW”, Proceedings International Conference on
Intelligent Human Machine and Cybernetics (IHMSC),vol-1,pp.206-209,2009.
[29] Thepsatorns,P;Numsomran,A;Tipsuwanporn,V;Teanthong,T, “DC Motor speed
Control using Fuzzy logic based on LabVIEW”, Proceedings International
Conference on Applied Sciences and Engineering ( SICE-ICASE),pp.3617-
3620,2006.
[30] Ali,FH; Mahmood,HM;Ismeal,S.M.B, “LabVIEW FPGA implementation of a PID
Controller for DC motor speed control”, Proceedings 1st International Conference
On Energy, power and control(EPQ-IQ),pp.139-144,2010.
[31] Guoshing Huang;Shuocheng Lee Audio, “PC-Based PID speed control in DC
motor”,Proceedings International Conference on Audio, Language and image
processing (ICALIP) ,pp.400-407,2008.
References
Page 59
DISSEMINATION
(1) Sunita Mohnata, Umesh Chandra. pati, “Monitoring and Analysis of Vibration Signal
Based on Virtual Instrumentation”, Proceedings International Conference on Advance
Computing and communication (ICACC), pp. 188-192, Ranchi, March 16-17, 2013.
(2) Sunita Mohnata, Umesh Chandra. pati, “Monitoring and Analysis of Vibration Signal
Based on Virtual Instrumentation”, International Journal of Advanced Computer
Research (IJACR).Volume-3,Issue-8, pp.188-192, March-2013.
Top Related