


Languages
Pages
Legal


A Common Copy Number Variation on Chromosome 6 Association with the Gene Expression
Level of Endothelin 1 in Transformed B-Lymphocytes from Three Racial Groups
Yan V. Sun, PhD
Patricia A. Peyser, PhD
Sharon L.R. Kardia, PhD
Department of Epidemiology, School of Public Health, University of Michigan, Ann Arbor, Michigan, USA
Corresponding author:
Yan V. Sun, Ph.D.
University of Michigan
School of Public Health
Department of Epidemiology
109 Observatory, #4605
Ann Arbor, MI 48109
Phone: (734) 615-6279
Fax: (734) 764-1357
Short Title: CNV Association with EDN1 Gene Expression
Manuscript ID: CIRCULATIONAHA/2009/848754
Subject Code: [89] Genetics of cardiovascular disease; [146] Genomics
tyyyytytytytyyytytytyyyytyytyyyyy ooooooooooooooooooooooof ffffffffffffffffffffff MiMiMiMiMiMiMiMiMiMiMiMiMiMiMiMMiMMiMMMMMM chchchchchchchchchchchchchchchchchchchhchhchigigigigigigigiigigigigigiggiigiigigigiigananananananannnanannannnan,
oor:
by guest on July 8, 2018http://circgenetics.ahajournals.org/
Dow
nloaded from
by guest on July 8, 2018http://circgenetics.ahajournals.org/
Dow
nloaded from
by guest on July 8, 2018http://circgenetics.ahajournals.org/
Dow
nloaded from
2
Abstract
Background: Previous studies indicate that the endothelin system is involved in hypertension,
heart failure, atherosclerosis, chronic kidney disease, and diabetes. To explore the potential
genetic effects of copy number variations (CNV) on the endothelin system which underlie these
diseases, we studied the association of genome-wide CNVs with gene expression levels of seven
genes involved in the endothelin system using independent HapMap subjects including 90
Asians (45 Han Chinese and 45 Japanese), 60 Caucasians, and 60 Africans.
Methods and Results: For each subject, the genome-wide variations were measured using the
Affymetrix® 6.0 chip that includes measurements of 906,000 single nucleotide polymorphisms
and 946,000 CNV probes. The gene expression profiles of the transformed B-lymphocytes were
measured for the same subjects. Among the 210 subjects, we identified 1,529 CNV regions on 22
autosomes. By testing the association between CNVs and the gene expression levels in each
racial group using linear regression, we identified four statistically significant CNV associations
in all three groups (alpha=0.05). The strongest association was between a 66 kbp CNV region
located on chromosome 6 and endothelin-1 (EDN1) expression. The effects of the CNV-EDN1
association in the three racial groups were in the same direction and explained 7%-14% of the
variation in EDN1 expression.
Conclusions: Although the biological function of the chromosome 6 CNV is unclear, the
significant and consistent association found in three racial groups suggests that CNVs may
contribute to variation in underlying risks of common disease through their effects on key
molecular signaling pathways.
Key Words: hypertension, heart failure, atherosclerosis, endothelin system
gle nucleotide p pppppppppppp
ansfoffooofoofofofoffoooooorm deddddddddddddddd BBB BB BBBB B BBBBBBB-l-lllllll-lllllllll-llyyyymyyyyy
m N
n v
n N
mee eee ssusss bjeccccctsssss.... AmAmAmAmmononononong g g gg thththththe e e 2122 0 0 0 sssubbbjjectctctctts,s,s,s,, w w wwweee ee ididdidenenenenentififiififiededededed 1 ,55,55,52929292929 C CCCN
ng thththththe ee ee asasasasassosososs ciciciciiatatattatioioioioion nnn bebebebebetwtwtwtwtweeeeeen n nn n CNCNCNCNCNVsVsVsVsVs aa aaandndndndnd t t t t thehehehehe g g gggenenenene eeee exexexexexprprprprpresesesesessisisisisiononononn ll lllevee
nnnneaeaearrr rereregrgrgrgg esesessisisiononon, wewewe ii idededentntntifififieieieddd fofofoururur ss statatatititistststicicicalalallllyyy sisisigngngnififificicicanananttt CNCNNCN
by guest on July 8, 2018http://circgenetics.ahajournals.org/
Dow
nloaded from

3
Introduction
A copy number variation (CNV) is a segment of DNA that is present at a variable number
of copies compared with a reference genome sequence 1 Initial studies by Redon et. al. used
genome-wide single nucleotide polymorphism (SNP) arrays to identify genome wide CNVs
using the HapMap population and identified 1,447 CNVs, covering 12% of the human genome
2. Recently, Stranger et al. have demonstrated potentially functional associations between CNV
regions and quantitative gene expression levels 3. CNVs represent a unique opportunity to
expand genome-wide association (GWA) studies because they quantitate both gene-dosage and
the functional implications of SNP variation. Furthermore, CNVs have been reported to be
associated with numerous human disorders such as Parkinson’s disease 4, schizophrenia 5-7,
autism 8, 9 and Crohn’s disease 10.
While a number of GWA studies to date have identified SNP loci associated with
cardiovascular disease (CVD) 11-13, the association between CNVs and CVD has not been
investigated widely and is less understood. CNVs are suggested to affect CVD and its clinical
phenotypes 14. One approach to assess the role of CNVs in CVD susceptibility is to focus on
candidate genes. Endothelin-1 (EDN1) is a well-studied candidate gene for CVD. EDN1 was
firstly isolated and cloned as a novel vasoconstrictor in 1988 15. Human EDN1 is located on
chromosome 6 and encodes a 21-amino acid peptide. Besides vasoconstriction, EDN1 also
contributes to the vasodilation, oxidative stress, inflammation and fibrogenic processes through
the endothelin system 16. EDN1 is believed to be an important molecule contributing to the
pathogenesis of hypertension, heart failure, atherosclerosis, chronic kidney disease (CKD), and
diabetes 16. Importantly, several SNPs in the endothelin system genes have been shown to have
functional relevance and association with cardiovascular phenotypes and/or diseases 17.
s have been repepepppeppppppppppo
diseaaaaaaaaaaaaaase 444444444444444444, ,,,,,,,,,,,,,, scccccccccccccchihihihihihihihiihihihihihihhhhhhh zozzzzzzzzzz p
n
b a
s s
n’sssss dddddiseassesss 110111 .
bererererr o o o oofff GWGWGWGWGWAA AAA stststss ududududu ieieieieies ss s s tototototo d ddddatatatatate eeee hahahahahaveveveveve iiiiidededededentntntntntifififififieieieieied dddd SNSNSNNNPPP PP lololololocicicicc aaaaassssssss ococococociaii
sessese (( (CVCVCVD)D)D) 11-1111 1313131313, thththeee asasassososociciciatatatioioionnn bebebetwtwtweeeeeennn CNCNCNVsVsVs aa andndnd CC CVDVDVD hh hasassas
by guest on July 8, 2018http://circgenetics.ahajournals.org/
Dow
nloaded from

4
In this study, we used available data from HapMap subjects to estimate CNV associations
with gene expression levels of seven endothelin system genes, including EDN1, endothelin-2
(EDN2), endothelin-3 (EDN3), endothelin converting enzyme 1 (ECE1), endothelin converting
enzyme 2 (ECE2), endothelin receptor type A (EDNRA), and endothelin receptor type B
(EDNRB) in three racial groups (Asians, Caucasians, and Africans). The goal of the study was to
identify associations between CNVs and gene expression levels that were consistent across the
three racial groups.
Methods
Sample and Data
Two hundred and seventy subjects in three racial groups were available from the
HapMap project for the current study. All 270 subjects were used to identify the specific CNV
regions (described below). We used the 210 unrelated HapMap subjects from three racial groups
to examine the association between CNVs and the expression level of genes in the endothelin
system. There were 60 unrelated subjects from Utah; these individuals represent the United
States Caucasian population with Northern and Western European ancestry (parents in 30 trios).
There were 60 unrelated subjects collected from the Yoruba people in Nigeria (parents in the 30
trios). Forty-five unrelated Han Chinese in Beijing, China and 45 unrelated Japanese in Tokyo,
Japan were collected for the Asian group. All subjects gave specific consent for their inclusion in
the HapMap project 18.
The mRNA gene expression data for the HapMap samples were obtained from Wellcome
Trust Sanger Institute. Gene expression profiles of the seven endothelin system genes, EDN1,
EDN2, EDN3, ECE1, ECE2, EDNRA and EDNRA, were identified using their unique mRNA
wereeeeeeeeeeeeeee availililililililililiilililililababababababababababababababababbbbbleleleellelelelelelelelelee f
t e
e h
c h
thehehehehe curreeeeentntnttt ss studududududy.y.y.y.y. AlAlAlAlAll l l ll 2727272 0 0 0 sususubjjeectsssss w w w wwererrreee ee usuuu ededededed toooo ii ii idededededentttififififify yy y y thtttt e
elowowowowow).).).).). WeWeWeWeW usususususededededed thehehehehe 2 2 2 221010101010 u u u u unrnrnrnrnrelelelele atatataa ededededed H H HH HapapapapapMaMaMaMaMap pppp susususuubjbjbjbjbjececececectststststs fffffrororororom mmmm thththtt
ciaiaiatititiononon bb betetetweweweenenen CC CNVNVNVsss anananddd thththeee exexexprprpresesessisisiononon ll levevevelelel oo offf gegegenenenesss ininin tt thhhh
by guest on July 8, 2018http://circgenetics.ahajournals.org/
Dow
nloaded from

5
RefSeq identifiers from the microarray annotation file. The quantification and normalization of
the gene expression data were described in a previous report 3.
The genotyping data for the 270 HapMap subjects were produced and distributed by
Affymetrix® using the Genome-Wide Human SNP Array 6.0 platform. The CNV genotype data
for the 210 HapMap subjects were merged with their gene expression data using the anonymous,
unique identifiers. Prior to CNV analysis, the Contract QC (CQC) value was calculated for each
chip (Affymetrix 6.0) for each of the 270 HapMap subjects using Affymetrix Genotyping
ConsoleTM. All of the studied chips passed the CQC threshold of 0.4, which is recommended by
Affymetrix for controlling genotyping quality.
Copy Number Variation Analysis
Two different approaches were applied to identify copy number variation. For the first
approach, the Copy Number Analysis Module (CNAM) in HelixTree was used to process the
Affymetrix® raw intensity files (.CEL) and generated a common reference genome with a normal
number of copies, using all 270 HapMap subjects. Then the log2ratio was calculated for each
probe (both SNP probes and copy number probes) on each microarray compared to the reference
genome. HelixTree implements a dynamic programming based algorithm 19, 20, which
exhaustively searches through all possible cutpoint positions to find an optimal segmentation of
the log2ratios for each measured subject. A multivariate method implemented in HelixTree
segments log2ratios across all subjects simultaneously, finding general copy number regions that
may be similar across all subjects (HelixTree manual of copy number analysis module). For a
given subject, the mean of the log2ratios within each segment for that subject are used as
independent variables to identify the CNV associations with a dependent variable.
t n
N
e m
t apapapappproaaaachchchchheseeee wwwwwererererere eee apapapapapplplppp ieieiieied d tototott iddeentititititifyfyfyfyfy c opopopopo y yyy nununununumbmbmbmbmbererererer v v vararararariaiaiaiaiatitititition
Numumumumumbebebebeber rrrr AnAnAnAnA alalalalalysysysysysisiii MMMMModododododullllleee ee (C(C(C(C(CNANANANANAM)M)M)M)M) iiiiinnn nn HeHeHeHeHelililililixTxTxTxTxTrererereeeee ee wawawaww s ss usususuusededededed t
eneenensisitytyty f filililleseses ( (((( CC.CELELEL) ) )) ananandd gegegegg nenenerararatetetedd a aa cococommmmmmononon rr refeferererenenencecece gg genenenomommom
by guest on July 8, 2018http://circgenetics.ahajournals.org/
Dow
nloaded from

6
The second approach used the Affymetrix® Genotyping Console (GTC) 3.0.1 to generate
a reference genome for comparing copy numbers and was generated using all 270 raw intensity
files (CEL files) from the human SNP 6.0 array (Affymetrix® Genotyping Console 3.0.1 User
Manual). Using the common reference genome for comparisons, the intensity ratio of each probe
(both SNP probe and copy number probe) on each array was calculated. The boundaries of the
common CNV segments were determined using the predefined CNV regions 21. A hidden
Markov model (HMM) was utilized to call the copy number state (i.e. the number of DNA
copies, 2 for a diploid genome like human) for each identified CNV. Genotype calls for the
common copy number variations (observed in multiple unrelated subjects) were determined
using the Canary algorithms 21. The chromosomal boundaries as well as the copy number state
were exported and utilized in the association analysis of gene expression levels.
Statistical Analysis
Population genetic parameters for CNVs (copy number states) were calculated, including
minor allele frequencies (MAFs), genotype frequencies, and a chi-square test for departures from
expectations under Hardy-Weinberg equilibrium (HWE) for the 210 unrelated subjects in three
racial groups. Summary statistics for CNVs and linear regression models were generated using
the statistical software R. Single CNV associations with gene expression levels were evaluated in
each racial group separately using standard linear regression models. For CNV associations with
p-value less than 0.05 in all three racial groups, we pooled the 210 HapMap subjects from all
racial groups after testing for heterogeneity (described below) and performed the CNV
association analysis. To estimate the relationship between the associated CNVs and SNPs, we
tested the additive effect of SNPs associated with gene expression levels in the pooled sample.
d subjects) werrrrrrrrrrre eeeeeeeeeeee
welllllllllllllllll a a a a a a a a a aa a aa aaaaaas s s ss ss s sss s ss sss s ththththhththththhthhhthhththththhtt e eeeeeeeeeeeeeeee cococococococcococococococococococococooopypppppppppp
t
e u
tilililililizizizizzed in nnnn thththththe eee asasasasassososososociciciciiatatatatatioioioioon n n nn ananananalalaa yssis ooooof f f ff gegegegegenenenenene eeeexpxpxpxpxpressssssssssioioiooon nnnn lelelelelevevevevevelslslslsls.
eneeneneteteticic p p parararamamametetetererersss foforrr CNCNCNVsVsVs ( ((((cococopypypypp nununumbmbererer ss statatatetetes)s)))) ww wererereee cacacalclcuuu
by guest on July 8, 2018http://circgenetics.ahajournals.org/
Dow
nloaded from

7
For the CNV and SNP association tests conducted on the pooled sample of three racial
groups, as well as on the sample of each of the three racial groups, we used the principal
component analysis (PCA) to adjust for the population stratification 22. The top ten principal
components (PCs) of the 752,286 autosomal SNPs (MAF>0.05 and call rate >95%) were
calculated within each race and in the pooled sample. The PCs significantly associated with the
gene expression levels were used as covariates in the multiple regression model of testing CNV
associations. In the CNV association analysis of EDN1 gene expression within each racial group,
none of top 10 PCs is significantly associated with the outcome and no PC was used to adjust the
linear regression model within each racial group.
All regression analyses were performed with the mean log2ratio of each CNV fragment as
the independent variable. The null hypothesis of no CNV effect was evaluated by testing
whether the regression coefficients were significantly different from zero. The CNV genotypes
(copy number states exported from Affymetrix® GTC 3.0.1 using Canary) were also used as
independent variables in regression analysis to confirm the findings. In the CNV genotype test,
we assumed an additive model of the DNA copy number effect for each CNV. All tests were
two-sided and the alpha level was set to 0.05.
For those CNVs that were significant in three racial groups, we applied two methods,
Cochran's Q test 23 and Higgins’s inconsistency test 24, to examine the heterogeneity of the
results across the three HapMap racial groups. k
iwii xxwQ
1
2)( where 21 ii Sw / ,
2iS is
the an unbiased estimate of the error variance of ix , iiiw wxwx / , k is the number of
experiments. Under the null hypothesis, the Q statistic has an approximate chi-square distribution
with k-1 degrees of freedom. The I2 inconsistency metric measures the amount of heterogeneity
g2ratitititititttitititittititititio o oooo ooooo oooooooooo ofofofofoffofofofofofofofofofofofofofffo eee e e e eeee e eee eeeacacacacaacacaaccacacacacacacacacaccach hhhhhhhhhhhhhhhhhhh C
a b
o C
a
abababbblelelell . Thehehehehe n nn nnululullu llll l hyhyhyhyhypopopopopothththhthesesesesesisiss ofofooo n oo CNNNNNV V VV V efefefefeffefefeffectctctctct ww ww wassasss evevevevevalalalaa uauauauauateteteteted dddd b
on cccccoeoeoeoeoefffffffffficicicicicieieiei ntntntntnts ssss wwewww rerererere sss ssigiiii nininininififififificacacacacantntntntntlylyylyy dddddifififififfefefefeferererererentntntntnt fffffrororooom mmmm zezezezezerrorrr . TT TTThehehehehe C
exexexpopoportrtrtedededded f frororommm AfAffyfyyyymememetrtrtrixix®®® GG GTCTCTC 3 3 3.0.0.0 11.1 uu usisisiis ngngngg CC Canananararary)y)y)y)y) ww wererereee a
by guest on July 8, 2018http://circgenetics.ahajournals.org/
Dow
nloaded from

8
not due to chance 24. I2 = (Q-df)/Q*100%, where Q is Cochran’s heterogeneity statistic and df the
degrees of freedom.
906,602 SNPs were genotyped using the Affymetrix® Genome-Wide Human SNP Array
6.0 platform. SNPs were excluded if they had unknown chromosomal location, a call rate less
than 95% or a minor allele frequency (MAF) less than 0.05. These quality control filters resulted
in 752,286 SNPs available for analysis in 210 independent HapMap subjects. The additive effect
of each SNP was estimated by using a linear regression model.
Results
Among the 270 HapMap genotyped subjects, we identified 1,529 CNV regions on 22
autosomes using CNAM implemented in HelixTree 6.2 software package. We identified
statistically significant associations between four CNVs and gene expression levels among the
endothelin system in each of the three racial groups. One CNV region (chromosome 6:
79,025,772 bp - 79,091,892 bp) was associated with EDN1 expression, one CNV region
(chromosome 2: 86,802,346 bp - 86,807,353 bp) was associated with EDN3 expression, one
CNV region (chromosome 7: 3,150,183 bp – 3,150,685 bp) was associated with ECE1
expression, and one CNV region (chromosome 20: 35,480,198 bp – 35,488,136 bp) was
associated with EDNRA expression. The respective p-values in Asians, Caucasians and Africans
were 0.011, 0.009 and 0.003 for the EDN1 association, 0.011, 0.026 and 0.023 for the EDN3
association, 0.016, 0.039 and 0.008 for the ECE1 association, and 0.027, 0.008 and 0.016 for the
EDNRA association.
We focused on the CNV-EDN1 associations, as they represented the most statistically
significant findings in this study. The CNV-EDN1 associations are summarized in Table 1. The
ed 1,11,11,,,11,1,,,52525252525252525252525525252522525252255 99 9999999999999999 CNCCNCNCNCNCNCNCNCNCNCNCCNCCCNCNCNC V VVVVVVVVVVVVV VVVVVV re
N d
n v
n o
NAMAMAMAMAM imppppplelememmm ntntteded in n HelixTreee 6.2 sssssoftwwwwware packkkkkagagaggge. WWWWe ee id
nt tttt asasasasassosososos ciciciciciatttit ononononons bebebebebetwtwtwtwtweeeeeeeen fofofofofoururururur C C C C CNVNVNVNVNVs ssss anananaand dddd gegegegegenenenenne ee e expxpxpxpxprererereesssssss ioioioioion n n lelelelelev
n eeeacacachh h ofofof t t thehehe t tthrhrhrhh eeeeee r r racacaciaiaiall l ll grgrgrouououpspsps.. . OnOnOnO ee e CNCNCNCNCNV VV V rereregigigiononon (( (chchchrororomomomososooso
by guest on July 8, 2018http://circgenetics.ahajournals.org/
Dow
nloaded from

9
numbers of CNV regions demonstrating statistically significant associations with EDN1
expression were, 77 in Asians, 218 in Caucasians and 106 in Africans. We repeated the CNV
association analysis of EDN1 gene expression using the standardized copy number states called
by Affymetrix® GTC 3.0.1. Both methods identified the CNV region (CNV_6q14.1) on
chromosome 6 with identical boundaries. The p-values are higher when using the discrete CNV
states in the linear regression model than those when using the continuous log2ratio. The p-
values, however, remain statistically significant within each racial group (Table 1). Pooling the
samples from the three racial groups together yielded highly significant p-values for the log2ratio
test as well as the copy number test with adjustment of population stratification using principal
component analysis 22. Among the top ten PCs, the first and second were associated with EDN1
gene expression. In the pooled CNV association test of EDN1 expression, we used these two PCs
to adjust for population stratification. The p-values of CNV_6q14.1 in the multiple regression
model were 4.34x10⁻⁶ (log2 ratio test) and 1.15x10⁻⁵ (copy number test). These p-values were
significant after Bonferroni correction for multiple testing, with adjusted p-values of 4.77x10⁻³
(log2 ratio test) and 1.27x10⁻² (copy number test). The results are similar when including the top
10 PCs in the adjustment model (nominal p-values are 1.07x10⁻⁵ for log2 ratio test and 2.66x10⁻⁵
for copy number test).
The proportion of variance (R2) explained by this CNV ranges from 0.071 in the Asians
to 0.142 in the Africans (log2ratio test), and from 0.058 in the Asians to 0.121 in the Africans
(copy number test). The R2 values from the copy number test are slightly smaller than those
obtained when using the mean log2ratio as the independent variable. The R2 values between the
two pooled tests (mean log2ratio vs. CNV state) are comparable (0.146 vs. 0.143). Previous
studies found that R2 values or p-values generated in the association test using the log2 ratios or
n stratificationnnnnnnnnnnnn u
nd wwwwwwwwwwwwwwwwwerereerrerererererereerererererrreeee e eeeeeeeeeeeeeeee asasasasasasasasassasasasasasassaaa sosososossosossoosososososososososoosoccccciciccccccccccc a
t e
i p
- p
thhhhhe ee e poolededededed CCCCCNVNVNVNVNV a a aaassssssococococociaiaiaiaiatitititt onnnnn tt tesst offfff ddd EDEDEDEDEDN1N1N1N1N1 e e eexpxpxpxpxpreeeessssssssssioioioioion,n,n,n,n, w w w w we e ee e usuuuu e
ionnnnn s sssstrtrtrtrtratatatatatififififificiciccaaaaatitititiiononononon. ThThThThTheee ee p-vavavavavalululululueseseseses ooooof ff CNCNCNCNCNVVV_VV 6q6q6q6q6q1414141414.111 ininininin ttttthehehehehe mmmmmulululuu titititt p
-6 ( (lologgg222 r r ratatatioio tt tesesest)t)))) aa andnd 11 1.1.1.15x5x5x101010-5555 ( ((((cococopypypypyy nn numumumbeberrr teteteststst).).))) TT Thehesesese p pp p
by guest on July 8, 2018http://circgenetics.ahajournals.org/
Dow
nloaded from

10
the CNV genotypes are strongly correlated (Pearson correlation coefficients > 0.9), indicating
that log2 ratios can be used directly 3. In our study, we also found that the linear relationship
between CNV_6q14.1 and EDN1 expression is very similar using either log2 ratio or CNV
genotype (Figure 1), and the R2 values or p-values from the linear regression model are also
consistent (Table 1).
In addition, we examined the heterogeneity of the estimated betas of the CNV_6q14.1
association with EDN1 gene expression levels in three racial groups, using Cochran's Q test 23
and Higgins’s inconsistency test 24. The p-value of the Cochran's Q test was 0.649 and the I2
value was 4.6% in the inconsistency test (possible range 0% to 100%, I2 less than 25% indicates
low heterogeneity) 24. Both tests indicate that no heterogeneity was observed across the
CNV_6q14.1-EDN1 association results from three racial groups. The beta coefficients for CNV
associations are all of the same relative magnitude and direction of association (e.g. 0.381
(Asian), 0.427 (Caucasian), and 0.609 (African) for the CNV genotype association). We
recognize, however, that we may have low power to detect heterogeneity with only three groups.
Table 2 summarizes the population genetics of this EDN1 associated CNV. The minor
allele (i.e. deletion allele) frequency (MAF) in Caucasians is 0.242, which is much higher than
that in Asian (MAF=0.061) and African (MAF=0.075) populations. None of the three
populations have significant p-values from the chi-square test of Hardy-Weinberg equilibrium
(HWE), with an alpha level of 0.05 (Table 2). The EDN1 associated CNV spans 66 kbp on
6q14.1 starting at 79,025,772 bp and ending at 79,091,892 bp (NCBI built 36). This CNV has
been previously identified and repeatedly reported in several human CNV studies 2, 25, 26.
The genome-wide association of 752,277 autosomal SNPs (MAF>5% and call rate >
95%) with EDN1 gene expression level was conducted using all 210 unrelated HapMap subjects
00%, I less thhhhhhhhhhhhhanaaaaaaaaaa
was obobobobobobobobbobboobobobobobbsesesesesesesesesseseseseseseseseseseeses rvvrvrvvrvrvvrvvrvvvrvrvrvrvvrvvrvvedededededededededededededdededdeeded aaaaaaaaaaaaaaaaaaaacr
i
o e
c o
rrrresesesesesululululultstststss f ff f frororororom m m mm thththrerererr e raraciiiialalalala aaaaassssssssociatitititit ononononon grgrgrgg ououououo pspspspss. ThThThhhe e e ee bebebebebetaaaaa cc c ccoeoeoeoeoeffffff i
of thththththee eee sasasasasamemememme rrrrrelelellelatatatttiviii e eee mamamamamagnnnnnitititititudududududee eee ananananand dddd dididididirererererectctctctctioioioioionn nnn ofofofoof aaaaasssssssss ocoooo iaiaiaaatititittiononononon (( (e
casasasiaian)n), ananandd 000.606060999 (A(A(( frfricicccananan) ) )) foforrr ththe ee CNCNCNVVV gegegegg nononotytytyyypepepepp aa assssssococociaiatitiio
by guest on July 8, 2018http://circgenetics.ahajournals.org/
Dow
nloaded from

11
with adjustment for population stratification by principal component analysis (Price 2006).The
lowest p-value among 752,277 SNP tests for the pooled sample is 1.06x10⁻⁶ which is not
significant after adjusting for multiple testing (Bonferoni corrected p-value is 0.79). Within the
flanking region of CNV_6q14.1 (25 kb upstream and downstream), there are 13 SNPs (5
upstream and 8 downstream) genotyped on the Affymetrix 6.0 array with a minor allele
frequency larger than 5% and call rate larger than 95%. Their distances and LD correlations to
CNV_6q14.1, and the associations with EDN1 gene expression levels are summarized in
supplementary Table 1. The lowest p-value among thirteen SNPs is 0.006 (rs818269). None of
these neighboring SNPs have strong LD with CNV_6q14.1.
Discussion
CNVs have been suggested to influence CVD due to their potential biological effects on
various CVD candidate genes 14. One plausible mechanism is indicated by the effect of CNV on
the gene expression levels of given disease candidate genes 10.Using unrelated Asians,
Caucasians, and Africans from HapMap samples, we investigated the associations between
genome-wide CNVs with the gene expression levels of the endothelin system, which includes
well-studied candidate genes for hypertension, atherosclerosis, heart failure, CKD and diabetes.
In this study, a known deletion variation on chromosome 6 was significantly associated with
EDN1 expression in each of the three racial groups considered.
Although there is no known gene overlapped with the identified CNV region on
chromosome 6, four genes are located within 1 Mbp window from the CNV region, including 5-
hydroxytryptamine (serotonin) receptor 1B (HTR1B, 796 Kbp upstream); interleukin-1 receptor-
associated kinase 1 binding protein 1 (IRAK1BP1, 608 Kbp downstream), pleckstrin homology
domain interacting protein (PHIP, 684 Kbp downstream), and high mobility group nucleosomal
b o
a f
l A
beeeeeenenenenen suggegegegegeststststs ededdeded ttt tto oo o o innnnnflflflflflueueueuuencncncncn e eee CVCVDD dududududue e e e e totoototo tt ttheheheheeiririririr potototototenenenenentitttt alalalalal bibibibibioloooo o
ate eeee gegegegegenenenenenes 1114. OnOnOnOnOne eee plplplplplauauauauausiblblblblblee eee mememememechchchchchanananananisisisisismmm mm isisisiss ii iiindndndndndiiiiicacacacaateteteteted dddd bybybybyby tt ttthehehehee ee eeef
lellevevevelsls o o of f ff gigigg vevevennn didiseseseasasaseee cacacandndididatatateee gegegenenenesss 1001010.U.U.Usisingngnggg uu unrnrnrelelatatateded A AA A
by guest on July 8, 2018http://circgenetics.ahajournals.org/
Dow
nloaded from

12
binding domain 3 (HMGN3, 942 Kb downstream). Two neighboring blocks within the
chromosome 6 CNV, 79033035 bp -79033306 bp and 79033329 bp -79033429 bp, are highly
conserved among 10 mammalian species (UCSC genome browser). The log-odds score for the
two blocks are 644 and 272 correspondingly computed by PhastCons 27 which is a program for
identifying evolutionarily conserved elements in a multiple alignment, given a phylogenetic tree.
The log-odds scores range from 0 to 1000 and the higher score indicates more conserved region
across species. One the other hand, approximately 60% of conserved bases in the ENCODE
regions are assigned at least one molecular function 28. The inter-species conservation within the
chromosome 6 CNV region suggests plausible biological functions.
Three other CNVs were also associated with gene expression levels of EDN3, ECE1 and
EDNRA. Taken together, these associations demonstrate a possible impact of CNVs on CVD,
CKD, and diabetes through the endothelin system, although further epidemiological studies are
needed to confirm the potential relationships between the CNVs and these complex common
diseases.
In this study, the gene expression profile was measured in transformed B-lymphocytes.
Therefore the CNV association may not be generalized to other cell-types or tissues due to
potential cell-type/tissue specific gene expression. Because of the high heritability of many gene
expression levels, studying CNV association with gene expression in transformed B-
lymphocytes can be an essential approach to understanding the molecular mechanisms between
CNV and disease traits through examining the intermediate gene expression traits.
For CNV analysis, data quality needs to be carefully controlled to guard against false
CNV calls. In Affymetrix Genotyping ConsoleTM, the Contract QC (CQC) value was calculated
for each chip (Affymetrix 6.0) for each of the 270 HapMap subjects. The CQC values of the
ns.
sion leleleleleleleleleleeleeleleleleleleeevevevevevevevevevevevevevevevevevevvveelslslslslslslslslslsllssslslslls o o o o o o o oooo o oooo o ooooof ff f f f f f f f f ff f f f fff f EEEDEEEEEEEEEEEE
t N
h
h
thhhhheeeree , thessssse eee e asasaasa sososososocicicicic atatatattioioioioionsnsnsnsns dddddememememmonoo ssttratatattate e ee e a a aa a popopopopossssssssibibibibiblell iiiiimpmpmpmpmpacaaacact t t t ofofofofof C CC CCN
hrooooougugugugugh hhhh thththththe eee enenenenendododododoththththhelelelelelininininin sysysysysystttttememememem, alalalalalthththhhouououououghghghghgh fffffurururururththththheeeree eeeeepipipipipidedededed mimimimim olololollogogogoo
he ee popopotetetentntntiaiall rererelalatitionononshshipippps s s bebetwtwtweeeeeennn thththheee CNCNCNVsVsVs aa andnd tt thehesesese cc comomomppp
by guest on July 8, 2018http://circgenetics.ahajournals.org/
Dow
nloaded from

13
chips from the 210 unrelated HapMap subjects range from 1.0 to 3.7 with a mean of 2.6. All of
the chips passed the CQC threshold of 0.4, which is recommended by Affymetrix for controlling
genotyping quality. These high-quality chip results were used in the CNV analysis.
CNV association studies show promise as a complement to the current GWA studies
using SNPs to identify disease loci on the human genome 10. Because the CNVs have large base-
pair coverage on the human genome 2, their functional roles in human disease development are
substantial. At least one thousand human CNVs have been characterized and validated in recent
years 2, 25, 29 and more will be discovered with improved technology 30. Unlike the SNPs, CNVs
tend to have differential boundaries across individuals 30. This property of CNV limits the
current population studies with the more conserved CNVs with common boundaries among
individuals. The advancement of technology in both CNV measurements and CNV calling
algorithms 21 will improve our understanding of the boundaries, origins and distributions of
human CNVs, as well as our knowledge of their functional roles in human diseases. The ongoing
GWA studies provide a unique opportunity to study the genome-wide CNV association with
CVD and other common human diseases. Along with the genome-wide SNP data, the genome-
wide CNV data will help us to better understand the genetic architecture of common diseases.
roperty of CNVVVVVVVVVVVVVVVVV
ommmmmmmmmmmmmmmmmmmononononononononononoononononononononnono bbbbbbbbbbbbbbbbbbbbbbouououououououououououououuououououuoundndndndndndndndndndndndndnddndndndndnn a
a N
m r
l s
ananananancccecc mennnnnt t t ofofooo tttttececececechnhnhnhnhnololololologogogogogy y y yy ininin b bbbothh CNNNNNV V VV V memememem asasasassurururururemmmmmenenenenentstttt aaaaandndndndnd C C C CCN
mprovovovovove eeee ououououour rr unununuundedededed rsrrrr tataataandndndndndinininini g gggg ofofofofof t tttthehehehehe b bbbbouououououndndndndndaaaaaririririieseseseses, orororoorigggggininininins ssss annnnnddd dd didididdistststss r
lllll asasas oo oururur k knononowlwlededgegegegg oo off ththhheieirrr fufuncncnctitiionononalal rr rololleseses i innn huhumamamannn didiseseseasaaa
by guest on July 8, 2018http://circgenetics.ahajournals.org/
Dow
nloaded from

14
Acknowledgement
We would like to thank Michael Todd Greene, University of Michigan, Ann Arbor, Michigan,
and Greta M. Linse, Christophe G. Lambert, Golden Helix Inc., Bozeman, Montana, for their
insightful comments.
Funding Sources
This work was supported by National Institute of Health grant HL087660 and HL086694.
Conflict of Interest Disclosures
None.
by guest on July 8, 2018http://circgenetics.ahajournals.org/
Dow
nloaded from

15
References
1. Feuk L, Carson AR, Scherer SW. Structural variation in the human genome. Nat Rev Genet.
2006; 7: 85-97.
2. Redon R, Ishikawa S, Fitch KR, Feuk L, Perry GH, Andrews TD, Fiegler H, Shapero MH,
Carson AR, Chen W, Cho EK, Dallaire S, Freeman JL, Gonzalez JR, Gratacos M, Huang J,
Kalaitzopoulos D, Komura D, MacDonald JR, Marshall CR, Mei R, Montgomery L, Nishimura
K, Okamura K, Shen F, Somerville MJ, Tchinda J, Valsesia A, Woodwark C, Yang F, Zhang J,
Zerjal T, Zhang J, Armengol L, Conrad DF, Estivill X, Tyler-Smith C, Carter NP, Aburatani H,
Lee C, Jones KW, Scherer SW, Hurles ME. Global variation in copy number in the human
genome. Nature. 2006; 444: 444-454.
3. Stranger BE, Forrest MS, Dunning M, Ingle CE, Beazley C, Thorne N, Redon R, Bird CP, de
Grassi A, Lee C, Tyler-Smith C, Carter N, Scherer SW, Tavare S, Deloukas P, Hurles ME,
Dermitzakis ET. Relative impact of nucleotide and copy number variation on gene expression
phenotypes. Science. 2007; 315: 848-853.
4. Singleton AB, Farrer M, Johnson J, Singleton A, Hague S, Kachergus J, Hulihan M,
Peuralinna T, Dutra A, Nussbaum R, Lincoln S, Crawley A, Hanson M, Maraganore D, Adler C,
Cookson MR, Muenter M, Baptista M, Miller D, Blancato J, Hardy J, Gwinn-Hardy K. alpha-
Synuclein locus triplication causes Parkinson's disease. Science. 2003; 302: 841.
5. The International Schizophrenia Consortium. Rare chromosomal deletions and duplications
increase risk of schizophrenia. Nature. 2008; 455:237-41.
cooocoocococococoocooococoooooooopypypypypypypypypypypypypypypypyypyyypyyy nnnnnnnnnnnnnnnnnnnnnnnnnnumumumumumumumumumumumumumumumumumumumumummmbebebebebebebebebebebebbebebebebebebbebbbbberrrr rrrrrrrrrrr ininininininininininininiiinininin ttt tttttttttttt
06; 444: 444-454.
e n
l H
06; 4444444 4:4:4:4:4 4 44 444444444444-454.
esssstttt t MSMSMMMS, , ,, , DuDuDuDuD nnnnnnnnnninininining ggg M,M,M,M,M, III I Ingngngngngleelelele C C CCCE,E,E,E,E, BeBeBeBeBeazazazazazleleleleleyyy yy C,C,C,C,C, TT T T Thohohohohornrnrnrnrne e e ee N,N,NN,N R RRRRedededddooonoo
lererer-SSSmimimiththth C CC,,, CaCaCaCC rtrtrttererer NNNNN,,, ScScScSS hehehehh rerererrr SWSWSWSWSW,,, TaTaTaTT vavavarerere SSSS,,, DeDeDelololol ukukukasasas PP P,,, HHHH
by guest on July 8, 2018http://circgenetics.ahajournals.org/
Dow
nloaded from

16
6. Walsh T, McClellan JM, McCarthy SE, Addington AM, Pierce SB, Cooper GM, Nord AS,
Kusenda M, Malhotra D, Bhandari A, Stray SM, Rippey CF, Roccanova P, Makarov V, Lakshmi
B, Findling RL, Sikich L, Stromberg T, Merriman B, Gogtay N, Butler P, Eckstrand K, Noory L,
Gochman P, Long R, Chen Z, Davis S, Baker C, Eichler EE, Meltzer PS, Nelson SF, Singleton
AB, Lee MK, Rapoport JL, King MC, Sebat J. Rare structural variants disrupt multiple genes in
neurodevelopmental pathways in schizophrenia. Science. 2008; 320: 539-543.
7. Xu B, Roos JL, Levy S, van Rensburg EJ, Gogos JA, Karayiorgou M. Strong association of de
novo copy number mutations with sporadic schizophrenia. Nat Genet. 2008; 40: 880-885.
8. Sebat J, Lakshmi B, Malhotra D, Troge J, Lese-Martin C, Walsh T, Yamrom B, Yoon S,
Krasnitz A, Kendall J, Leotta A, Pai D, Zhang R, Lee YH, Hicks J, Spence SJ, Lee AT, Puura K,
Lehtimaki T, Ledbetter D, Gregersen PK, Bregman J, Sutcliffe JS, Jobanputra V, Chung W,
Warburton D, King MC, Skuse D, Geschwind DH, Gilliam TC, Ye K, Wigler M. Strong
association of de novo copy number mutations with autism. Science. 2007; 316: 445-449.
9. Weiss LA, Shen Y, Korn JM, Arking DE, Miller DT, Fossdal R, Saemundsen E, Stefansson
H, Ferreira MA, Green T, Platt OS, Ruderfer DM, Walsh CA, Altshuler D, Chakravarti A, Tanzi
RE, Stefansson K, Santangelo SL, Gusella JF, Sklar P, Wu BL, Daly MJ, Autism Consortium.
Association between microdeletion and microduplication at 16p11.2 and autism. N Engl J Med.
2008; 358: 667-675.
10. McCarroll SA, Huett A, Kuballa P, Chilewski SD, Landry A, Goyette P, Zody MC, Hall JL,
Brant SR, Cho JH, Duerr RH, Silverberg MS, Taylor KD, Rioux JD, Altshuler D, Daly MJ,
lsh TTTTTTTTTTTTTTTTTTTTT, YYYaYYYYYYYYYYYYYYYYYYYY mrommmmmmmmmmmmmmmmmm B
L
t V
M M
J,J,J,J,, LL L LLeotttttta aaaa A,A,A,A,A, Paiaa D, Zhang ggg R,,, LLLeee YH,H,H, HHHHHiciiii ks J , SpSpSpSpSpence SSJ,J,J,, L
tererererer DD D D D, , , GrGrGrGrGregegeggererererersesesesesen nnn PKPKPKPKPK, ,,,, BrBrBrBrBregegegegegmamamamamann nnn J,J,JJ,J SSSSSutututututclclclclcliffiffffefefefefe J J JJJS,S,S,SS, JJJJJobobobobobanananananpupupupuputrtrtraaa aa VVVVV
MCMMC,, , SkSkusususee e D,DD,DD G GGGGeseseschchhhhwiiwiiindndddd DHDHDHDHDH,, , GiGiGGiG llllll iaiamm TCTCTCTCC,, , YeYYeYY KK KKK,, , WiWiglglerere M MM
by guest on July 8, 2018http://circgenetics.ahajournals.org/
Dow
nloaded from

17
Xavier RJ. Deletion polymorphism upstream of IRGM associated with altered IRGM expression
and Crohn's disease. Nat Genet. 2008; 40: 1107-1112.
11. Helgadottir A, Thorleifsson G, Manolescu A, Gretarsdottir S, Blondal T, Jonasdottir A,
Jonasdottir A, Sigurdsson A, Baker A, Palsson A, Masson G, Gudbjartsson DF, Magnusson KP,
Andersen K, Levey AI, Backman VM, Matthiasdottir S, Jonsdottir T, Palsson S, Einarsdottir H,
Gunnarsdottir S, Gylfason A, Vaccarino V, Hooper WC, Reilly MP, Granger CB, Austin H,
Rader DJ, Shah SH, Quyyumi AA, Gulcher JR, Thorgeirsson G, Thorsteinsdottir U, Kong A,
Stefansson K. A common variant on chromosome 9p21 affects the risk of myocardial infarction.
Science. 2007; 316: 1491-1493.
12. McPherson R, Pertsemlidis A, Kavaslar N, Stewart A, Roberts R, Cox DR, Hinds DA,
Pennacchio LA, Tybjaerg-Hansen A, Folsom AR, Boerwinkle E, Hobbs HH, Cohen JC. A
common allele on chromosome 9 associated with coronary heart disease. Science. 2007; 316:
1488-1491.
13. Samani NJ, Erdmann J, Hall AS, Hengstenberg C, Mangino M, Mayer B, Dixon RJ,
Meitinger T, Braund P, Wichmann HE, Barrett JH, Konig IR, Stevens SE, Szymczak S, Tregouet
DA, Iles MM, Pahlke F, Pollard H, Lieb W, Cambien F, Fischer M, Ouwehand W, Blankenberg
S, Balmforth AJ, Baessler A, Ball SG, Strom TM, Braenne I, Gieger C, Deloukas P, Tobin MD,
Ziegler A, Thompson JR, Schunkert H, WTCCC and the Cardiogenics Consortium.
Genomewide association analysis of coronary artery disease. N Engl J Med. 2007; 357: 443-453.
14. Pollex RL, Hegele RA. Copy number variation in the human genome and its implications for
cardiovascular disease. Circulation. 2007; 115: 3130-3138.
e H
bj o
h e
errrrrtststststsemliiiiddiddd s AAA,AA Kava asslar N, Stewaw rt AAA, ,,, RoRoRoRooberttttts R,,, CC CCox DR, H
bjaaaaaerererererg-g-ggg HaHaHaHaHansnsnsnsenenenenen A A A A A, FoFoFoFoFolslslslslsomomomomom ARARARARAR, ,,,, BoBoBoBoBoerererererwiwiwiwiwinknknknknklelelelele E E E EE, ,, HoHoHoHoHobbbbbbbbbbs s s ss HHHHHHHHHH, ,,, CoCCoCC
hrrromomo osososomomo ee e 9 99 99 asasassososociiciiatatattteddeddd w wwitititith hh hh cococororoonanaaryryy hh hhheaeaeartttrtrt dd ddisisi eaeaeasesese.. . ScScScieieiencncnceee
by guest on July 8, 2018http://circgenetics.ahajournals.org/
Dow
nloaded from

18
15. Yanagisawa M, Kurihara H, Kimura S, Tomobe Y, Kobayashi M, Mitsui Y, Yazaki Y, Goto
K, Masaki T. A novel potent vasoconstrictor peptide produced by vascular endothelial cells.
Nature. 1988; 332: 411-415.
16. Re RN. Molecular Mechanisms in Hypertension. London, UK: Taylor & Francis; 2006.
17. Rossi GP, Pitter G. Genetic variation in the endothelin system: do polymorphisms affect the
therapeutic strategies? Ann N Y Acad Sci. 2006; 1069: 34-50.
18. The International HapMap Consortium. The International HapMap Project. Nature. 2003;
426: 789-796.
19. Hawkins DM. On the Choice of Segments in Piecewise Approximation. IMA Journal of
Applied Mathematics. 1972; 9: 250-256.
20. Hawkins DM. Fitting multiple change-point models to data. Computational Statistics and
Data Analysis. 2001; 37: 323-341.
21. Korn JM, Kuruvilla FG, McCarroll SA, Wysoker A, Nemesh J, Cawley S, Hubbell E, Veitch
J, Collins PJ, Darvishi K, Lee C, Nizzari MM, Gabriel SB, Purcell S, Daly MJ, Altshuler D.
Integrated genotype calling and association analysis of SNPs, common copy number
polymorphisms and rare CNVs. Nat Genet. 2008; 40: 1253-1260.
22. Price AL, Patterson NJ, Plenge RM, Weinblatt ME, Shadick NA, Reich D. Principal
components analysis corrects for stratification in genome-wide association studies. Nat Genet.
2006; 38: 904-909.
n A
s
t S
n ttttthehehehehe CCC CChohohohh iccccceee e of Segments in PPPieiieii cewise AAAAAppppprororororoximation. IMA
s. 19191911972; ;;;; 9:9999 22500---25656565656. ....
ttting mumumumumultltltltltipipipipiplelelelele c c c hhhhhananananangegegegeg -p-p-p-p-poioioioiointntntntnt m m m m modododododelelelee s s s tototototo d d d d datatattta.a.a.a.a. CoCoCoCoCompmpmpmpmputututututatataaa ional SSS
by guest on July 8, 2018http://circgenetics.ahajournals.org/
Dow
nloaded from
19
23. Cochran WG. The combination of estimates from different experiments. Biometrics. 1954;
10: 101-129.
24. Higgins JP, Thompson SG, Deeks JJ, Altman DG. Measuring inconsistency in meta-
analyses. BMJ. 2003; 327: 557-560.
25. Wang K, Li M, Hadley D, Liu R, Glessner J, Grant SF, Hakonarson H, Bucan M. PennCNV:
an integrated hidden Markov model designed for high-resolution copy number variation
detection in whole-genome SNP genotyping data. Genome Res. 2007; 17: 1665-1674.
26. McCarroll SA, Kuruvilla FG, Korn JM, Cawley S, Nemesh J, Wysoker A, Shapero MH, de
Bakker PI, Maller JB, Kirby A, Elliott AL, Parkin M, Hubbell E, Webster T, Mei R, Veitch J,
Collins PJ, Handsaker R, Lincoln S, Nizzari M, Blume J, Jones KW, Rava R, Daly MJ, Gabriel
SB, Altshuler D. Integrated detection and population-genetic analysis of SNPs and copy number
variation. Nat Genet. 2008; 40: 1166-1174.
27. Siepel A, Bejerano G, Pedersen JS, Hinrichs AS, Hou M, Rosenbloom K, Clawson H, Spieth
J, Hillier LW, Richards S, Weinstock GM, Wilson RK, Gibbs RA, Kent WJ, Miller W, Haussler
D. Evolutionarily conserved elements in vertebrate, insect, worm, and yeast genomes. Genome
Res. 2005; 15: 1034-1050.
28. ENCODE Project Consortium. Identification and analysis of functional elements in 1% of
the human genome by the ENCODE pilot project. Nature. 2007; 447: 799-816.
29. Perry GH, Ben-Dor A, Tsalenko A, Sampas N, Rodriguez-Revenga L, Tran CW, Scheffer A,
Steinfeld I, Tsang P, Yamada NA, Park HS, Kim JI, Seo JS, Yakhini Z, Laderman S, Bruhn L,
,,,,,,,,,,,,,,,,,,, W WW W W W WW W W WW WW WWWWWW WWysysysysysysysysysysysysysysysysysysysysysy okokokokokokokokokokokokkokokkokokkoo ererererererererererererererererrererrereree AAAAAAAAAA AAAAAAAAAA, ShShShSShSShShShShSSSSShSShShSSShh
W bbbbbbbbbbbbbbbbbbbbb ttttttttttttttt TTTTTTTTTTTTTTTTTTTTTT MMMMMMMMMMMMMMMMMMMMMMB, Kirby A, Elliott AL, Parkin M, Hubbell E, Webster T, Me
e a
e n
.
B, Kirby A,,,, Elliott AL, Parkin M, Hubbell E,,,,, Webster T, Me
errr rr RR,RRR Lincoooolnln SS SSS, NiNiNiNiNizzzararararari MMM, BBlumume eeee J,J,J,J,J, J J JJJonneees K K KKKW,W,W,W,W, RR RRRavavavavavaa R,R,R,RR D D DDDa
egrated deteeeeectctctctctioioioon nn n n ananananand dd dd popopopop pupupupupulalalalalatitiitionononnn-gggggenenenneneteteteteticicicicic a aa aanananananalylylylylysississis s s ss of SNPs an
. 2008; 4040404040: :::: 11111111116666666666-1-1-1-1- 17171717174.4444
by guest on July 8, 2018http://circgenetics.ahajournals.org/
Dow
nloaded from

20
Lee C. The fine-scale and complex architecture of human copy-number variation. Am J Hum
Genet. 2008; 82: 685-695.
30. Kidd JM, Cooper GM, Donahue WF, Hayden HS, Sampas N, Graves T, Hansen N, Teague
B, Alkan C, Antonacci F, Haugen E, Zerr T, Yamada NA, Tsang P, Newman TL, Tuzun E,
Cheng Z, Ebling HM, Tusneem N, David R, Gillett W, Phelps KA, Weaver M, Saranga D, Brand
A, Tao W, Gustafson E, McKernan K, Chen L, Malig M, Smith JD, Korn JM, McCarroll SA,
Altshuler DA, Peiffer DA, Dorschner M, Stamatoyannopoulos J, Schwartz D, Nickerson DA,
Mullikin JC, Wilson RK, Bruhn L, Olson MV, Kaul R, Smith DR, Eichler EE. Mapping and
sequencing of structural variation from eight human genomes. Nature. 2008; 453: 56-64. aaaaaaaaaaaaaaaaaaaaaatututututututututututututuututututututuurerererererererererererererererrererreree. 202020202020202020202020202020200202020202000808080808080808080808080808080808080800008;; ;; ;;;;;;;;;;; 4545454545454545454544545454455454 3333333333333333
by guest on July 8, 2018http://circgenetics.ahajournals.org/
Dow
nloaded from
21
Tables
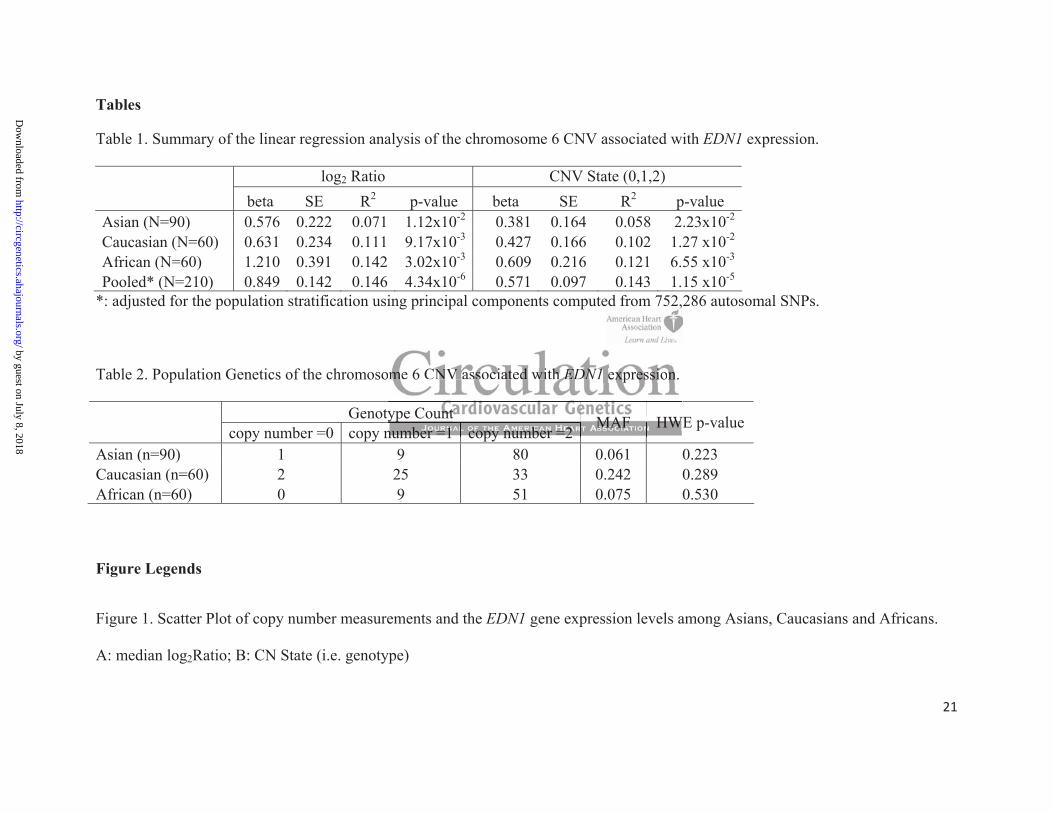
Table 1. Summary of the linear regression analysis of the chromosome 6 CNV associated with EDN1 expression.
log2 Ratio CNV State (0,1,2) beta SE R2 p-value beta SE R2 p-value
Asian (N=90) 0.576 0.222 0.071 1.12x10⁻² 0.381 0.164 0.058 2.23x10⁻²
Caucasian (N=60) 0.631 0.234 0.111 9.17x10⁻³ 0.427 0.166 0.102 1.27 x10⁻²
African (N=60) 1.210 0.391 0.142 3.02x10⁻³ 0.609 0.216 0.121 6.55 x10⁻³
Pooled* (N=210) 0.849 0.142 0.146 4.34x10⁻⁶ 0.571 0.097 0.143 1.15 x10⁻⁵
*: adjusted for the population stratification using principal components computed from 752,286 autosomal SNPs.
Table 2. Population Genetics of the chromosome 6 CNV associated with EDN1 expression.
Genotype Count copy number =0 copy number =1 copy number =2
MAF HWE p-value
Asian (n=90) 1 9 80 0.061 0.223 Caucasian (n=60) 2 25 33 0.242 0.289 African (n=60) 0 9 51 0.075 0.530
Figure Legends
Figure 1. Scatter Plot of copy number measurements and the EDN1 gene expression levels among Asians, Caucasians and Africans.
A: median log2Ratio; B: CN State (i.e. genotype)
ynumber 1
Wcopy number 2
memmmm 6 CNVNVNVNVNV a ssssssssss ccoccciaiaiaiai tet d d d wiiwithhhhh EDEDEDEDEDN1N1111 ee expxpxxx reeeeessssssss ioiioii n.nn
yyyypepp Countntntntnt nnnumumbebeeeerrrr =1=1111 cococc pypyyypy nnnnumumumumbebebebeb rrr =2=22=22
MAMAMAMAMAF F F F F HWWHWHW
by guest on July 8, 2018http://circgenetics.ahajournals.org/
Dow
nloaded from

by guest on July 8, 2018http://circgenetics.ahajournals.org/
Dow
nloaded from

by guest on July 8, 2018http://circgenetics.ahajournals.org/
Dow
nloaded from

Yan V. Sun, Patricia A. Peyser and Sharon L.R. KardiaLevel of Endothelin 1 in Transformed B-Lymphocytes from Three Racial Groups
A Common Copy Number Variation on Chromosome 6 Association with the Gene Expression
Print ISSN: 1942-325X. Online ISSN: 1942-3268 Copyright © 2009 American Heart Association, Inc. All rights reserved.
TX 75231is published by the American Heart Association, 7272 Greenville Avenue, Dallas,Circulation: Cardiovascular Genetics
published online August 2, 2009;Circ Cardiovasc Genet.
http://circgenetics.ahajournals.org/content/early/2009/08/02/CIRCGENETICS.109.848754World Wide Web at:
The online version of this article, along with updated information and services, is located on the
http://circgenetics.ahajournals.org/content/suppl/2009/08/02/CIRCGENETICS.109.848754.DC1Data Supplement (unedited) at:
http://circgenetics.ahajournals.org//subscriptions/
is online at: Circulation: Cardiovascular Genetics Information about subscribing to Subscriptions:
http://www.lww.com/reprints Information about reprints can be found online at: Reprints:
document. Permissions and Rights Question and Answer this process is available in the
located, click Request Permissions in the middle column of the Web page under Services. Further information aboutnot the Editorial Office. Once the online version of the published article for which permission is being requested is
can be obtained via RightsLink, a service of the Copyright Clearance Center,Circulation: Cardiovascular Genetics Requests for permissions to reproduce figures, tables, or portions of articles originally published inPermissions:
by guest on July 8, 2018http://circgenetics.ahajournals.org/
Dow
nloaded from

SUPPLEMENTAL MATERIAL
Supplemental Table 1. Summary of SNPs in the flanking region of CNV_6q14.1.
Marker Chr. Position (bp)
Allele EDN1
Expression Assoc. P
Distance to CNV_6q14.1
(bp)
LD with CNV_6q14.1 (R2)
Asian Caucasian African
rs6911854 6 79001258 C/T 0.015 24514 0.011 0.002 0.058
rs946138 6 79001613 C/T 0.862 24159 0.010 0.000 0.007
rs17728780 6 79019012 A/G 0.848 6760 0.000 0.041 0.113
rs16889799 6 79019300 A/G 0.373 6472 0.016 0.000 0.000
rs7751252 6 79019345 A/G 0.711 6427 0.000 0.041 0.039
CNV_6q14.1 6 79025772‐79091892 1.15x10‐5 0 NA NA NA
rs818316 6 79095953 A/C 0.084 4061 0.179 0.550 0.027
rs9448374 6 79108333 G/T 0.152 16441 0.000 0.000 0.038
rs818267 6 79108563 A/T 0.045 16671 0.008 0.744 0.037
rs818269 6 79108671 G/T 0.006 16779 0.008 0.744 0.189 rs235460 6 79109332 A/G 0.177 17440 0.007 0.261 0.008 rs235459 6 79109564 A/C 0.174 17672 0.008 0.288 0.064 rs16889893 6 79111910 A/T 0.534 20018 0.004 0.000 0.000 rs766797 6 79116509 C/T 0.534 24617 0.004 0.000 0.000
Top Related