


Languages
Pages
Legal

9 juni 2009
EMECOEuropean Marine Ecosystem Observatory
Remi Laane and Dave Mills

GoalWhy?ExamplesChallenges
9 juni 2009MODEG Brussels
Goal
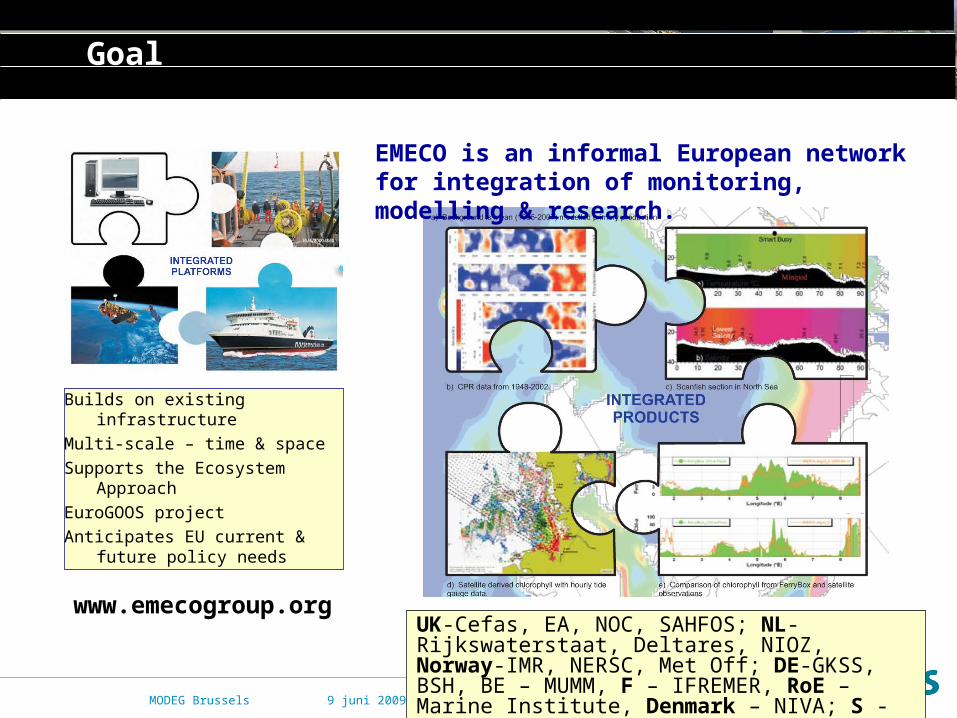
UK-Cefas, EA, NOC, SAHFOS; NL-Rijkswaterstaat, Deltares, NIOZ, Norway-IMR, NERSC, Met Off; DE-GKSS, BSH, BE – MUMM, F – IFREMER, RoE – Marine Institute, Denmark – NIVA; S - SMHI
Builds on existing infrastructure
Multi-scale – time & space
Supports the Ecosystem Approach
EuroGOOS project
Anticipates EU current & future policy needs
EMECO is an informal European network for integration of monitoring, modelling & research.
www.emecogroup.org

9 juni 2009MODEG Brussels
“The marine environment is a precious heritage that must be protected, restored and treated as such with the ultimate aim of providing biologically diverse and dynamic oceans and seas that are safe, clean, healthy and productive.”
Why? political and management
Sustainable use Ecosystem integrity
EMS, WFDGreenbook
socio-economical system natural ecosystem

9 juni 2009MODEG Brussels
Why? scientifically
1cm1mm 1dm 1m 10m 100m 1km 10km 100km 1000km
1sec
1 min
1 hour
1 day
1 week
1 month
1 year
10 year
MolecularProcesses
Movementby Individual
TurbulantPatch size
SurfaceWaves
Inertial/InternalWaves
Tides
PlanktonMigration
Phytoplanktonbloom/patch
Monsoon
GyreCirculation
Storms
EdgeWaves
Seasonal Fronts
After Dickey
Buoy
Ships
SpaceTim
e
Satellites
Eco -Models
9 juni 2009MODEG Brussels
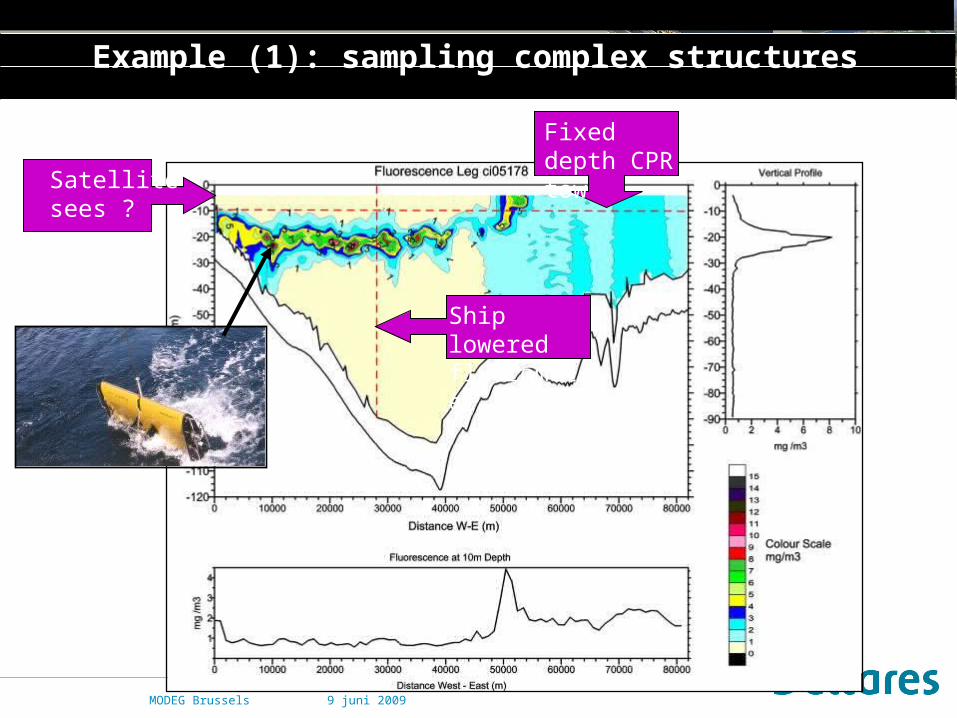
Example (1): sampling complex structures
Fixed depth CPR tow
Ship lowered fluorometer
Satellite sees ?

9 juni 2009MODEG Brussels
Example (2): integrated monitoringO
yste
r G
rou
nd
s U
K/N
L S
mar
tBu
oy
site
Ch
loro
ph
yll
(mg
m-3)
Ch
loro
ph
yll
Flu
ore
scen
c
Chlorophyll algorithms from F Gohin, IFREMER

9 juni 2009MODEG Brussels
Example (3): Environmental assessment -
0
10
20
30
40
50
60
70
Nov-02
Mar-03 Jul-03 Nov-03
Mar-04 Jul-04 Nov-04
Apr-05 Aug-05
TO
XN
(m
ol/
l)
0.0
5.0
10.0
15.0
20.0
25.0
Si
(m
ol/
l)
NAS TOXNWMS TOXNShip TOXNWMS Si
0
5
10
15
20
25
30
35
40
45
Nov-02 Mar-03 Jul-03 Nov-03 Mar-04 Jul-04 Nov-04 Apr-05 Aug-05
ch
loro
ph
yll ( g
/l)
Nit
art
eC
hlo
rop
hy
ll
Over-winter - November to February
Growing season – March to October
16.5 = +17.3 = +
24.8 = +15.9 = +
17.2 = +18.6 = +
29.3 = + 6.6 = --
30.3 = + 5.0 = --
29.8 = + ?
Liverpool BayLiverpool Bay SmartBuoy DataMills (2007)
Low frequency sampling (italic)
undersampling

9 juni 2009MODEG Brussels
Example (4): FerryBox
Appropriate spatial & temporal resolution (through water column)
Variables measured with required accuracy and precision
Operational – reliable, repeatable, Quality Assured
Effective monitoring requires:
Future monitoring :
• Spatial coverage poor in places
• Gaps in phytoplankton sampling
• augment current routes with relevant ‘eutropication’ sensors/samplers
Integrated approach
SmartBuoys

9 juni 2009MODEG Brussels
Example (5): EMECO example product
• User generated maps• ‘Agreed’ international map
of chlorophyll• Transparent information
product with estimate of confidence
• Step towards EU harmonisation
Data Integration & Assessment System
9 juni 2009MODEG Brussels
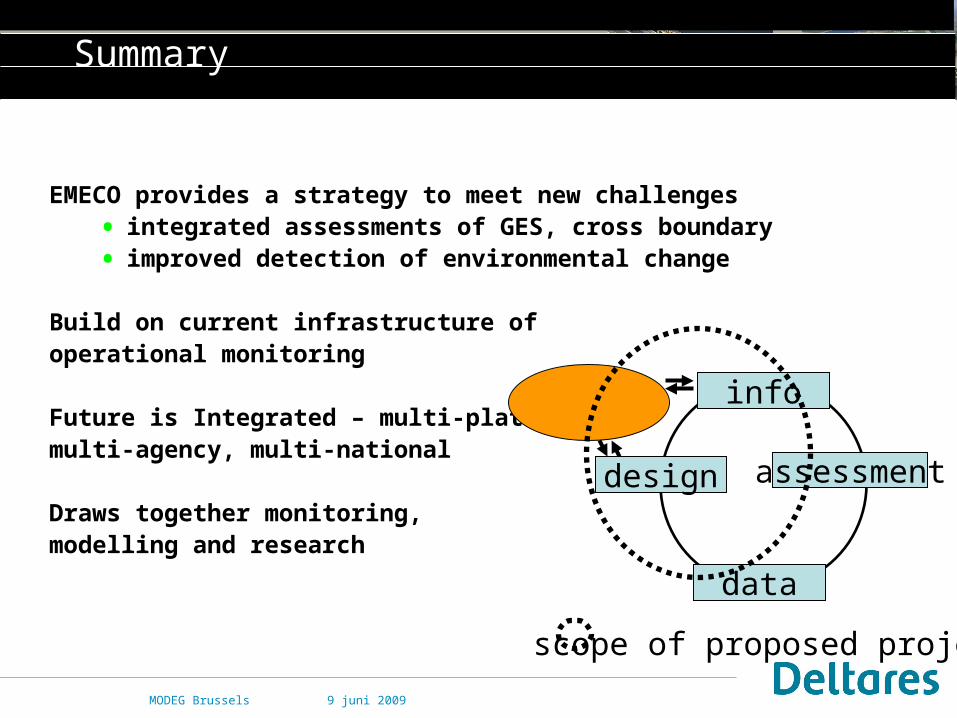
Summary
EMECO provides a strategy to meet new challenges
• integrated assessments of GES, cross boundary
• improved detection of environmental change
Build on current infrastructure of operational monitoring
Future is Integrated – multi-platform, multi-agency, multi-national
Draws together monitoring, modelling and research
info
assessment
data
scope of proposed project
design
Top Related