


Languages
Pages
Legal


04/19/23 IENG 486 Statistical Quality & Process Control 1
IENG 486 - Lecture 21
Short Run SPC

04/19/23 IENG 486 Statistical Quality & Process Control 2
Assignment
Reading: Chapter 6
Section 6.4: pp. 259 - 265 Chapter 9
Sections 9.1 – 9.1.5: pp. 399 - 410 Sections 9.2 – 9.2.4: pp. 419 - 425 Sections 9.3: pp. 428 - 430
Homework: CH 9 Textbook Problems:
1a, 17, 26 Hint: Use Excel charts!

04/19/23 TM 720: Statistical Process Control 3
Review
Shewhart Control charts Are for sample data from an approximate Normal distribution
Three lines appear on all Shewhart Control Charts UCL, CL, LCL
Two charts are used: X-bar for testing for change in location R or s-chart for testing for change in spread
We check the charts using 4 Western Electric rules Attributes Control charts
Are for Discrete distribution data Use p- and np-charts for tracking defective units Use c- and u-charts for tracking defects on units Use p- and u-charts for variable sample sizes Use np- and c-charts with constant sample sizes

04/19/23 TM 720: Statistical Process Control 4
Short Run SPC
Many products are made in smaller quantities than are practical to control with traditional SPC
In order to have enough observations for statistical control to work, batches of parts may be grouped together onto a control chart
This usually requires a transformation of the variable on the control chart, and a logical grouping of the part numbers (different parts) to be plotted.
A single chart or set of charts may cover several different part types
04/19/23 TM 720: Statistical Process Control 5
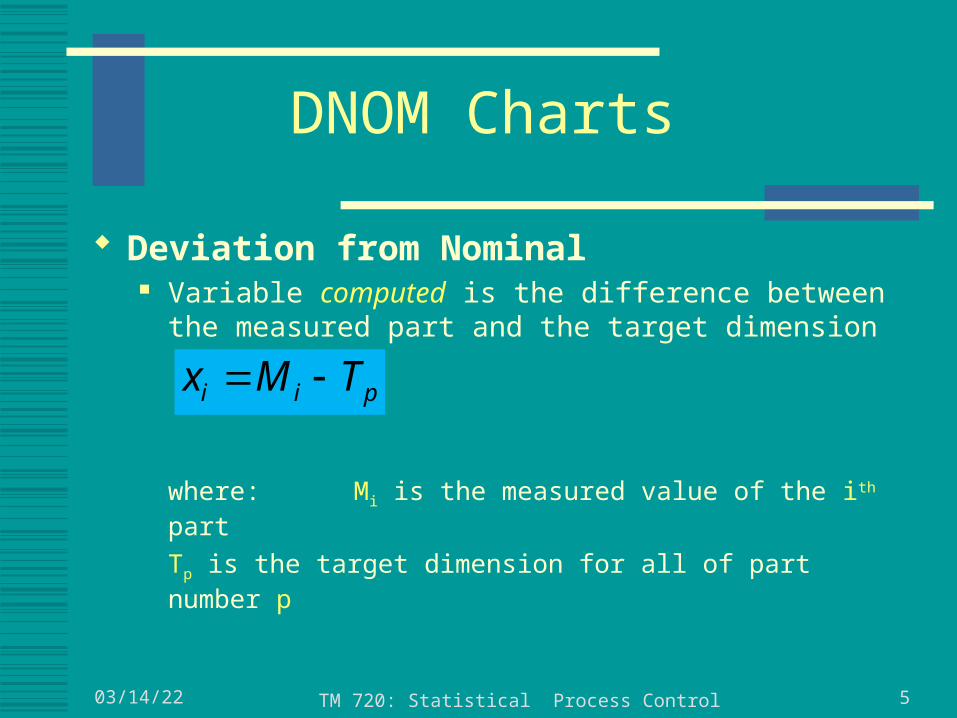
DNOM Charts
Deviation from Nominal Variable computed is the difference between the
measured part and the target dimension
where: Mi is the measured value of the ith part
Tp is the target dimension for all of part number p
pii TMx

04/19/23 TM 720: Statistical Process Control 6
DNOM Charts
The computed variable (xi) is part of a sub-sample of size n
xi is normally distributed n is held constant for all part
numbers in the chart group.
Charted variables are x and R, just as in a traditional Shewhart control chart, and control limits are computed as such, too:
RARAxLCL
xCL
RARAxUCL
22
22
0
RDLCL
RCL
RDUCL
3
4

04/19/23 TM 720: Statistical Process Control 7
DNOM Charts
Usage: A vertical dashed line is used to mark the charts at the point at
which the part numbers change from one part type to the next in the group
The variation among each of the part types in the group should be similar (hypothesis test!)
Often times, the Tp is the nominal target value for the process for that part type
Allows the use of the chart when only a single-sided specification is given
If no target value is specified, the historical average (x) may be used in its’ place

04/19/23 TM 720: Statistical Process Control 8
Standardized Control Charts
If the variation among the part types within a logical group are not similar, the variable may be standardized
This is similar to the way that we converted from any normally distributed variable to a standard normal distribution:
Express the measured variable in terms of how many units of spread it is away from the central location of the distribution

04/19/23 TM 720: Statistical Process Control 9
Standardized Charts – x and R
Standardized Range: Plotted variable is
where: Ri is the range of measured values for the ith sub-sample of this part type j
Rj is the average range for this jth part type
j
isi
R
RR
3
4
DLCL
RCL
DUCL
j

04/19/23 TM 720: Statistical Process Control 10
Standardized Charts – x and R
Standardized x: Plotted variable for the sample is
where: Mi is the mean of the original measured values for this sub-sample of the current part type (j)
Tj is the target or nominal value for this jth part type
j
jisi
R
TMx
2
2
0
ALCL
CL
AUCL

04/19/23 TM 720: Statistical Process Control 11
Standardized Charts – x and R
Usage: Two options for finding Rj:
Prior History Estimate from target σ:
Examples: Parts from same machine
with similar dimensions Part families – similar part
tolerances from similar setups and equipment
4
2
c
dσR j

04/19/23 TM 720: Statistical Process Control 12
Standardized Charts – Attributes
Standardized zi for Proportion Defective: Plotted variable is
Control Limits:
npp
ppz ii
)1(
3
0
3
LCL
CL
UCL

04/19/23 TM 720: Statistical Process Control 13
Standardized Charts – Attributes
Standardized zi for Number Defective: Plotted variable is
Control Limits:
)1( ppn
pnnpz ii
3
0
3
LCL
CL
UCL
04/19/23 TM 720: Statistical Process Control 14
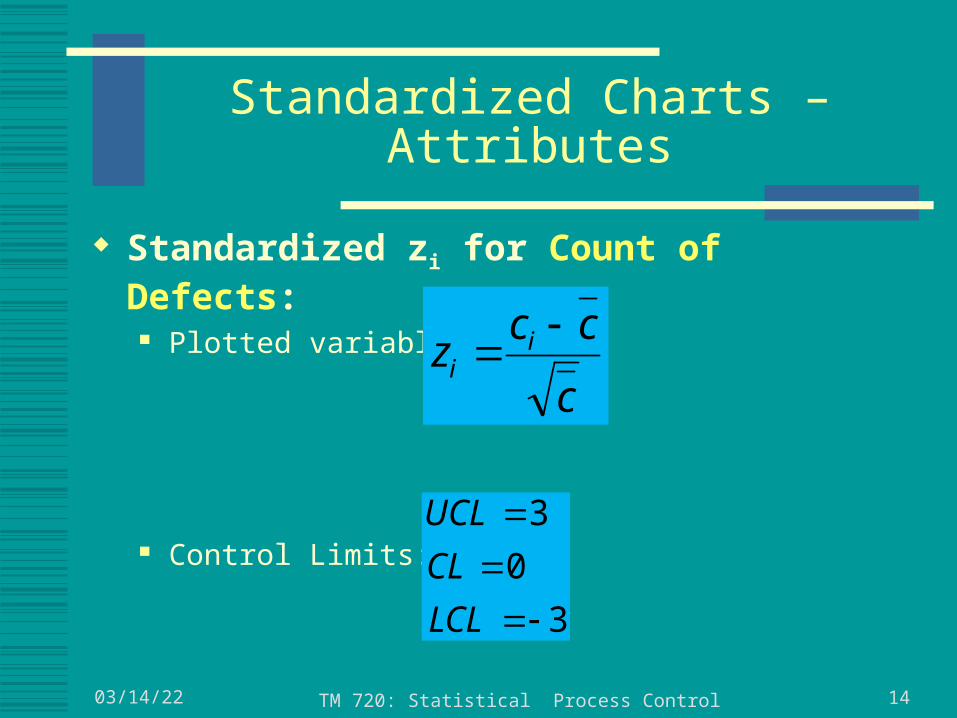
Standardized Charts – Attributes
Standardized zi for Count of Defects: Plotted variable is
Control Limits:
c
ccz ii
3
0
3
LCL
CL
UCL
04/19/23 TM 720: Statistical Process Control 15
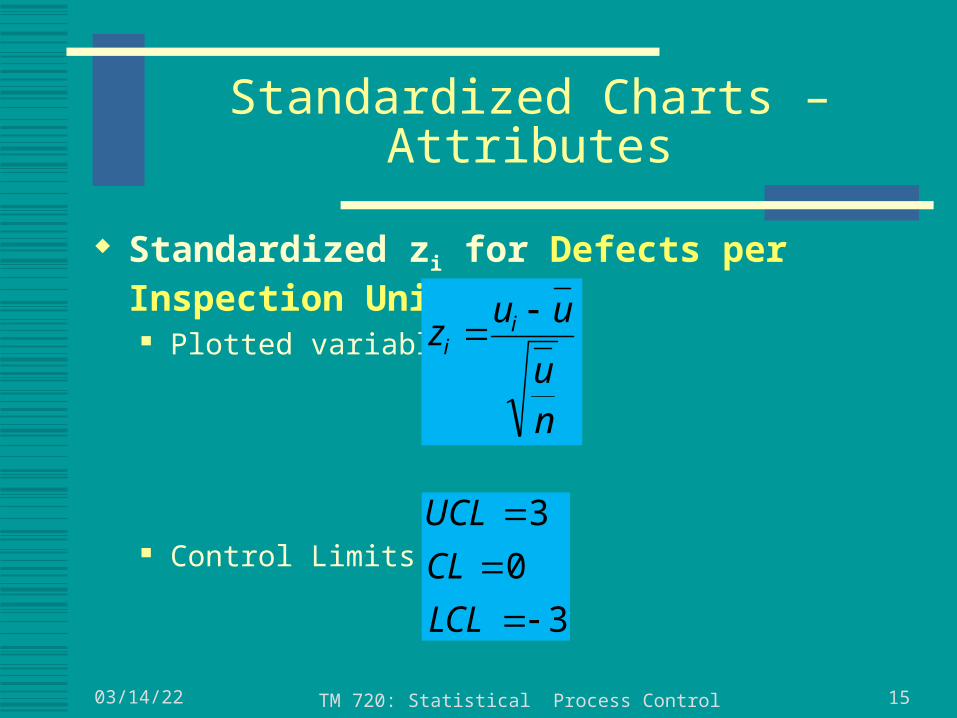
Standardized Charts – Attributes
Standardized zi for Defects per Inspection Unit:
Plotted variable is
Control Limits:
nu
uuz ii
3
0
3
LCL
CL
UCL

04/19/23 IENG 486 Statistical Quality & Process Control 16
Guidelines for Implementing Control Charts
1. Determine which process or product characteristic(s) to control
2. Determine where the charts should be implemented in process
3. Choose proper type of control charts
4. Decide what actions should be taken to improve processes
5. Select data-collection systems and computer software

04/19/23 IENG 486 Statistical Quality & Process Control 17
Determine Which Characteristic to Control and Where to Put Charts
1. To start, apply charts to any process or product characteristics believed important.
2. Charts found unnecessary are removed; others that may be required are added. (Usually more charts to start than after process has stabilized)
3. Keep current records of all charts in use, i.e., types and parameters of each.
4. If charts used effectively number of charts for variables increases and number of attributes charts decreases

04/19/23 IENG 486 Statistical Quality & Process Control 18
5. At beginning, use more attributes charts applied to finished units, i.e., near end of process. As more is learned about the process, these are replaced with variables charts earlier in process on critical process characteristics that affect nonconformities.Rule of thumb: the earlier in the process that control can be established, the better.
6. Control charts are an on-line process monitoring procedure; Maintain charts as close to work center as possible.Operators and process engineers should be directly responsible for using, maintaining and interpreting charts
Determine Which Characteristic to Control and Where to Put Charts
04/19/23 IENG 486 Statistical Quality & Process Control 19
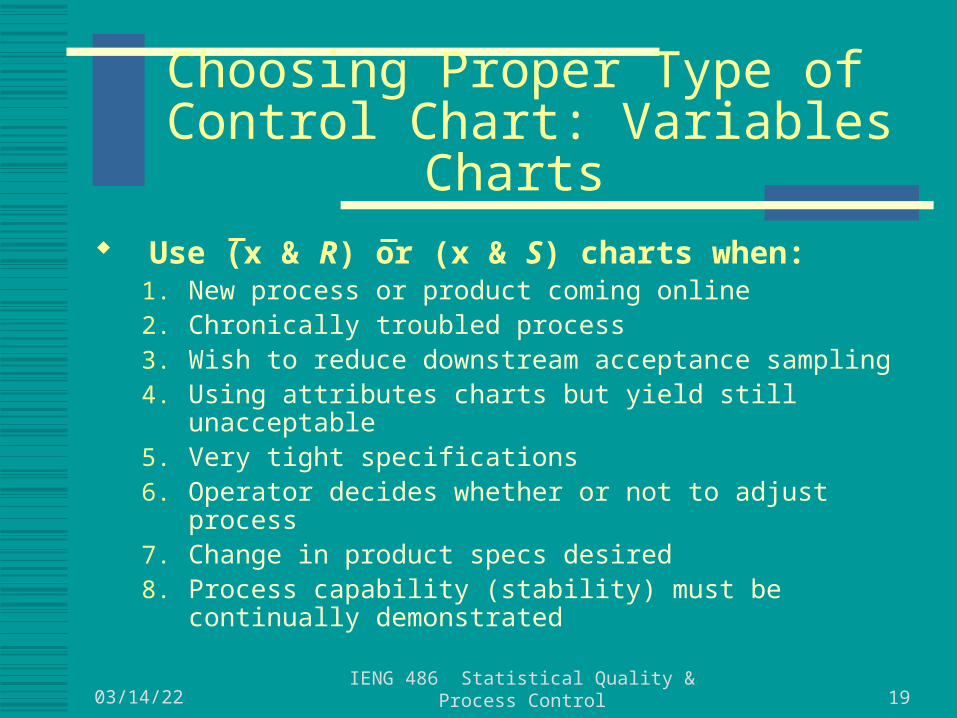
Choosing Proper Type of Control Chart: Variables Charts
Use (x & R) or (x & S) charts when:1. New process or product coming online2. Chronically troubled process3. Wish to reduce downstream acceptance sampling4. Using attributes charts but yield still unacceptable5. Very tight specifications6. Operator decides whether or not to adjust process7. Change in product specs desired8. Process capability (stability) must be continually
demonstrated

04/19/23 IENG 486 Statistical Quality & Process Control 20
Choosing Proper Type of Control Chart: Attributes Charts
Use p, np, c or u charts when:1. Operators control assignable causes and it is necessary to
reduce fallout2. Process is complex assembly operation and product quality
measured in terms of occurrence of nonconformities: e.g. computers, automobiles
3. Measurement data cannot be obtained4. Historical summary of process performance is necessary.
Attributes charts are effective for summarizing a process for management

04/19/23 IENG 486 Statistical Quality & Process Control 21
Choosing Proper Type of Control Chart: Individuals Charts
Use (x & MR), MA, EWMA, or CUSUM charts when:1. Repeated measures do not make sense
2. Inconvenient / impossible to obtain more than one measurement per sample
3. Automated testing allows you to measure every unit
(EWMA chart may be best)
4. Data becomes available very slowly and waiting for a larger sample is impractical.
Top Related