


Languages
Pages
Legal


8 Civil wars and guerrilla warfare in the
contemporary world: toward a joint
theory of motivations and opportunities
Carles Boix
The use of systematic and organized violence to effect political change is
a generalized phenomenon around the world. Singer and Small (1994)
put at 137 the number of civil wars that killed at least 1,000 during the
period from 1820 to 1990. The death toll from civil wars fought after
World War II has been estimated at a minimum of 16.2 million (Fearon
and Laitin 2003). According to the data gathered by Banks (1997),
between 1919 and 1997 there were over 500 spells of guerrilla warfare
around the world. In the same period of time, close to 1,500 politically
motivated assassinations or attempted assassinations of high government
officials or politicians were committed – at a rate of one every three
weeks. Banks codes a similar number of revolutionary or rebellious acts
against the central government and about 4,000 political riots – or
almost one per week.
A first generation of researchers working on the causes of political
violence emphasized the presence of “structural” causes to explain civil
wars and guerrilla warfare. Modernization scholars traced rebellion to
economic inequality (Muller 1985; Paige 1975; Russett 1964) and the
impact of economic modernization and the position or claims of par-
ticular social groups (Huntington 1968; Wolf 1969; Gurr 1973). A later
line of research related violent conflict to ethnic nationalism (Horowitz
1985; Connor 1994).
More recently, scholars working on civil wars have offered a strong
critique of the central assumption made by the former generation of
scholars that rebellious activities occur when “grievances are sufficiently
acute that people want to engage in violent protest” (Collier and
Hoeffler 2001, 2). According to this position, the presence of economic
resentments, ethnic antagonisms, and personal or clique grudges are too
A first version of this essay was prepared for the Yale conference on “Order, Conflict, andViolence,” April 30–May 1, 2004. I thank the comments of the participants andparticularly of Robert Bates, Stathis Kalyvas, David Laitin, and Nicholas Sambanis.
197
MASOUD: 9780521897686c08 4/14/08 12:44:34pm page 197

widespread to specify the cases in which political violence will erupt.
Similarly, to maintain that all cases of violence point to the existence of
exaggerated grievances is also useless since the concept (and presence)
of “acute grievances” is particularly difficult to pin down. Hence, in a
world full of “grievances,” researchers must abandon any examination of
the political and economic motivation of actors to focus on the “oppor-
tunity” structures that facilitate the actual outbreak of violence. Accord-
ingly, Collier and Hoeffler (1999; 2001) have explained the occurrence of
civil wars as a function of greed (at least in their initial work). In their
account greed is fueled by the abundance of “natural resources” (meas-
ured through the percentage of primary products) and by the relatively low
life chances of potential rebels (proxied by rates of secondary-school
enrollment for males). In turn, Fearon and Laitin (2003, 75–76) have
hypothesized that “financially, organizationally, and politically weak cen-
tral governments render insurgency more feasible and attractive due to
weak local policing or inept and corrupt counterinsurgency practices” and
then concluded that civil wars happen in “fragile states with limited
administrative control of their peripheries” (88).
There is no doubt that, as forcefully stated by the political oppor-
tunities’ scholars, the first generation of work on civil wars and guerrilla
warfare was too broad and even ambiguous about the causes and agents
that motivated the generation of systematic and organized political
violence. Yet the alternative theory, based on the idea of strictly stressing
the opportunities that may be open to potential insurgents, remains
equally unconvincing, at least when interpreted in a strict manner. Civil
war and guerrilla onsets may be more likely in mountainous terrain
and in mining areas. Weak police and military forces are an invitation
to chaos and violence. Still, Switzerland and Norway have extremely
mountainous terrain (and their per-capita income was not very high
in the nineteenth century, at least by post-World War II standards),
but they have not undergone any civil war in the past 150 years –
Switzerland’s civil war of 1848 resulted in a handful of deaths and would
clearly not qualify as such in any of the current datasets we have. Many
nineteenth-century and twentieth-century nations have sustained long
spells of peace without particularly well-developed bureaucracies and
road systems.
A more sensible theoretical approach to explain systematic political
violence is to acknowledge that different opportunity structures con-
strain or facilitate the eruption of violence, in the same way they prevent
or ease the commission of a crime. But, to paraphrase Collier and
Hoeffler (2001), the commission of the crime itself requires some
motives, which we still need to identify if we wish to make serious
198 Carles Boix
MASOUD: 9780521897686c08 4/14/08 12:44:34pm page 198
progress in the determination of the causes of political violence. In other
words, a convincing model of civil war and guerrilla warfare requires, as
with almost all crimes, both motivation and opportunity.
Accordingly, this chapter departs from the assumption that civil wars
and guerrilla warfare occur whenever the expected net gains from
employing it exceed the net gains derived from accepting the status quo
among some political actors (such as unions, peasant organizations, a
clique of army officers and so on). The status quo is here defined as a
situation in which either a section of society holds the (public) monopoly
of violence and policymaking uncontested by those that are excluded
from the decision-making process or political differences are settled
peacefully (through either voting procedures or bargaining) among all
parties in contention.
More precisely, the decision to engage in violent activities is a function
of two factors. On the one hand, violence becomes more likely as the
difference between the benefits accrued under a new regime obtained
through the use of violence and the gains obtained under the status quo
increases. The use of violence to alter the political and economic status
quo increases as the distribution of relatively immobile assets becomes
more unequal in any given economy. As income inequality rises, the
resistance of the well-off to the introduction of democratic, peaceful
means to set government policy simply hardens – the losses they would
incur from majority rule would be simply too substantial. Correspond-
ingly, resorting to violence becomes more attractive to those that are
excluded from the state apparatus – the prize of victory raises with
inequality. Political violence becomes particularly acute in unequal
economies in which assets are fixed and are not complementary to the
skills of their current owners. In those cases the potential rebels can
apply violence to overturn the existing regime with the relative certainty
that assets will not be moved out of the country and that the elimination
of their owners will not reduce their economic value.1
On the other hand, the occurrence of political violence declines as its
costs go up, thus accommodating the current literature on civil wars that
insists on the key role played by the structure of “political opportunities”
within which rebels launch violent actions against the state. As detailed
1 The literature on greed and civil wars becomes easily embedded in the theory of thischapter as follows. The presence of abundant natural resources (rather than all sorts ofresources, which, prima facie, could also finance any type of illegal activity) fits squarelywith the idea that only fixed assets can be easily expropriated and controlled by therebels. Educational attainment similarly points to the type of assets in society and, in away to be discussed later, to the underlying pattern of income distribution in society.
Civil wars and guerrilla warfare 199
MASOUD: 9780521897686c08 4/14/08 12:44:34pm page 199

later, the costs of violence to the parties in contention vary with their
organizational and mobilizational capabilities, the military technology
they employ, and other factors such as the type of terrain, the distri-
bution of the population, and the infrastructures of the state.
After developing the theory in the first section, this chapter turns to
examine its empirical validity. The second section describes the distri-
bution of violence over time and provides a first cut into the underlying
causes of violence. The third section tests in a systematic way the theory
presented in the first section. The empirical analysis is original in two
directions. First, I move beyond current studies of civil wars, which have
focused on post-1945 data, by looking at civil wars since the middle of
the nineteenth century and guerrilla and revolutionary outbreaks since
World War I. Second, I consider more fine-grained measures of the
nature and distribution of wealth and I show that several factors, such as
per-capita income and ethnic composition, which have been claimed to
be strongly correlated to violence, are of little or no interest in more
broadly specified models.
Theory
To explore the circumstances that may lead to civil wars and guerrillas,
let me proceed in the following manner. I will first characterize the
structure of any economy along two dimensions – the level of capital
endowment of each individual, and the extent to which capital is mobile
and can be actually taxed. I will then consider and discuss the distri-
butional consequences that different political regimes have on different
types of individuals (given their position in the economy) and the pol-
itical strategies they will be likely to adopt. This will allow me to describe
the conditions under which they may choose to engage in violent
strategies and civil confrontation.2
Economic structure
To approximate the economic structure of any country, assume in the
first place that assets are distributed unequally. That is, there are dif-
ferent individuals with different skills and assets, and thus income, who
choose to work variably. By assumption, in that economy the distribu-
tion of skills and incomes is skewed so that the median individual, who is
the individual with 50 percent of the others above and below her on the
2 This discussion follows, in an abbreviated manner, the model developed in Boix (2003).
200 Carles Boix
MASOUD: 9780521897686c08 4/14/08 12:44:34pm page 200
income ladder, is poorer than the average income individual, that is, the
person with the mean income.3
In addition to having a particular distribution of assets and income,
economies are also defined by their types of assets. Assets vary in
an economy according to the extent to which they can be more or
less easy to tax. The extent to which assets may be “taxable” will be
determined by two factors. In the first place, their specificity, which
grows when the difference of the income or returns it generates at
home and abroad increase. For example, some assets, such as land or
oil wells, are completely specific to the country they are located: they
cannot be moved anywhere else. Other assets, such as high skills or
money, can be moved abroad to generate rents very similar to the
returns they yield at their country of origin. The more specific assets
are to the country in which they are being used, the more taxable they
are since the cost of moving them abroad (in response to higher taxes)
is higher. In the second place, the “taxability” of assets varies with the
degree to which the tax authority can monitor any given asset and its
return. A fully “taxable” asset is one that cannot be hidden for tax pur-
poses and therefore yields the expected tax return. A nontaxable asset is
one whose income flow is hard to monitor and whose owner can easily
escape from the tax enforcement authority – this is the case, for example,
of certain professional skills, the provision of consulting services, or the
transactions of small shopkeepers.
Taxation
Assume further that in this economy the state sets a linear tax income.4
All tax revenues are redistributed lump sum (i.e. an equal amount) to
everyone. That transfer, which is the total tax revenue divided by the
number of individuals in the economy, equals the taxes paid by the voter
with average income. As a result, all the individuals poorer than the
average income will favor a positive tax since the transfer they will
receive will be larger than the amount they pay. Conversely, all the
individuals richer than the average income voter will oppose a tax.
In a democratic setting, with a one-person one-vote rule, and fol-
lowing the median voter theorem, the policy that is adopted is the one
most preferred by the median voter. Since the income of the median
individual is lower than the average income, the result will be a positive
3 As a matter of fact, all real world income distributions match this assumption.4 The description of the taxation model departs from (and then extends) the optimaltaxation mechanism introduced by Meltzer and Richards (1981).
Civil wars and guerrilla warfare 201
MASOUD: 9780521897686c08 4/14/08 12:44:34pm page 201

tax and positive transfers. Moreover, the poorer the median voter is
relative to the average income individual, the larger the tax rate he will
favor, because the difference between the tax he pays and the transfer
received becomes larger. In other words, as the income distribution
becomes more skewed and unequal, the tax pressure should increase.
The level of taxation will only be constrained by two parameters. First,
the median voter is bound by the distortions that come from tax rates:
the median voter will never impose taxes that lead to an overall decline
in total revenue.5 Second, he will be constrained by the mobility and
taxability of assets. As capital becomes more mobile, that is, as it can
be moved abroad to obtain a return equal to the domestic return, the
tax rate will decline since otherwise the capital holder would have an
incentive to transfer his assets abroad. Similarly, whenever capital can be
easily hidden from the state or it becomes of a kind that can only be used
by its owner, the temptation to confiscate it also declines.
Political institutions
Economists have always treated the voting rule of this taxation model
(where all individuals vote and the median voter determines the tax
policy) as a fixed or exogenous parameter. Yet this theoretical decision
is wrong.6 The choice of the voting rule precedes the actual process of
voting about the tax rate and the distribution of assets. As a matter of
fact, all political actors determine who will vote (and how will the vote
take place) informed by the tax outcomes they anticipate will take place
under each alternative voting rule. Rich voters will be interested in
excluding the poorest voters (and thus moving the median voter toward
them) to minimize the tax to be paid. Conversely, the voters with the low
incomes will press for their full political participation.
More precisely, as inequality in a given country goes up, the demand
and political pressure for redistribution will intensify. As a result, to
avoid paying high, quasi-confiscatory taxes, the wealthy will be even
more inclined to establish an authoritarian regime that excludes the
majority of the population. Naturally, since the introduction of an auth-
oritarian regime requires bearing some costs of repression, the well-off
will only act to exclude the poorest if those repression costs are larger
than the taxes they would have paid under a democratic regime. Similarly,
5 Without this restriction, the median voter would always set the tax rate equal to 1 andhence expropriate from individuals with an income equal to or larger than the averageincome.
6 In fact, this mistake explains why the Meltzer-Richards model performs very weakly toexplain the level of taxes in the empirical arena.
202 Carles Boix
MASOUD: 9780521897686c08 4/14/08 12:44:35pm page 202
as the distribution of income becomes more equal among individuals,
redistributive pressures from the poorest social sectors on the well-off
voters diminish. The relative costs of tolerating a mass democracy, that is,
the taxes they would pay, decline for the holders of the most productive
assets to the point that they become smaller than the costs of repression
they would have to bear to exclude the majority of citizens. And dem-
ocracy becomes acceptable to all parties.
The type of political solution that will prevail will also depend on the
types of assets in the economy. As assets become less specific (more
mobile), the redistributive pressures from noncapital holders on capit-
alists diminish and, as a result, the likelihood of democracy rises. By
contrast, economies with a large proportion of fixed assets, such as the
oil countries, will generally remain authoritarian (conditional on having
a skewed distribution of income).
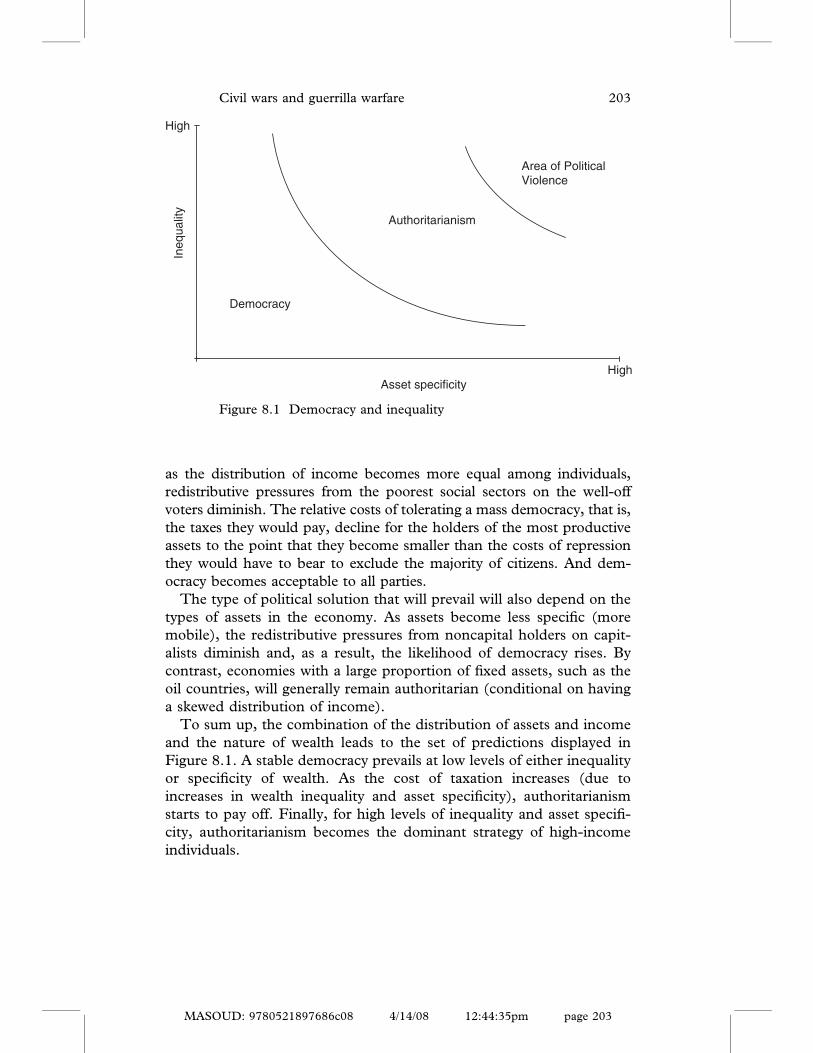
To sum up, the combination of the distribution of assets and income
and the nature of wealth leads to the set of predictions displayed in
Figure 8.1. A stable democracy prevails at low levels of either inequality
or specificity of wealth. As the cost of taxation increases (due to
increases in wealth inequality and asset specificity), authoritarianism
starts to pay off. Finally, for high levels of inequality and asset specifi-
city, authoritarianism becomes the dominant strategy of high-income
individuals.
Asset specificity
Ineq
ualit
y
Democracy
Authoritarianism
Area of Political Violence
High
High
Figure 8.1 Democracy and inequality
Civil wars and guerrilla warfare 203
MASOUD: 9780521897686c08 4/14/08 12:44:35pm page 203

Political violence
For sufficiently high levels of inequality and asset specificity or immo-
bility, political violence will erupt as a systematic means to effect polit-
ical change. As already pointed above, with growing income inequality
and asset specificity, the resistance of the well-off (such as landowners
or government officials in control of mining resources in rentier states)
to democracy grows – the losses they would incur from majority rule
become too large. In turn, those that are excluded from governing
and setting taxes have a strong incentive to revolt. At high levels of
inequality, the prize of victory is substantial. Political violence will
become particularly acute in unequal economies in which assets are
fixed and not complementary to the skills of their current owners. In
those cases the potential rebels can apply violence to overturn the
existing regime with the relative certainty that assets will not be moved
out of the country and that the elimination of their owners will not
reduce their economic value. In short, political violence will tend to
appear in countries located in the upper right-hand corner of Figure 8.1.
Still, the prediction that violence will happen in that region should be
simply taken as a probabilistic statement. The potential rebels of highly
unequal highly asset-specific economies will only resort to armed action
if they believe they have a reasonable chance of winning. Those beliefs
are generally formed under conditions of incomplete information.
Hence, their guesses or estimations about their probability of success
will be shaped by their assessment of the strength of their own organ-
izational capacities and the perceived military capabilities of the state.
It is in this context that the “political opportunities” literature can be
fully integrated with a theory of political motivations to pursue a strategy
of violent engagement. Certain objective or structural traits, such as the
existence of mountainous terrain, inaccessible forests, poor roads, geo-
graphically fragmented states (e.g. archipelagos), and so on, will likely
play an important role in bolstering the decision to engage in violent
activities. Likewise, the availability of finance (in the form of natural
resources such as oil wells, diamond mines, or coca plantations) should
encourage rebellious activities as well.
Finally, the organizational and mobilizational capacity of insurgents is
central in explaining when violent rebellions will flare up and progres-
sively transform into guerrilla warfare or even civil wars. We can put this
point in a slightly broader historical context. It is reasonable to assume
that in many countries their underlying conditions of high inequality and
wealth specificity did not change substantially from the eighteenth to the
twentieth century or that, at least, they did not worsen dramatically. Yet
204 Carles Boix
MASOUD: 9780521897686c08 4/14/08 12:44:35pm page 204
the number, length, and harshness of civil wars, guerrillas, and rebellious
outbreaks increased over time – eventually culminating in all the large
civil wars of the mid-twentieth century such as those fought in Russia,
China, or Vietnam. Such a secular, long-dur�ee trend toward more vio-
lence was triggered by the growing agitation and organization of certain
social sectors such as the peasantry, which had remained isolated and
poorly communicated until that time. With the advent of “political
modernization” (functional states, city networks, and literate minor-
ities), a set of “enlightened” elites provided those that were discontent
with the means to challenge the status quo (or, in a different inter-
pretation, pushed them to engage in violence). Still, those “revolutionary
vanguards” were only successful when certain conditions obtained on
the ground. In the absence of broad inequalities, violence hardly evolved
into civil war. To put it in other words, a theory that dismisses motiv-
ation and that only emphasizes the supply of the means to be violent
(either because the state has imploded or because some Polpotian char-
acters have appeared to force, by pure intimidation, a segment of the
population) would be unconvincing. It could not explain the empirical
patterns I unveil in the third section.
The distribution of political violence
To explore the validity of the explanatory model, I examine data on the
occurrence of civil wars and guerrilla warfare. The data for civil wars
come from two datasets: the dataset of the “Correlates of War” (COW)
project developed by Singer and Small (1994), which includes data from
1816 through 1992, and the dataset built by Fearon and Laitin (2003),
spanning from 1945 to 1999. Generally speaking, a civil war is defined
as a conflict in which military action took place between agents of (or
claimants to) a state and organized, nonstate groups who sought to take
control of the state (in the entire country or in part of the country) or to
change governmental policies, and where at least 1,000 battle deaths
resulted from the war.7 The Fearon-Laitin dataset is more expansive
than the COW: for the period 1945 to 1990, whereas the former reports
80 war onsets and over 600 years of civil war, the latter includes 60 war
onsets and roughly 400 years of war. The data on guerrillas are taken
7 Fearon and Laitin (2003) further qualify a civil war as a conflict where at least 100 werekilled on both sides. For a full specification of conditions see Fearon and Laitin (2003,76, footnote 4).
Civil wars and guerrilla warfare 205
MASOUD: 9780521897686c08 4/14/08 12:44:35pm page 205

from Banks (1997) and cover the period from 1919 to 1997. Episodes of
guerrilla warfare are any armed activity, sabotage, or bombings carried
on by independent bands of citizens or irregular forces and aimed at the
overthrow of the present regime.
Figure 8.2 shows the number and proportion of sovereign countries
with an ongoing civil war (as defined in COW) from 1820 to 1994. The
proportion of countries under civil war has been relatively stable –
around 2 to 4% for the whole universe of sovereign countries. Within
a pattern of general stability, two periods stand out as more conflict-
ridden: the middle decades of the nineteenth century and the last
quarter of the twentieth century. Spurred by considerable political tur-
moil over the introduction of liberal institutions in Europe and the con-
struction of new states in America, the proportion of countries at war
rose to 5% between 1848 and 1871, with two peaks in 1848 and 1861.
Except for a spike around World War I, civil wars became very infre-
quent from 1880 to 1945. In the postwar period, the COW dataset
shows an upward trend, particularly after 1975. The last three decades
have been the most turbulent with about 10% of all sovereign countries
at war (or an average of 15% in the Fearon-Laitin database).
Figure 8.3 depicts the number and proportion of countries experi-
encing guerrilla warfare every year. About 10% of all countries suffered a
guerrilla movement in the interwar period. The proportion increased to
about 15% after 1945, peaked in the late 1960s, and then gradually
0
0.02
0.04
0.06
0.08
0.1
0.12
0.14
0.16
0.18
0.2 20.00
18.00
16.00
14.00
12.00
10.00
8.00
6.00
4.00
2.00
0.00
182018
2518
3018
3518
4018
4518
5018
5518
6018
6518
7018
7518
8018
8518
9018
9519
0019
0519
1019
1519
2019
2519
3019
3519
4019
4519
5019
5519
6019
6519
7019
7519
8019
8519
9019
95
Year
Per
cent
age
of c
ount
ries
with
civ
il w
ar
Num
ber
of c
ount
ries
with
civ
il w
ar
Percent of countries with civil war (left axis)
Number of countries with civil war (right axis)
Figure 8.2 Civil wars, 1820–1994
206 Carles Boix
MASOUD: 9780521897686c08 4/14/08 12:44:35pm page 206

declined. By 1997 there were guerrillas in thirteen countries or 7% of
all sovereign states.
Empirical analysis
The central hypothesis of this essay is that political violence should erupt
as income inequality and asset-specificity increase. Additionally, the
model also predicts that the costs of choosing violence will shape the
level and type of violence. More expensive forms of violence should be
rarer. This is indeed true observing the empirical evidence presented in
Figures 8.2 and 8.3. Civil wars are less frequent than guerrilla move-
ments. Similarly, better organized states with easy access to all their
territory and population should have less violence.
Inequality and asset specificity
Figures 8.4 and 8.5 show the distribution of civil war onsets and guerrilla
warfare onsets across the world by the average level of industrialization
and urbanization (on the x axis) and the percentage of family farms (on
the y axis). The percentage of family farms captures the degree of
concentration and therefore inequality in the ownership of land. That
measure, gathered and reported by Vanhanen (1997, 48), is based on
defining as family farms those “farms that provide employment for
not more than four people, including family members, . . . that are
0
0.05
0.1
0.15
0.2
0.25
0.3
0.35
0.4 50
45
40
35
30
25
20
15
10
5
01919 1924 1929 1934 1939 1944 1949 1954 1959 1964 1969 1974 1979 1984 1989 1994 1999
Year
Per
cent
age
of c
ount
ries
with
gue
rrill
as
Num
ber
of c
ount
ries
with
gue
rrila
s
Percent of countries with guerrillas (left axis)
Number of countries with guerrillas (right axis)
Figure 8.3 Guerrillas, 1919–1997
Civil wars and guerrilla warfare 207
MASOUD: 9780521897686c08 4/14/08 12:44:36pm page 207

cultivated by the holder family itself and . . . that are owned by the
cultivator family or held in ownerlike possession.” The definition, which
aims at distinguishing “family farms” from large farms cultivated mainly
by hired workers, is not dependent on the actual size of the farm – the
size of the farm varies with the type of product and the agricultural
020
4060
8010
0
020406080100Average of industrialization and urbanization
Per
cen
tag
e o
f fa
mily
farm
s
War Onset
Figure 8.4 Economic structure and civil wars, 1850–1994
020
4060
8010
0
020406080100Average of industrialization and urbanization
Per
cen
tag
e o
f fa
mily
farm
s
Guerrilla Onset
Figure 8.5 Economic structure and guerrillas, 1919–1997
208 Carles Boix
MASOUD: 9780521897686c08 4/14/08 12:44:36pm page 208
technology being used.8 The dataset, reported in averages for each
decade, ranges from 1850 to 1999.9 The average of industrialization
(measured as the average of the percentage of nonagricultural popula-
tion) and the percentage of urban population (defined as population
living in cities of 20,000 or more inhabitants) are also taken from
Vanhanen and are used to approximate the extent to which assets may
be mobile.10 Both axes have been drawn in the reverse order (decreasing
in value as one moves away from the origin) so that the high inequality/
high specificity area is in the upper-right corner.
Figure 8.4 plots all the country-year observations from 1850 to 1994
(the black dots) and the cases in which a civil war (as defined by COW)
started (marked with the abbreviated name of the country in which it took
place). The graph shows considerable dispersion in the combination of
how industrialized countries are and how unequal their agrarian sectors
are.11 Most civil wars occur in countries where the agrarian sector is still
dominant and land is distributed unequally (basically within the triangle
to the right of a diagonal going from no industrialization and less than 50
percent of the land to middle levels of industrialization with no family
farms at all). Several cases that are closer to the middle (that is, farther
away from the upper-right corner) have considerable oil resources and
so conflict there may be related to asset immobility. All in all, the dis-
tribution of observed civil war onsets matches quite well the predictions
of Figure 8.1.
Figure 8.5 depicts the distribution of guerrilla warfare from 1919 to
1997. The occurrence of guerrillas is more widespread than systematic
civil wars but the pattern is still similar: violence is heavily concentrated
in unequal agrarian economies.
Civil wars
Although the graphical evidence presented thus far strongly supports the
model of the essay, I have not controlled for the impact of important
8 It varies from countries with 0% of family farms to nations where 94% of theagricultural land is owned through family farms: the mean of the sample is 30% with astandard deviation of 23%. A detailed discussion and description of the data can befound in Vanhanen (1997, 49–51) and the sources quoted therein.
9 An extensive literature has related the unequal distribution of land to an unbalanceddistribution of income. For the period after 1950, and excluding the cases of socialisteconomies, the correlation coefficient among the Gini index and the percentage offamily farms is �0.50.
10 This average has a mean of 35% and varies from 3 to 99%.11 For our purposes (to investigate the origins of violence) the measure is adequate since it
is only inequality in the agrarian sector that matters: as assets become less fixed orspecific, the incentives to engage decline, even in relatively unequal societies.
Civil wars and guerrilla warfare 209
MASOUD: 9780521897686c08 4/14/08 12:44:36pm page 209

Table
8.1.Civilwarsan
dguerrilla
movem
ents
Civilwar
Guerrillawarfare
Model
1M
odel
2M
odel
3M
odel
4M
odel
5M
odel
6
1850–1994
1950–97
1950–97
1919–97
1950–97
1950–97
Constant
�1.985***
(0.687)
�3.557***
(0.747)
�3.952***
(1.001)
�2.793***
(0.369)
�3.049***
(0.435)
�2.757***
(0.544)
Lagged
dep
enden
t
variable
2.961***
(0.084)
3.530***
(0.102)
3.487***
(0.106)
1.362***
(0.050)
1.368***
(0.059)
1.213**
(0.062)
Percentoffamily
farm
st-1
0.004(0.004)
0.014***
(0.016)
0.020***
(0.006)
0.003(0.002)
0.002(0.003)
0.008**
(0.003)
Index
ofoccupational
diversificationt-1
0.005(0.005)
0.003(0.006)
0.013*(0.007)
0.005**(0.003)
0.003(0.003)
0.009***
(0.004)
Familyfarm
st-1*
occup.diversif.t-1
�0.025**
(0.011)
�0.033***
(0.011)
�0.041***
(0.013)
�0.022***
(0.005)
�0.022***
(0.006)
�0.027***
(0.007)
Log(population)t-1
0.096***
(0.025)
0.160***
(0.034)
0.123***
(0.045)
0.170***
(0.016)
0.155***
(0.019)
0.110***
(0.023)
Log(per
cap.
inco
me)
t-1
�0.162*(0.092)
�0.059(0.105)
�0.123(0.119)
�0.026(0.047)
0.043(0.060)
�0.072
(0.068)
Dem
ocracy
t-1
0.148(0.100)
0.290**(0.114)
0.243**(0.128)
0.173***
(0.056)
0.244***
(0.066)
0.136*
(0.072)
Log(percentage
mountainous)
0.053(0.044)
0.073***
(0.025)
Nonco
ntiguousstate
0.263**(0.139)
0.431***
(0.076)
Oilexporter
�0.058(0.175)
�0.073
(0.097)
Ethnic
fractionalization
0.643(0.926)
1.781***
(0.498)
MASOUD: 9780521897686c08 4/14/08 12:44:37pm page 210
(Ethnic
fractionalization)2
�0.292(0.973)
�1.651***
(0.549)
Religious
fractionalization
0.879(0.997)
0.187
(0.558)
(Religious
fractionalization)2
�0.577(1.200)
�0.066
(0.664)
PercentageofM
uslim
s0.004*(0.002)
�0.000
(0.001)
Percentageof
Catholics
0.003(0.002)
0.002**
(0.001)
Percentageof
Protestants
�0.003(0.005)
�0.008**
(0.003)
Growth
rate
t-2
tot-1
�0.299(0.744)
�0.068
(0.438)
Number
of
observations
8453
4435
4240
6242
4066
3937
Loglikelihood
�651.24
�390.23
�365.11
�2006.45
868.80
�1328.40
Prob>ch
i20.0000
0.0000
0.0000
0.0000
0.0000
0.0000
PseudoR2
0.5832
0.7789
0.7883
0.2344
0.2377
0.2610
Estim
ation:probitmodel.Standard
errors
inparenthesis.***p<0.01;**p<0.05;*p<0.10.
MASOUD: 9780521897686c08 4/14/08 12:44:38pm page 211

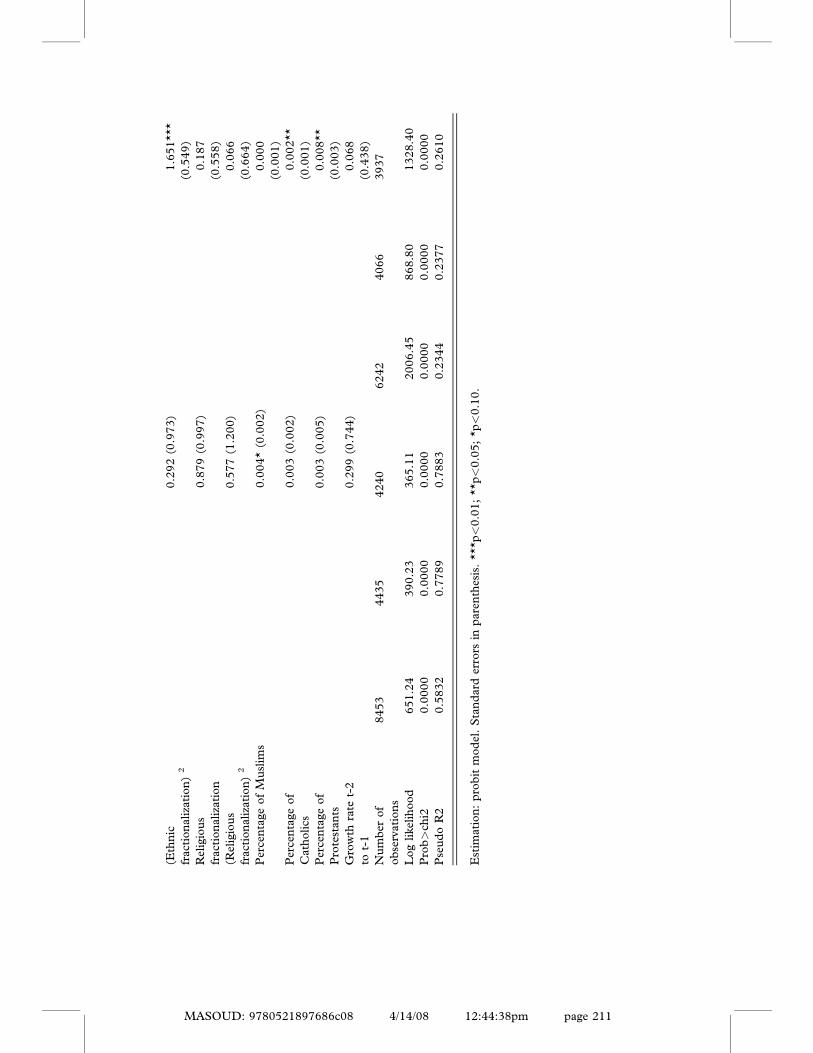
variables in the literature such as per-capita income, population, political
regime, geography, and ethnic and religious composition. In Table 8.1
I present results on a multivariate analysis of the factors that may
influence the eruption of civil war and guerrilla warfare.
For each type of violence I run three models. The first one includes
data prior to 1950 (since 1850 for civil wars and since 1919 for the rest
of violent events) – this dataset maximizes the number of observations,
which range from 8,300 to 6,200 country-years, but cannot include
variables such as religious composition or geographical structure for
which we only have data after World War II. The second model includes
data only for the second half of the twentieth century yet employs the
same specification used in the first model. The last model adds a whole
battery of controls to the second model. Notice that the coefficients
remain very stable across the first two models. In the third model, the
interactive coefficient and population go up in size – but that change
does not affect the thrust of the essay’s argument.
For model 1 (employing pre-1950 data) and model 2 (postwar data),
the following independent variables are included:
(1) The lagged value of the dependent variable.
(2) The percentage of family farms.
(3) The index of occupational diversification, that is, the average of
industrialization and urbanization.
(4) The interaction of the two previous variables, which should capture
the theoretical expectations of the model.
(5) The log value of per-capita income. This variable is built with data
reported in the Penn Wold Tables 6.1 (Heston et al. 2002), coveringthe period from 1950 to 1999, plus data from Maddison (1995),
which provides observations for the period previous to 1950
(essentially for developed countries and some large Asian and Latin
American cases), adjusted to make it comparable with the Heston
dataset, and some interpolated data from Bourguignon and
Morrission (2002).12
(6) The log value of population, taken from Banks (1997).
(7) Democracy. This variable is taken from Boix and Rosato (2001),
where all sovereign countries from 1800 to 1999 are coded as either
democratic or authoritarian. Countries are coded as democracies
if they meet three conditions: elections are free and competitive;
the executive is accountable to citizens (either through elections in
12 For the post-1950 period I use Fearon and Laitin (2003) definition of per-capitaincome.
MASOUD: 9780521897686c08 4/14/08 12:44:38pm page 212
212 Carles Boix

presidential systems or to the legislative power in parliamentary
regimes); and at least 50 percent of the male electorate is enfranchised.
In the third model (of postwar data), the following variables have been
added:
(8) Ethnic fractionalization. This measure is computed as one minus
the Herfindhal index of ethnolinguistic group shares, with new data
gathered and calculated in Alesina et al. (2003).(9) Religious fractionalization, also computed as one minus the
Herfindhal index of religious groups, also taken from Alesina
et al. (2003).(10) Percentage of Muslims, Catholics, and Protestants, taken from
LaPorta et al. (1999).(11) Economic growth rate (in the year before the observed event).
(12) The log of the percentage of the territory that is mountainous.
(13) A dummy variable coded as 1 if oil represents more than one-third
of the country’s exports.
(14) A dummy variable coded 1 if the state is composed of non-
contiguous territories. The last three variables are taken from
Fearon and Laitin (2003).
In Table 8.1 civil war and guerrilla warfare are coded as 1 if there was
one of these events in place, 0 otherwise. The estimation is done through
probit analysis.13 For the period from 1850 to 1994 (Table 8.1, column
1) I employ data from COW. For the period after 1950 (columns 2 and
3), I employ the dataset from Fearon and Laitin (2003).
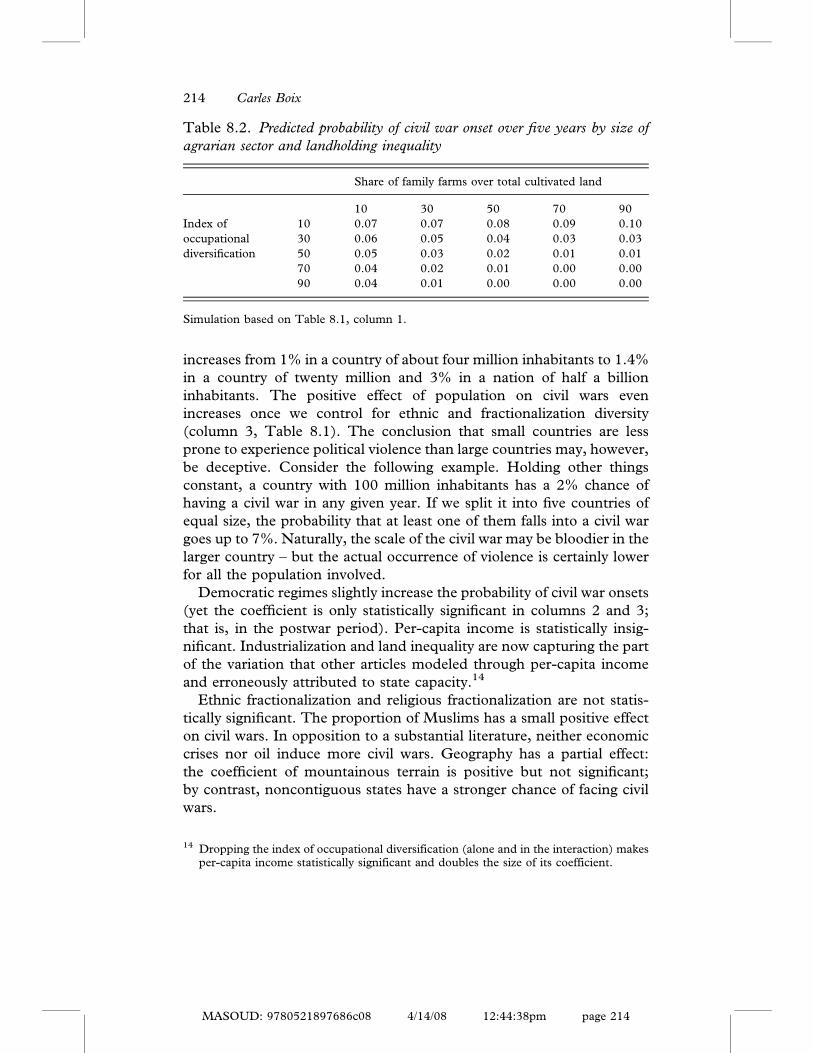
As expected from the model, the interactive term of family farms and
nonagrarian assets is statistically significant and has a substantial
depressing impact on the occurrence of civil wars. A simulation of the
results (in column 1, Table 8.1) is shown in Table 8.2. In countries with
either less than 20% of the land held by family farms or with an average
urbanization and industrialization below 25%, the probability of a civil
war onset is more than 5% over the course of a five-year period. As both
land equality and industrialization increase, the probability of a civil war
declines quickly. In countries where family farms control more than 50%
of the cultivated land and average industrialization and urbanization are
also over 50%, the probability of a civil war occurring over a period of
five years drops below 1%.
Population increases the probability of a civil war onset. For all other
variables at their median values, the probability of a civil war erupting
13 Logit analysis does not change any of the results.
Civil wars and guerrilla warfare 213
MASOUD: 9780521897686c08 4/14/08 12:44:38pm page 213
increases from 1% in a country of about four million inhabitants to 1.4%
in a country of twenty million and 3% in a nation of half a billion
inhabitants. The positive effect of population on civil wars even
increases once we control for ethnic and fractionalization diversity
(column 3, Table 8.1). The conclusion that small countries are less
prone to experience political violence than large countries may, however,
be deceptive. Consider the following example. Holding other things
constant, a country with 100 million inhabitants has a 2% chance of
having a civil war in any given year. If we split it into five countries of
equal size, the probability that at least one of them falls into a civil war
goes up to 7%. Naturally, the scale of the civil war may be bloodier in the
larger country – but the actual occurrence of violence is certainly lower
for all the population involved.
Democratic regimes slightly increase the probability of civil war onsets
(yet the coefficient is only statistically significant in columns 2 and 3;
that is, in the postwar period). Per-capita income is statistically insig-
nificant. Industrialization and land inequality are now capturing the part
of the variation that other articles modeled through per-capita income
and erroneously attributed to state capacity.14
Ethnic fractionalization and religious fractionalization are not statis-
tically significant. The proportion of Muslims has a small positive effect
on civil wars. In opposition to a substantial literature, neither economic
crises nor oil induce more civil wars. Geography has a partial effect:
the coefficient of mountainous terrain is positive but not significant;
by contrast, noncontiguous states have a stronger chance of facing civil
wars.
Table 8.2. Predicted probability of civil war onset over five years by size ofagrarian sector and landholding inequality
Share of family farms over total cultivated land
10 30 50 70 90
Index of 10 0.07 0.07 0.08 0.09 0.10
occupational 30 0.06 0.05 0.04 0.03 0.03
diversification 50 0.05 0.03 0.02 0.01 0.01
70 0.04 0.02 0.01 0.00 0.00
90 0.04 0.01 0.00 0.00 0.00
Simulation based on Table 8.1, column 1.
14 Dropping the index of occupational diversification (alone and in the interaction) makesper-capita income statistically significant and doubles the size of its coefficient.
214 Carles Boix
MASOUD: 9780521897686c08 4/14/08 12:44:38pm page 214

Guerrilla warfare
Columns 4 through 6 in Table 8.1 examine the covariates of guerrilla
warfare. Their results parallel those for civil wars. The effect of inequ-
ality and asset specificity is very similar in statistical significance and
substantial size for both guerrilla and civil war. Table 8.3 simulates the
probability of a guerrilla movement over a five-year period (employing
the results in column 4, Table 8.1). For low levels of family farms and
industrialization, the probability fluctuates around 20%. In fact, it
increases with each value separately – this may be capturing the fact that
societies with family farms may organize more easily. Nonetheless, as
both variables increase, the probability drops: it falls below 10% at the
median values of both variables and below 5% for values common in
developed countries.
Since guerrilla warfare is a far more widespread phenomenon than
civil wars, factors other than land inequality and asset mobility must
account for the former’s higher probability. Per-capita income is again
not significant. Although population and democracy raise the eruption
of guerrilla movements, their impact is not that different from the effect
they had over the likelihood of having civil wars.
Ethnic fractionalization now becomes statistically significant. Its
impact is substantial and follows a quadratic form. With all other values
at their median, a highly fragmented country (with an index of 0.08,
which corresponds to the tenth percentile of the universe of observa-
tions) has an annual probability of having a guerrilla movement of about
4.8%. This probability peaks at 8.8% among countries with an ethnic
fractionalization of 0.5 (about the sixtieth percentile) and then declines
to 5.6% for the most homogeneous country in the sample (with an
Table 8.3. Predicted probability of guerrilla warfare onset over five years bysize of agrarian sector and landholding inequality
Share of family farms over total cultivated land
(percentiles)
10 30 50 70 90
Index of 10 0.20 0.22 0.24 0.25 0.27
occupational 30 0.22 0.20 0.18 0.16 0.15
diversification 50 0.24 0.18 0.14 0.10 0.07
70 0.26 0.17 0.10 0.06 0.03
90 0.28 0.15 0.08 0.03 0.01
Simulation based on Table 8.1, column 4.
Civil wars and guerrilla warfare 215
MASOUD: 9780521897686c08 4/14/08 12:44:39pm page 215
ethnic fractionalization index of 0.93). However, as countries become
more industrialized and less unequal, the effect of ethnic fractionaliza-
tion declines and the difference in violence between balanced countries
and either homogeneous or very heterogeneous countries narrows sig-
nificantly. For example, for high levels of equality and development, the
probability of a guerrilla starting is 1% for homogeneous countries and
only 3% for countries with an ethnic fractionalization of 0.5. Given that
the impact of ethnic and religious fractionalization on violence vanishes
in more equal and developed countries, it is difficult to sustain the
hypothesis that ethnic diversity translates automatically into political
grievances (and then violence). Although the following point should rem-
ain purely speculative, one possibility is that ethnic groups are excellent
conveyors of patron–client networks in underdeveloped countries. But
that once unequal economic relations and poverty decline, those net-
works fall in significance and violent conflict lessens as well. Besides
ethnic fractionalization, the proportion of Catholics slightly increases
and the percentage of Protestants depresses the presence of guerrilla
movements.
Not unexpectedly geography plays also a stronger role than for civil
wars. Mountainous terrain leads to more guerrilla – with all other par-
ameters at their medians, the probability changes from 6.2% for the
minimum value to 8.6% for the fiftieth percentile and to 11.3% for the
maximum value. Noncontiguous states are also much more prone to
violence: the probability of a guerrilla increases by 8%.
Conclusions
Combining two central strands of the literature on political violence, the
literature on material grievances and motivations and recent research on
the geographical and organizational opportunities that foster conflict,
this chapter offers a model to account for the distribution of civil wars,
guerrillas, and rebellious actions across the world. The model is suc-
cessfully tested with a comprehensive dataset that covers the period after
World War II.
Political violence occurs in states in which assets are immobile and
unequally distributed. In relatively equal societies, peaceful, democratic
means of solving conflict are advantageous to all parties and violence
happens with little probability. In economies where wealth is either
mobile or hard to “tax” or confiscate, sustained political violence to grab
those assets does not pay off since their owners either can leave in res-
ponse to the threat of confiscation or are indispensable to the optimal
216 Carles Boix
MASOUD: 9780521897686c08 4/14/08 12:44:39pm page 216
exploitation of assets. These two simple parameters (inequality and spe-
cificity of assets) capture in a stylized yet robust way the set of intuitions
previous scholars have employed to examine the underlying motivations
that generate violence, such as the role of inequality or the idea that
“lootable assets” correlate with the presence of civil wars. The examin-
ation of the existing data on civil wars and guerrilla warfare validates the
model of the essay. Spells of organized or systematic political violence in
the world tend to cluster in a relatively tight manner in states where both
inequality is high and the economy is mainly agrarian.
Besides depicting the motives of political violence, the model incor-
porates the notion that “opportunities” of an organizational or geo-
graphical nature drive the costs of engaging in violence and therefore
determine the likelihood with which it will occur (as well as the likeli-
hood with which different types of violence will be employed). Again,
this component emerges in the empirics of the essay. Geography mat-
ters, although in a less than systematic way. Mountainous terrain enters
strongly for guerrilla movements but not for civil wars. Noncontiguous
states are in turn more prone to civil wars.
The theoretical and empirical strength of the model, which naturally
has to be read in probabilistic terms, has a key advantage. It allows us to
think about all the variance that is left unexplained in a fruitful way. This
is clear in at least two ways. First, a second look at the visual informat-
ion conveyed in Figures 8.4 and 8.5 shows that although most cases
of “organized” political violence occur within the upper-right corner of
inequality and asset specificity, there are a few cases that do not – most of
them seem to belong to the cases of “urban terrorism.” Second, ethnic
and religious traits still play a role, even though it is a diminished one:
the positive effect on violence of Catholics and Muslims is very small;
the balance of ethnic groups is only relevant for guerrilla warfare when the
societies are still agrarian or not very egalitarian. Our theories for those
cases are thus far wanting. Naturally, this calls for stepping up our efforts
in establishing their theoretical underpinnings.
references
Alesina, Alberto, Arnaud Devleeschauwer, William Easterly, Sergio Kurlat, andRomain Wacziarg. 2003. “Fractionalization.” Journal of Economic Growth8: 155–194.
Banks, Arthur S. 1997. “Cross National Time Series: A Database of Social,Economic, and Political Data.” www.databanks.sitehosting.net.
Boix, Carles. 2003. Democracy and Redistribution. Cambridge University Press.Boix, Carles, and Sebastian Rosato. 2001. “A Complete Data Set of Political
Regimes, 1800–1999.” University of Chicago.
Civil wars and guerrilla warfare 217
MASOUD: 9780521897686c08 4/14/08 12:44:39pm page 217

Bourguignon, Francois, and Christian Morrission. 2002. “Inequality AmongWorld Citizens: 1820–1992.” American Economic Review 92 (September):727–745.
Collier, Paul, and Anke Hoeffler. 1999. “Justice Seeking and Loot-seeking inCivil War.” World Bank. www.worldbank.org/research/conflict/papers/paulnew2.pdf.
2001. “Greed and Grievance in Civil War.” World Bank. www.worldbank.org/research/conflict/papers/greedgrievance_23oct.pdf.
Connor, Walker. 1994. Ethnonationalism: The Quest for Understanding. PrincetonUniversity Press.
Fearon, James D., and David Laitin. 2003. “Ethnicity, Insurgency, and CivilWar.” American Political Science Review 97 (February): 75–90.
Gurr, Ted. 1973. “The Revolution-Social Change Nexus.” Comparative Politics5 (April): 359–392.
Heston, Alan, Robert Summers, and Bettina Aten. 2002. Penn World TableVersion 6.1. Center for International Comparisons at the University ofPennsylvania (CICUP).
Horowitz, Donald L. 1985. Ethnic Groups in Conflict. Berkeley: University ofCalifornia Press.
Huntington, Samuel. 1968. Political Order in Changing Societies. New Haven:Yale University Press.
LaPorta, Rafael, Florencio Lopez de Silanes, Andrei Shleifer, and RobertVishny. 1999. “The Quality of Government.” Journal of Law, Economics andOrganization 15 (April): 222–279.
Maddison, Angus. 1995. Monitoring the World Economy, 1820–1992. Paris:Organisation for Economic Co-operation and Development.
Meltzer, A.H., and S. F. Richards. 1981. “A Rational Theory of the Size ofGovernment.” Journal of Political Economy 89: 914–927.
Muller, Edward N. 1985. “Income Inequality, Regime Repressiveness, andPolitical Violence.” American Sociological Review 50: 47–61.
Paige, Jeffery M. 1975. Agrarian Revolution. New York: Free Press.Russett, Bruce M. 1964. “Inequality and Instability.” World Politics 16: 442–
454.Singer, J. David, and Melvin Small. 1994. “The Correlates of War Project:
International and Civil War Data, 1816–1992.” Correlates of War Project,University of Michigan.
Vanhanen, Tatu. 1997. Prospects of Democracy: A Study of 172 Countries. London:Routledge.
Wolf Eric R. 1969. Peasant Wars in the Twentieth Century. New York: Harper &Row.
218 Carles Boix
MASOUD: 9780521897686c08 4/14/08 12:44:39pm page 218
Top Related