


Languages
Pages
Legal


CHAPTER - 5
TYRSEM - AN OVERVIEW OF PERFORMANCE
5.1 Objectives, Approach & Strategy . _ _ _ _ _ _ _ - - - - - - - - - _ d - - - - - - _ _ _ - - - _ _ . _ _ _ - _ ^ - - - _ - _ _ _
5.2 Components of the Programme
5.4 Supply of Free-tool kit to Trainees _ _ _ _ _ _ - - - - _ _ - - - _ _ _ - - - _ _ - - - - - - - - - - _ - - - - _ _ - - -
5.5 Financing project for S.E
5.6 Organisational Support - - - - - - - - - - _ - - _ - - - -
5.7 Progress of TRYSEM - India
5.8 Progress of TRYSEM - Andhra Pradesh -
5.9 Progress of TRYSEM - Nellore - - _ -
5.10 Conclusion - - _ _ _ _ _ _ _ _ _ _ _- _ _ _ _ _ _ _ _ ._ _ _ - _ _ _ - _ - - - _ - .- - -- - - -- - - - - - - -

CHAPTER-5
TRYSEM : AN OVERVIEW OF PERFORMANCE
5.0 INTRODUCTION:
Attempts have been made over the last five decades by different Governments
both at the centre and state levels, to take the economy of the country to new heights of
development and to promote social just~ce through a series of five year plans using
various strategies and policy programmes But all these efforts have failed to unfold
new opportunities for a richer and mc-e varied life to the poor in general and rural
masses in particular '
The provis~on of employment opportunities IS an intensively human and very
complex problem as it involves a large number of variables, whlch require to be
manipulated for the purpose The problems of creating self-employment opportunities
in the rural areas 1s that rural people are illiterates, lacks managerial and entrepreneurial
skills and lack asset base Nearly one fourth of India's rural population comprises of
youth in the age group of 15 to 25 years This vast human resource as at present is away
from direct involvement in the national development process
Both in terms of infrastructure and human development, the need to formulate
programmes for all-round development of the youth and their particlpat~on in the
national growth process has been taken up as the Central theme of natlonal plannlng
1 Meera Reddy, V. "TRYSEM - a source of non-farm employment", Kurukshetra, Vol. XXXVII, No.7, pp. 14-1 7
2 Hoshiar Singh (e.d), "Rural Development in India, Evaluative Studies in Policies and Programmes", Print Well Publishers, Jaipur 1985.

process particularly from the sixth plan onwardsi One Imponant dimension i n the way
of providing employment opportunities for the rural youth includes opportunltles where
the youth could find and exploit their own resources for self-ernploymel~t Rightly a
programme directed towards this objective of self-employment for the rural youth,
known as TRYSEM was initiated by the Government of India
In this chapter the physical and financial progress of TRYSEM Programme is
presented Further the objectives, approach and components of the programme are also
briefly discussed
5.1 OBJECTIVES, APPROACH AND STRATEGY:
A centrally sponsored scheme "Training of Rural Youth for Self-employment"
(TRYSEM) was launched by the Government of Indla, Department of Rural
Development on 15" August, 1979 TRYSEM is a facilitating component of the
Integrated Rural Development Programme (IRDP).'
The objective of TRYSEM is to provide technical skllls to rural youth from
families below poverty line to enable them to take up self-employment in the broad
fields of agriculture and allied activities, industries, services and business activities The
target group comprises rural youth between the age of 18-35 from famrlies l~vlng below
the poverty line According to guidelines the upper age hmit of 35 years is relaxed to 45
years in case of widows, freed bonded labourers, fieed convtcts, persons displaced due
3 Singh, S.K. "TRYSEM and Rural Employment Generation", Kurukshetra (April 19891, NIRD, ~yderabad, Vol. XXXVI I, No.7, pp.8-11.
4 Ministry of Ruml Development, "IRDP and Allied Programmes of TRYSEM and DWACRA" Manual (New Delhi : Government of India, 19981, pp. 20-27
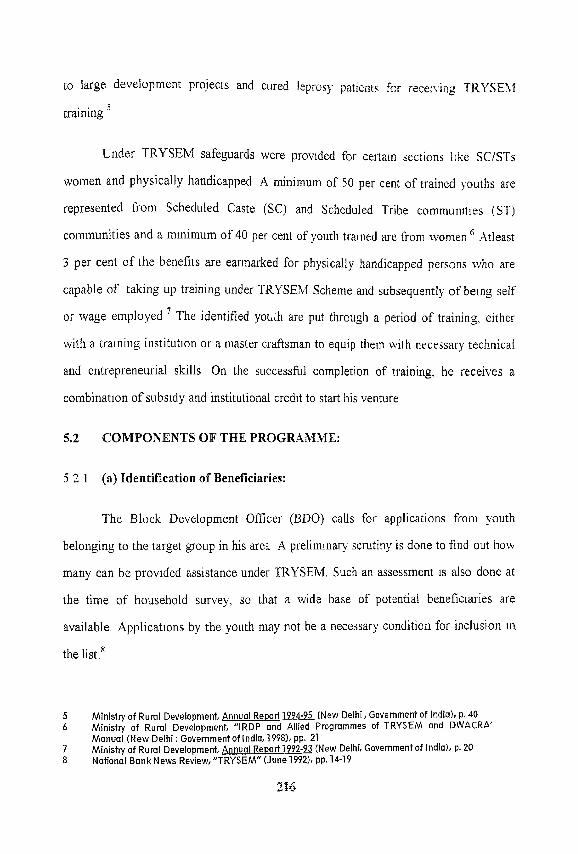
to large development projects and cured leprosy patients for receiving TRY SEhl
training
Under TRySEM safeguards were provided for certain sections Itlie SC/STs
women and physically handicapped A minimum of 50 per cent of trained youths are
represented from W d u l e d Caste (SC) and Scheduled Tribe cornrnunlties (ST)
communities and a minimum of 40 per cent of youth trained are from women h t l e a s t
3 per cent of the benefits are earmarked for physically handicapped persons who are
capable of taking up training under TRYSEM Scheme and subsequently of being self
or wage employed The identified y o ~ h are put through a period of training, either
with a training institution or a master craftsman to equip them with necessary technical
and entrepreneurial skills On the successful completion of training, he receives a
combination of subsidy and institutional credit to start his venture
5.2 COMPONENTS OF THE PROGRAMME:
5 2 1 (a) Identification of Beneficiaries:
The Block Development Officer (BDO) calls for applications from youth
belonging to the target group in his are; A preliminary scrutiny is done to find out holv
many can be provided assistance under TRYSEM. Such an assessment is also done at
the time of household survey, so that a wide base of potential beneficiaries are
available. Applications by the youth may not be a necessary condition for inclusion in
the list.'
5 Ministry of Rural Development, Annual Reoorf. 1994-95 (New Delhi , Government of India), p. 40 6 Ministty of Rural Development, "IRDP and Allied Programmes of TRYSEM and DWACRA'
Manual (New Delhi : Government of India, 19981, pp. 21 7 Ministry of Rural Development, Annual Reoort 1992-93 (New Delhi, Government of India), p. 20 8 National Bank News Review, "TRYSEM" (June 19921, pp. 14-19
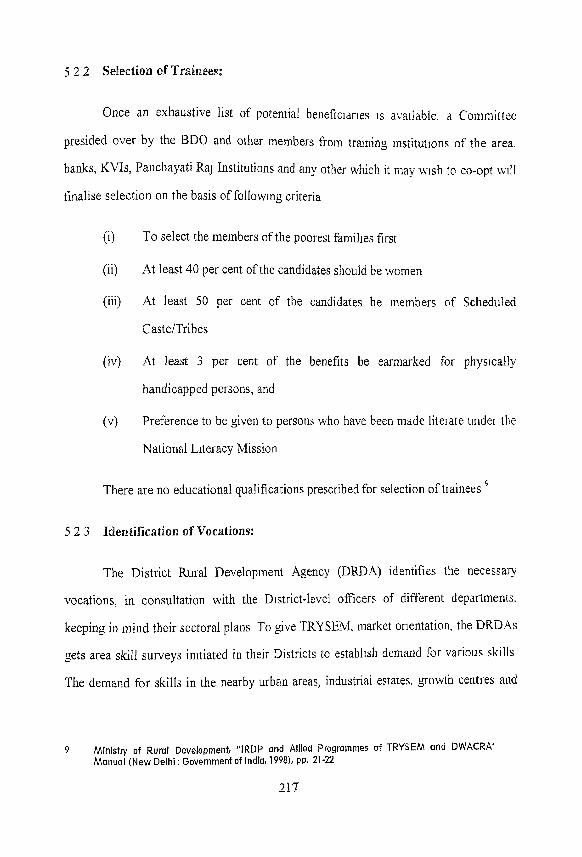
5 2 2 Selection sf Trainees:
Once an exhaustive list of potential benefic~arles is available. a Committee
presided over by the BDO and other members from training ~nstitutlons of the area.
banks, KVIs, Panchayati Raj Institutions and any other which it may wlsh to co-opt w~ll
finalise selection on the basis of following criteria
(i) To select the members of the poorest families first
(ii) At least 40 per cent of the candidates should be women
(iii) At least 50 per cent of the candidates be members of Scheduled
CasteITribes
(iv) At least 3 per cent of the benefits be earmarked for phys~cally
handicapped persons, and
(v) Preference to be given to persons who have been made literate under the
National Literacy Mission
There are no educational qualifications prescribed for selection of trainees
5 2 3 Identification of Vocations:
The District Rural Development Agency (DRDA) identifies the necessary
vocations, in consultation with the District-level officers of different departments,
keeping in mind their sectoral plans To give TRYSEM, market orlentation, the DRDAs
gets area skill surveys initiated in their gistricts to establish demand for various skills
The demand for skills in the nearby urban areas, industrial estates, growth centres and
9 Ministry of Ruml Development, "IRDP and Allied Programmes of TRYSEM and DWACRA' Manual (New Delhi : Government of India, 19981, pp. 21-22
22'7

major project areas also kept in view The final selection of vocations is done keeping I n
mind the demand for skills, goods and services requ~red
5 2 4 Identification of Training Facilities:
Once vocations have been shortlisted, the DRD;\ prepares a resource tnventoq
of training facilities The facilities may include institutions such as lTIs Pol3qechnics
Krishi Vigyan Kendras, Nehru Yuvak Kendras, Khadi and Village lndustnes Boards.
State Institutes of Rural Development extension tralning centres, reputed voluntary
organisations, and any departmental facilities available In that area In addition, reputed
master craftsmen are also utilised for tralnlng on a limited scale after adequately
ascertaining the quality of instructions they are capable of imparting RThile selecting
training institutionstmaster craftsman, it is ensured that they have adequate facilities in
terms of faculty, buildings etc lo
5.3 TRAINING:
Syllabus for each trade is approved by the DKDA The syllabus includes
training in job skills as well as mamgerial and entrepreneurial skllls The latter
may include (1) elements of book keeping (ii) slmple knowledge of marketing
(iii) acquaintance with product costing (iv) famillarisat~on wlth project financing by
banks Tra~ning module for each skill is systematically formulated and maximum
emphasis is on learning by doing
It is also felt desirable to associate successful trainees who have set up ventures
of self-employment with the training of a new batch of tranees The durat~on of training
10 Ministry of Agriculture and Rural Development, Annual Report, 1986-87, (New Delhi, Government of India), pp.12-13

generally does not exceed six months The State Le id CQ-ordinatmon Consmittee
(SLCC) can change the duration and prescribe duraklsn for nett trades DRD.4s Issue
certificates to TRYSEM trainees after successful complerlon of training
Stipends to trainees under TRYSEM are available as under
(i) Upto Rs 1501- per trainee per month, ~f the training is conducted in the vllIage
of the trainee
(ii) Upto Rs 2501- per trainee per month, if the training 1s conducted in a place other
than trainee's village and arrangements for free accommadation have been
made In case the period of trainlng is less than one month, dally stipend of
Rs 101- may be given subject to 2 maximum of Rs 1251-
(iii) Upto Rs 3001- per trainee per month, if the tralnlng is conducted in a piace other
than the trainee's village and no arrangements for free accommodation have
been made In case the per~od of training is less than one month, dally stipend of
Rs 121- may be glven subject to a maximum of Rs 1501-
On completion of training, the trainee is subjected to a performance test to see
whether he has acquired the skills and is proficient In them There is no financ~al
provision in the scheme for a perrod of apprent~ceshlp
5.4 SUPPLY OF FREE TOOLKIT TO TRALYEES:
A free toolkit costing not more than Rs S00/- can be given in kind to the trainees
during the course of the training itself It will be provided to the tranees after they have
acquired some proficiency, so that they gain experience in the use of their own toolk~ts

In case the toolkit costs more than Rs 800!- ~t could we]! be pro\-ided. if the balance is
met from the arrears of stipend or by the trainee htrnself
Artisans from a variety of crafts, except weaving, tailor~ng, needle-workers and
beedi-workers are supplied with suitable improved hand tools or a set of tools The
average cost of a toolkit is Rs 2,000 and in case of power driven tools the average-cost
is Rs 4,500 90 per cent of the cost of the toolk~t is a subsldy from the Goirernment of
India and 10 per cent is to be contributed by the beneficiary and there is no state share
The unit cost is to be fixed by the D~strict Rural Development .Agency (DRD.4)
concerned DRDA is the implementing agency "
5.5 FINANCING PROJECT FOR SELF-ENIPLOYMENT:
Loan application for assistance under IRDP of TRYSEM trainee has to be
completed and processed while training is still in progress, so that loan is disbursed
immediately upon completion of the course Delay in processing can lead to trainee
losing interest in the proposition and the benefit of tralnlng being lost, or at least
reduced. Apart from arranging institutionalecredit the Government provides subsidy to
the beneficiar~es for taking up self-employment scheme
The subsidy paid to the small farmers ~ncluding SCs is equal to one fourth of the
total cost of the project, while it 1s one third of the project cost for marglnal farmers and
rural artisans including scheduled castes But the maximum subsidy allowed In all the
above cases is Rs.3,000/-
11 Ministry of Rural Areas and employment, Annual Re~ort 1998-99 (Government of India, New Delhi) p. 36

5.6 ORGANISATIONAL SUPPORT :
(a) Central Level:
The Central Committee on IRDP and allied programmes prestded over by the
Secretary, Union Ministry of Rural Development provides the pollcy gu~delines
(b) State Level:
A Sub-committee of the State Level Co-ordination Committee (SLCC) is to be
constituted exclusively for TRYSEM An official of the rank of Project Director
(DRDA) w ~ l l function at State headquarters as part of the IRDP rnonttoring cell He
may be designated as Director (TRYSEM) Expenditure on this post is sharable equally
by the Central and the State Government l 2
(c) District and Block Levels :
The DRDA is responsible for the implementation of TRYSEM It has to ensure
complete involvement of all concerned District officials The District Industry Centre
has to be especially involved by the Industries Services Business (ISB) sector The APO
(Industries) and the Extension Officers !Industries) are to be specially designated at the
District and Block-levels respectively, as being responsible for the execution of
TRYSEM in addition to thetr normal dutles
A District Level Committee will be formed exclusively for TRYSEM follow-up
This Committee shall be a part of the DRDAs administrative organisation The main
72 Ministry of Ruml Areas and employment, Annual Report 1997-98 (Government of India, New Delhi), p.35

objective of the Committee was to take all necessary actions for rettllng TRJ7SEhI
trainees in ventures of self-employment or suitable \\age-employment on a substantive
and long-term basis It gives action taken report regarding settlement and progress of
TRYSEM trainees to the governing body of the DRDA whenever it meets
5.7 PROGRESS OF TRYSEM - INDIA
TRYSEM seeks to impart new skills and upgrade existing skills of beneficiaries
who are by and large attuned only to stagnant levels of agr~cultural or artlsan skills in
the year 1983 the objective of TRYSEM was enlarged to include prov~ding wage
employment also to trained youth TRYSEM has proved of great help in the
development of skills relevant to the rural areas The successhl implementation of this
programme is expected to bring out drastic Improvement in the living conditions of
rural youth The best criteria for assessing the development programme is to sketch out
the said objectives including physical targets and financial progress and then examine
the progress of achievement l3
TRYSEM broadly aims at providing basic technical and managerla1 skills to
rural youth from families below poverty line which will enable them to take up self-
employment ventures and also participate in wage employment activities relating to
agriculture and allied sectors, industries, services and business activities
The data on expenditure ~ncurred on TRYSEM are provided in the following
table
13 TRYSEM - "Training Rural youth for self-empfoyment", Co-a~emtive News Diaest, 30 (12) 1975' (December) : 214-21 6.

Table 5.1 - TRYSEM : Expenditure Incurred on Training during 1990-9 1-1 998-99
(Rs In lalihs)
Year Central Share State Share Total
1998-99 (upto Dec 98)
Source Annual Report 1998-99 - M~ustry of Rural Areas and Emplo~nicnt. 34-35
The above table explains the break up of the Central and State shares and the
total expenditure incurred during different years from 1990-91 to 1998-99 Dur~ng the
perlod 1993-94 the expenditure incurred was the highest. Thls may be due to the fact
that eighth five year plan recognised the worsening unemployment problem and
accorded high priority for achieving near full employment by 2000 The financial
support provided for TRYSEM programme can be explained with the help of the
following table

Table 5.2 - Financial Support Vnder TR17SE31 (Rs m lL&bsl
S1.No Period Recurring Infrastructure assistance to tralntng Expenses institutes as Central share
1 Sixth Plan 387 90 5.754 50
2 Seventh Plan 12884 90 2435 3 5
1998-99 (upto Dec 98)
Source 1 Annual Report 1997-98 - Mmstry of Rural Areas and Employment. p 35 2 Annual Report 1998-99 - Muustry of Rural Areas and Enlplo! rnent. p 155
(a> Denotes Central N A Not available
A cursory glance of the table indicates that large amounts were spent on this
programme for infrastructure development in sixth plan and seventh plan This may be
due to the fact that investment in infrastructure 1s qulte essential at the initial stages of a
development programme and needs huge resources The recurring expenses Increased
fi-011177 6 lakhs per annum during sixth ~ l a n to 6807 55 lakhs in 1997-98

The following table explains a b ~ t l t the number of beneficiaries to be trained and
the actual number undergone training
Table 5.3 - Targets and Achievements under TRYSEhl Programme in India
(Rs In ldd~s)
Period No to be trained No trained Percentage
Sixth Plan 1009440 I0 14695 100 52
Seventh Plan N A 876836 --
1998-99 (upto Dec 98)
Source NIRD, Rural Development Stabsbcs - 1998-99, p 225 N A . Not available
It is clear from the table that the number of trainees per annum under TRYSEh4
increased from around 2 lakhs during the sixth plan period to 2 5 lakhs in 1997-98 The
increase is not consistent and slight fluctuations are noticed It is also clear from the
table that the number of youth trained exceed the target during the sixth plan period and
1996-97 In the remaining years the achievement fell short of the target and it was very
low i e 22 50 per cent during 1998-99

The information on employment generation under TRYSEX1 are _elver? in Table
5.4 ~t can be seen from the table that though training \was given to 43 lakhs. only
24 lakhs were able to get employment constituting 54 49 per cent Further it is clear that
the percentage of trainees who got employment continuously declined from 62 8 per
cent in 1990-91 to 36 6 per cent in 1998-99 Employment generated under TRYSEM,
comprised of both self and wage employment Majority of the beneficiaries were able to
get self-employment, accounting for around 74 8 per cent while only around 25 19 per
cent were wage employed
Table 5.4 - Number of Youth Employed under TRYSEM Programme in India
Period No trained Self Wage Total
Sixth Plan 1014695 478396 (82 41) 102097 (17 50) 580493 (57 20)
Seventh Plan 876836 464036 (77 97) 131096 (22.02) 5951 32 (59 63)
(upto Dec 98)
Total: 4269670 1789718 (74.80) 602906 (25.19) 2392624 (54.49)
Source 1 Annual Report 1997-98 - Muustry Rural Areas & Employment, Govt of India, p 35 2 Annual Report 1998-99 - Mirustry Rural Areas & Employment, Govt. of India, p. 1 51;

It is interesting to note that while the proponlon of self-employed decllned from
82 41 per cent during the sixth plan to 53 75 per cent in 1998-99, the proportion of
wage employed increased from 17 5 per cent to 46 25 per cent during the same period,
thereby indicating declining prospects of self-employment generation under TRYSEM
Caste and gender were also given importance under this programme The
Table 5 5 provides explanation about caste wise break up and the level of women
prticipation From this it is clear that women were also given opportun~ty to participate
in this programme and gender equality was practiced
From the table it is evident that the percentage of SC/STs trained under
TRYSEM was more than 40 per cent as stipulated in the guidelines of the programme
The percentage of SC/ST youth trained was 44 6 per cent in 1990-91 and the percentage
remains almost the same at 45 per cent till 1998-99. During the period 1998-99, the
number tratned are relatively less so the percentage of SCIST category was as h ~ g h as
60 70 per cent The percentage of women trained reveals the gender equality and the
rate of percentage of women beneficiaries are trained was almost more than 50 per cent
in all the years except in 1995-96 (42 70 per cent)
The rate of percentage of women trained was as high as 70 2 per cent during the
period 1998-99 This reveals that women who belonged to the crucial group of family
also had their share of participation and employment in this programme There was no
discrimination on the basis of sex in this scheme
The following Table 5 5 explains the caste-wise breakup and women
participation in India during the implementation of TRYSEM programme

Table 5.5 - Coverage of SC/STs and Women among trained l'outh - India
Period No trarned SC/ST Women
Sixth Plan 10 1 4695 333928 (32 90) 342743 (33 77)
Seventh Plan 876836 422 1 45 (42 30) 459505 (46 04)
1998-99 6601 6 40073 (60 70) 46390 (70 2) (upto Dec 98)
Total: 4269670 1854825 (42.24) 2004668 (45.65)
Mean 224719 40 97622 42 105508 SO
LGR 2 290435 4 113449 4 37085 1
't'
Source . Annual Report 1997-98 - Ministry Rural Areas & Employment, Go\? of Indla, p 35 Amual Report 1998-99 - Ministry Rural Areas & Enlployment, Go1 t of Indln. p 35
Note F~gures m parentheses mhcate percentages * S~r@~cant at 10% level *** S~gnlficant at 1 % l e ~ ~ e l

5.8 PROGRESS OF TRYSEM - ANDHkS. PIWDESH :
TRl'SEM programme was implemented in Andhra Pradesh from 1979-80
~nwards A state level co-ordination committee was set up in 198 1 The members in the
committee represented various departments like industries, handlooms, handicrafts,
textiles, khadi and village industries e t ~ Thls State level committee meets frequently to
discuss about the implementation of the TRYSEM programme Implementation process
was completely decentralised in the district level with a district level committee headed
by the Distnct Collector The progress achleved under TRYSEM in the State is
discussed with the help of the following table
Table 5.6 - Target and Achievements under TRYSEM programme in A.P
Period No, to be trained No trained Percentage
1998-99 (upto Dec 98) 38534 7 192 18 66
Totall : 230033 147368 64.06
Source . 1 Annural Reports 1990-91, Department of Rural Development. M s t r q . of Agriculture. PP 67-68,
2.NIRD, Rural Development Statis~cs - 1996-97, pp 170-171 3 NIRD, Rural Development Statishcs - 1998-99, pp 220

The above table reveals that in 1990-91, 22,722 youth are to be tratned and only
15020 were trained (66 10) per cent. The number trained increased to 18 106 in 1 99 4 -92
i.e 76 32 per cent In 1994-95 the per centage of youth trained decreased to 46 80 per
cent and later again in 1996-97 it increased to 84.84 per cent But the per centage
trained was least in the year 1998-99 i e 18 66 per cent Some of the reasons for thls
may be lack of sufficient funds, lack of proper monitoring and discouraging atmosphere
of the past experience.
Total number of youth employed and the number of self-employed and wage
employed are presented in the Table 5 1
Table 5.7 - Number of Youth Employed under TRYSEM Programme in A.P
Period No tralned Self employed Wage elnplolred Total emplo! ed
1996-97 283 10 8130 (74 84) 2733 (25 IS) 10863 (38 37)
1998-99 7192 1416 (56.23) 1102 (43 76) 2518 (35 01) (upto Dec 98)
Total : 147368 52399 (76.02) 16528 (23.97) 68927 (46 77)
Source : NIRD, Rural Development Stat~sbcs - 1998-99, p 225 Note . Flgures in parentheses ~ndicate percentages

An analysis of employment generat~on under TRYSEhl in the state of ..\ndhra
Pradesh lndlcates that only 47 per cent of the trained youth were employed lvhlch is less
than the employment generation at all India level
It is also seen that during 1990-91 out of the total number employed, 76 02 per
cent are self-employed and 23 97 per cent are wage employed and total employment
was 46 77 per cent. In the year 1992-93 total employment has increased to 52 82 per
cent from 45 3 per cent (1 990-91) and later from 1994-95 it began to fall from 44 93 per
cent to 35 0 1 per cent in 1998-99 resulting in the increase in percentage of youth under
wage employment
Wage employment was highest in the year 1997-98 and lowest In the
year 1993-94 and it varied between 9 per cent to 55 per cent between the years
(1990-91-1998-99) whereas self-employment varied between 24.4 per cent to
80 per cent over the same period
The number of women trained and SCISTs trained under TRYSEM programme
in Andhra Pradesh are presented In the Table 5 8 The Cursory glance at the table
reveals that number of SCIST trained youth marked a decline till 1996-97 from
54 27 per cent to 24 7 per cent and later in the year 1998-99 it was 33 14 per cent With
regard to women's participation in TRYSEM it is disheartening to note that urornen
beneficlarles constituted only 11 per cent, which is around one fourth of the all India
coverage The proportion of women trained was least in the year 1993-1994
( 5 2 per cent) and highest in 1997-98 (27 6 per cent) However, in all the years the
percentage of women trained was less than the prescribed representation according to
guidelines of the programme.

Table 5.8 - Coverage of SC/STs and Women among trained Youth - -4.P
Period No trained SClST \11'0nlen
1990-9 1 15020 8152 (54 27) 1245 (08 20)
1998-99 7 192 2384 (33.14) 1102 (15 32) (upto Dec 98)
Total: 147368 62230 (42.22) 16528 ( 1 1.2)
Mean 13335 63 5915 421 3037.578
LGR 3 166309 1716180 - 2 94261
't' 1 988499* 1 166559~' -1 09229"~
Source: 1 NIRD, Rural Development Sta~shcs-1996-97, pp. 170-171 2. NIRD, Rural Development StaQshcs-1998-99, p 222 * Significant at 1% level NS-not Sigmficant
The investment in infrastructure is quite essential at the initial stages of a
development programme, When the infrastructural facilities become rich and stabilised
the same can be decreased l 4
14 National Institute of Rural Development, fJational Seminar on "TRYSEM and rural industn'es", (Sep. 8-1 0,1980), Hyderubad (mime01

The allocation of hnds for strengthening training and infrastructure are depicted
in the Table 5 9.
Table 5.9 - Allocation of Funds for Strengthening of Training Infrastr~cture-~4.P
(Rs rn ldd~s)
Year Allocation Funds Released Central + State Central + State
1990-9 1 117 28 55 42 (47 25)
199 1-92 117 20 56 03 (47 80)
1998-99 (upto Dec 98) 478 96 248 75 (5 1 93)
Source 1 NIRD, Rural Developnlent Stat~strcs (1 998-99), Hyderabad, pp 229 2 Annual Report (1998-99), rvfinrstry of Rural Areas and Employment, Go\? of India, pp 155
Note Flgures in parentheses inhcates percentages
The above table reveals that allocation of hnds (Centre & State) marked an
increase from 117 28 lakhs in 1990-91 to 684 92 lakhs in 1994-95 showlng an increase
but it remained the same for the period 1994-95 - 1997-98 Later it fell to 478 96 lakhs
in 1998-99 It can be observed from the table that hnds released marked a gradual
increase from 55 42 lakhs in 1990-91 to 1028 37 lakhs in 1995-96 but later it decreased
to 157 12 lakhs in the year 1996-97 Again in the year 1997-98 it increased to 669 10
lakhs and finally in the last year of the programme implementation it fell to 238 75
lakhs

Thus in the beginning, the resource allocation for promoting training
infrastructure was negligible Later realising the need to increase it, the amounts are
increased and it can be seen from the table that that the allocated funds are not totally
released The released funds constituted around 50 per cent of allocated funds from
1990-91 to 1994-95. later jumped to 150 per cent in 1995-96, again slashed down to 23
per cent in 1996-97 and again increased to 98 per cent in 1997-98
5.9 PROGRESS OF TRYSEM - NELLORE DISTRICT:
At the District level there is TRYSEM Committee for which District Coilector 1s
the Chairman The DRDA which assumes the over-all responsibility for the programme
provides the subsidy Projects for self-employment were discussed and prepared by the
youth with development officials Beneficiaries are being helped by the tralner, the
banker, the industrial Extension Officer and Block Development Officer (BDO) The
DRDA in its monthly meetings discusses the proposals and scrutinises the list of
beneficlar~es under the programme The officials of DRDA and DIC visit the
beneficraries and after train~ng period help them to obtain assistance from financial
institutions for starting their enterprises At the mandal level, the selection committee
usually consists of Mandal Development Officer (MDO), representative of lead bank,
IC & master craftsmen
The progress of the programme in terms of number of trained youth since ~ t s
inception in the district is hrnished in the Table 5 10. During 1980-99 train~ng was
given to youth in number of economic activities. A birds eye view of the table indicates
that on an average 775 rural youth are trained per annurn which is more than the target
It has to be noted that there are wide fluctuations in the number of trained persons
during 1980-1998 as shown by the calculated standard deviation Further the calculated
growth rate is observed to be significant at 1 per cent level.

Table 5.10- Number of Youth Trained under TRYSE3I Nellore District
SI.No. Year No. of Candidates trained
1 1980-8 1 732
Total :
Mean
S D
L G R
't'
CV
Source District Rural Development Agency, Nellore * * * Significant at 1 % level

Keeping in view the norms of TRUSEM, necessary per centage was allotted for
SC/STS and women and the following table explains the caste wise break up and
women beneficiaries trained under the programme
Table 5.12 - Caste-wise particulars of TRUSEM since 1990
No. of candidates Year trained SGslSTs Women
1990-9 1 708 575 (8 1.20) 206 (29 09)
199 1-92 483 358 (74 12) 144 (29 81)
1992-93 1361 899 (66 05) 408 (30.00)
1993-94 1483 768 (5 1 78) 444 (30 00)
1994-95 1425 696 (48 84) 575 (40 35)
1995-96 1375 71 9 (52 29) 786 (57 16)
1996-97 1173 436 (37 16) 477 (40 66)
1997-98 945 478 (50 58) 550 (58 20)
1998-99 847 339 (40 12) 288 (34 00)
Total : 9800 5268 (53.75) 3878 (39.57)
Mean 458.1052 254 7894
LGR
(t'
Source. Dlslrict Rural Developll~ent Agency, Nellore NS - not-s~grufic;uit *** Significant at 1%) level
From the above table it can be noticed that the amount of trained youth
belonging to SCISTs was highest as 899 in the year 1992-93, and for women 786 in the
year 1995-96. The calculated mean, st~nidard deviation, long term growth rates were
depicted in the Table 5.12.

The details of expenditure incurred under TRYSEM in Nellore District are
furnished in the following table
Table 5.113 - Total Expenditure Incurred under TRVSEM in Nellore District
- Year No. of Trained Expenditure (in lakhs)
-
Total : 9,800 3,16,26,000
Source DRDA, Nellorc
The above table reveals that expenditure was highest during the year 1995-96
and later ~t decreased to 30,53,000 by 1998-99 Though the allocation of expenditure
over different years was in varying amounts from 1993-94 (15,46,000) to 1996-97
(59,80,000) the expendtture was increasing But the last years of programme
implementation marked a decline in expenditure
Thus it can be concluded the TRYSEM plays a vital role in enhancing
employment opportunities to rural youth But the performance of TRYSEM in terms of
number of youth trained was less than the target in India, Andhra Pradesh and in the

study region, Nellore District. Though TRYSEM programme started with the main
of providing self-employment, later wage employment was also included in
the programme manual It is krther noticed that half of the trained youth were able to
set up self-employment and a considerable portion of youth wage employment ~ f f o r t s
were made by the implementing authorities to improve the performance of the
programme Due to lack of proper CO-ordination and monitoring, TRYSEM programme
could not achieve the desired result and efforts have to be taken by the implementing
authorities to enable the trained rural youth to set up self-employment schemes by
themselves atleast in fbture
5,10 CONCLUSION:
The vast human resources as at present are away from direct involvement In the
national development process One important decision in the way of providing
employment opportunit~es for the rural poor includes opportunities where the youth can
.find and exploit thetr own resources for self-employment Rightly a programme directed
towards this objective of self-employment for the rural youth known as TRYSEM was
initiated by the Government of India on August 15'h, 1979 Its main objective was to
provide technical skills to rural youth from families below poverty line to enable them
to take up self-employment in agriculture, industry, services and business activities. 50
per cent of trained youth are from SC/ST communities and 40 per cent of youth
includes women The identification of the beneficiaries for the programme will be done
after preliminary scrutiny A committee, presided over by the B D . 0 and other members
finalise the selection on tke basis of certain guidelines. Necessary vocations are
identified and training will be imparted through various government and non-
governmental organisations and the syllabus includes training in job-skills as well as

and entrepreneurial skills Stipends to trainees are paid depending on the
vocation Trainees are subjected to test after training and certificates are issued At the
end of the training, free tool kits are given to trainees, so that they get experience in the
use of their own tool kits Loan applications for assistance under IRDP of TRYSEM are
completed and processed while training is still in progress to obtain loans immediately
after the completion Organisational support is provided both by central and state level
co-ordination committee and Project Officer, D N A hnctions at District headquarters.
Between 1990-91 to 1998-1999 amount spent on this programme increased from
3260 93 lakhs to 8976 28 lakhs Large amounts were spent on this programme for
infrastructure development in sixth and seventh plans Recurring expenditure also
marked an increase from 77 6 lakhs tc 5807 lakhs during the period 1990-91 to 1997-
1998 The number of youth trained per annum ~ncreased from around 2 lakhs during the
sixth plan period to 2 5 lakhs in 1997-98 54 49 per cent of youth could able to get
employment generated under TRYSEM comprised both self-employment and wage
employment It was notlced that wage employment increased from 17 5 per cent to
46 24 per cent from sixth plan to 1998-99 whereas self-employment marked a decline
during the same period from 82 41 per cent in the sixth plan to 53 75 per cent in
1998-99 The youth tra~ned out of SC/ST communities also marked an increase and the
number of women beneficiaries trained was almost more than 50% in all the years
TRUSEM programme was implemented in Andhra Pradesh from 1979-80
onwards In Andhra Pradesh, the achievement has been always less than the target Out
of the total number of beneficiaries trained during the perlod 1990-91 to 1998-99, only
46 7 per cent were able to get employment opportunities. Out of the total number
employed 76 02 per cent are self-employed and 23 97 per cent are wage employed.
There was a decline in self-employment from 81.70 per cent to 56.23 per cent and in

case of wage employment there was an increase from 18 2 per cent to 43 76 per cent
during the same period (1990-9 1 to 1998-99) Among the number of trained youth, the
~roportlon of women was only 11 2 per cent and the proportion of SClST trained was
42 22 per cent
At the district level, Nellore district which was the sample for study, the over-all
responsibility rests with DRDA and the District Collector is Chairman The progress of
TRYSEM programme, in terms of number of youth trained since its inception, revealed
wide fluctuations in the number of youth trained during the period 1980-98 where
14733 youth were trained for the entire period During the period 1990-99 the
programme provided considerable amount of wage employment also in the district
where on an average 512 youth were self-employed and 337 youth were wage
employed Caste wise particulars revealed that number of SCIST trained were in the
proportion of 53 75 per cent during the period 1990-91 to 1998-99 and the women
beneficiaries were 39 357 per cent The expenditure incurred over a ten year period
from 1990-91 to 1998-99 amounted to Rs 3,16,26,000 00 Thus the phys~cal and
financial progress of TRYSEM In India, Andhra Pradesh in general and study
region- Nellore Distr~ct in particular were studied in this chapter
Top Related