


Languages
Pages
Legal

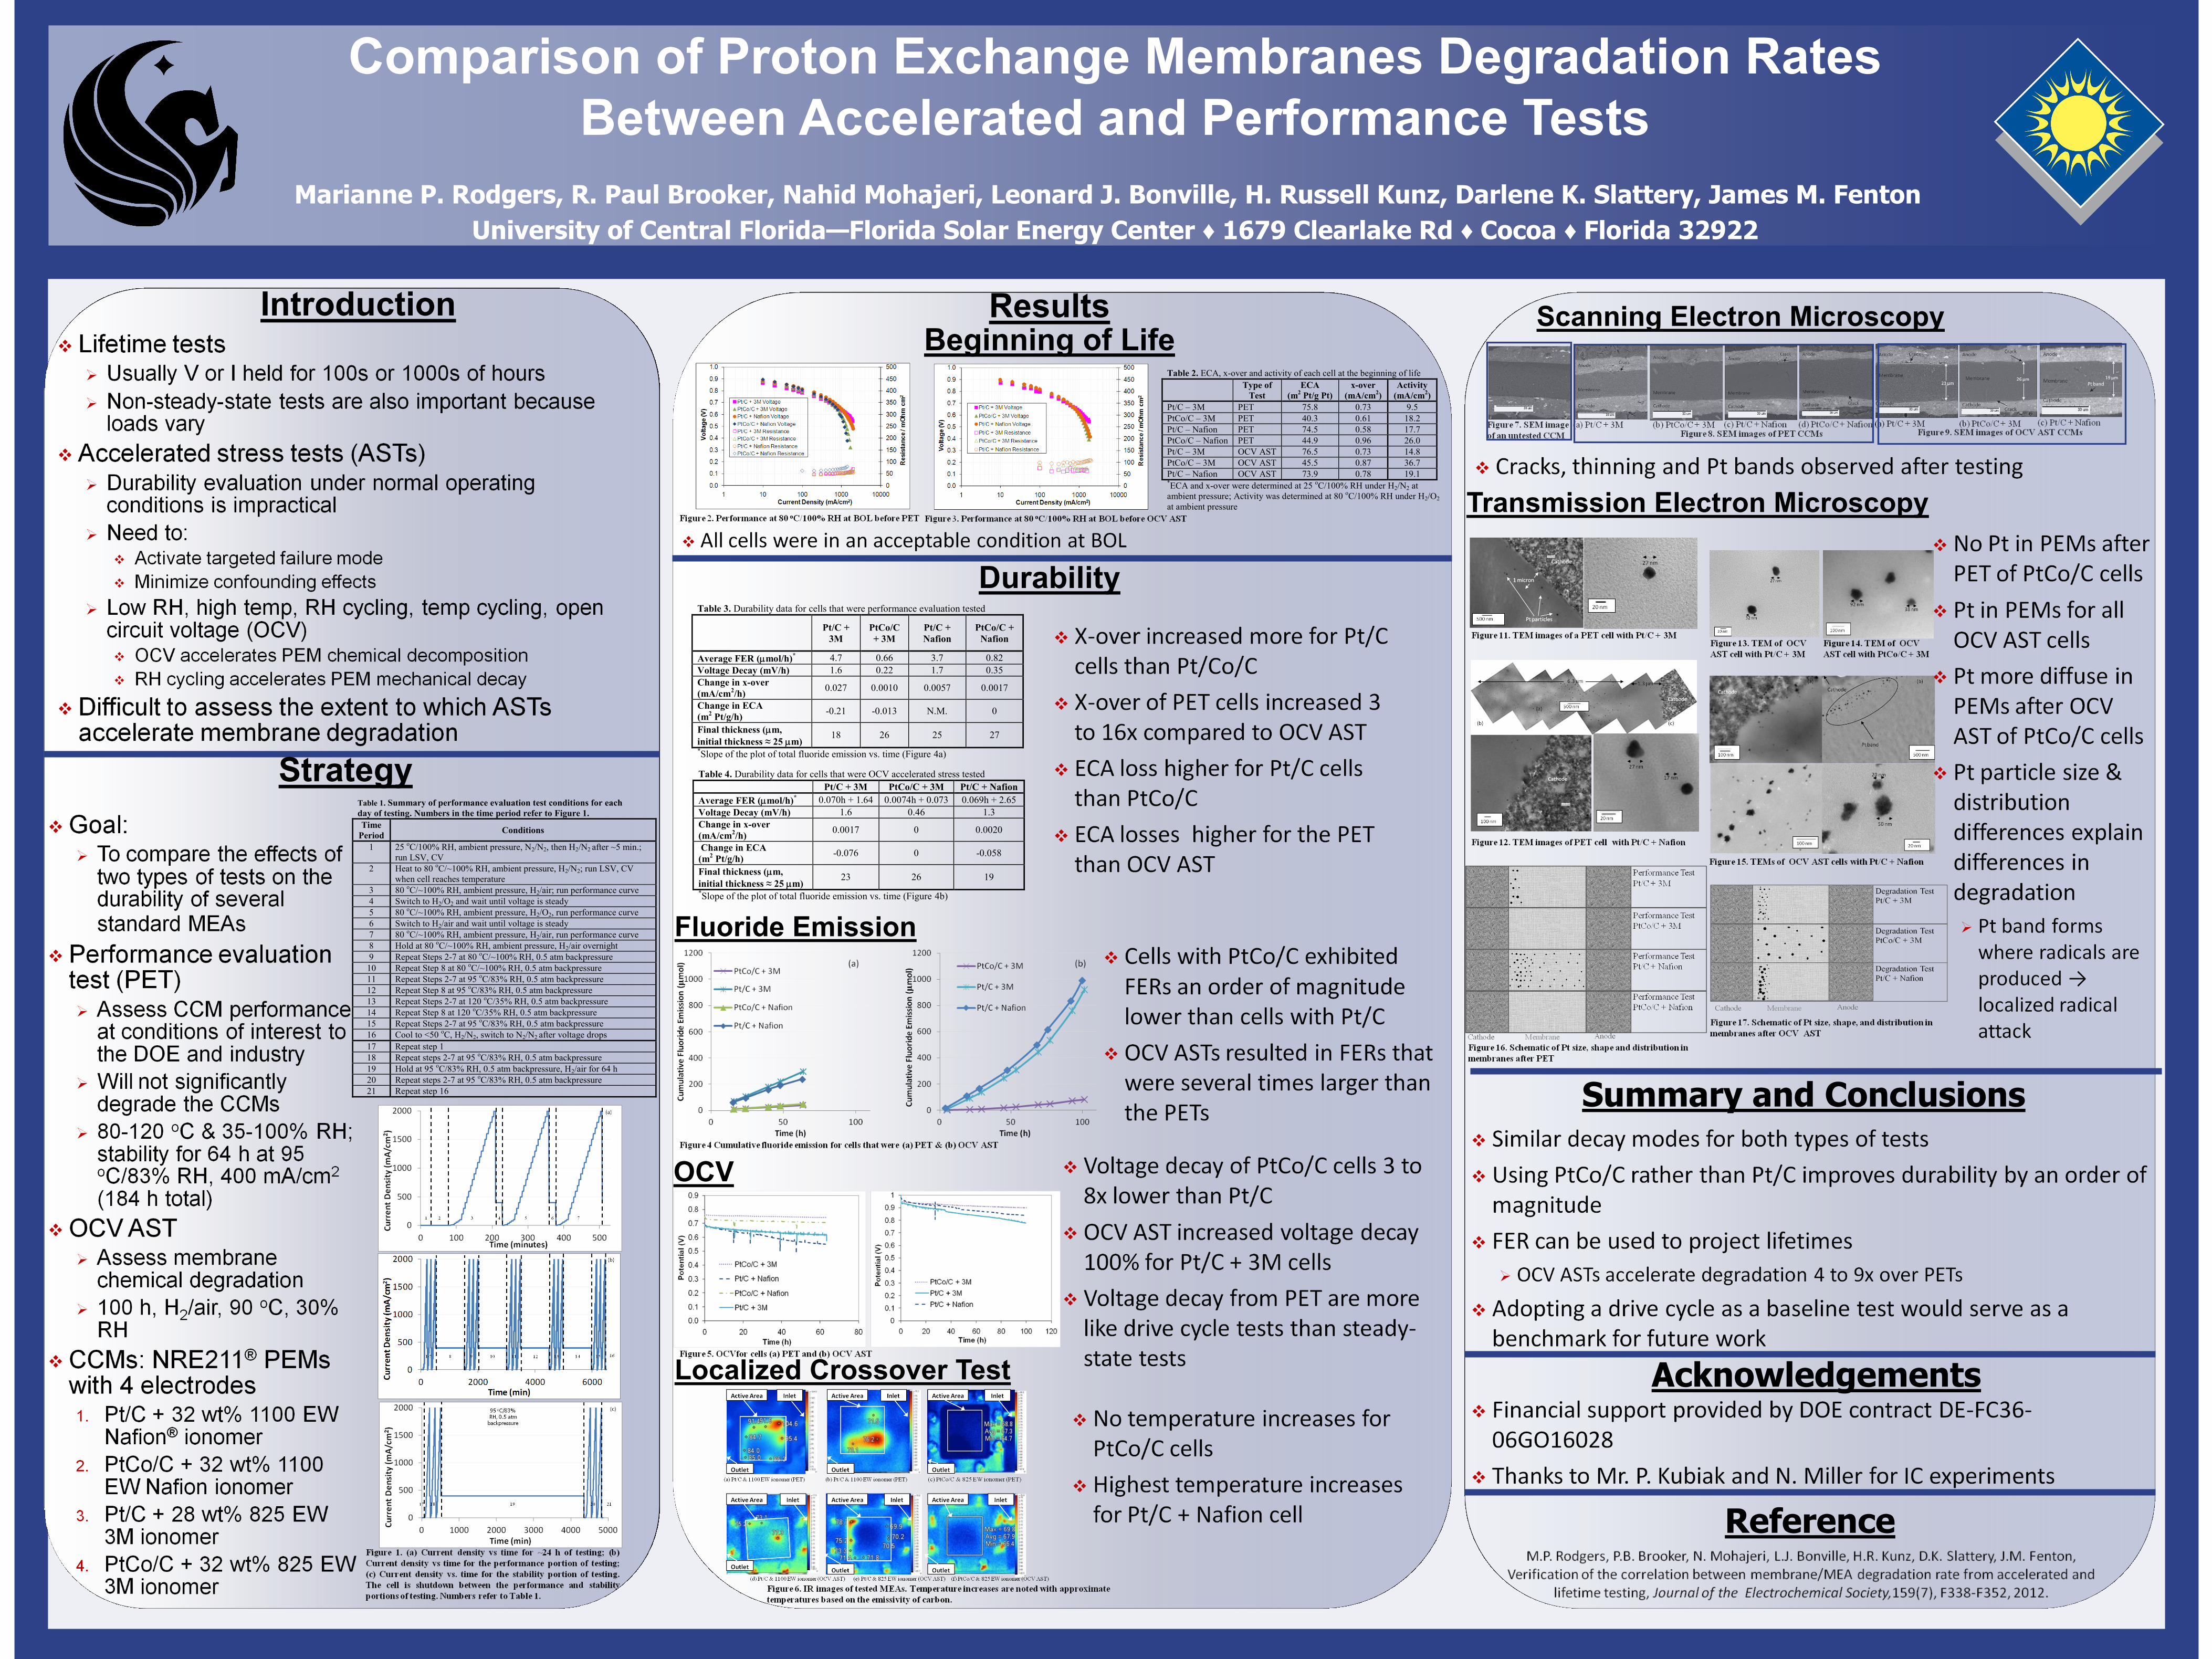
Comparison of Proton Exchange Membranes Degradation Rates
Between Accelerated and Performance Tests
Marianne P. Rodgers, R. Paul Brooker, Nahid Mohajeri, Leonard J. Bonville, H. Russell Kunz, Darlene K. Slattery, James M. Fenton
University of Central Florida—Florida Solar Energy Center ♦ 1679 Clearlake Rd ♦ Cocoa ♦ Florida 32922
Acknowledgements
Introduction
Strategy
Results Beginning of Life
Durability
Fluoride Emission
OCV
Table 1. Summary of performance evaluation test conditions for each
day of testing. Numbers in the time period refer to Figure 1.
Time
Period Conditions
1 25 oC/100% RH, ambient pressure, N2/N2, then H2/N2 after ~5 min.;
run LSV, CV
2 Heat to 80 oC/~100% RH, ambient pressure, H2/N2; run LSV, CV
when cell reaches temperature
3 80 oC/~100% RH, ambient pressure, H2/air; run performance curve
4 Switch to H2/O2 and wait until voltage is steady
5 80 oC/~100% RH, ambient pressure, H2/O2, run performance curve
6 Switch to H2/air and wait until voltage is steady
7 80 oC/~100% RH, ambient pressure, H2/air, run performance curve
8 Hold at 80 oC/~100% RH, ambient pressure, H2/air overnight
9 Repeat Steps 2-7 at 80 oC/~100% RH, 0.5 atm backpressure
10 Repeat Step 8 at 80 oC/~100% RH, 0.5 atm backpressure
11 Repeat Steps 2-7 at 95 oC/83% RH, 0.5 atm backpressure
12 Repeat Step 8 at 95 oC/83% RH, 0.5 atm backpressure
13 Repeat Steps 2-7 at 120 oC/35% RH, 0.5 atm backpressure
14 Repeat Step 8 at 120 oC/35% RH, 0.5 atm backpressure
15 Repeat Steps 2-7 at 95 oC/83% RH, 0.5 atm backpressure
16 Cool to <50 oC, H2/N2, switch to N2/N2 after voltage drops
17 Repeat step 1
18 Repeat steps 2-7 at 95 oC/83% RH, 0.5 atm backpressure
19 Hold at 95 oC/83% RH, 0.5 atm backpressure, H2/air for 64 h
20 Repeat steps 2-7 at 95 oC/83% RH, 0.5 atm backpressure
21 Repeat step 16
Table 2. ECA, x-over and activity of each cell at the beginning of life
Type of
Test
ECA
(m2 Pt/g Pt)
x-over
(mA/cm2)
Activity
(mA/cm2)
Pt/C – 3M PET 75.8 0.73 9.5
PtCo/C – 3M PET 40.3 0.61 18.2
Pt/C – Nafion PET 74.5 0.58 17.7
PtCo/C – Nafion PET 44.9 0.96 26.0
Pt/C – 3M OCV AST 76.5 0.73 14.8
PtCo/C – 3M OCV AST 45.5 0.87 36.7
Pt/C – Nafion OCV AST 73.9 0.78 19.1 *ECA and x-over were determined at 25
oC/100% RH under H2/N2 at
ambient pressure; Activity was determined at 80 oC/100% RH under H2/O2
at ambient pressure
Table 3. Durability data for cells that were performance evaluation tested
Pt/C +
3M
PtCo/C
+ 3M
Pt/C +
Nafion
PtCo/C +
Nafion
Average FER (mol/h)* 4.7 0.66 3.7 0.82
Voltage Decay (mV/h) 1.6 0.22 1.7 0.35
Change in x-over
(mA/cm2/h)
0.027 0.0010 0.0057 0.0017
Change in ECA
(m2 Pt/g/h)
-0.21 -0.013 N.M. 0
Final thickness (m,
initial thickness ≈ 25 m) 18 26 25 27
*Slope of the plot of total fluoride emission vs. time (Figure 4a)
Table 4. Durability data for cells that were OCV accelerated stress tested
Pt/C + 3M PtCo/C + 3M Pt/C + Nafion
Average FER (mol/h)* 0.070h + 1.64 0.0074h + 0.073 0.069h + 2.65
Voltage Decay (mV/h) 1.6 0.46 1.3
Change in x-over
(mA/cm2/h)
0.0017 0 0.0020
Change in ECA
(m2 Pt/g/h)
-0.076 0 -0.058
Final thickness (m,
initial thickness ≈ 25 m) 23 26 19
*Slope of the plot of total fluoride emission vs. time (Figure 4b)
Localized Crossover Test
Scanning Electron Microscopy
Transmission Electron Microscopy
Summary and Conclusions
Reference
Top Related