


Languages
Pages
Legal


3Q17 EARNINGS
RELEASE
OCF
R$360.4 mn
+101.3%
EBITDA Margin
+2.2p.p.
27.7%
EBITDA
+15.0%
R$223.6 mn
+5.9%
Net Revenue
R$808.1 mn
Average Ticket
On-campus:
+ 10.2%
Distance Learning:
+ 12.1%
1
Rio de Janeiro, October 27, 2017
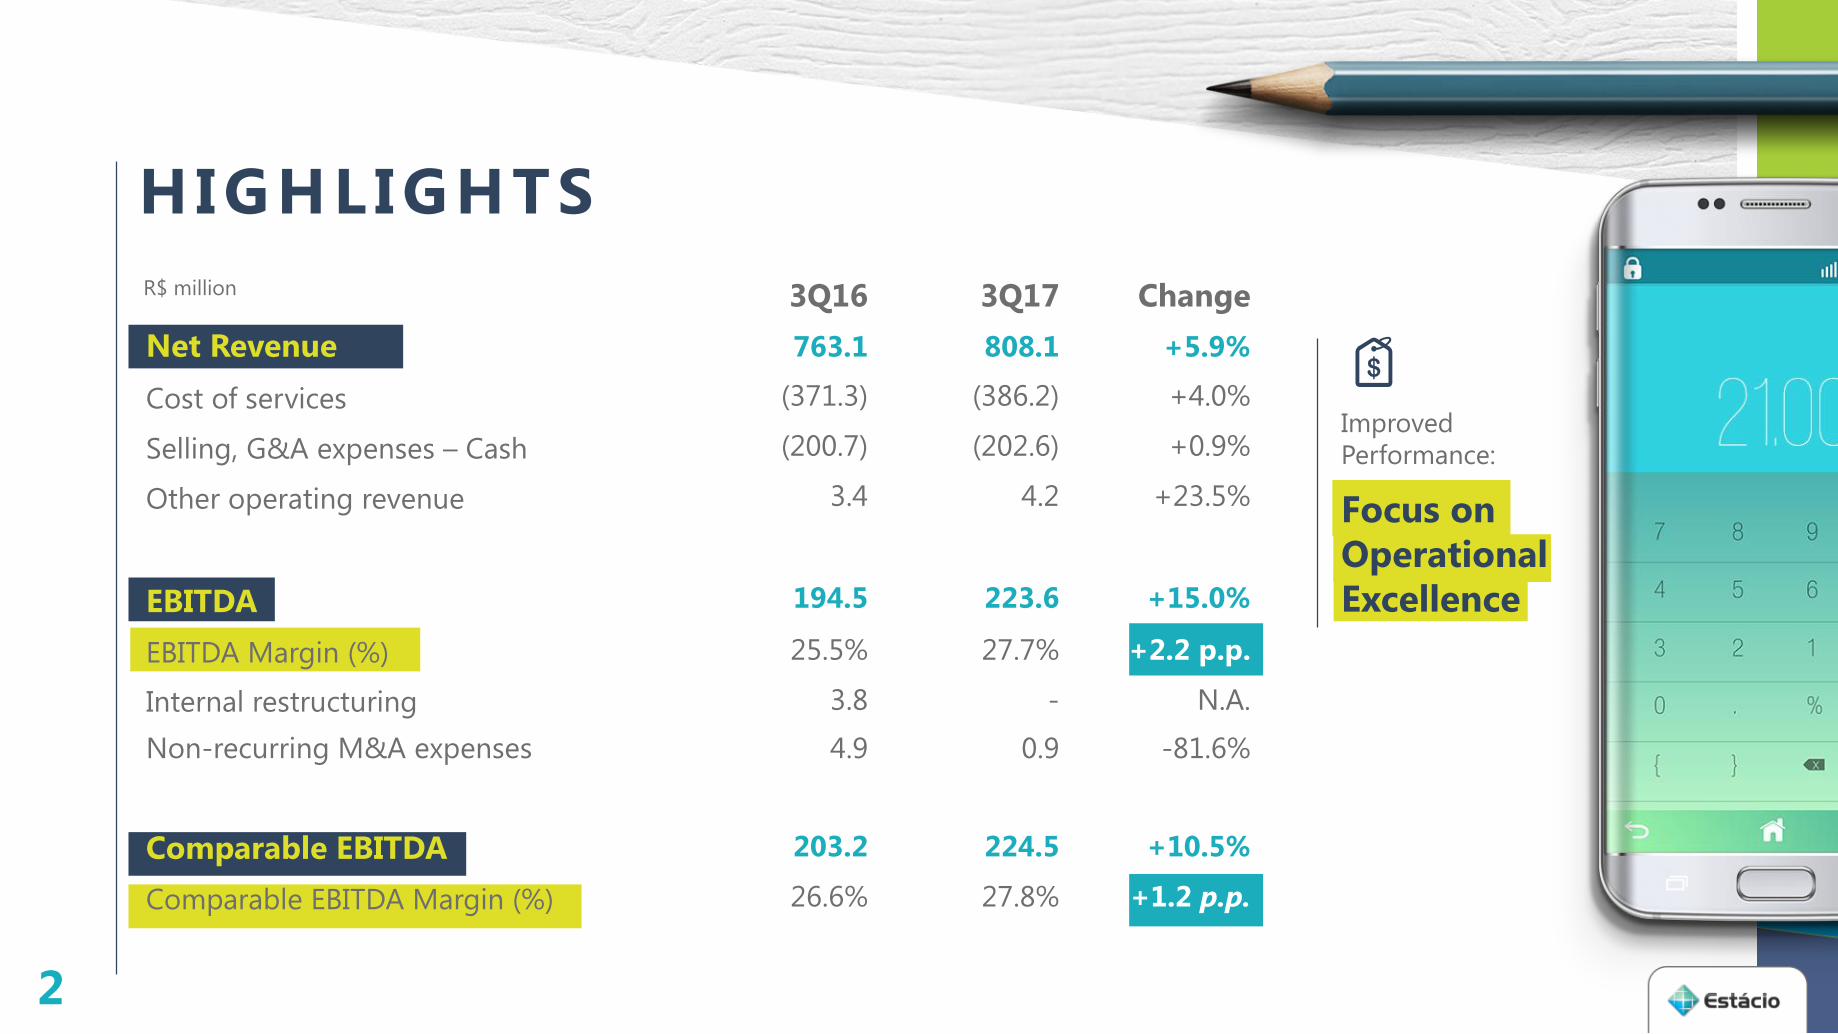
HIGHLIGHTS
R$ million
2
Improved
Performance:
Focus on
Operational
Excellence
3Q16 3Q17 Change
Net Revenue 763.1 808.1 +5.9%
Cost of services (371.3) (386.2) +4.0%
Selling, G&A expenses – Cash (200.7) (202.6) +0.9%
Other operating revenue 3.4 4.2 +23.5%
EBITDA 194.5 223.6 +15.0%
EBITDA Margin (%) 25.5% 27.7% +2.2 p.p.
Internal restructuring 3.8 - N.A.
Non-recurring M&A expenses 4.9 0.9 -81.6%
Comparable EBITDA 203.2 224.5 +10.5%
Comparable EBITDA Margin (%) 26.6% 27.8% +1.2 p.p.

FLOWCASH
3
R$ million 3Q16 3Q17
PROFIT BEFORE TAXES AND AFTER RESULTS FROM
CONTINUED OPERATIONS 116.8 132.7
Adjustments to reconcile profit to cash and cash equivalents 136.9 119.4
Changes in assets and liabilities (27.9) 149.5
Net cash provided by (used in) operating activities 225.8 401.6
Acquisition of property and equipment (30.4) (25.6)
Acquisition of intangible assets (16.5) (15.7)
OPERATING CASH FLOW (OCF) 179.0 360.4
Cash flow from investment activities 0.0 -
Cash flow from financing activities 8.6 (193.1)
Net cash provided by (used in) financing activities 187.5 167.2
EBITDA 194.5 223.6
Net cash provided by (used in) operating activities / EBITDA 116.1% 179.6%
OCF / EBITDA 92.0% 161.2%
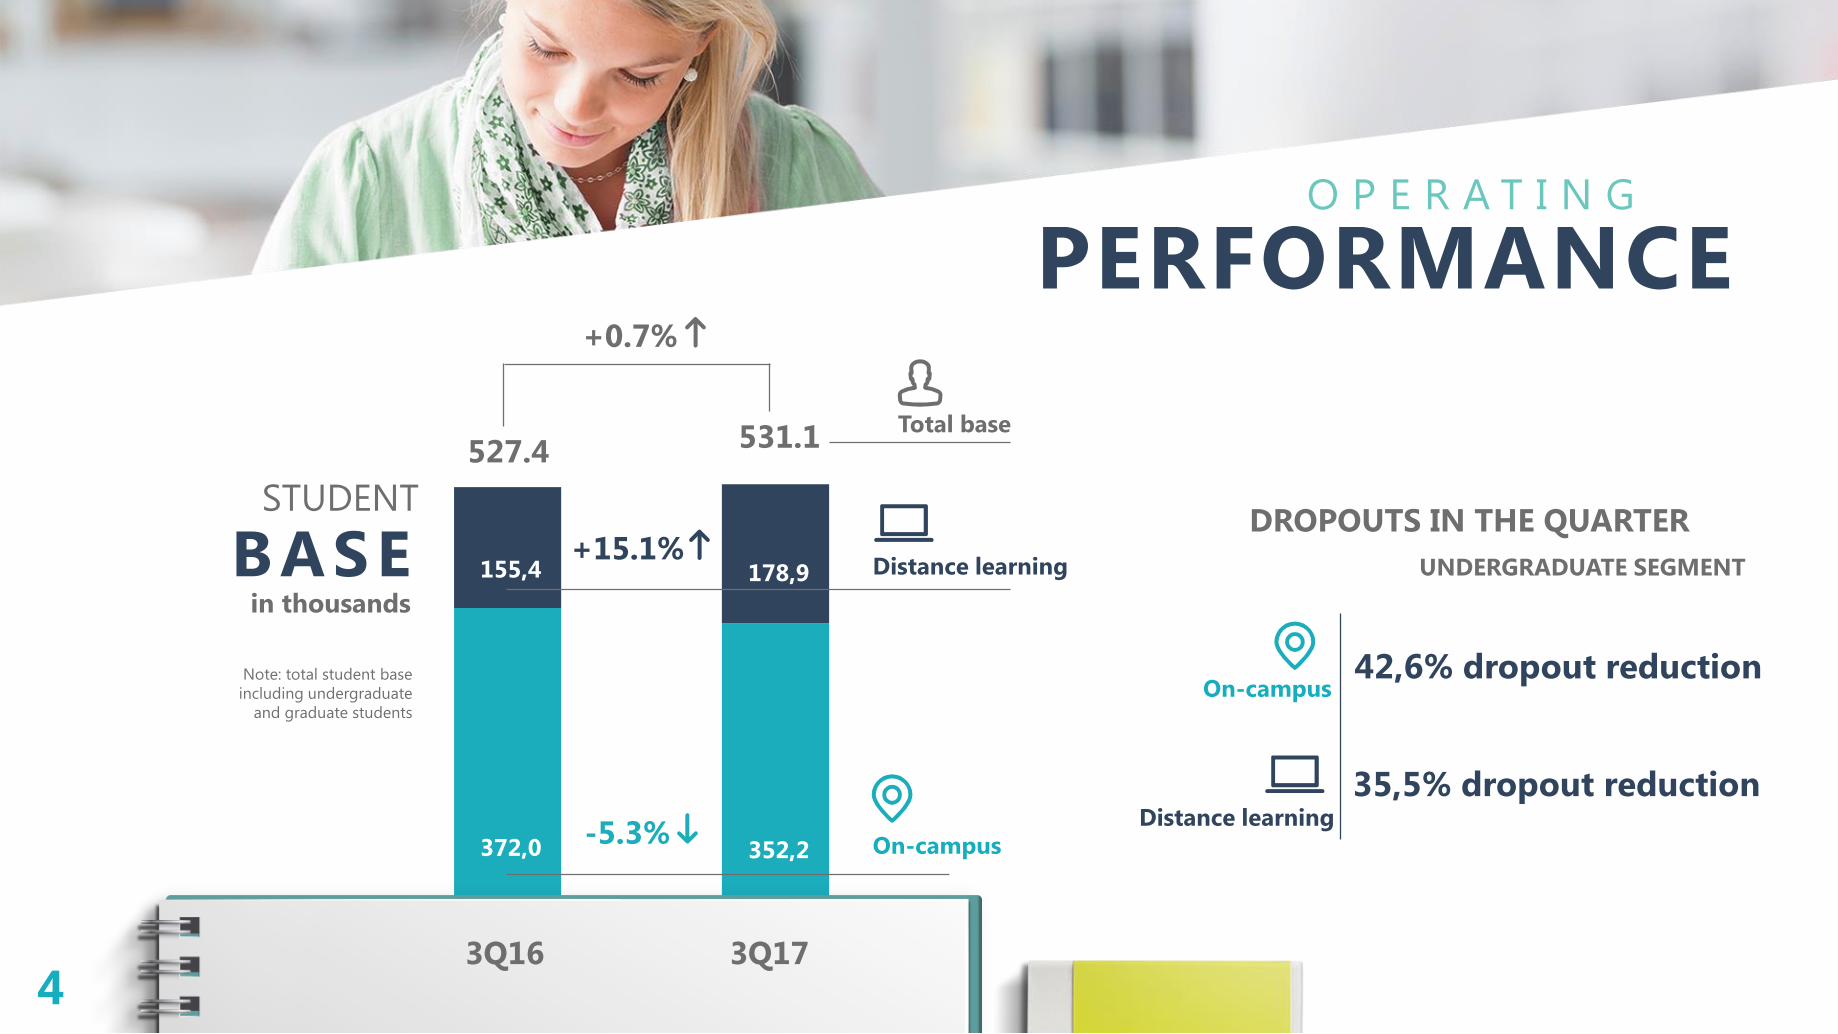
372,0 352,2
155,4 178,9
Note: total student base
including undergraduate
and graduate students
Distance learning
On-campus-5.3%
BASESTUDENT
in thousands
3Q16
527.4 531.1
3Q17
+15.1%
+0.7%
Total base
PERFORMANCEO P E R A T I N G
4
DROPOUTS IN THE QUARTER
35,5% dropout reductionDistance learning
On-campus42,6% dropout reduction
UNDERGRADUATE SEGMENT

On-campus 3Q16 3Q17 Change
Undergraduate 657.6 716.4 8.9%
Graduate 203.2 290.3 42.9%
Total 625.2 688.7 10.2%
Distance
learning 3Q16 3Q17Change
Undergraduate 201.9 215.4 6.7%
Graduate 103.0 191.3 85.7%
Total 189.6 212.6 12.1%
PER SEGMENT R$
Result from the change in the pricing
strategy and courses offered
Sustainable base, students
who comply with payment
obligations and
performance management
AVERAGE TICKET
5
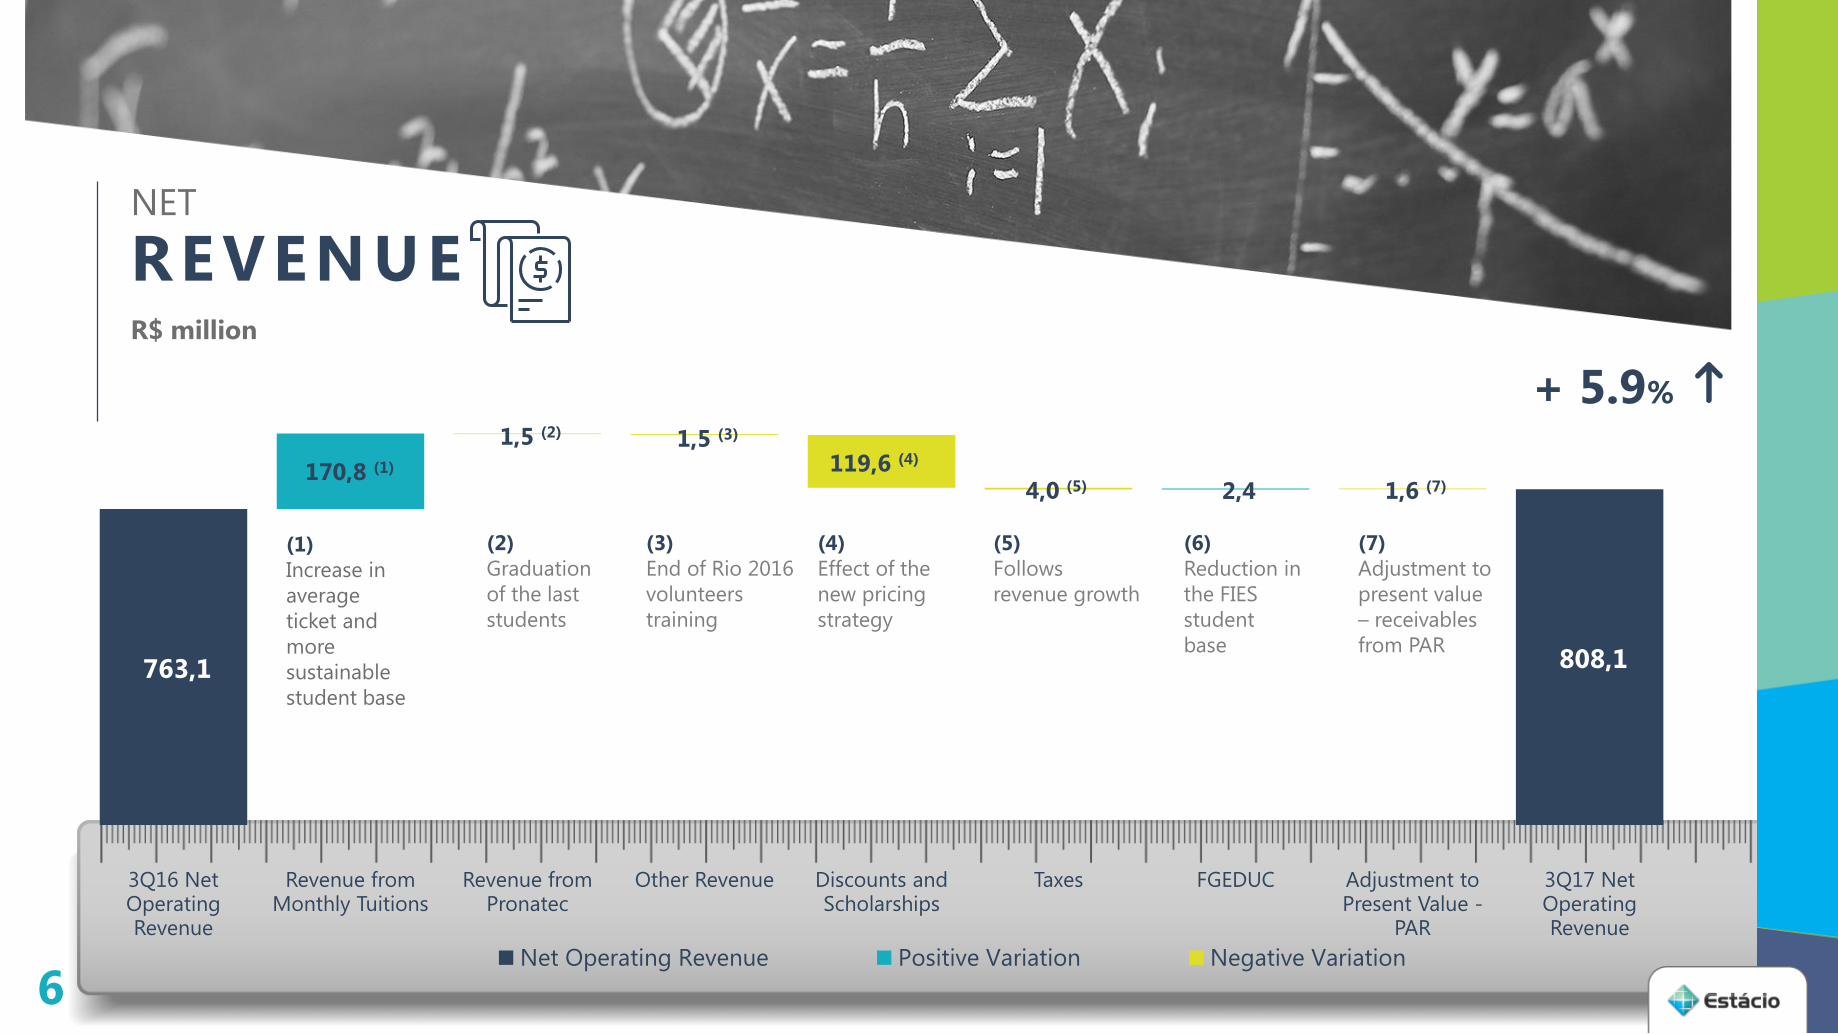
763,1 808,1
170,8 (1)
2,4
1,5 (2) 1,5 (3)
119,6 (4)
4,0 (5) 1,6 (7)
3Q16 Net Operating Revenue
Revenue from Monthly Tuitions
Revenue from Pronatec
Other Revenue Discounts and Scholarships
Taxes FGEDUC Adjustment to Present Value -
PAR
3Q17 Net Operating Revenue
Net Operating Revenue Positive Variation Negative Variation
REVENUENET
R$ million
(1)
Increase in
average
ticket and
more
sustainable
student base
(2)
Graduation
of the last
students
(3)
End of Rio 2016
volunteers
training
(4)
Effect of the
new pricing
strategy
(5)
Follows
revenue growth
(6)
Reduction in
the FIES
student
base
(7)
Adjustment to
present value
– receivables
from PAR
+ 5.9%
6
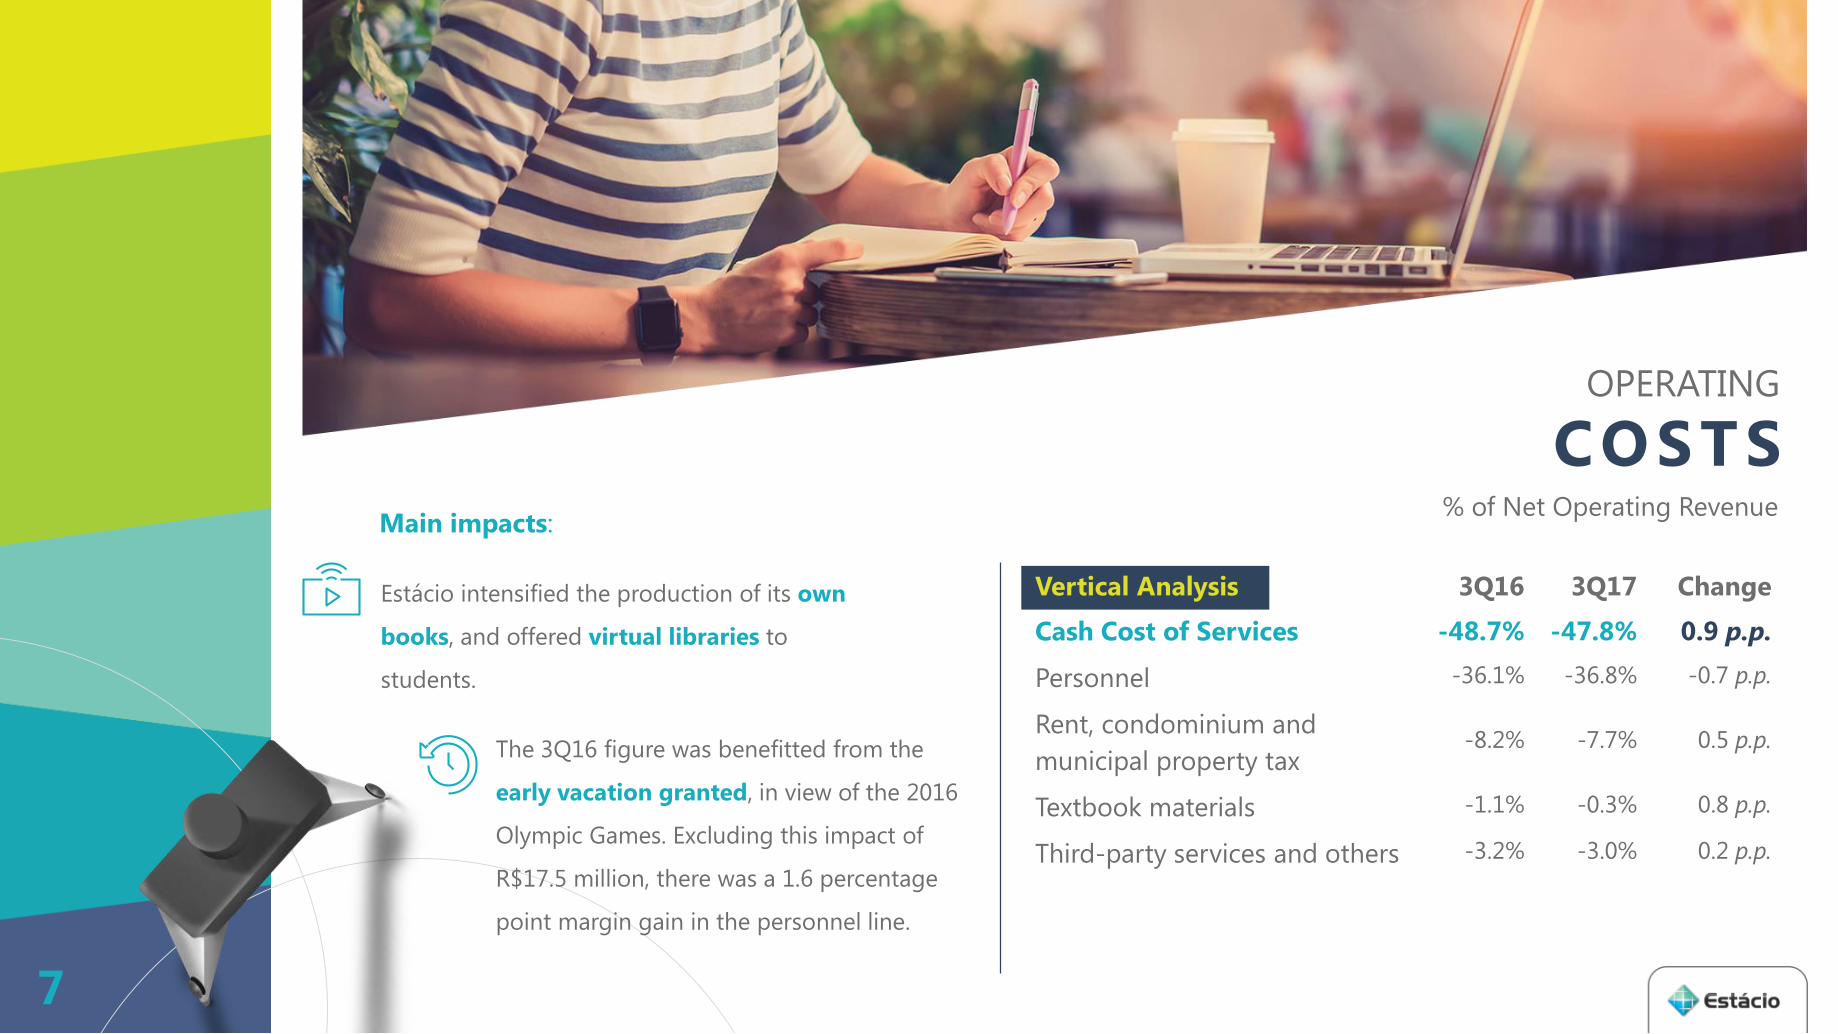
COSTSOPERATING
% of Net Operating Revenue
Vertical Analysis 3Q16 3Q17 Change
Cash Cost of Services -48.7% -47.8% 0.9 p.p.
Personnel -36.1% -36.8% -0.7 p.p.
Rent, condominium and
municipal property tax-8.2% -7.7% 0.5 p.p.
Textbook materials -1.1% -0.3% 0.8 p.p.
Third-party services and others -3.2% -3.0% 0.2 p.p.
Main impacts:
Estácio intensified the production of its own
books, and offered virtual libraries to
students.
The 3Q16 figure was benefitted from the
early vacation granted, in view of the 2016
Olympic Games. Excluding this impact of
R$17.5 million, there was a 1.6 percentage
point margin gain in the personnel line.
7

E XPENSESOPERATING
% of Net Operating Revenue3Q16 3Q17 Change
Selling expenses -10.0% -12.1% -2.1 p.p.
PDA -4.2% -3.4% 0.9 p.p.
PDA PAR 0.0% -1.3% -1.3 p.p.
PDA FIES -0.1% 0.0% 0.1 p.p.
Advertising -5.6% -7.4% -1.8 p.p.
G&A expenses -16.3% -13.0% 3.3 p.p.
Personnel -6.5% -6.2% 0.3 p.p.
Other -9.9% -6.8% 3.0 p.p.
Other operating revenue/expenses 0.4% 0.5% 0.1 p.p.
Main Impacts:
PDAImproved Performance
of non-PAR PDA
8
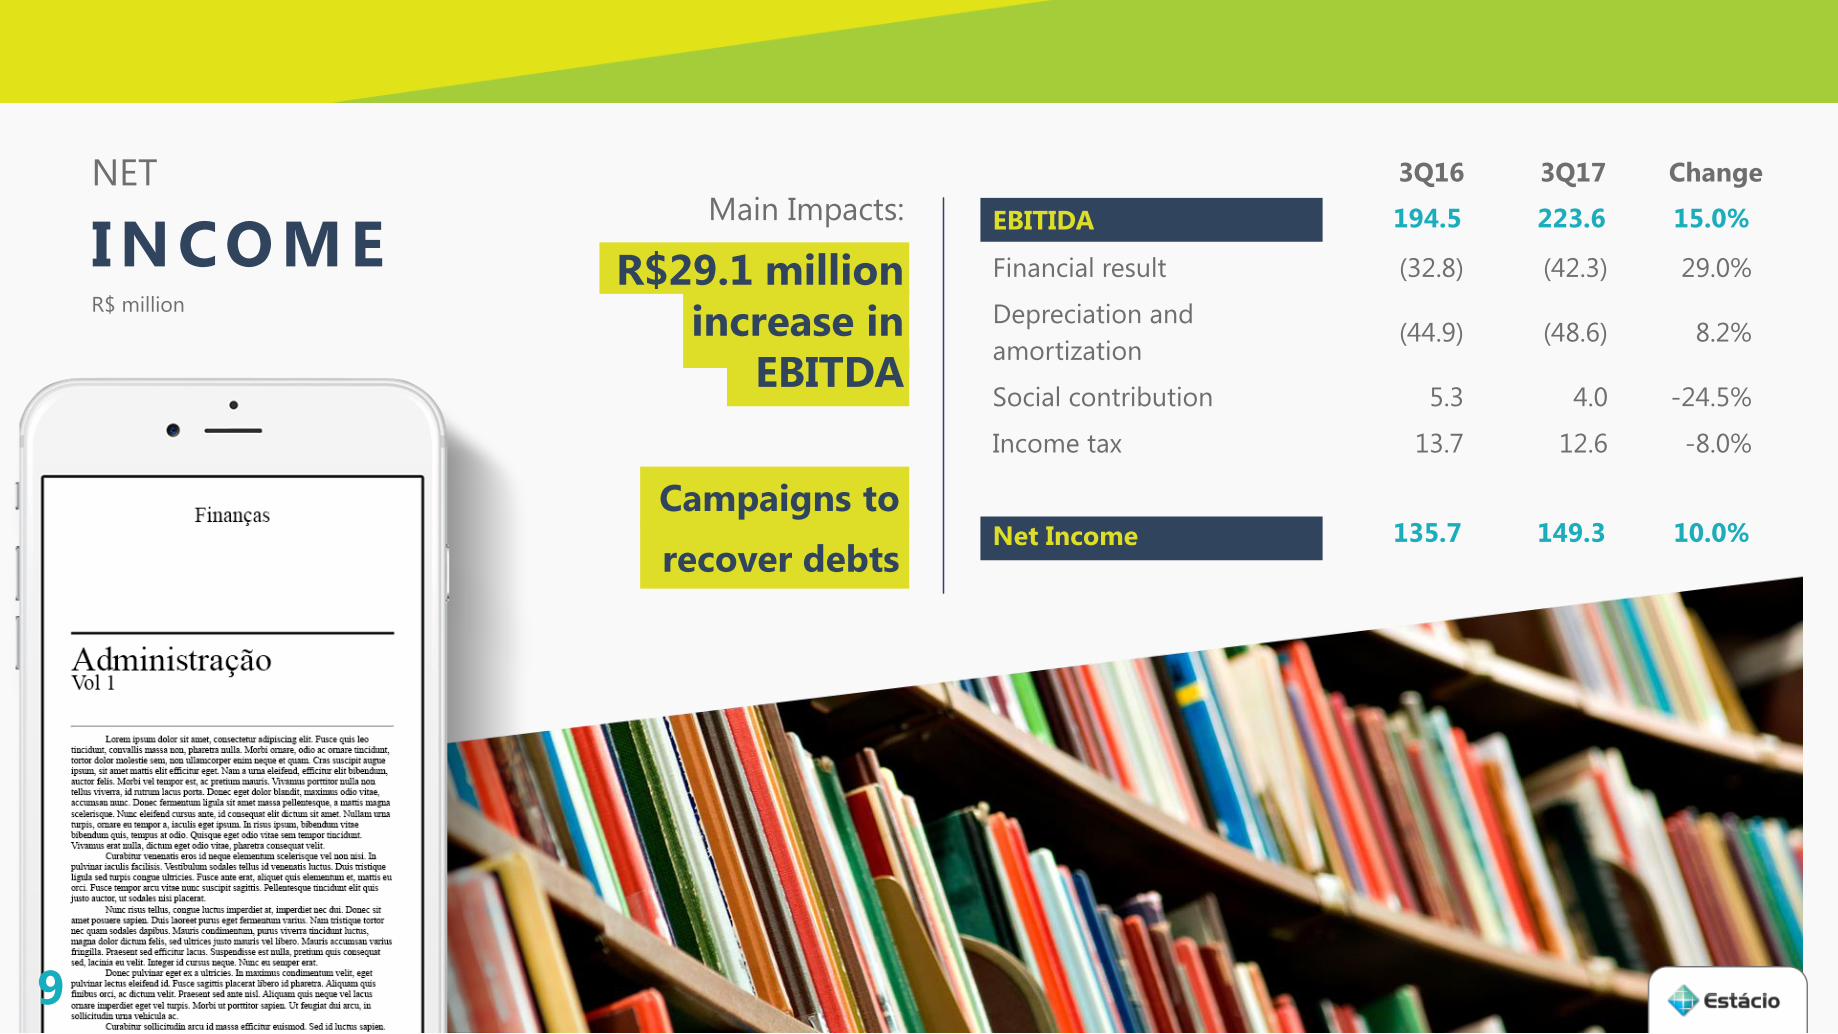
Campaigns to
recover debts
EBITIDA 194.5 223.6 15.0%
Financial result (32.8) (42.3) 29.0%
Depreciation and
amortization(44.9) (48.6) 8.2%
Social contribution 5.3 4.0 -24.5%
Income tax 13.7 12.6 -8.0%
Net Income 135.7 149.3 10.0%
INCOME
NET
R$ million
3Q16 3Q17 Change
9
Main Impacts:
R$29.1 million
increase in
EBITDA
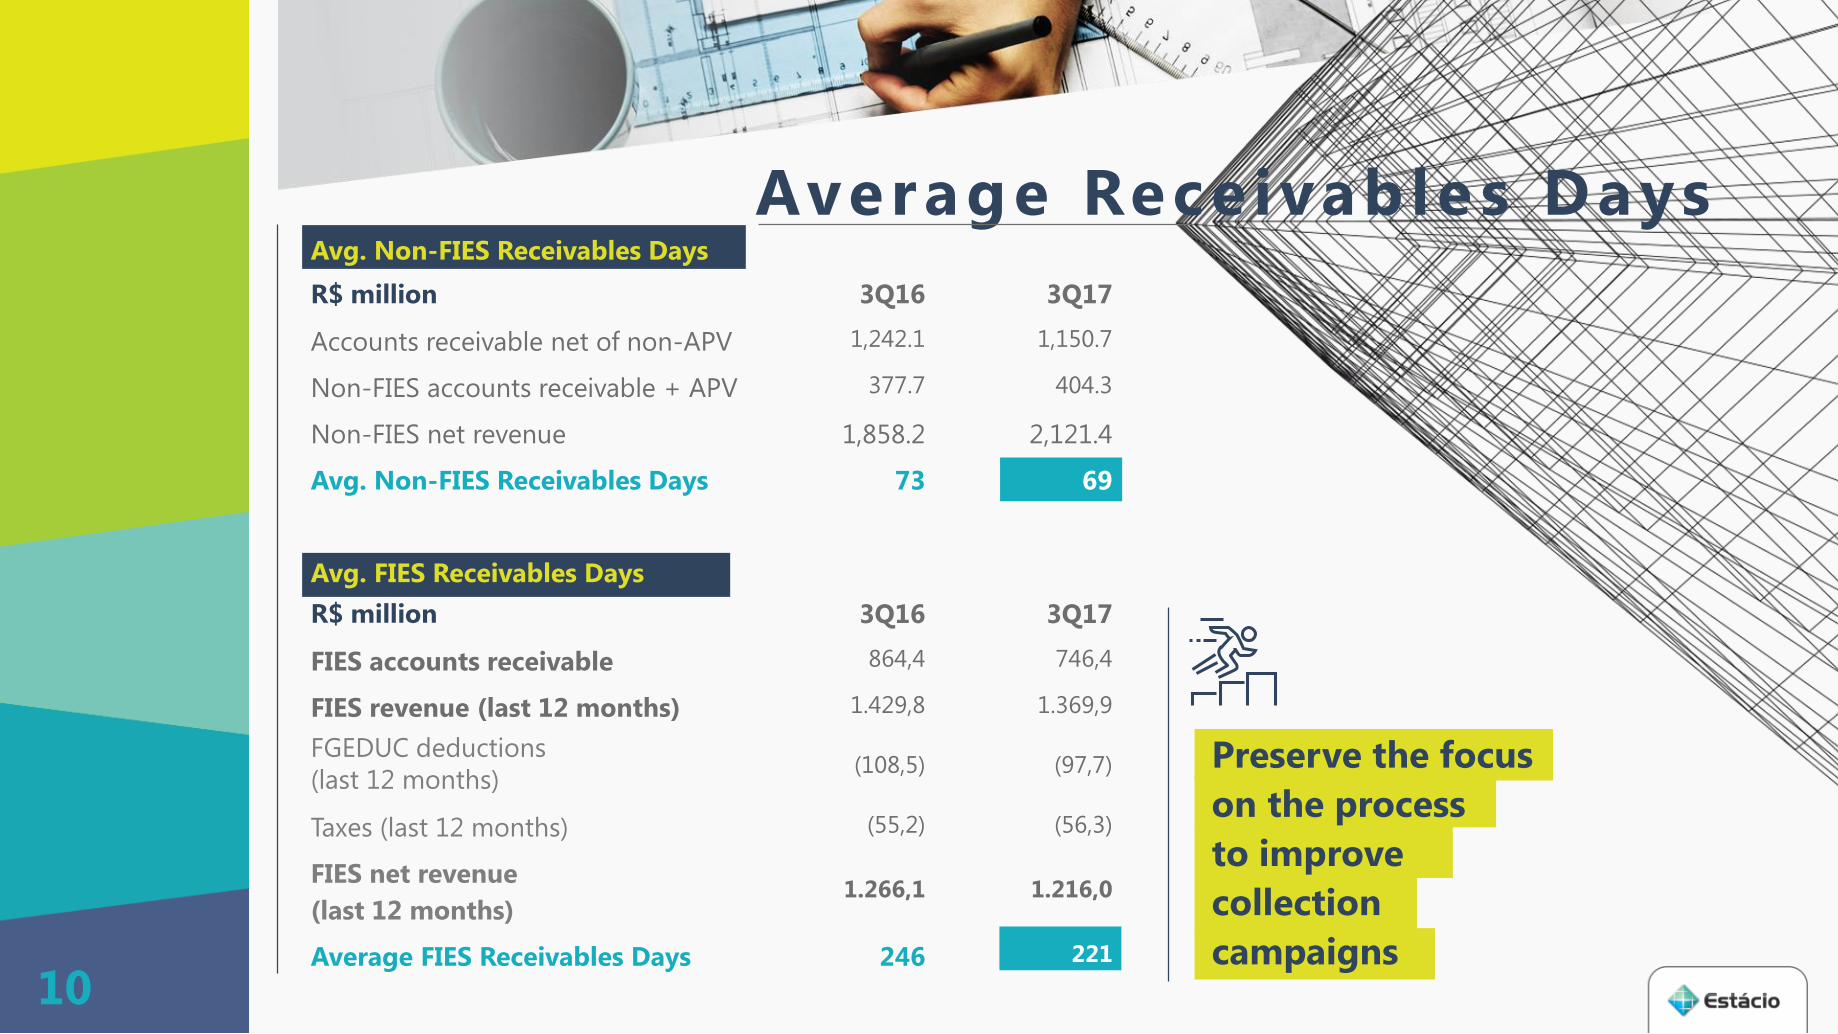
Average Rece ivable s Days
Preserve the focus
on the process
to improve
collection
campaigns10
Avg. Non-FIES Receivables Days
R$ million 3Q16 3Q17
Accounts receivable net of non-APV 1,242.1 1,150.7
Non-FIES accounts receivable + APV 377.7 404.3
Non-FIES net revenue 1,858.2 2,121.4
Avg. Non-FIES Receivables Days 73 69
Avg. FIES Receivables Days
R$ million 3Q16 3Q17
FIES accounts receivable 864,4 746,4
FIES revenue (last 12 months) 1.429,8 1.369,9
FGEDUC deductions
(last 12 months)(108,5) (97,7)
Taxes (last 12 months) (55,2) (56,3)
FIES net revenue
(last 12 months)1.266,1 1.216,0
Average FIES Receivables Days 246 221
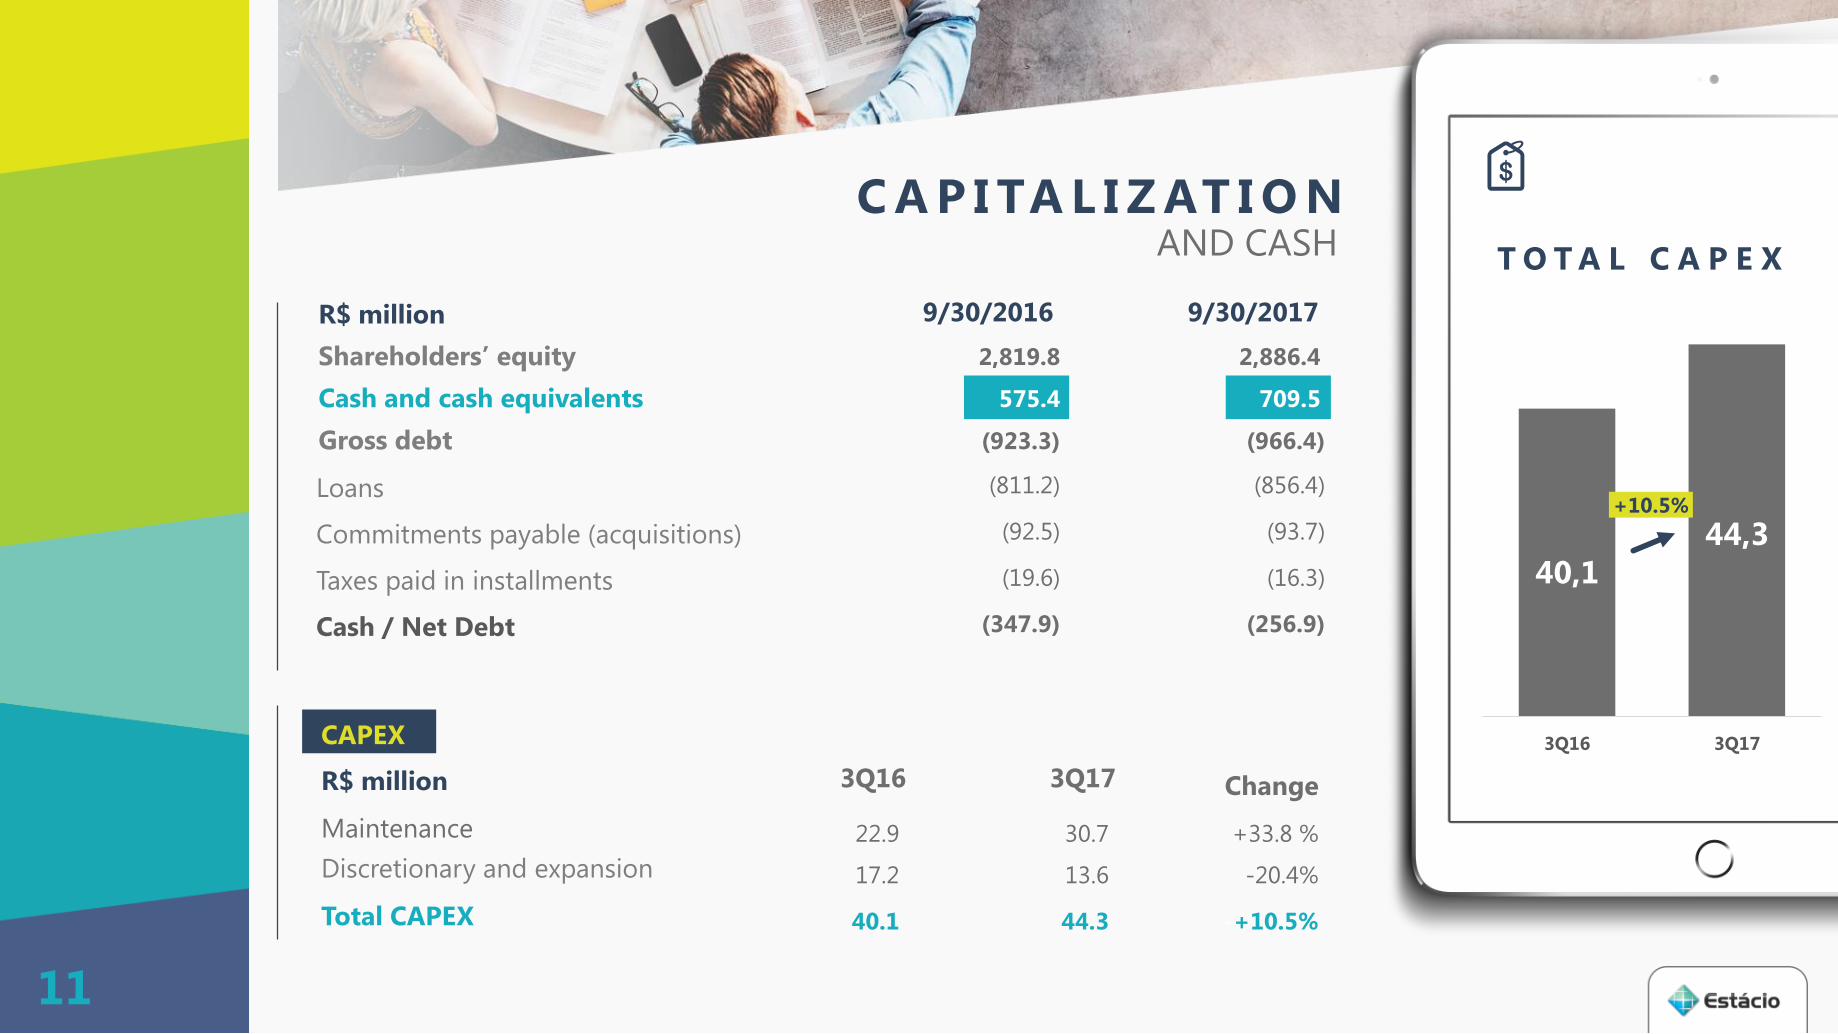
AND CASHC A P I TA L I Z AT I O N
40,1
44,3
3Q16 3Q17
T O T A L C A P E X
+10.5%
11
CAPEX
R$ million 3Q16 3Q17 Change
Maintenance 22.9 30.7 +33.8 %
Discretionary and expansion 17.2 13.6 -20.4%
Total CAPEX 40.1 44.3 -+10.5%
R$ million 9/30/2016 9/30/2017
Shareholders’ equity 2,819.8 2,886.4
Cash and cash equivalents 575.4 709.5
Gross debt (923.3) (966.4)
Loans (811.2) (856.4)
Commitments payable (acquisitions) (92.5) (93.7)
Taxes paid in installments (19.6) (16.3)
Cash / Net Debt (347.9) (256.9)

GAINSE F F I C I E N C Y
Plan for continued efficiency gains:
New Educational Model
Online tutoring program
Optimization of the course mix
Footprint reassessment
12

GROWTH
DRIVERS
100 new operationaldistance-learning centers
At a total of 338 operational distance-learning centers at the close of 3Q17
Medicine Course in Angra dos ReisThree new Medicine units by
March 2018
High SchoolBeginning of operations in seven units in the Rio de Janeiro State
13

DISCLAIMER
The content of this presentation may include expectations regarding
future events and results estimated by Management. However, such
forward-looking statements are not guarantee of future delivery and/or
performance, given the risks and uncertainties inherent to the business
environment, including the country’s economic performance, the global
economy, the capital market, regulatory aspects of the industry, and
governmental and competitive issues, among other factors, as well as the
risks presented in the disclosure documents filed by Estácio, which are
subject to change without prior notice.
14

Investor Relations
E-mail: [email protected]: (21) 3311-9700
www.estacioparticipacoes.com.br
Pedro ThompsonCEO and Investor Relations Officer
Flávia OliveiraInvestor Relations Manager
Julia GregolinInvestor Relations
15
Top Related