


Languages
Pages
Legal


3Comparative Advantage and the
Gains from Trade
International Economics
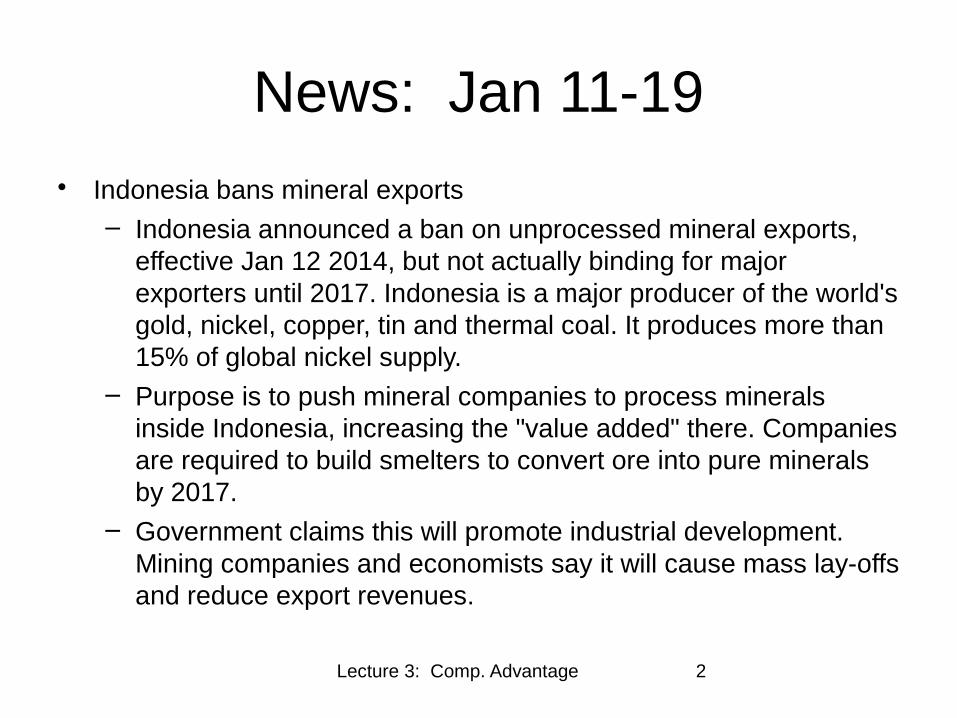
News: Jan 11-19
• Indonesia bans mineral exports – Indonesia announced a ban on unprocessed mineral exports,
effective Jan 12 2014, but not actually binding for major exporters until 2017. Indonesia is a major producer of the world's gold, nickel, copper, tin and thermal coal. It produces more than 15% of global nickel supply.
– Purpose is to push mineral companies to process minerals inside Indonesia, increasing the "value added" there. Companies are required to build smelters to convert ore into pure minerals by 2017.
– Government claims this will promote industrial development. Mining companies and economists say it will cause mass lay-offs and reduce export revenues.
Lecture 3: Comp. Advantage 2
Lecture 3: Comp. Advantage 3
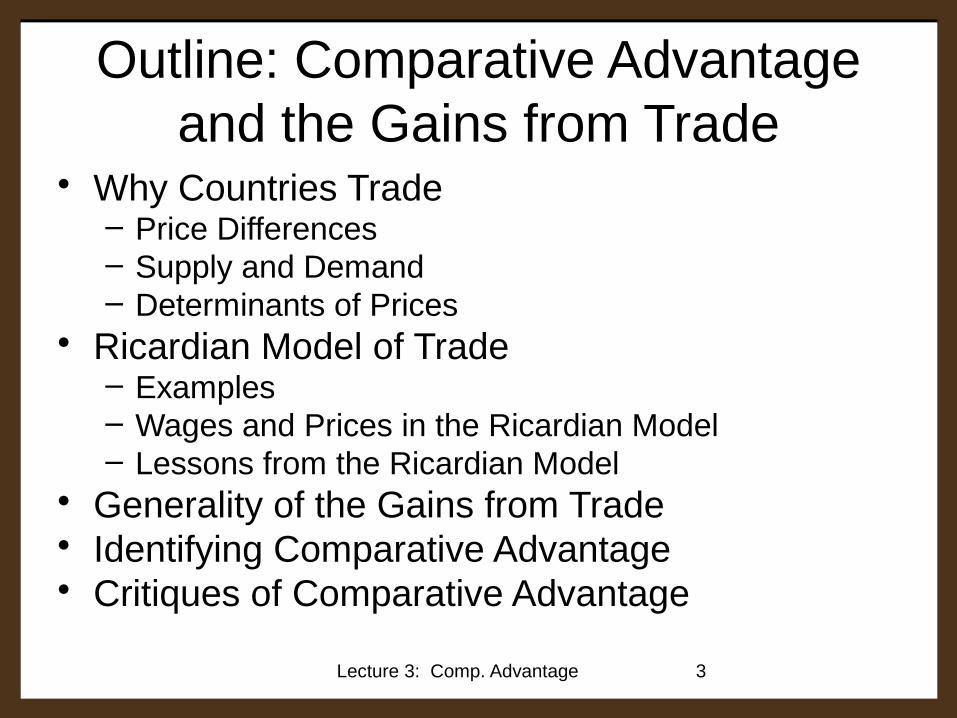
Outline: Comparative Advantage and the Gains from Trade
• Why Countries Trade– Price Differences– Supply and Demand– Determinants of Prices
• Ricardian Model of Trade– Examples– Wages and Prices in the Ricardian Model– Lessons from the Ricardian Model
• Generality of the Gains from Trade• Identifying Comparative Advantage• Critiques of Comparative Advantage
Lecture 3: Comp. Advantage 4
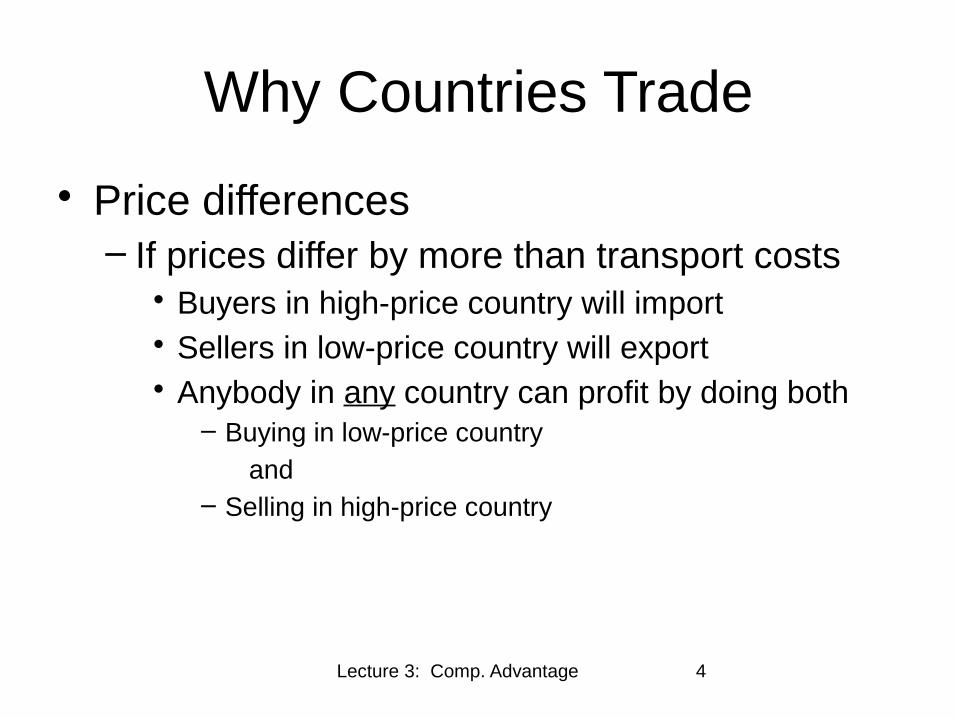
Why Countries Trade
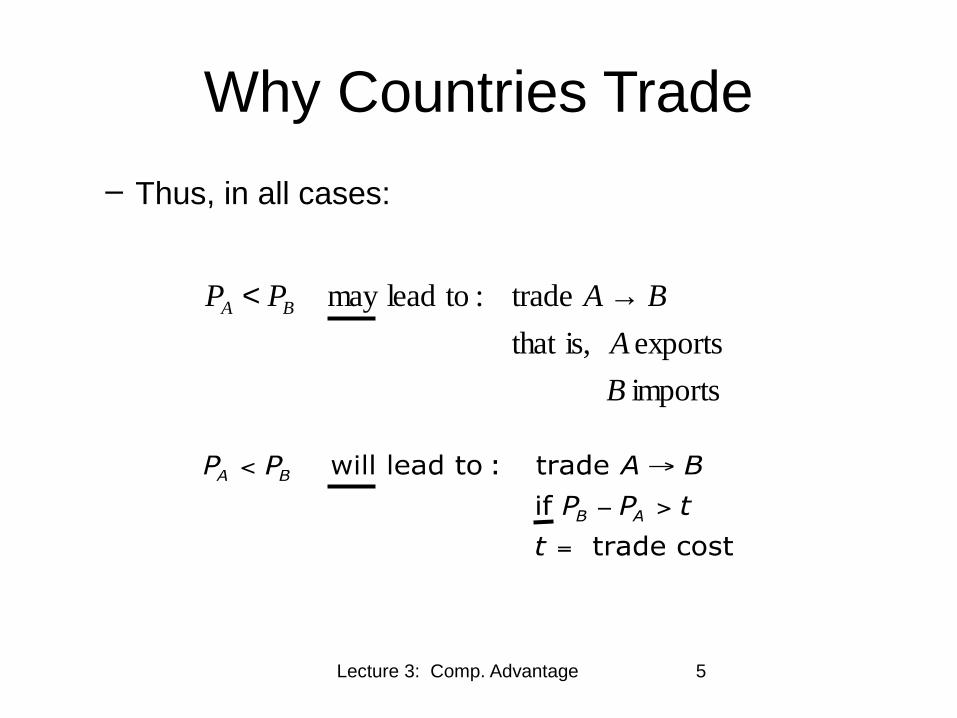
• Price differences– If prices differ by more than transport costs
• Buyers in high-price country will import• Sellers in low-price country will export• Anybody in any country can profit by doing both
– Buying in low-price country
and – Selling in high-price country
Lecture 3: Comp. Advantage 5
Why Countries Trade
– Thus, in all cases:
imports
exports is,that
trade: toleadmay
B
A
BAPP BA →<

Lecture 3: Comp. Advantage 6
Why Countries Trade: Supply and Demand
Country BP
Q
Country AP
Q
DA
DB
SB
SA
PA
PB
“Autarky” = No trade
Autarky price in country A
Autarky price in country B
PB
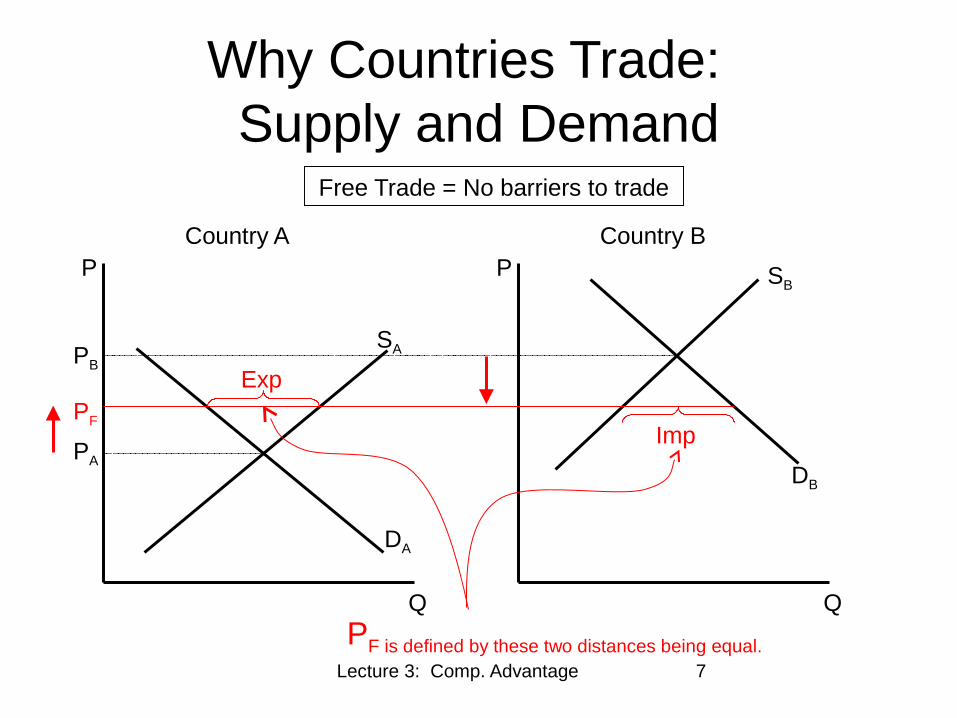
Lecture 3: Comp. Advantage 7
Country BP
Q
Country AP
Q
DA
DB
SB
SA
PA
PB
PF
Exp
Imp
Why Countries Trade: Supply and Demand
Free Trade = No barriers to trade
PF is defined by these two distances being equal.
Lecture 3: Comp. Advantage 8
Country BP
Q
Country AP
Q
DA
DB
SB
SA
PA
PB
PF
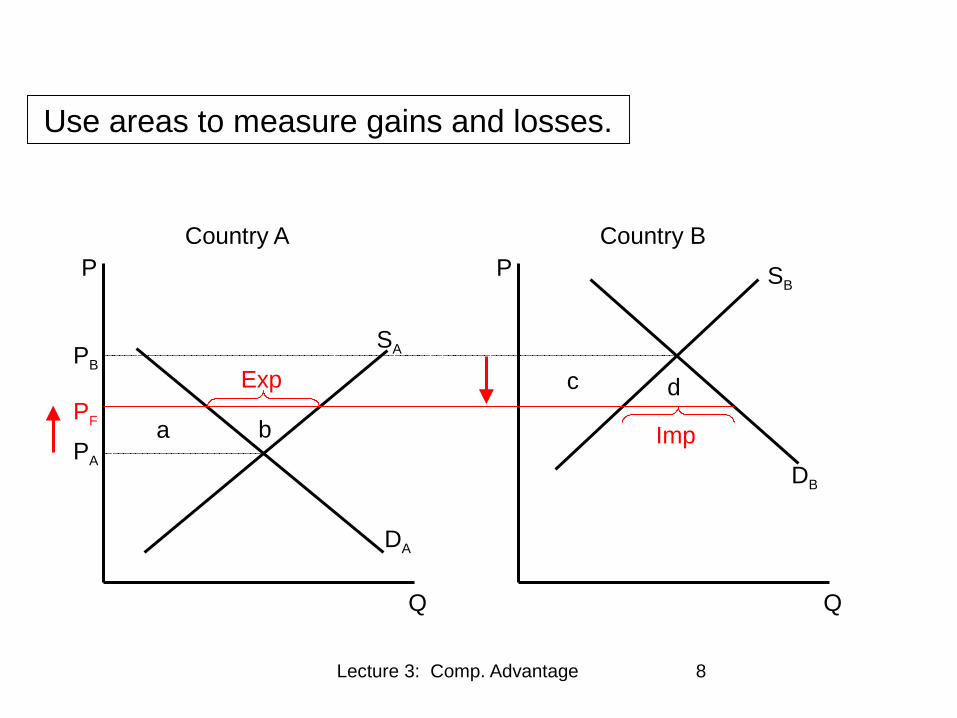
Exp
Impa
c
b
d
Use areas to measure gains and losses.
Lecture 3: Comp. Advantage 9
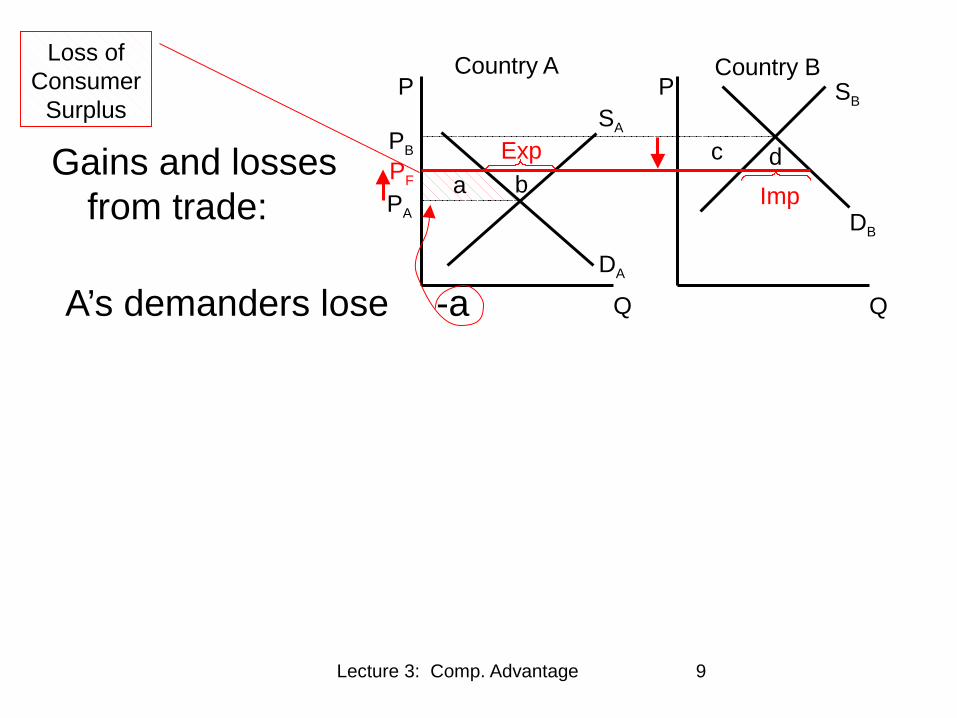
A’s demanders lose -a
Gains and losses from trade:
Country BP
Q
Country AP
Q
DA
DB
SB
SA
PA
PB
PF
Exp
Impa
cb
d
Loss of Consumer
Surplus
Lecture 3: Comp. Advantage 10
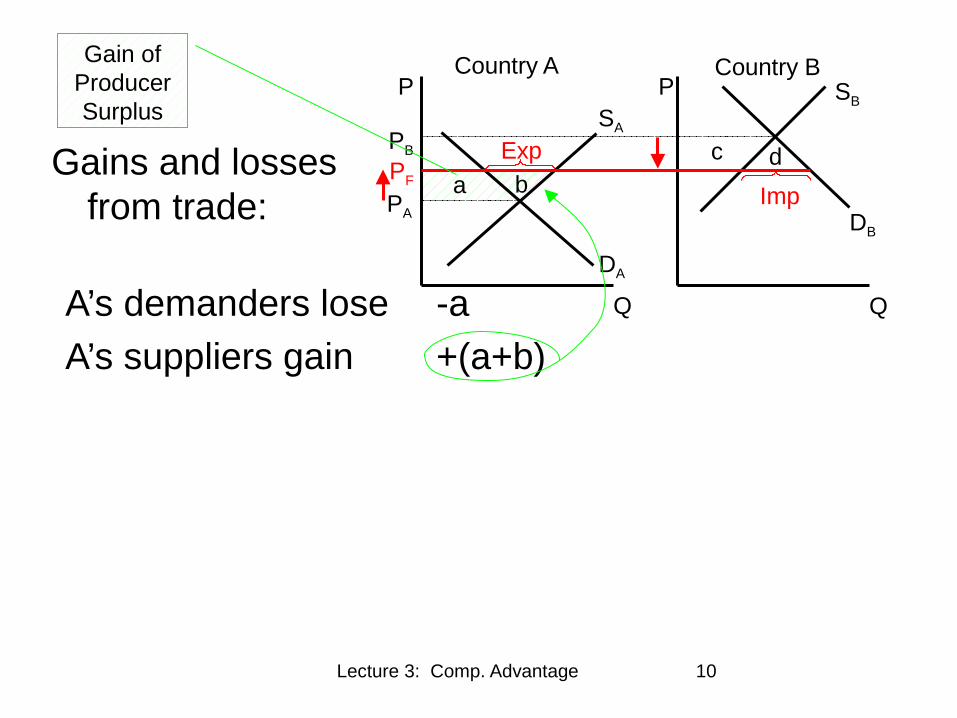
A’s demanders lose -a
A’s suppliers gain +(a+b)
Gains and losses from trade:
Country BP
Q
Country AP
Q
DA
DB
SB
SA
PA
PB
PF
Exp
Impa
cb
d
Gain of Producer Surplus
Lecture 3: Comp. Advantage 11
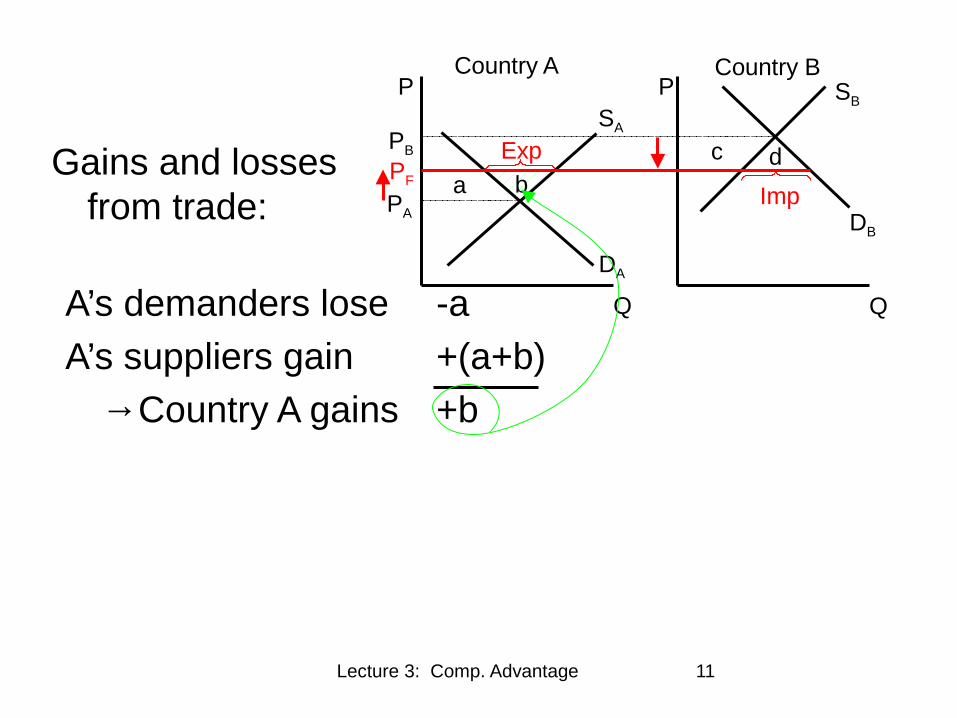
A’s demanders lose -a
A’s suppliers gain +(a+b)
→Country A gains +b
Gains and losses from trade:
Country BP
Q
Country AP
Q
DA
DB
SB
SA
PA
PB
PF
Exp
Impa
cb
d
Lecture 3: Comp. Advantage 12
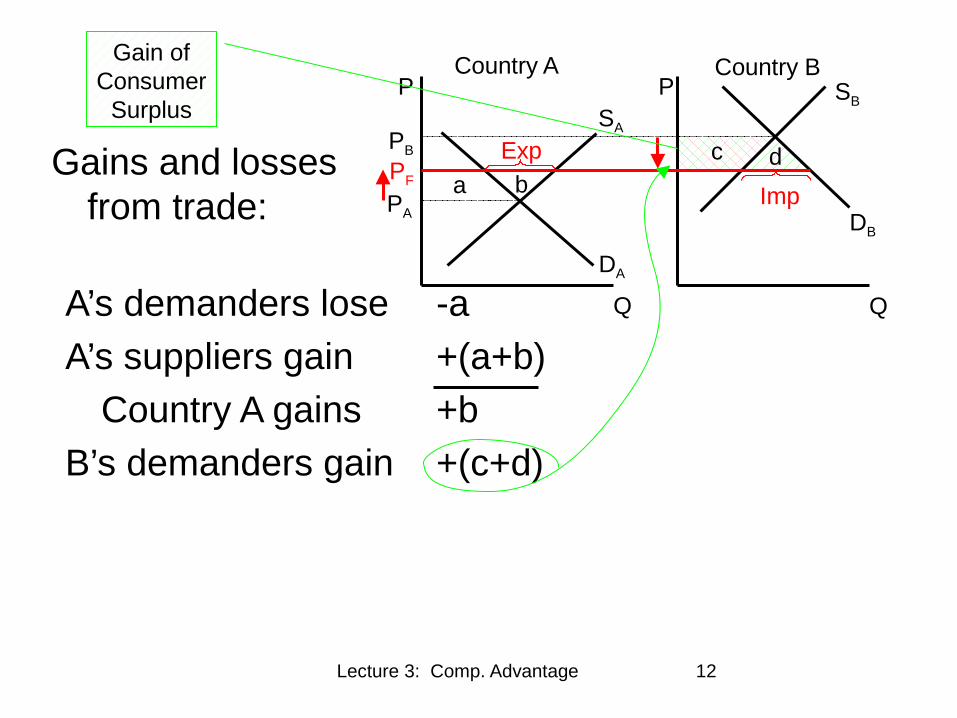
A’s demanders lose -a
A’s suppliers gain +(a+b)
Country A gains +b
B’s demanders gain +(c+d)
Gains and losses from trade:
Country BP
Q
Country AP
Q
DA
DB
SB
SA
PA
PB
PF
Exp
Impa
cb
d
Gain of Consumer
Surplus
Lecture 3: Comp. Advantage 13
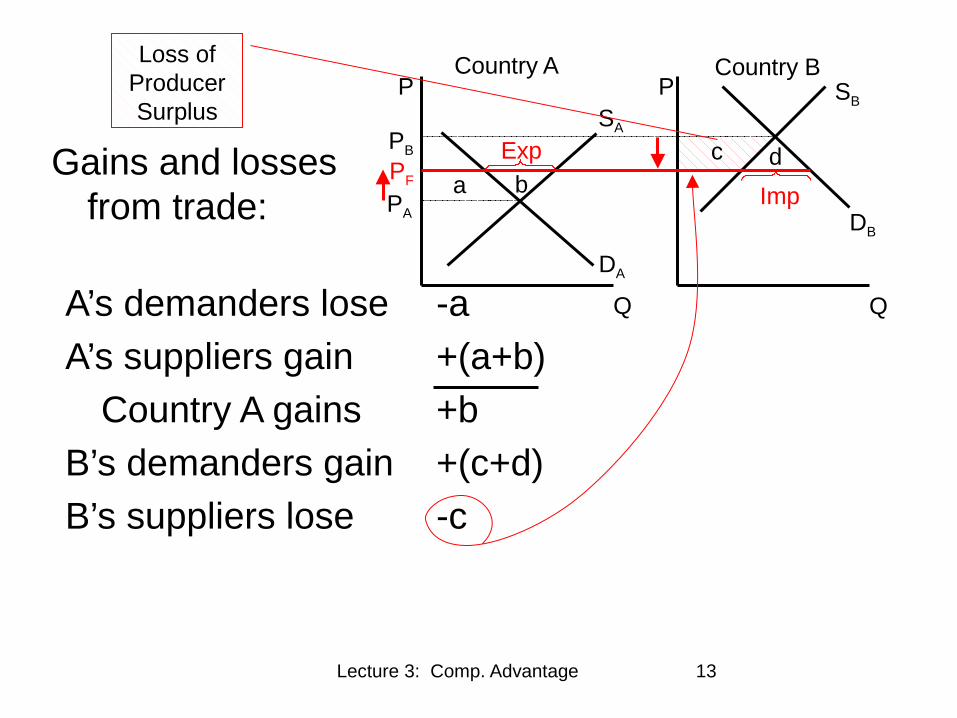
A’s demanders lose -a
A’s suppliers gain +(a+b)
Country A gains +b
B’s demanders gain +(c+d)
B’s suppliers lose -c
Gains and losses from trade:
Country BP
Q
Country AP
Q
DA
DB
SB
SA
PA
PB
PF
Exp
Impa
cb
d
Loss of Producer Surplus
Lecture 3: Comp. Advantage 14
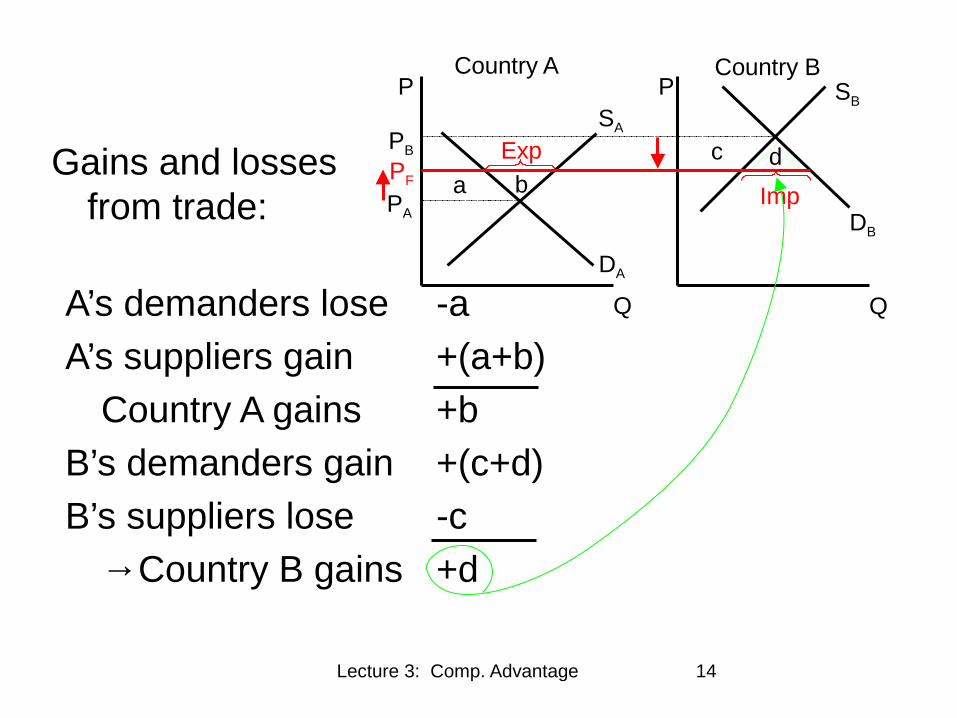
A’s demanders lose -a
A’s suppliers gain +(a+b)
Country A gains +b
B’s demanders gain +(c+d)
B’s suppliers lose -c
→Country B gains +d
Gains and losses from trade:
Country BP
Q
Country AP
Q
DA
DB
SB
SA
PA
PB
PF
Exp
Impa
cb
d

Lecture 3: Comp. Advantage 15
A’s demanders lose -a
A’s suppliers gain +(a+b)
Country A gains +b
B’s demanders gain +(c+d)
B’s suppliers lose -c
Country B gains +d
→ World gains +(b+d)
Gains and losses from trade:
Country BP
Q
Country AP
Q
DA
DB
SB
SA
PA
PB
PF
Exp
Imp
cb
d
Lecture 3: Comp. Advantage 16
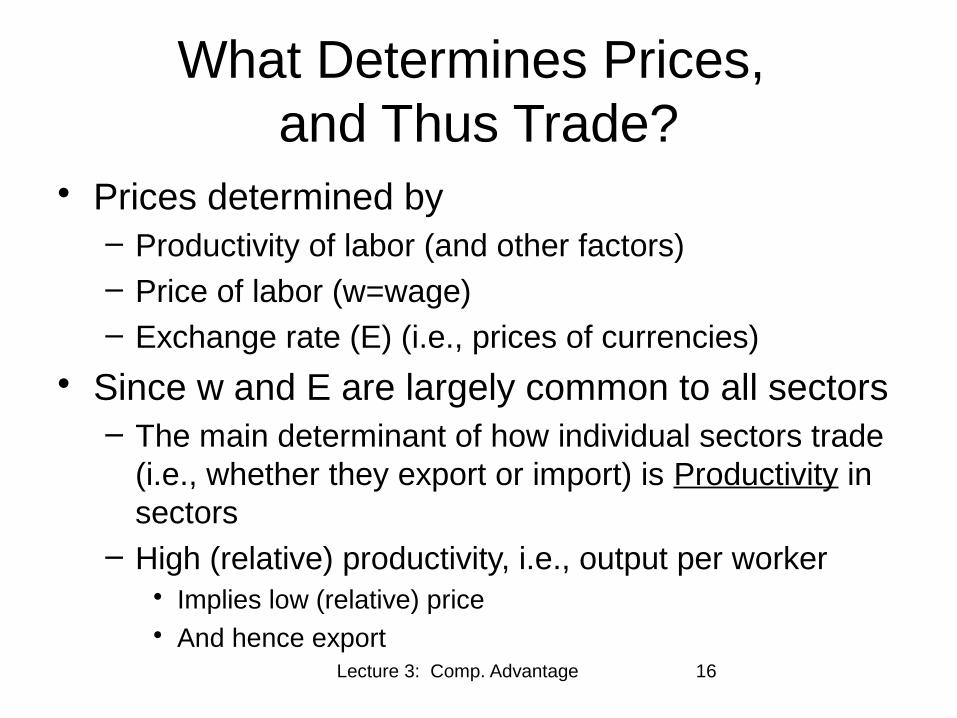
What Determines Prices, and Thus Trade?
• Prices determined by– Productivity of labor (and other factors)– Price of labor (w=wage)– Exchange rate (E) (i.e., prices of currencies)
• Since w and E are largely common to all sectors– The main determinant of how individual sectors trade
(i.e., whether they export or import) is Productivity in sectors
– High (relative) productivity, i.e., output per worker• Implies low (relative) price• And hence export

Lecture 3: Comp. Advantage 17
Adjustment Mechanism
• What if all of a country’s prices are too high for it to export at all?
Then either:– Exchange rate (value of currency) will fall
• Because otherwise nobody would buy its currency,
Or:– Wages will fall
• Because nobody would hire its labor
Either of these will lower the country’s prices

Lecture 3: Comp. Advantage 18
Outline: Comparative Advantage and the Gains from Trade
• Why Countries Trade– Price Differences– Supply and Demand– Determinants of Prices
• Ricardian Model of Trade– Examples– Wages and Prices in the Ricardian Model– Lessons from the Ricardian Model
• Generality of the Gains from Trade• Identifying Comparative Advantage• Critiques of Comparative Advantage

Lecture 3: Comp. Advantage 19
Ricardian Model of Trade
• Due to David Ricardo (1772-1823)
Assumptions:• Production uses only labor• Technology:
– Constant unit labor requirements
(labor per unit of output)– Or equivalently, constant labor productivities
(output per unit of labor)
(“constant” here means “doesn’t vary with output”)
Lecture 3: Comp. Advantage 20
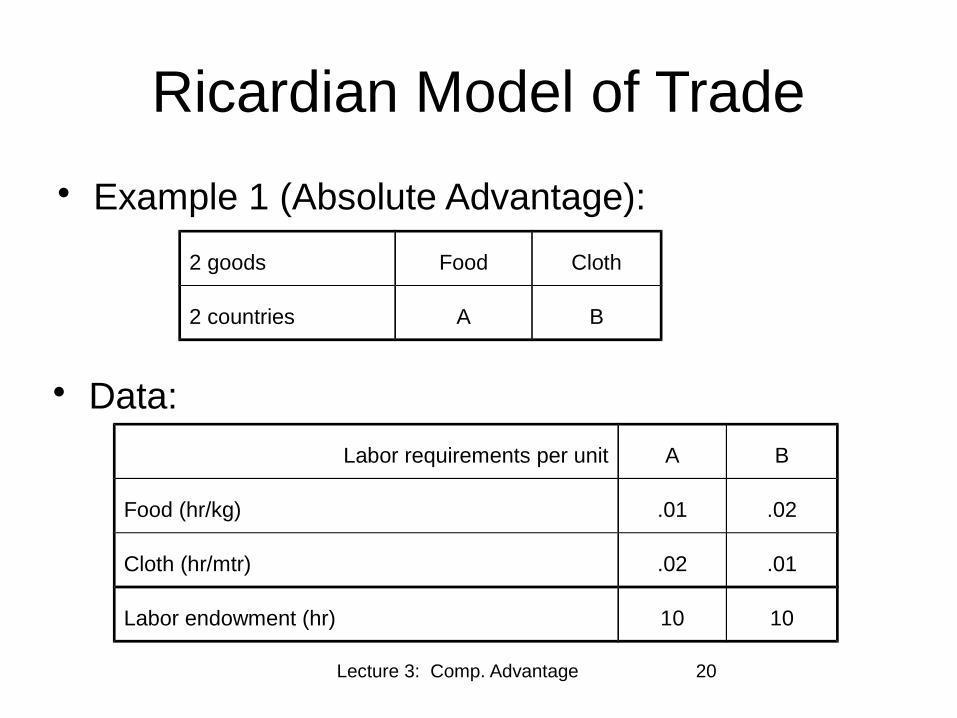
Ricardian Model of Trade
• Example 1 (Absolute Advantage):
2 goods Food Cloth
2 countries A B
• Data:
Labor requirements per unit A B
Food (hr/kg) .01 .02
Cloth (hr/mtr) .02 .01
Labor endowment (hr) 10 10
Lecture 3: Comp. Advantage 21
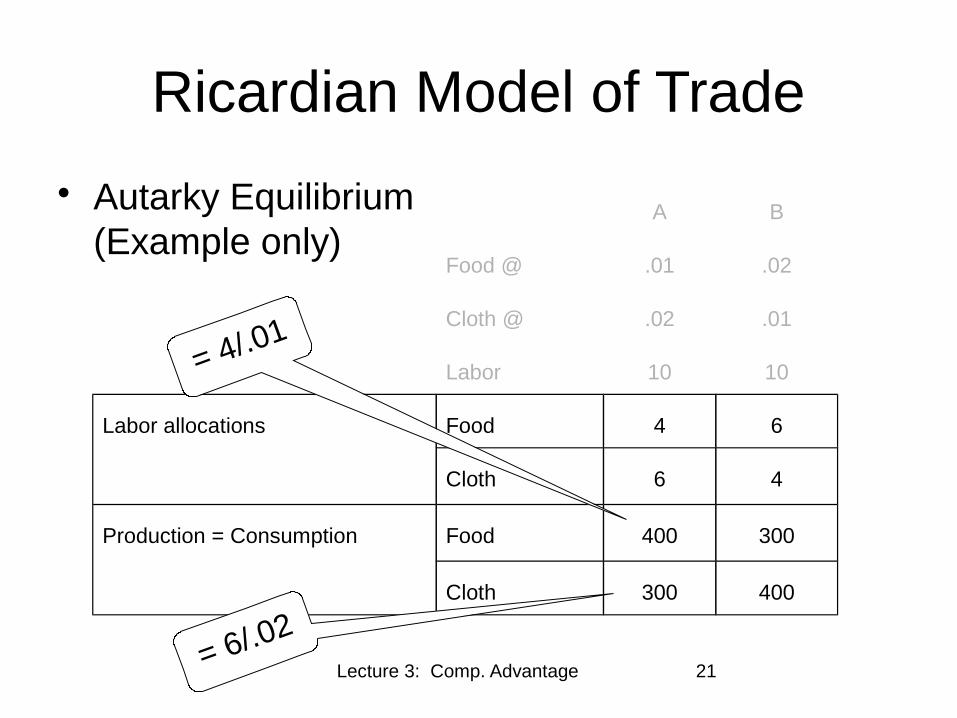
Ricardian Model of Trade
• Autarky Equilibrium (Example only)
A B
Food @ .01 .02
Cloth @ .02 .01
Labor 10 10
Labor allocations Food 4 6
Cloth 6 4
Production = Consumption Food 400 300
Cloth 300 400
= 4/.01
= 6/.02
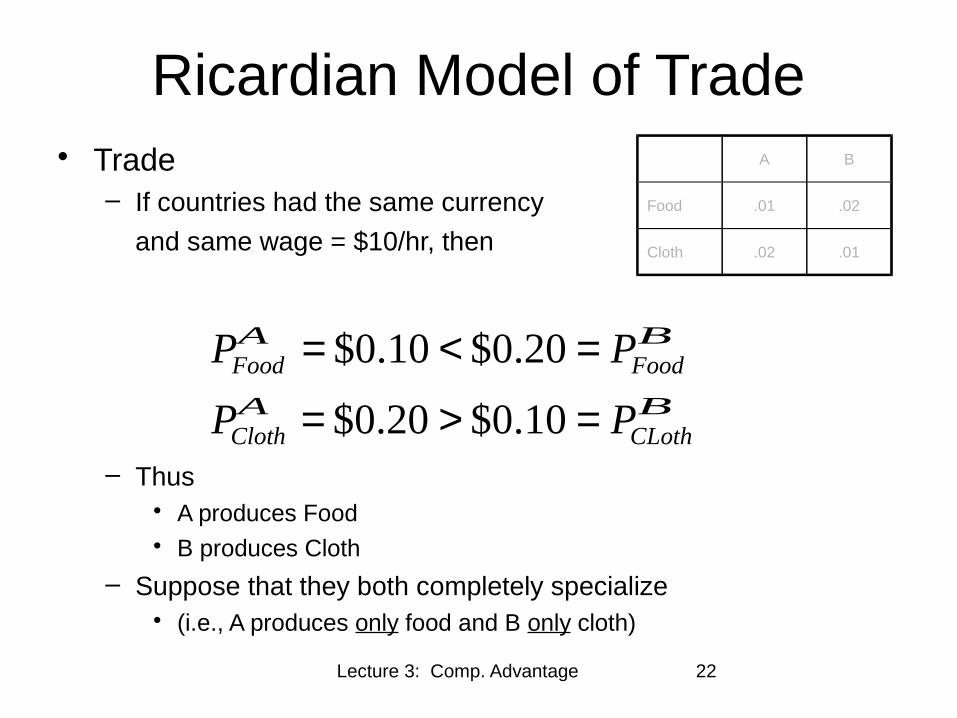
Lecture 3: Comp. Advantage 22
Ricardian Model of Trade• Trade
– If countries had the same currency
and same wage = $10/hr, then
– Thus• A produces Food• B produces Cloth
– Suppose that they both completely specialize • (i.e., A produces only food and B only cloth)
A B
Food .01 .02
Cloth .02 .01
BCLoth
ACloth
BFood
AFood
PP
PP
=>=
=<=
10.0$20.0$
20.0$10.0$
Lecture 3: Comp. Advantage 23
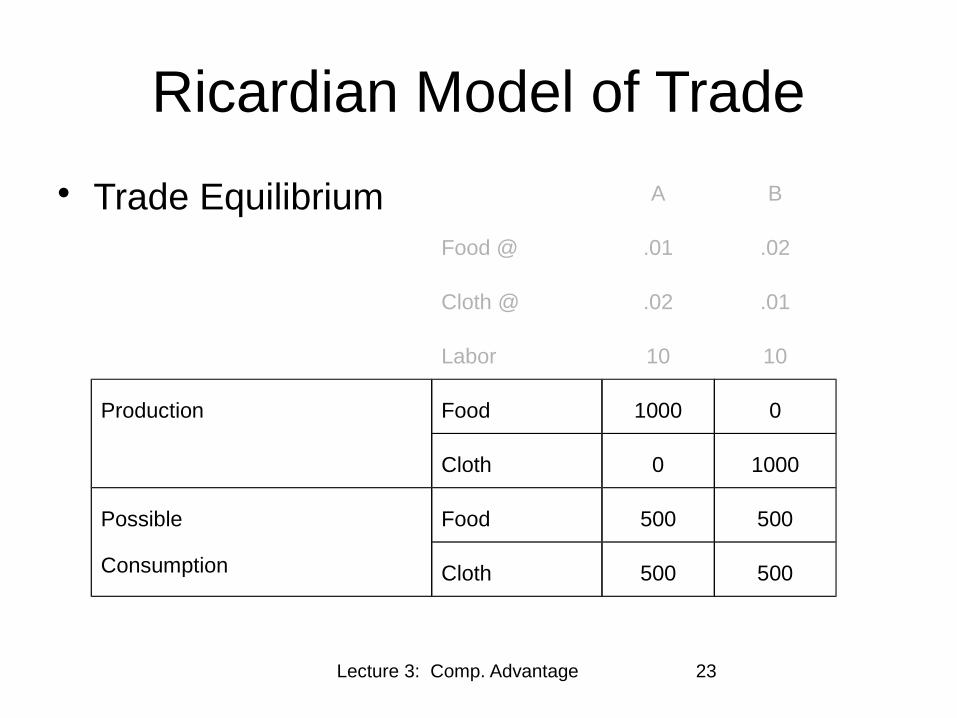
Ricardian Model of Trade
• Trade Equilibrium A B
Food @ .01 .02
Cloth @ .02 .01
Labor 10 10
Production Food 1000 0
Cloth 0 1000
Possible
Consumption
Food 500 500
Cloth 500 500
Lecture 3: Comp. Advantage 24
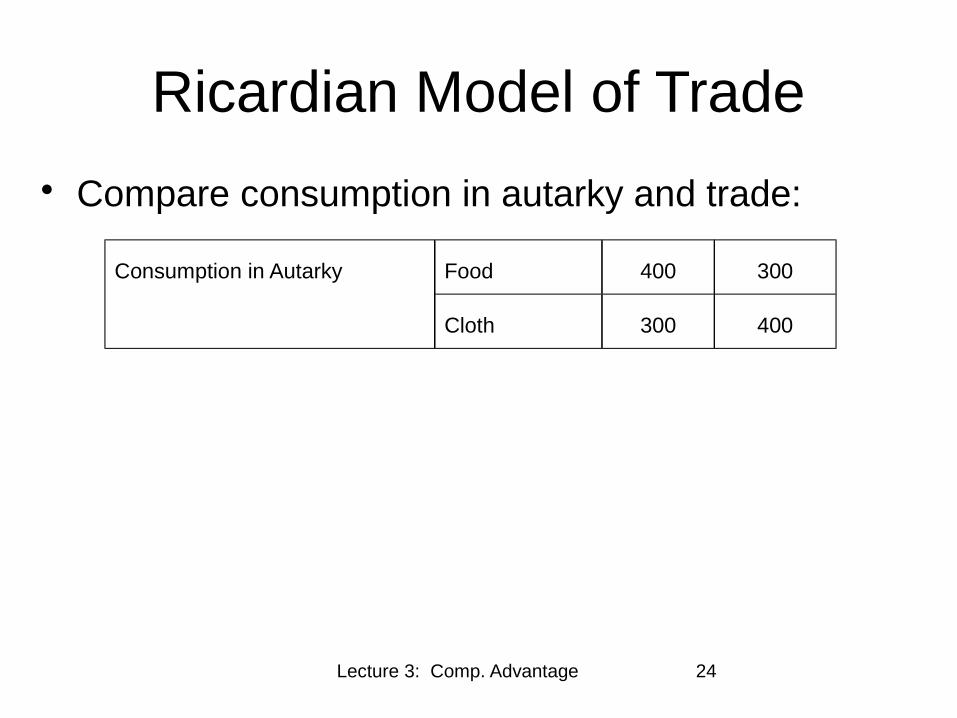
Ricardian Model of Trade
• Compare consumption in autarky and trade:
Consumption in Autarky Food 400 300
Cloth 300 400

Lecture 3: Comp. Advantage 25
Ricardian Model of Trade
• Compare consumption in autarky and trade:
• Trade permits consumption to be higher, of both goods, in both countries!
• Both countries gain from trade
Consumption in Autarky Food 400 300
Cloth 300 400
Consumption with Free Trade Food 500 500
Cloth 500 500

Lecture 3: Comp. Advantage 26
Ricardian Model of Trade
• This example had “absolute” advantage; that is– A used less labor to produce food than B– B used less labor to produce cloth than A
• But results don’t depend on that• Change the example
– B'• Assume B’ needs ten times as much labor to do anything• And also has ten times as much labor
A B
Food .01 .02
Cloth .02 .01

Lecture 3: Comp. Advantage 27
Ricardian Model of Trade
• Example 2 (Comparative Advantage):
• Data:Labor requirements A B′
Food (hr/lb) .01 .20
Cloth (hr/yd) .02 .10
Labor endowment (workers) 10 100
Now A has absolute advantage in both goods (i.e., it needs a lot less labor)

Lecture 3: Comp. Advantage 28
Ricardian Model of Trade
• Does this matter for production, consumption, or trade? NO!– In autarky, B could produce 300 food and 400
cloth, by allocating 6 workers to food and 4 to cloth.
– So can B′: by allocating 60 workers to food and 40 to cloth.
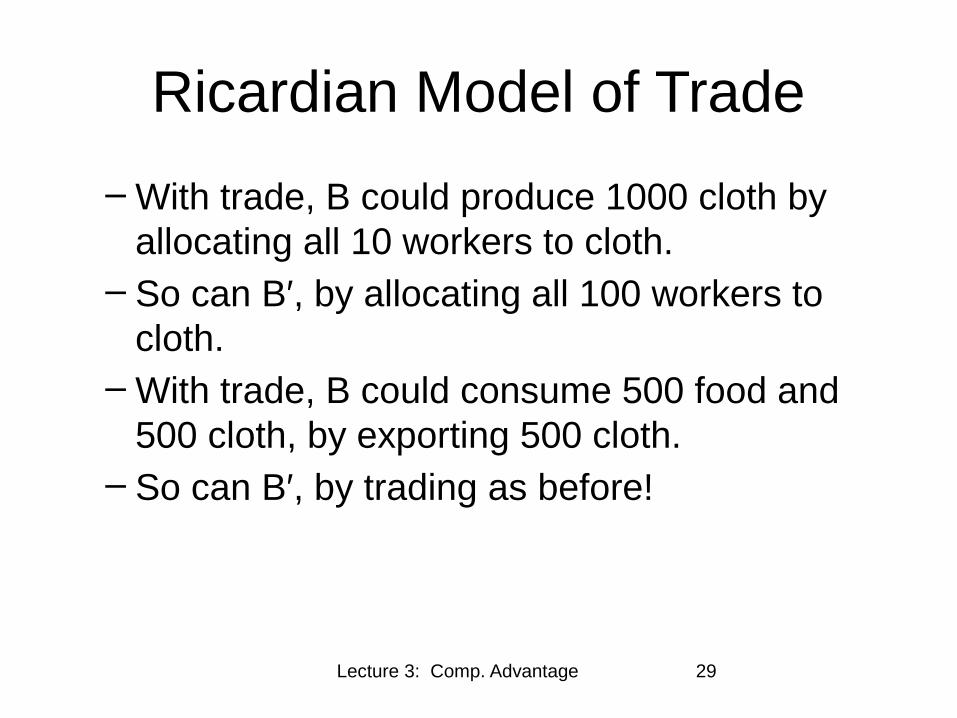
Lecture 3: Comp. Advantage 29
Ricardian Model of Trade
– With trade, B could produce 1000 cloth by allocating all 10 workers to cloth.
– So can B′, by allocating all 100 workers to cloth.
– With trade, B could consume 500 food and 500 cloth, by exporting 500 cloth.
– So can B′, by trading as before!

Lecture 3: Comp. Advantage 30
Ricardian Model of Trade• How does this happen? Through prices and wages• Suppose initial wage is $10 in both A and B′.• Then prices are:
Prices A B′
Food $.10 $2.00
Cloth $.20 $1.00
• DISEQUILIBRIUM!– Nobody would buy from B′– No labor demand in B′– Wage in B′ must fall
• How far?– At least to $2.00
– (so PC = $.20)– At most to $0.50
– (so PF = $.10)
Lecture 3: Comp. Advantage 31
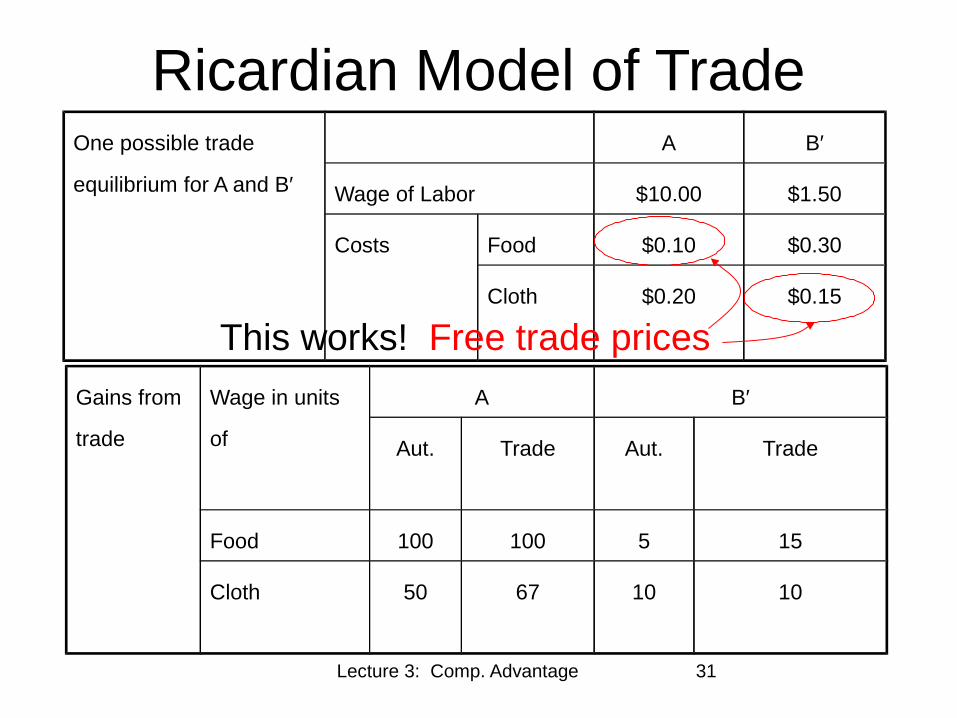
Ricardian Model of TradeOne possible trade
equilibrium for A and B′
A B′
Wage of Labor $10.00 $1.50
Costs Food $0.10 $0.30
Cloth $0.20 $0.15
This works! Free trade prices
Gains from
trade
Wage in units
of
A B′
Aut. Trade Aut. Trade
Food 100 100 5 15
Cloth 50 67 10 10

Lecture 3: Comp. Advantage 32
Ricardian Model of Trade
• Implications for Fears of Trade– Low productivity country (B′) can still
compete, because of its low wage– High wage country (A) can still compete
because of its high productivity
Lecture 3: Comp. Advantage 33
Outline: Comparative Advantage and the Gains from Trade
• Why Countries Trade– Price Differences– Supply and Demand– Determinants of Prices
• Ricardian Model of Trade– Examples– Wages and Prices in the Ricardian Model– Lessons from the Ricardian Model
• Generality of the Gains from Trade• Identifying Comparative Advantage• Critiques of Comparative Advantage

Lecture 3: Comp. Advantage 34
Gain from Trade in General
• This is a very simple model• But it does generalize to less restrictive
assumptions (trust me!)– Many goods (not just 2)– Many countries (not just 2)– Many other assumptions can also be relaxed

Lecture 3: Comp. Advantage 35
Gain from Trade in General
• Sources of gain from trade– Most sources of gain are analogous to how
individuals gain from trade– Comparative advantage focuses on
• Differences in ability to produce goods
– Other sources of gain, not in this model• Differences in tastes• Economies of scale
Lecture 3: Comp. Advantage 36
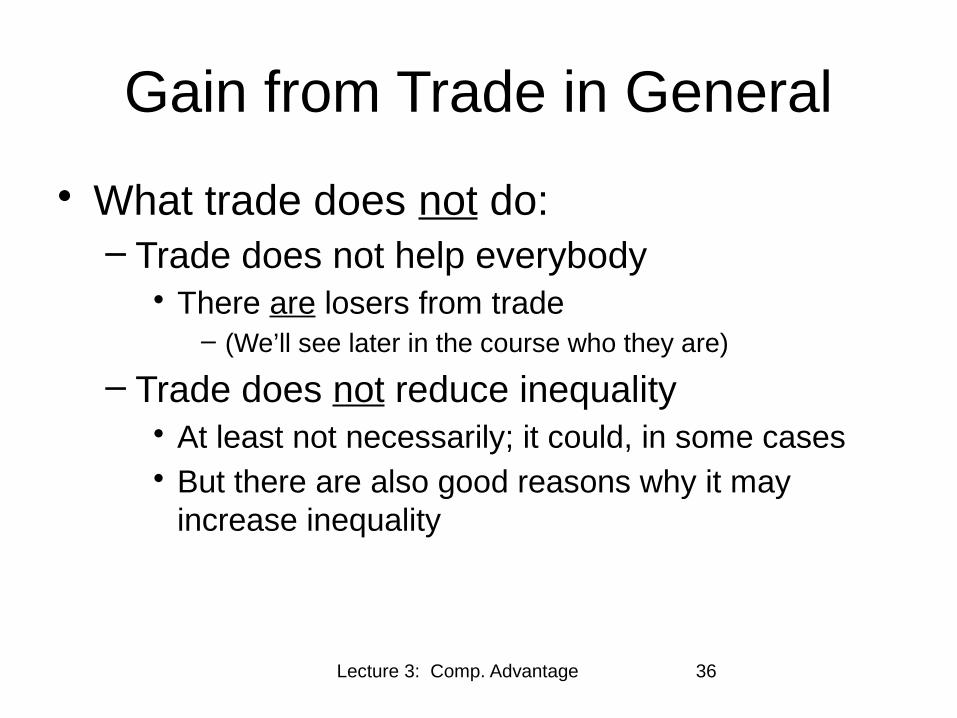
Gain from Trade in General
• What trade does not do:– Trade does not help everybody
• There are losers from trade– (We’ll see later in the course who they are)
– Trade does not reduce inequality • At least not necessarily; it could, in some cases• But there are also good reasons why it may
increase inequality

Lecture 3: Comp. Advantage 37
Gain from Trade in General
• What trade does not do:– Trade may not cause countries to grow faster
(There is debate on that)– Trade certainly does not fix all problems
• Weak or corrupt government• Failure to save• Poor technology
(Look at B′. It gains from trade, but it is still very poor.)

Lecture 3: Comp. Advantage 38
Gain from Trade in General
• Implications for Trade Policies• Autarky is not realistic, but “protection” (i.e.,
tariffs, quotas, etc.) is very realistic• Result that there is gain from trade does extend
to reducing protection– There are exceptions – we’ll see later– But in most cases, countries (as a whole) do gain
from reducing their tariffs• Even if other countries do not reduce tariffs
– Countries also gain when other countries liberalize
Lecture 3: Comp. Advantage 39
Outline: Comparative Advantage and the Gains from Trade
• Why Countries Trade– Price Differences– Supply and Demand– Determinants of Prices
• Ricardian Model of Trade– Examples– Wages and Prices in the Ricardian Model– Lessons from the Ricardian Model
• Generality of the Gains from Trade• Identifying Comparative Advantage• Critiques of Comparative Advantage

Lecture 3: Comp. Advantage 40
Identifying Comparative Advantage
• Definition: A country has a comparative advantage in a good, relative to another good and another country, if its relative cost of producing the good is lower than the other country’s
(This comparison should be done in autarky, i.e., when they do not trade, because costs may change as a result of trade)

Lecture 3: Comp. Advantage 41
Identifying Comparative Advantage
• If Cgc is the cost of producing 1 unit of good g in country c, then country 1 has a
C-A in good 1 (compared to good 2 and country 2) if
Country 2’s C-A
Country 1’s C-A 22
12
21
11
C
C
C
C <
Lecture 3: Comp. Advantage 42
Identifying Comparative Advantage
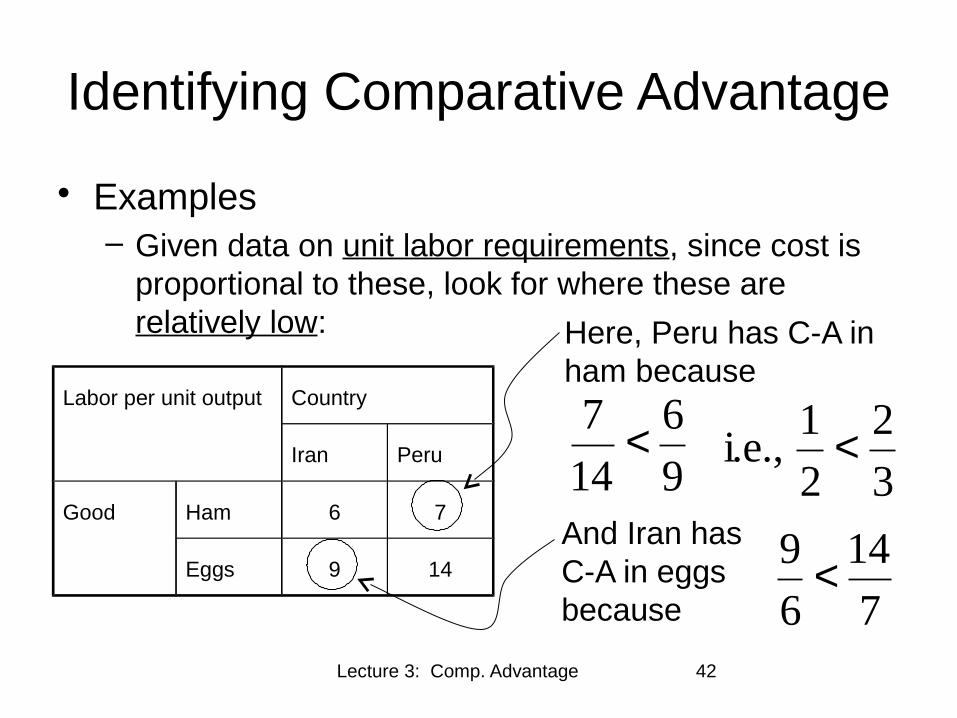
• Examples– Given data on unit labor requirements, since cost is
proportional to these, look for where these are relatively low:
Labor per unit output Country
Iran Peru
Good Ham 6 7
Eggs 9 14
Here, Peru has C-A in ham because
And Iran has C-A in eggs because
9
6
14
7 <3
2
2
1 i.e., <
7
14
6
9 <

Lecture 3: Comp. Advantage 43
Identifying Comparative Advantage
• In this example, you could also compare across countries: – Although Peru’s labor requirement is higher than
Iran’s in both goods, – it is only 1/6 higher in Ham and it is 5/9 (>1/6) higher
in Eggs
Labor per unit output Country
Iran Peru
Good Ham 6 7
Eggs 9 14
7
6< 14
9

Lecture 3: Comp. Advantage 44
Identifying Comparative Advantage
• Examples in a different form:– Given data on labor productivities (outputs per
worker), since cost is inversely proportional to these, look for where these are relatively high:
Output per unit labor Country
Blog Slog
Good Rugs 400 200
Drugs 8 5
Here, Blog has C-A in rugs because
5
200
8
400 >
Lecture 3: Comp. Advantage 45
Is the Theory of Comparative Advantage Correct?
• It’s not easy to test, for reasons explained in Dizikes article– Model says countries don’t produce at all
where they have no comparative advantage; so how can you measure productivity there?
– Economists Costinot and Donaldson get around this with data on land characteristics
– They find support for the theory
Lecture 3: Comp. Advantage 46
Outline: Comparative Advantage and the Gains from Trade
• Why Countries Trade– Price Differences– Supply and Demand– Determinants of Prices
• Ricardian Model of Trade– Examples– Wages and Prices in the Ricardian Model– Lessons from the Ricardian Model
• Generality of the Gains from Trade• Identifying Comparative Advantage• Critiques of Comparative Advantage

Lecture 3: Comp. Advantage 47
Critiques of Comparative Advantage
• Some argue that Ricardian assumptions no longer hold– Some say the Ricardian Model assumes
• Factors are freely mobile within countries• Factors are immobile between countries
– Without these assumptions, they say, countries lose from trade
– Not true; relaxing either assumption does not interfere with the gains from trade
Lecture 3: Comp. Advantage 48
Critiques of Comparative Advantage - Bivens
• See reading by Josh Bivens• Writes from Economic Policy Institute, which is
often critical of free trade• He doesn’t question that there are gains from
trade• What he questions is the size of the gains
– He cites authors at the Peterson Institute who quote figures that he says are way too large
– (Peterson bases its estimates on study by Brown, Deardorff, and Stern)
Lecture 3: Comp. Advantage 49
Critiques of Comparative Advantage - Bivens
• Bivens’s objections to high estimates of gains from trade– Much of the gain comes from expanded trade
in services• Estimates on trade barriers in services are very
uncertain (Yes!)• Thus he says we should not expect gains from
service trade (No!)
– Estimates ignore the effects of trade on the distribution of income (Yes)
Lecture 3: Comp. Advantage 50
Critiques of Comparative Advantage - Prestowitz
• Prestowitz cites a study by 3 very respected (by me) economists– They measures losses from increased trade
with China– Find them to be significant
• Prestowitz concludes that US may have lost from this trade

Lecture 3: Comp. Advantage 51
Critiques of Comparative Advantage - Prestowitz
• Prestowitz also claims that the case for the gains from trade assumes:– Perfect competition, No economies of scale
– No cross-border flows of investment, technology, or people
– Full utilization of all resources, No costs of adjustment
– Fixed exchange rates
– That losers from trade (who exist, but whose losses are temporary) will be compensated by the winners
• And that these assumptions do not hold.
• He’s– Right that these assumptions do not hold
– Wrong that the gains from trade require them
Conclusion
• Bottom line from all this– Yes, there are losers from trade– Gains from trade, especially from comparative
advantage, outweigh the losses– Note also (see Brooks) that countries have
done much better with trade than without, and not just in income – also reduced child mortality and increased education
Lecture 3: Comp. Advantage 52
Lecture 3: Comp. Advantage 53
Next Time
• Modern Theories and Additional Effects of Trade– Other theories of trade that are more realistic
than the Ricardian Model– Effects of trade on other things, such as
wages– How some will lose from trade
Top Related