


Languages
Pages
Legal


Investor Presentation
April 2017

Safe Harbor SlideSafe Harbor Statement
This presentation contains forward-looking statements that involve risks and uncertainties, including statements regarding MobileIron's revenue and other GAAP and non-GAAP financial metrics for the company's third quarter in 2015 and other statements regarding trends in the company's business, including statements regarding MobileIron's GAAP and non-GAAP revenue and operating expense targets, growth in our customer base, increased customer adoption, and expected benefits from new product offerings and MobileIron’s partner ecosystem. There are a significant number of factors that could cause actual results to differ materially from statements made in this presentation, including MobileIron's limited operating history,quarterly fluctuations in MobileIron's operating results, MobileIron's need to develop new solutions and enhancements to compete in rapidly evolving markets, product defects, competitive pressures, customer adoption, changes by operating system providers and mobile device manufacturers, MobileIron's inability to manage growth, the quality of MobileIron support, MobileIron's reliance on channel partners and development of partner ecosystem.
Additional information on potential factors that could affect MobileIron's financial results is included in the company's SECfilings, including its most recent Form 10-K and Form 10-Q. MobileIron does not assume any obligation to update the forward-looking statements provided to reflect events that occur or circumstances that exist after the date on which they were made.

VisionUnlock human
potential
MissionProvide security and apps
backbone for modern computing
StrategyBuild scalable, multi-OS
architecture with repeatable business model

Large Secular Trend of Enterprise Security & Mobility
Leadership Positionin the Magic Quadrant
Rapidly Growing Base with over 12+ million Cumulative seats and 14,500 Cumulative Customers since 2009
High Organic GrowthRecurring Revenue Growth 25% in 2016
Sales Leverage & Reach through Global Channels
Strong ecosystem100+ OS, device, security, cloud, network, apps ISVs
Accelerating Business Modelwith Compelling Economics & Path to Profitability
Data as of fourth quarter 2015

Two trends power our business
Mobile security
Cloud security
Network security
Enablement
Intelligence
Move to cloudMove to mobile

Old: Perimeter Model
Enterprise Boundary Collapsing
System imageAnti-malware agents
PerimeterFirewall
Device VPNVDI
Mobile & Cloud Model
Salesforce Office365 Workday SAP Oracle
Concur Google Drive box Dropbox


Enterprise Information is Everywhere:
In the datacenter
In the cloud
In mobileapps
On mobile devices
In motion between them

Note: Some features will vary by device and deployment model
MobileIron end-to-end product architecture

Broad, Integrated Ecosystem
Service providers
Services multiplier
Infrastructure
Mobile awareness
OS/ODM
Device Adoption
Applications
Security

Accelerating growth
FedRampCalifornia law
Common Criteria
Mobile apps and regulatory
requirement
New products
Grow EMM business: 15-20% growth
Expand TAM: 560M laptops
Increase ASP $ / customer: 10 - 33%

Certifications awarded
FedRAMPGovernment Cloud
US-EU Privacy Shield CSfCNSA Commercial Solutions for Classified
FIPS 140-2 Common CriteriaMDMPP V2
SOC 2 Type II

Why We Win
We secure apps
AppConnect
We secure the network
Sentry
We secure identity
Certs and SSO
Routes to Market
Operators
VARs

Financial Overview
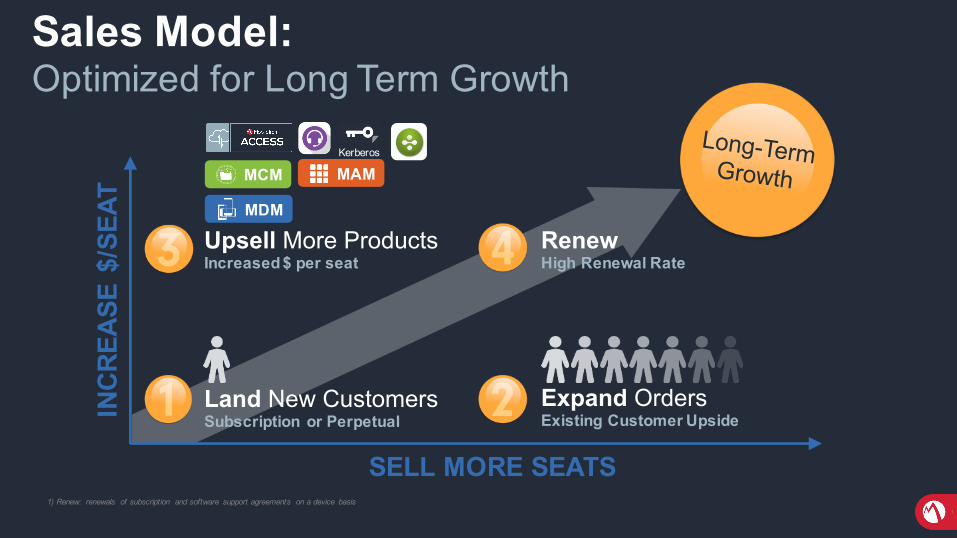
Sales Model: Optimized for Long Term Growth
SELL MORE SEATS
INCR
EASE
$/S
EAT
1) Renew: renewals of subscription and software support agreements on a device basis
Upsell More ProductsIncreased $ per seat
Land New CustomersSubscription or Perpetual
Expand OrdersExisting Customer Upside
RenewHigh Renewal Rate
MCM MAM
MDM
Kerberos

Revenue Mix Shifting Towards Subscription
See earnings press release for non-GAAP reconciliation
Shift from Perpetual to Subscription64% to 23%
Net Present Value on Subscription
Higher
Increased Predictability
15% 17% 19% 20% 22% 24% 24% 25% 31% 33% 33% 34% 38% 39% 37% 36% 40%
21% 24% 25%27% 28%
28% 28% 27%34% 33%
32%31% 34% 36% 35% 33% 37%
64% 59%57%
53%49%
48%48%
48% 35% 34%35%
36%27%
25%27%
32% 23%
$0
$5
$10
$15
$20
$25
$30
$35
$40
$45
$50
1Q13 2Q13 3Q13 4Q13 1Q14 2Q14 3Q14 4Q14 1Q15 2Q15 3Q15 4Q15 1Q16 2Q16 3Q16 4Q16 1Q17
Reve
nue
$MM
Subscription Software Sprt/Service Perpetual

Perpetual23%
Subscription40%
SoftwareSupport/Services
37%
First Quarter 2017 Revenue
$42.3M
+11%
1Q YoY Revenue Growth by Category
$38.0$42.3
-0.5
+2.3 +2.5
1Q16REVENUE PERPETUAL SUBSCRIPTION SUPPORTANDSERVICE
1Q17REVENUE

$6M$7M
$9M$11M
$12M$14M
$16M$18M
$20M$22M
$23M$26M$27M$28M
$29M$30M$31M
1Q132Q133Q134Q131Q142Q143Q144Q141Q152Q153Q154Q151Q162Q163Q164Q161Q17
$9M $9M$12M
$16M$16M$19M
$20M
$24M$24M$25M
$27M
$31M
$27M
$31M
$35M
$40M
$34M
1Q13
2Q13
3Q13
4Q13
1Q14
2Q14
3Q14
4Q14
1Q15
2Q15
3Q15
4Q15
1Q16
2Q16
3Q16
4Q16
1Q17
Recurring Billings and Revenue
Recurring Billings Recurring Revenue
Billings Model
Perpetual (One Time)
Software Support
Term Subscription(12/24/36 Month)
Monthly Recurring (MRC)Billed Each Month by Service Provider
Not in Deferred Revenue
Footnotes:1) See earnings press release for non-GAAP reconciliation2) Recurring billings: Billings from subscription (term and MRC) plus service support. 3) Recurring revenue: revenue from subscription (term and MRC) plus service support.
37% CAGR 46% CAGR

Billings and Revenue shift to recurring modelBillings mix Revenue mix
64.8%69.9%
74.9%
35.2%30.1%
25.1%
1Q15 1Q16 1Q17
RecurringBillings One-TimeBillings
60.1%
70.1%73.8%
39.9%
29.9%26.2%
1Q15 1Q16 1Q17
RecurringRevenue One-TimeRevenue

Focus on expense optimization
1Q17: Non-GAAP operating expenses of $40.8M• Down $1.5M from 1Q16• Down 14.7% as a % of revenue
Non-GAAP operating expenses as % of revenue
Non-GAAP target model Target
Gross Margin 85% – 87%
Sales & Marketing 33% - 36%
Research & Development 18% – 20%
General & Admin 7% - 9%
Operating Income 20% - 25%
36% 38% 34%
73% 59%51%
22%
14%12%
1Q15 1Q16 1Q17
Research&Development Sales&Marketing General&Admin
131%
111%97%


GAAP to Non-GAAP Reconciliation(inUSD$000s,exceptforpercentages) Q1FY2016 Q2FY2016 Q3FY2016 Q4FY2016 FY2016 Q1FY2017
GAAPRevenue 38,008 38,881 41,566 45,472 163,927 42,288
VSOErevenuepriorto2013 - - - - - -
Non-GAAPRevenue 38,008 38,881 41,566 45,472 163,927 42,288
GAAPGrossProfit 30,738 30,764 33,757 38,120 133,379 35,018
VSOErevenuepriorto2013 - - - - - -
Amortizationofintangibles 154 154 154 154 617 154
Stockbasedcompensationcharges 390 1,055 747 851 3,043 700
Restructuringcharge - - 181 -
Non-GAAPGrossProfit 31,282 31,974 34,839 39,125 137,038 35,872
Non-GAAPgrossmargin(non-GAAPgrossprofitovernon-GAAPrevenue)
82.3% 82.2% 83.8% 86.0% 83.6% 84.8%

GAAP to Non-GAAP Reconciliation(inUSD$000s,exceptforpercentages) Q1FY2016 Q2FY2016 Q3FY2016 Q4FY2016 FY2016 Q1FY2017
Research&development-GAAP 16,927 18,019 16,587 16,214 67,747 17,193Stockbasedcompensationcharges (2,601) (3,812) (2,709) (2,606) (11,729) (2,766)
Restructuringcharge - - (349) - (349) -
Research&development-non-GAAP 14,326 14,207 13,529 13,608 55,669 14,427Research&development-non-GAAP;as%ageofnon-GAAPrevenue
38% 37% 33% 30% 34% 34%
Sales&marketing-GAAP 25,669 27,246 24,404 24,844 102,162 23,303Stockbasedcompensationcharges (3,119) (2,992) (2,307) (2,056) (10,473) (1,772)
Restructuringcharge - - (404) - (404) -
Sales&marketing-non-GAAP 22,550 24,254 21,693 22,788 91,285 21,530Sales&marketing-non-GAAP;as%ageofnon-GAAPrevenue
59% 62% 52% 50% 56% 51%
General&administrative-GAAP 7,548 8,265 7,080 6,921 29,814 7,331Stockbasedcompensationcharges (2,139) (2,686) (2,109) (2,210) (9,143) (1,308)
Restructuringcharge - - (119) - (119) -
General&administrative-non-GAAP 5,409 5,580 4,852 4,711 20,553 6,023General&administrative-non-GAAP;as%ageofnon-GAAPrevenue
14% 14% 12% 10% 13% 14%

GAAP to Non-GAAP Reconciliation(inUSD$000s,exceptforpercentages) Q1FY2016 Q2FY2016 Q3FY2016 Q4FY2016 FY2016 Q1FY2017
Operatingloss-GAAP (19,407) (22,765) (14,314) (9,859) (66,344) (12,808)
VSOErevenuepriorto2013 - - - - - -
Amortizationofintangibles 154 154 154 154 617 154
Stockbasedcompensationcharges 8,248 10,545 7,872 7,723 34,388 6,546
Restructuringcharge - - 1,052 - 1,052 -
Litigationsettlementcharge - - - - - 1,143
ImpairmentofIPR&D - - - - - -
Operatingloss-non-GAAP (11,004) (12,066) (5,235) (1,982) (30,287) (4,964)
OperatingMargin-non-GAAP;(non-GAAPoperatinglossovernon-GAAPrevenue)
(29%) (31%) (13%) (4%) (18%) (12%)

GAAP to Non-GAAP Reconciliation(inUSD$000s,exceptforpercentages) Q1FY2016 Q2FY2016 Q3FY2016 Q4FY2016 FY2016 Q1FY2017
GAAPRevenue 38,008 38,881 41,566 45,472 163,927 42,288
TotalDeferredRevenue,EndofPeriod(1) 70,157 72,488 78,172 88,076 88,076 91,162
Less:TotalDeferredRevenue,BeginningofPeriod (69,875) (70,157) (72,488) (78,172) (69,875) (88,076)
GrossBillings 38,289 41,213 47,251 55,375 182,128 45,374
GAAPRevenue 38,008 38,881 41,566 45,472 163,927 42,288
Less:PerpetualLicenseRevenue (10,368) (9,783) (11,311) (14,313) (45,774) (9,882)
Less:ProfessionalServicesRevenue (570) (1,023) (780) (438) (2,811) (698)
SubscriptionandSoftwareSupportDeferredRevenue,EndofPeriod67,580 70,286 75,956 85,613 85,613 88,617
Less:SubscriptionandSoftwareSupportDeferredRevenue,BeginningofPeriod
(67,267) (67,580) (70,286) (75,956) (67,267) (85,613)
Less:Adjustments(2) (612) (341) (232) (726) (1,912) (728)
RecurringBillings 26,770 30,440 34,915 39,651 131,776 33,983
RecurringBillingsasPercentageofGrossBillings 70% 74% 74% 72% 72% 75%

Explanation ofNon-GAAPMeasures
TosupplementourfinancialresultspresentedonaGAAPbasis,weusethenon-GAAPmeasuresindicatedinthetables,whichexcludestock-basedcompensation,theamortizationofintangibleassets,andperpetualrevenue recognizedfromlicensesdeliveredpriorto2013,thatwebelievearehelpfulinunderstandingourpastfinancialperformanceandourfutureresults.Ournon-GAAPfinancialmeasuresarenotmeanttobeconsideredinisolationorasasubstituteforcomparableGAAPmeasuresandshouldbereadonlyinconjunctionwithourconsolidatedfinancialstatementspreparedinaccordancewithGAAP.Ourmanagement regularly usesoursupplementalnon-GAAPfinancialmeasuresinternallytounderstand,manageandevaluateourbusinessandmakeoperatingdecisions.Thesenon-GAAPmeasuresareamongtheprimary factorsmanagementusesin planningforandforecastingfutureperiods.Compensationofourexecutivesisbasedinpartontheperformanceofourbusinessbasedonthesenon-GAAPmeasures.Ournon-GAAPfinancialmeasuresreflectadjustmentsbasedonthefollowingitems:
Perpetuallicenserevenuerecognizedfromlicensesdeliveredpriorto2013 Wehaveexcludedtheeffectofperpetuallicenserevenuerecognizedfromlicensesdeliveredpriorto2013fromrevenuegrossprofit,grossmargin,operatingloss,andoperatingmargin.Becausewehadnotestablishedvendorspecificobjectiveevidence,orVSOE,offairvalueofsoftwaresupportandservicespriortoJanuary1,2013,werecognizedperpetuallicenserevenueratablyover thetermoftherelatedsoftwaresupportagreement.UponestablishingVSOEonJanuary1,2013,webegantorecognizeperpetuallicense revenueupondeliveryassumingallotherrevenue recognitioncriteriaaremet.Asaresult,ourperpetual licenserevenueincludesamountsrelatedtolicensesdelivered inpreviousyears.Revenue fromtheseperpetual licensesdeliveredpriorto2013hasdeclinedovereachquartersincethequarterendedMarch31,2013andwillcontinuetodeclinesequentiallyuntilitisfullyamortized.Weevaluateourbusinessperformanceexcludingrevenuefromtheseperpetual licensesdeliveredpriorto2013aswebelievethattheinclusionofthisrevenuemakesitdifficulttocompareperiodsandunderstandgrowthin ourbusiness.
Stock-basedcompensationexpenses:Wehaveexcludedtheeffectofstock-basedcompensationexpensesfromournon-GAAPcostofrevenue,operatingexpensesandnet incomemeasures.Althoughstock-basedcompensationisakeyincentiveofferedtoouremployees,andwebelievesuchcompensationcontributedtotherevenuesearnedduringtheperiodspresentedandalsobelieve itwillcontributetothegenerationoffutureperiodrevenues,wecontinuetoevaluateourbusinessperformanceexcludingstock-basedcompensationexpenses.Stock-basedcompensationexpenseswillrecurinfutureperiods.
Amortizationofintangibleassets:Wehaveexcludedtheeffectofamortizationofintangibleassetsfromournon-GAAPcostofrevenue,operatingexpensesandnet incomemeasures.Amortizationofintangibleassetsisinconsistentinamountandfrequencyandissignificantlyaffectedbythetimingandsizeofouracquisitions.Investorsshouldnotethattheuseofintangibleassetscontributedtoourrevenuesearnedduringtheperiodspresentedandwillcontributetoourfutureperiodrevenuesaswell.Amortizationofintangibleassetswillrecurinfutureperiods.
RestructuringCharges:Inournon-GAAPfinancialmeasures,wehaveexcludedtheeffectoftheseveranceandotherexpensesrelated toourreductioninworkforce.Restructuringchargesmay recurinthefuture;however, thetimingandamountsaredifficulttopredict.
GAAP to Non-GAAP Reconciliation

Top Related