


Languages
Pages
Legal


2Q 2011 Corporate PerformanceJuly 2011

2
This presentation contains forward-looking statements that are based on our
current expectation, assumptions, estimates and projections about S-OIL and the
refinery industry. We caution you not to place undue reliance on any forward-
looking statement which may involve various risks and uncertainties.
Please also note that although we believe that the assumptions on which our
forward-looking statements are based are reasonable, any of those assumptions
could prove to be inaccurate, and, as a result, the forward-looking statements
based on those assumptions could be incorrect. Except as required by law, we
do not undertake to release the results of any revisions of these forward-looking
statements to reflect future events or circumstances.
Disclaimer

2Q 2011 Performance
Performance by Business Segment
3
Contents
2H ’11 Industry Outlook
Appendix

4

Revenue Increased 18% QoQ driven by increase of ASP and sales volume, recording
historic-high
ASP: 7.9%↑ / Sales volume: 9.1%↑, QoQ
Operating
Income
Decreased 63% QoQ due to retail price cut, falling F/X rate, disappearance of
inventory related gain and FTC’s penalty, but increased 13% YoY
Retail price cut :\ 100/ℓ↓of Gasoline & Diesel (Apr.7 ~ Jul.6)
F/X rate trend (average) : 1Q \ 1,121.0/$ → 2Q \ 1,083.7/$
FTC’sPenalty (E) : 45 bil. Won(Unit: bil. Won)
5
2Q 2011 Financial Result
2Q ’11 QoQ 1Q ’11 2Q ’10 YoY
Revenue 8,025.8 17.7%↑ 6,817.3 4,911.7 63.4%↑
Operating Income 241.8 62.7%↓ 647.5 213.5 13.2%↑
(Margin) (3.0%) - (9.5%) (4.3%) -
Net Finance Gain 79.7 12.1%↑ 71.3 -166.0 -
− Net Interest Gain -5.0 - 4.2 0.5 -
− Net F/X Gain 84.7 26.2%↑ 67.1 -166.5 -
Equity Method Gain 1.2 15.0%↓ 1.4 0.8 49.0%↑
Income before Tax 322.7 55.2%↓ 720.2 48.3 568.9%↑

3,888 3,797 3,752
6,964 6,382 4,705
689 1,390
896
1,237 834
651
0
2,000
4,000
6,000
8,000
10,000
12,000
14,000
2Q '11-end 1Q '11-end FY '10-end
Assets
Tangible Asset A/R & Inventory Cash Others
6
5,027 4,801 4,505
3,289 3,071 1,937
678 680
682
3,784 3,851
2,880
0
2,000
4,000
6,000
8,000
10,000
12,000
14,000
2Q '11-end 1Q '11-end FY '10-end
Liabilities & Equities
Equity S-T borrowing L-T borrowing Other liabilities
(Unit: bil. Won) (Unit: bil. Won)
2Q ’11 1Q ’11 FY ’10
Return of Equity 20.1 47.5 16.8
ROCE 13.6 38.3 13.4
Net debt to equity 65.2 49.2 38.2
Net debt (bil. Won) 3,277.2 2,361.4 1,723.1
Financial Ratios (Unit: %)
Financial Status
12,778 12,403 10,004 12,778 12,403 10,004

Major projects
Onsan refinery expansion
Upgrade & Maintenance 18.9 billion Won
8.0 billion Won
(Unit: bil. Won)
2Q ’11 1Q ’11 FY ’11 (Budget)
1. Major projects 45.2 53.0 149.8
Onsan Refinery Expansion 44.5 53.0 137.9
New SPM Construction, and etc. 0.8 - 11.9
2. Upgrade & Maintenance 18.9 23.5 146.1
3. Marketing Investment 8.0 4.4 63.2
4. Acquisition of HK Silicon Equity 265.0 - 265.0
5. Others (Including construction of HQs building) 84.2 22.5 148.2
Total 421.3 103.4 772.3
45.2 billion Won
Marketing investment
7
Capital Expenditure for 2Q ’11
* Depreciation: 241.2 bil. Won(E) (FY ’11) vs. 188.7 bil. Won (FY ’10)
Acquisition of HanKook Silicon Equity (Appendix) 265.0 billion Won
44.5 billion Won
8
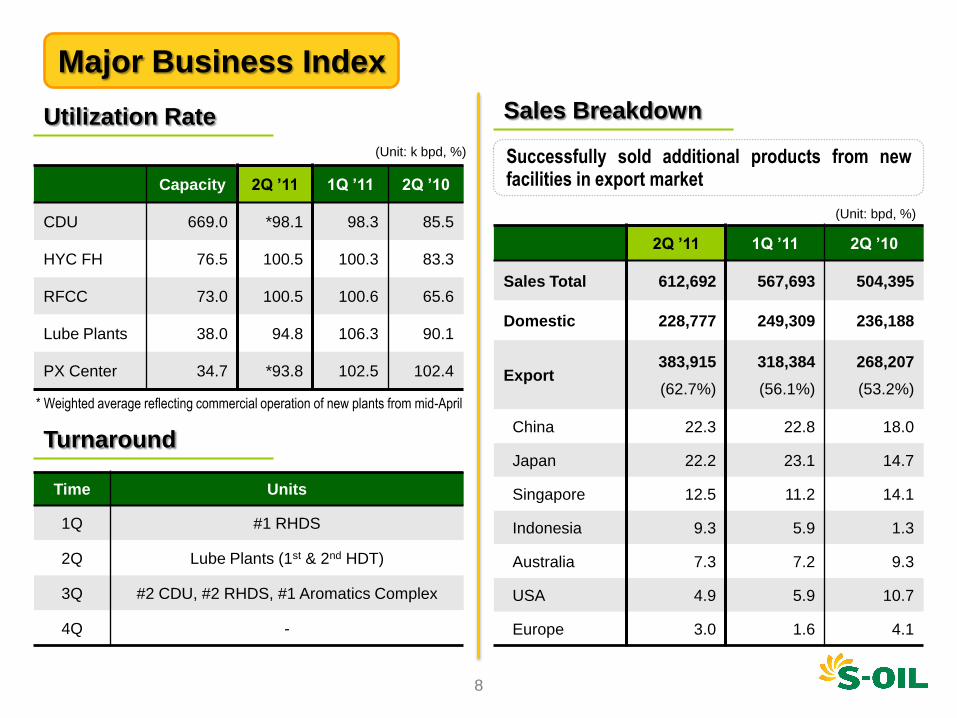
Utilization Rate
(Unit: k bpd, %)
Turnaround
Capacity 2Q ’11 1Q ’11 2Q ’10
CDU 669.0 *98.1 98.3 85.5
HYC FH 76.5 100.5 100.3 83.3
RFCC 73.0 100.5 100.6 65.6
Lube Plants 38.0 94.8 106.3 90.1
PX Center 34.7 *93.8 102.5 102.4
Sales Breakdown
(Unit: bpd, %)
2Q ’11 1Q ’11 2Q ’10
Sales Total 612,692 567,693 504,395
Domestic 228,777 249,309 236,188
Export383,915
(62.7%)
318,384
(56.1%)
268,207
(53.2%)
China 22.3 22.8 18.0
Japan 22.2 23.1 14.7
Singapore 12.5 11.2 14.1
Indonesia 9.3 5.9 1.3
Australia 7.3 7.2 9.3
USA 4.9 5.9 10.7
Europe 3.0 1.6 4.1
Major Business Index
Time Units
1Q #1 RHDS
2Q Lube Plants (1st & 2nd HDT)
3Q #2 CDU, #2 RHDS, #1 Aromatics Complex
4Q -
Successfully sold additional products from newfacilities in export market
* Weighted average reflecting commercial operation of new plants from mid-April

9

10
2Q ’11 QoQ 1Q ’11 2Q ’10 YoY
Refining 6,513.6 13.5%↑ 5,738.3 4,211.3 54.7%↑
Petrochem 915.6 61.6%↑ 566.7 357.2 156.3%↑
Lube 596.6 16.5%↑ 512.3 343.2 73.8%↑
Total 8,025.8 17.7%↑ 6,817.3 4,911.7 63.4%↑
(Unit: bil. Won)
(Unit: bil. Won)
2Q ’11 QoQ 1Q ’11 2Q ’10 YoY
Refining -14.0 - 424.7 123.2 -
(Margin) (-0.2%) (7.4%) (2.9%)
Petrochem 77.2 16.3%↓ 92.3 8.1 852.1%↑
(Margin) (8.4%) (16.3%) (2.3%)
Lube 178.6 36.8%↑ 130.5 82.2 117.2%↑
(Margin) (29.9%) (25.5%) (23.9%)
Total 241.8 62.7%↓ 647.5 213.5 13.2%↑
(Margin) (3.0%) (9.5%) (4.3%)
Refining Petrochem Lube
Financial Result by Business Segment
Revenue
Operating Income
6,5145,738
916
567
597
512
0
1,500
3,000
4,500
6,000
7,500
9,000
2Q '11 1Q '11
-14
425
77
92
179
131
-100
0
100
200
300
400
500
600
700
2Q '11 1Q '11
77
179
242 648
8,026 6,817

Increase of jet sales volume offsetting seasonal
demand slow-down of kerosene
Sales volume
11
2Q ’11 1Q ’11 2Q ’10
Dubai crude 110.6 100.9 78.1
Gasoline 11.7 10.5 7.4
Jet/Kero 20.4 20.3 11.8
Diesel 19.4 18.4 11.3
Naphtha -1.9 0.0 -0.3
HSFO 380 -9.5 -9.7 -7.0
Product/Dubai Spread
Source: Platt’s, P&G, The Company
(Unit: $/bbl)
Market Company
Sales Volume
(Unit: bpd) 2Q ’11 1Q ’11 QoQ
Gasoline 74,106 68,488 8.2%↑
Jet/Kero 147,198 137,319 7.2%↑
Diesel 157,383 129,473 21.6%↑
Naphtha 59,653 55,453 7.6%↑
Fuel Oil 60,308 80,546 25.1%↓
Others 30,398 30,190 0.7%↑
Total 529,046 501,469 5.5%↑
Refining Business
Complex margin slightly rose due to improvedspreads of gasoline and middle distillate in spite ofweak seasonality
Focused on sales of increased light products fromnew CFU(Condensate Fractionation Unit) to captureimproved spread
(Unit: bpd) 2Q ’11 1Q ’11 QoQ
Jet fuel 101,986 66,668 53.0%↑
Kerosene 45,212 70,651 36.0%↓
-1.3-2.4
-0.8-1.7
-0.9 -0.9
1.0 0.51.7 2.1
3.4 3.5
-6
-4
-2
0
2
4
6
1Q '10 2Q '10 3Q '10 4Q '10 1Q '11 2Q '11
($/bbl)Singapore Refining Margin (Var. Cost)
Hydroskimming Complex

12Source: Platt’s, ICIS, ACP, CMAI, The Company
(Unit: bpd) 2Q ’11 1Q ’11 QoQ
P-X 32,706 18,391 77.8%↑
Benzene 7,991 5,395 48.1%↑
Propylene 7,171 6,337 13.2%↑
Total 47,868 30,123 58.9%↑
Sales volume
Petrochemical
Lube
Market Company
Petrochemical & Lube Business
Succeeded full operation of new PX plant withinshortened ramp-up periodSpread contracted due to eased supply shortage
along with weakened demand
Spread surged thanks to strong demand fromdeveloped countries and declined supply bymaintenance
Maximized sales volume to capture strong margin
despite regular maintenance of Group II facilities
Sales volume
(Unit: bpd) 2Q ’11 1Q ’11 QoQ
Group II 7,781 9,444 17.6%↓
Group III 23,333 21,765 7.2%↑
Total 35,778 36,101 0.9%↓
248 192 167 156
226 155
335 296
248 370
635 604
510 469 449
388
498 501
0
200
400
600
800
1Q '10 2Q '10 3Q '10 4Q '10 1Q '11 2Q '11
$/MT
BZ spread PX spread Propylene spread
254
343 401 402 424
564
0
200
400
600
1Q '10 2Q '10 3Q '10 4Q '10 1Q '11 2Q '11
$/MT
ICIS150N-HSFO380
※ Lube sales volume includes by-products.

13

14
Demand change: (-) 45 (Diesel & Fuel oil ↓, Gasoline & Naphtha ↑)
Diesel: (-) 89 (India 83↓, ASEAN 91↓) & Fuel oil: (-) 108 (China 36↓, S.Korea 27↓)
− Weakened diesel demand from end of agricultural season & decline of bunker consumption due to slower economic growth
Gasoline: (+) 156 (China 90↑, Japan 33↑) & Naphtha: (+) 58 (Japan 55↑, China 25↑)
− Gasoline demand pick-up during driving season & consumption rebounded from sharp decline in 1H by earthquake in Japan
Supply change: (+) 180 (Capacity Add: 800, Closure: 210)
(Unit: k bpd)
2H ’11 Outlook – Refining*
Source: ESAI, The Company
HoH: Tiny decline of demand vs. a bit increase of supply
YoY: Sustainable demand growth vs. limited supply increase
* Demand forecast is based on 5 major products (Naphtha, Gasoline, Jet/Kero, Diesel, Fuel Oil)
Demand change: (+) 559 (5 major products↑)
Diesel: (+) 276 (China 230 ↑, India 69 ↑) & Fuel oil: (+) 137 (China 79 ↑, Japan 37 ↑)
− Continued growing regional demand along with still-healthy economic growth compared to last year
Naphtha : (+) 62 / Gasoline: (+) 75 / Jet & Kero: (+) 9
Supply change: (+) 260 (Capacity Add: 1,215, Closure: 470)
Slight HoH correction from strong 1H, but sustainable YoY improvement

15
Petrochemical
Lube
Source: CMAI, PCI
2H ’11 Outlook – Petrochemical & Lube
Tightness of Group III is expected to be somewhat eased due to sizable supply increase
Group III: Considerable supply increase from new capacities in Asia amid healthy demand in US and Europe
Group II: Sustainable demand growth in Asia offsetting some capacity additions
PX : Tighter market due to sizable increase of new PTA plants with no addition of PX plant
Demand : Further increase from sizable PTA capacity addition
− HoH Incremental demand : 460 k ton↑ (1H) → 593 k ton↑ (2H), 133 k ton↑
• PTA capacity increase : 1,890 k tpa↑ (1H) → 4,445 k tpa↑ (2H)
Supply : Limited increase due to no addition of new PX plant
− HoH Incremental supply : 618 k ton↑ (1H) → 517 k ton↑ (2H), 101 k ton↓
• PX capacity increase : 1,380 k tpa↑ (1H) → 0 k tpa↑ (2H)
Benzene : Continuously challenging market
− Increase of supply due to completion of sizable plant maintenance amid limited demand growth
• Restart-up of off-line plants for maintenance (GS Caltex, Mitsubishi Chem., etc.)
• Sluggish demand from SM & phenol

16

17
Investment on HanKook Silicon
33.9%
33.4%
10.8%
21.2%
0.7%
Osung LST
S-OIL
Shinsung Holdings
Susung Technology
Others
* Fully diluted basis
Size of investment: \ 265.0 bil.
Why poly-silicon?
Acquisition of 33.4% stake
Fast growing market with high profitability
− Global poly-silicon market is expected to grow at 23% p.a. for the next 5 years: 106 k ton (2010)→ 292 k ton (2015)
− Global leading poly-silicon producers have enjoyed high operating margin of average 29% in the past three years
Korean companies’ strong competitiveness for poly-silicon business
− Secured operational efficiency and technological competitiveness
− Close to major consumers such as China and Japan
Similarity in manufacturing process between poly-silicon and refining/petrochemical
Total
8 Directors35
Management participation

18
Investment on HanKook Silicon
7,500
0
4,000
8,000
12,000
2010 2011 2012
Plant 1 Plant 2
12,300
3,2003,000
(Unit: MT)
Joint
Venture
Why HanKook Silicon?
Proved its technology and capacity by succeeding in commercial production of high purity poly-silicon in
6 months, and currently produces 100% of high purity poly-silicon (8N and 9N)
One of 8 global players which currently produce high purity poly-silicon
Secured the core technologies of poly-silicon from its affiliates’ strong support
Will secure economies of scale from 1Q 2012
On-going Capacity Expansion
4,800
* Revamping of Plant 1 and construction of Plant 2 are under way as one project, which will lead to improvement of cost structure and
competitiveness.

19
Investment on HanKook Silicon
Poly-silicon business outlook
149
176
206244
292
150
186
228
276304
94
160
196
253278
2011 2012 2013 2014 2015
Poly-silicon Demand
Total Supply
High Purity Supply
(Unit: 1,000 MT)
Poly-silicon market will grow robustly in line with expansion of solar PV industry driven by the following
growth forces:
− Continued growth of current major markets such as Germany despite subsidy cut
− Demand diversification resulting from growth of such new markets as US and China
− Upcoming grid parity with continuous decrease of module price & improvement of module efficiency
− Increased concern on nuclear safety after earthquake in Japan
(Source: Accenture Analysis)
Poly-silicon supply & demand forecast
Despite heavy investment on global production capacity, total supply of high purity poly-silicon is still
expected to be short of demand thanks to growing demand of higher efficiency PV

Top Related