


Languages
Pages
Legal


MINES AND MONEY
TSX: SGQ HKEx: 1878
HONG KONG – MARCH 2011

2
Disclaimer
Forward-looking statements
This presentation includes certain “forward-looking statements.” All statements, other than statements of historical fact, are forward-looking statements that involve various risks and uncertainties. There can be no assurances that such statements will prove accurate, and actual results and future events could differ materially from those anticipated in such statements. Such information contained herein represents management’s best judgment as of the date hereof based on information currently available. The company does not assume the obligation to update any forward-looking statement.
Qualified Persons
The technical information in this presentation is derived from SouthGobi’s news releases, each of which has been reviewed by one or more qualified persons (QPs), as defined by NI 43-101. Copies of the releases naming the QPs are available at Sedar or www.southgobi.com.

3
Strategically located – closest coal to ChinaNearest coal production base to China and infrastru cture
1
MONGOLIA
CHINA
� Assets (2 mining licenses and 14 exploration licens es) predominantly in Ovoot Khural Basin – 40km from China border crossing with rail. C ontinued build out of rail in China
� Flagship Ovoot Tolgoi Mine:
— Semi-soft coking coal
— Favorable geology. Thick seams, low strip ratio ope n pit

4
China is ‘here to stay’ as a coal importer
2 Markets and marketingMarket dynamic
� Coal demand continues to grow 5-8% per year
� Domestic resource quality is reducing rapidly – only 25% of remaining coking coal resource shallower than 400m
� Costs increasing – coking coal cash costs now around US$110/t (twice 2006)
Mongolia – natural supplier
� Infrastructure being developed and scalable
� Located closer to faster growing markets – inland we st consumption forecast 9-10% per year
2009 2010
34.5mt 47.3mt
Growth: 2010 vs. 2009
Mongolia 278%
Australia -23%
Canada 8%
China coking coal imports by source
5
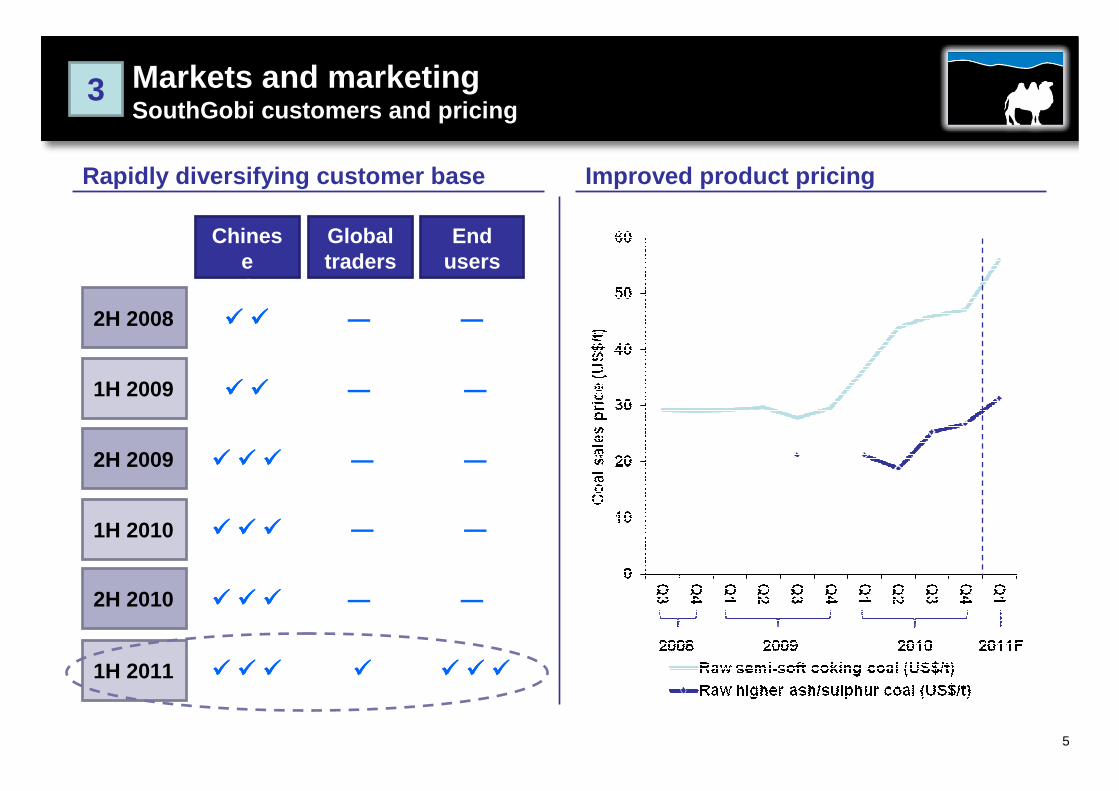
Rapidly diversifying customer base
3 Markets and marketingSouthGobi customers and pricing
Improved product pricing
Chinese
traders
Global traders
End users
2H 2008
1H 2009
2H 2009
1H 2010
2H 2010
1H 2011
���� ����
���� ����
���� ���� ����
���� ���� ����
���� ���� ����
���� ���� ����
―
―
―
―
―
����
―
―
―
―
―
���� ���� ����

6
Sales and Revenue (2009 – 2010)
FinancialsSales and revenue
Sales volume (mt)
Semi-soft
Raw high-ash
0.1 0.4 0.5 0.4 0.4 0.4 0.1 0.41.3 1.3
- - - - 0.0 0.0 0.1 1.1- 1.3
� Average selling price declined in Q4 2010 due to an increased mix of raw high-ash high-sulphur coal
� Overall average selling price for 2010 higher at $35/t
� 2010 revenue $79.8m 121% higher than 2009
4

7
Direct and total cash cost of product sold (2009 – 2 010)
FinancialsCash costs
Shovels / excavators operating
Strip ratio (BCM:tonne)
1 1 1 2 2 2 2 3
2.2 - 2.9 5.4 6.8 2.8 5.1 2.63.4 3.5
� Costs falling during 2010 with Q4 2010 being lowest cash cost production quarter
� Commissioning of newer larger fleets partially offsetting increasing fuel price
5
8
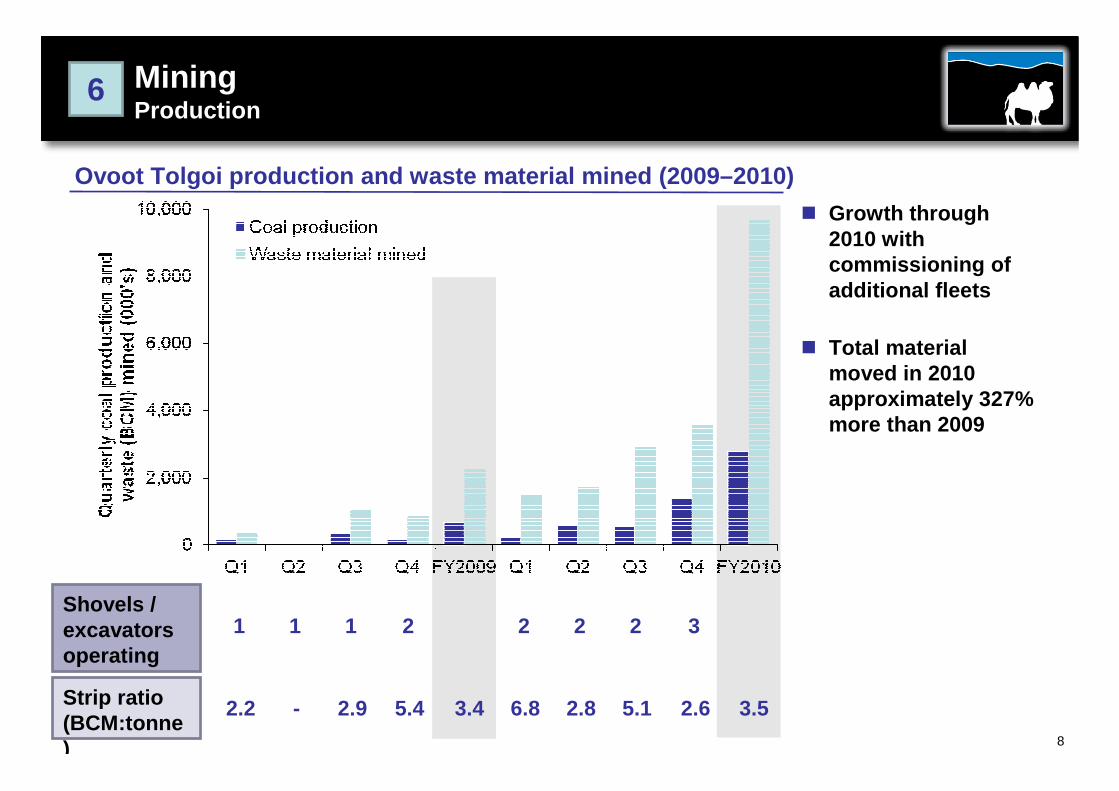
Ovoot Tolgoi production and waste material mined (2 009–2010)
MiningProduction
� Growth through 2010 with commissioning of additional fleets
� Total material moved in 2010 approximately 327% more than 2009
Shovels / excavators operating
Strip ratio (BCM:tonne)
1 1 1 2 2 2 2 3
2.2 - 2.9 5.4 6.8 2.8 5.1 2.63.4 3.5
6

9
Physical exploration activity (2009–2010)
Exploration
� Largest exploration campaign ever in 2010
� Almost one third of activity focused on Soumber area
� Resources to be updated in coming weeks
7
