


Languages
Pages
Legal

22 May 2020 Results Review 4QFY20
BSE
Fighting back,cash support BSE reported inline revenue but margin performance was below estimate in
4QYF20. There was improvement in core revenue stream (transaction charges
+19.5% QoQ), but EBIT margin is still in negative territory. BSE cash market
share has declined to 6.8% in FY20 vs. 8.9% in FY19. The StAR MF platform is
witnessing strong volume growth (+60% YoY in FY20), but drop in realisation
(Rs 6.5/transaction vs. Rs 8.5) will impact growth. We have cut FY21/22E EPS
est. by 5.3/4.7%. We arrive at a SoTP based TP of Rs 480 by assigning 10x
multiple to core FY22E PAT (Rs 16/sh), Rs 67/sh for the CDSL stake and
adding net cash excluding SGF and clearing corporation liabilities (Rs 397/sh).
Maintain ADD.
Revenue was up 8.8% QoQ to Rs 1.20bn (vs. est. of Rs 1.19) led by 19.5%
growth in transaction revenue offset by 1.0% drop in annual listing fees.
StAR MF revenue stood at Rs 0.12bn (-1.7% QoQ) led by higher volumes
(+27% YoY) offset by lower realization (-23% QoQ). StAR MF was the only
initiative of BSE which was witnessing solid growth, but drop in realization
and Covid-19 will impact growth for FY21E.
BSE has managed to improve its cash market share by 53bps QoQ, but still
down 188bps YoY to 6.9%. Currency derivative market share has declined
sharply to 31.1% (-1,101bps YoY). INX is currently in investment mode
(burning ~Rs 0.23bn annually). INX ADTV stood at USD 2.6bn (+48% YoY)
and no of daily trades was 67K (+175% YoY). Hopefully, INX will start
contributing to revenue from FY22E.
Adjusted EBITDA margin improved to 3.8% vs. -1.0% in 3Q, but was below
our est. of 5.1%. For FY20, EBITDA margin was down 467bps to 1.8% due to
flat revenue and 5% increase in total cost (adjusted for one-off). OCF stood
at Rs 3.97bn vs. negative in FY19.
Valuation and view. BSE cash market share has slipped to 6.8% in FY20
witnessing third consecutive year of decline. Interoperability has offered
some respite in 4Q, but the progress is slow. BSE is trying to fight back and
build the derivative volume through LES, but it’s still early days. New
initiatives like Insurance platform, currency trading in INX sounds
promising but there is no revenue visibility in the near term and is
impacting margins. We expect revenue growth of 6.4/12.2% in FY21/22E led
by rebound in transaction revenue and increase in listing fees. We expect
operating leverage with growth (EBITDA margin of 5.3/12.8% for FY21/22E).
BSE has net cash of Rs 18bn (~91% of MCap) and a dividend yield of ~4%,
which limits downside.
Financial Summary
YE Mar (Rs mn) 4Q
FY20
4Q
FY19
YoY
(%)
3Q
FY20
QoQ
(%) FY18 FY19 FY20 FY21E FY22E
Net Revenues 1,196 1,157 3.3 1,099 8.8 5,072 4,503 4,505 4,793 5,380
EBITDA 46 24 NM -11 NM 1,302 291 81 256 687
APAT 254 557 (54.4) 288 (11.9) 2,399 2,077 1,410 1,627 2,010
Diluted EPS (Rs) 5.6 10.8 (47.5) 6.4 (11.9) 45.1 40.1 31.3 36.2 44.7
P/E (x) 9.6 10.8 13.9 12.0 9.7
EV / EBITDA (x)
-2.3 -6.2 20.7 5.6 1.7
RoE (%) 7.8 7.1 5.8 6.7 8.2
Source: Company, HSIE Research
ADD
CMP (as on 21 May 2020) Rs 434
Target Price Rs 480
NIFTY 9,106
KEY
CHANGES OLD NEW
Rating ADD ADD
Price Target Rs 410 Rs 480
EPS % FY21E FY22E
-5.3% -4.7%
KEY STOCK DATA
Bloomberg code BSE IN
No. of Shares (mn) 45
MCap (Rs bn) / ($ mn) 20/258
6m avg traded value (Rs mn) 71
52 Week high / low Rs 627/275
STOCK PERFORMANCE (%)
3M 6M 12M
Absolute (%) (15.9) (13.9) (28.0)
Relative (%) 9.0 9.9 (7.4)
SHAREHOLDING PATTERN (%)
Dec-19 Mar-20
Promoters 0.00 0.00
FIs & Local MFs 2.53 2.38
FPIs 17.79 16.25
Public & Others 79.68 81.37
Pledged Shares 0.00 0.00
Source : BSE
Amit Chandra [email protected] +91-22-6171-7345
Vinesh Vala [email protected] +91-22-6171-7332
Page | 2
BSE: Results Review 4QFY20
Quarterly consolidated Financial Snapshot
Particulars (Rs mn) 4QFY20 4QFY19 YoY (%) 3QFY20 QoQ (%)
Total Revenue 1,196 1,157 3.3 1,099 8.8
Employee Cost 376 355 5.8 369 1.8
Technology Expenses 294 277 6.1 294 0.1
Other Operating Expenses 480 500 -4.0 448 7.2
EBITDA 46 24 88.4 -11 NM
Depreciation 134 147 -8.9 132 1.6
EBIT -88 -123 NM -143 -38.3
Interest Cost 10 2 442.1 5 119.1
Other Income (including E/O) 95 600 -84.1 555 -82.8
PBT -3 475 NM 407 NM
Tax 82 44 85.1 15 456.5
Share of Profit Loss from JV &
Associates 66 87 -24.4 57 15.6
Minority Interest -6 0 NM -6 -6.3
RPAT -13 519 NM 456 NM
E/o gains (adj for tax) 267 39 NM -167 NM
APAT 254 557 -54.4 288 -11.9
Source: Company, HSIE Research
Margin Analysis
Particulars (% of Revenue) 4QFY20 4QFY19 YoY (bps) 3QFY20 QoQ (bps)
Employee Cost % 31.4 30.7 73 33.6 -214
Technology Expenses % 24.6 24.0 63 26.7 -213
Other Operating Exp % 40.2 43.3 -308 40.8 -58
EBITDA Margin (%) 3.8 2.1 172 -1.0 485
EBIT Margin (%) -7.4 -10.6 323 -13.0 564
Tax Rate (%) NM 9.3 NM 3.6 NM
APAT Margin (%) 21.2 48.2 -2694 26.2 -499
Source: Company, HSIE Research
Revenue was up 8.8/3.3%
QoQ/YoY to Rs 1.20bn led
by 18% QoQ rise in
revenue from security
services and 3.5% QoQ rise
in revenue from corporate
services
Adjusted EBITDA margin
stood at 3.8% (our est.
5.1%). Adjustments include
Rs 26mn for IL&FS
provision
Other income was lower
due to reduction in net
cash due to buyback and
absence of one-time profit
booked from CDSL stake
sale last quarter
E/O items include Rs
186mn for IPF provisions
and Rs 54mn for LES
IPF provisions is for a
period of five years
APAT for the quarter stood
at Rs 0.25bn down 11.9%
QoQ led by lower EBITDA
and lower investment
income of Rs 0.31bn vs Rs
0.34bn QoQ
Page | 3
BSE: Results Review 4QFY20
Segmental Revenue Analysis
Rs mn 4QFY20 4QFY19 YoY
(%) 3QFY20 QoQ (%) FY20 FY19
YoY
(%)
Transaction Charges 313 287 9.1 262 19.5 1,193 1,139 4.7
Treasury Income 43 72 -40.4 42 2.1 215 307 -30.0
Other Income 101 98 3.0 83 21.6 296 269 10.0
Total Security
Services (A) 457 457 0.0 387 18.0 1,704 1,715 -0.7
Annual listing 493 443 11.3 498 -1.0 1,880 1,881 -0.1
Book building 60 48 24.0 31 95.1 182 149 22.1
Other Services 13 42 -69.0 18 -27.8 58 102 -43.1
Total Services to
corporate (B) 566 533 6.1 547 3.5 2,120 2,132 -0.6
Data Feed/others (C) 173 167 3.7 166 4.6 681 656 3.9
Total Revenue (A+B+C) 1,196 1,157 3.3 1,099 8.8 4,505 4,503 0.0
Source: Company, HSIE Research
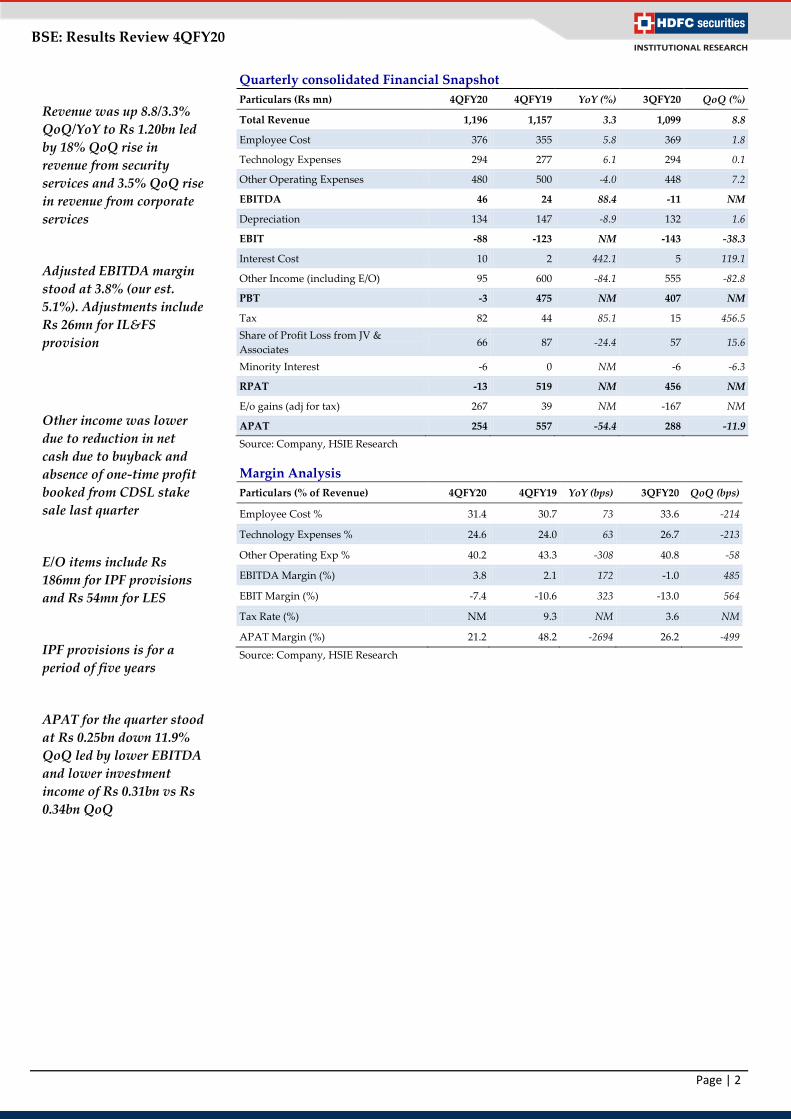
BSE Cash Market Share: Slight improvement
Source: BSE, NSE, HSIE Research
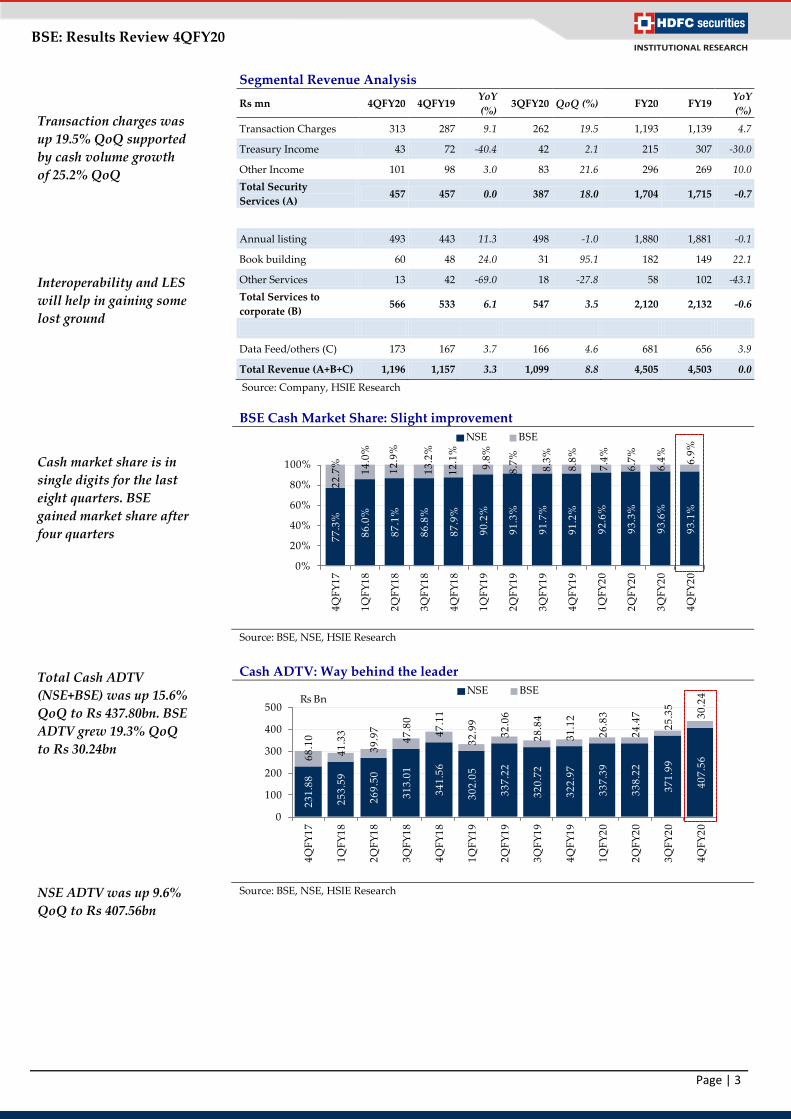
Cash ADTV: Way behind the leader
Source: BSE, NSE, HSIE Research
Transaction charges was
up 19.5% QoQ supported
by cash volume growth
of 25.2% QoQ
Interoperability and LES
will help in gaining some
lost ground
Cash market share is in
single digits for the last
eight quarters. BSE
gained market share after
four quarters
Total Cash ADTV
(NSE+BSE) was up 15.6%
QoQ to Rs 437.80bn. BSE
ADTV grew 19.3% QoQ
to Rs 30.24bn
NSE ADTV was up 9.6%
QoQ to Rs 407.56bn
77
.3%
86
.0%
87
.1%
86
.8%
87
.9%
90
.2%
91
.3%
91
.7%
91
.2%
92
.6%
93
.3%
93
.6%
93
.1%
22
.7%
14
.0%
12
.9%
13
.2%
12
.1%
9.8
%
8.7
%
8.3
%
8.8
%
7.4
%
6.7
%
6.4
%
6.9
%
0%
20%
40%
60%
80%
100%
4Q
FY
17
1Q
FY
18
2Q
FY
18
3Q
FY
18
4Q
FY
18
1Q
FY
19
2Q
FY
19
3Q
FY
19
4Q
FY
19
1Q
FY
20
2Q
FY
20
3Q
FY
20
4Q
FY
20
NSE BSE
23
1.8
8
25
3.5
9
26
9.5
0
31
3.0
1
34
1.5
6
30
2.0
5
33
7.2
2
32
0.7
2
32
2.9
7
33
7.3
9
33
8.2
2
37
1.9
9
40
7.5
668
.10
41
.33
39
.97
47
.80
47
.11
32
.99
32
.06
28
.84
31
.12
26
.83
24
.47
25
.35
30
.24
0
100
200
300
400
500
4Q
FY
17
1Q
FY
18
2Q
FY
18
3Q
FY
18
4Q
FY
18
1Q
FY
19
2Q
FY
19
3Q
FY
19
4Q
FY
19
1Q
FY
20
2Q
FY
20
3Q
FY
20
4Q
FY
20
NSE BSERs Bn
Page | 4
BSE: Results Review 4QFY20
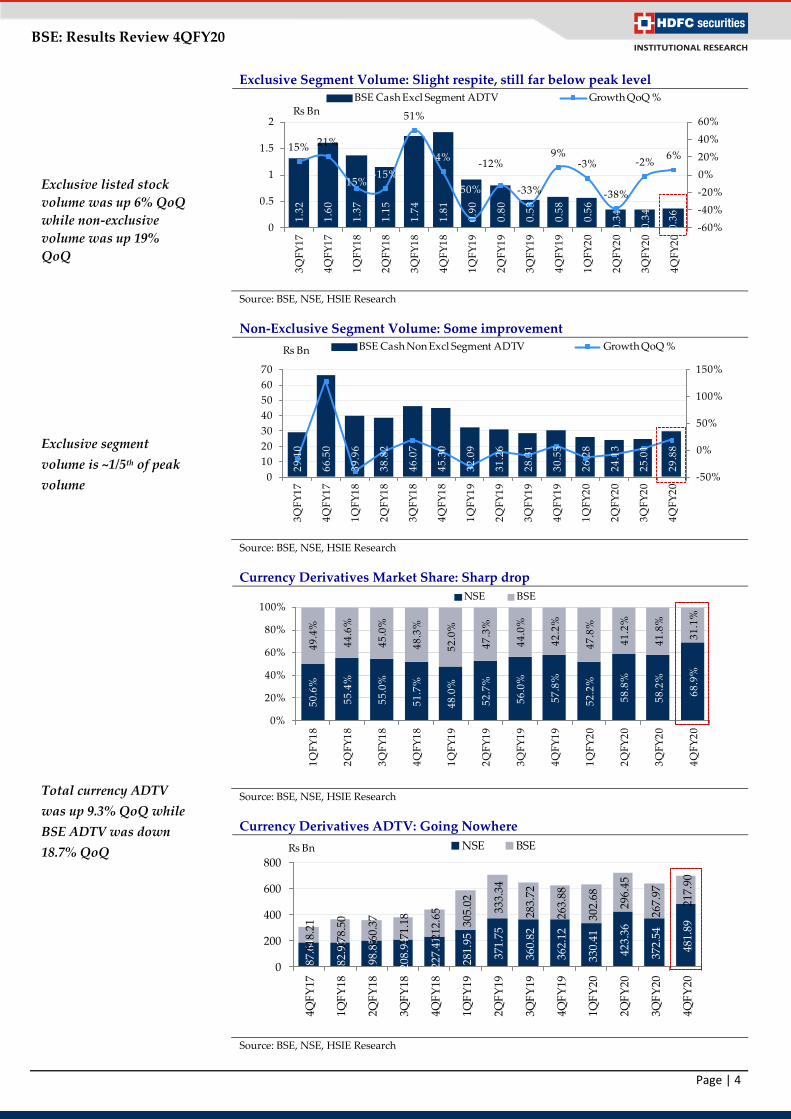
Exclusive Segment Volume: Slight respite, still far below peak level
Source: BSE, NSE, HSIE Research
Non-Exclusive Segment Volume: Some improvement
Source: BSE, NSE, HSIE Research
Currency Derivatives Market Share: Sharp drop
Source: BSE, NSE, HSIE Research
Currency Derivatives ADTV: Going Nowhere
Source: BSE, NSE, HSIE Research
Exclusive listed stock
volume was up 6% QoQ
while non-exclusive
volume was up 19%
QoQ
Exclusive segment
volume is ~1/5th of peak
volume
Total currency ADTV
was up 9.3% QoQ while
BSE ADTV was down
18.7% QoQ
1.3
2
1.6
0
1.3
7
1.1
5
1.7
4
1.8
1
0.9
0
0.8
0
0.5
3
0.5
8
0.5
6
0.3
4
0.3
4
0.3
6
15% 21%
-15%-15%
51%
4%
-50%
-12%
-33%
9%-3%
-38%
-2%6%
-60%
-40%
-20%
0%
20%
40%
60%
0
0.5
1
1.5
2
3Q
FY
17
4Q
FY
17
1Q
FY
18
2Q
FY
18
3Q
FY
18
4Q
FY
18
1Q
FY
19
2Q
FY
19
3Q
FY
19
4Q
FY
19
1Q
FY
20
2Q
FY
20
3Q
FY
20
4Q
FY
20
BSE Cash Excl Segment ADTV Growth QoQ %
Rs Bn
29
.10
66
.50
39
.96
38
.82
46
.07
45
.30
32
.09
31
.26
28
.31
30
.55
26
.28
24
.13
25
.01
29
.88
-50%
0%
50%
100%
150%
0
10
20
30
40
50
60
70
3Q
FY
17
4Q
FY
17
1Q
FY
18
2Q
FY
18
3Q
FY
18
4Q
FY
18
1Q
FY
19
2Q
FY
19
3Q
FY
19
4Q
FY
19
1Q
FY
20
2Q
FY
20
3Q
FY
20
4Q
FY
20
BSE Cash Non Excl Segment ADTV Growth QoQ %Rs Bn
50
.6%
55
.4%
55
.0%
51
.7%
48
.0%
52
.7%
56
.0%
57
.8%
52
.2%
58
.8%
58
.2%
68
.9%
49
.4%
44
.6%
45
.0%
48
.3%
52
.0%
47
.3%
44
.0%
42
.2%
47
.8%
41
.2%
41
.8%
31
.1%
0%
20%
40%
60%
80%
100%
1Q
FY
18
2Q
FY
18
3Q
FY
18
4Q
FY
18
1Q
FY
19
2Q
FY
19
3Q
FY
19
4Q
FY
19
1Q
FY
20
2Q
FY
20
3Q
FY
20
4Q
FY
20
NSE BSE
187.
64
182.
93
198.
85
208.
94
227.
41
281.
95
371.
75
360.
82
362.
12
330.
41
423.
36
372.
54
481.
89
118.
21
178.
50
160.
37
171.
18
212.
65
305.
02
333.
34
283.
72
263.
88
302.
68
296.
45
267.
97
217.
90
0
200
400
600
800
4QF
Y17
1QF
Y18
2QF
Y18
3QF
Y18
4QF
Y18
1QF
Y19
2QF
Y19
3QF
Y19
4QF
Y19
1QF
Y20
2QF
Y20
3QF
Y20
4QF
Y20
NSE BSERs Bn
Page | 5
BSE: Results Review 4QFY20
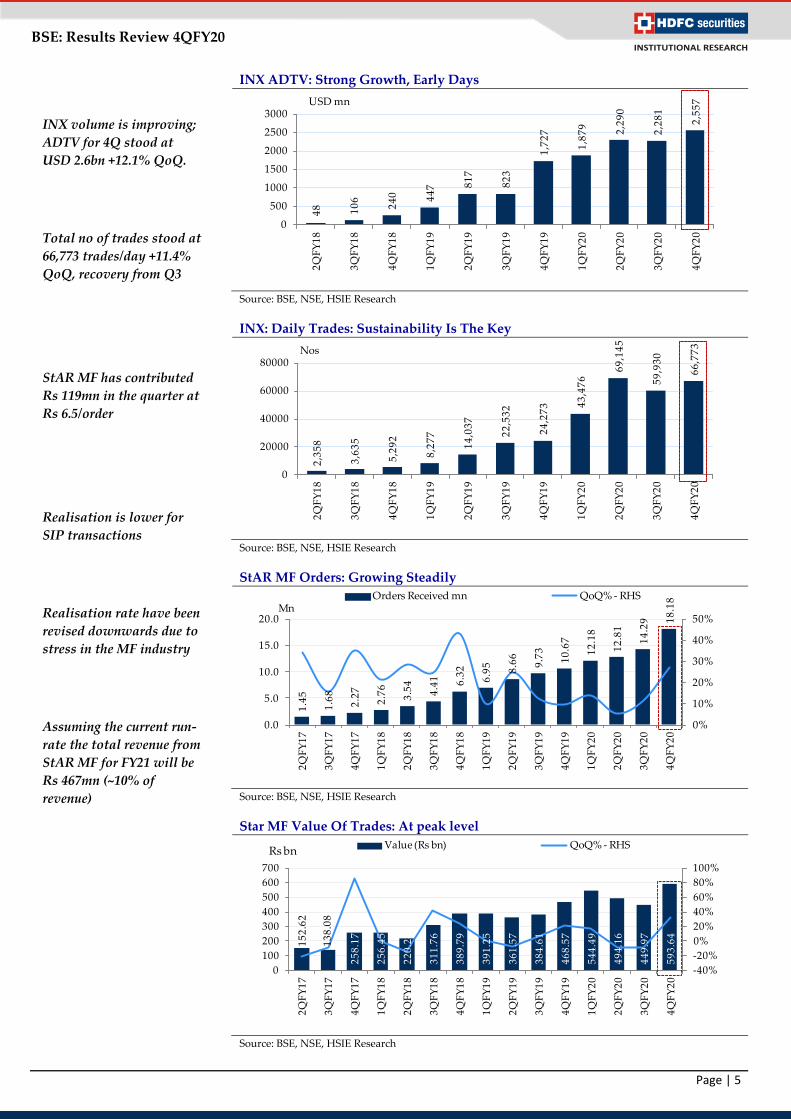
INX ADTV: Strong Growth, Early Days
Source: BSE, NSE, HSIE Research
INX: Daily Trades: Sustainability Is The Key
Source: BSE, NSE, HSIE Research
StAR MF Orders: Growing Steadily
Source: BSE, NSE, HSIE Research
Star MF Value Of Trades: At peak level
Source: BSE, NSE, HSIE Research
INX volume is improving;
ADTV for 4Q stood at
USD 2.6bn +12.1% QoQ.
Total no of trades stood at
66,773 trades/day +11.4%
QoQ, recovery from Q3
StAR MF has contributed
Rs 119mn in the quarter at
Rs 6.5/order
Realisation is lower for
SIP transactions
Realisation rate have been
revised downwards due to
stress in the MF industry
Assuming the current run-
rate the total revenue from
StAR MF for FY21 will be
Rs 467mn (~10% of
revenue)
48 10
6
24
0 44
7 81
7
82
3
1,7
27
1,8
79 2,2
90
2,2
81
2,5
57
0
500
1000
1500
2000
2500
3000
2Q
FY
18
3Q
FY
18
4Q
FY
18
1Q
FY
19
2Q
FY
19
3Q
FY
19
4Q
FY
19
1Q
FY
20
2Q
FY
20
3Q
FY
20
4Q
FY
20
USD mn
2,3
58
3,6
35
5,2
92
8,2
77
14
,03
7
22
,53
2
24
,27
3 43
,47
6
69
,14
5
59
,93
0
66
,77
3
0
20000
40000
60000
80000
2Q
FY
18
3Q
FY
18
4Q
FY
18
1Q
FY
19
2Q
FY
19
3Q
FY
19
4Q
FY
19
1Q
FY
20
2Q
FY
20
3Q
FY
20
4Q
FY
20
Nos
1.4
5
1.6
8
2.2
7
2.7
6
3.5
4
4.4
1 6.3
2
6.9
5
8.6
6
9.7
3
10
.67
12
.18
12
.81
14
.29 1
8.1
8
0%
10%
20%
30%
40%
50%
0.0
5.0
10.0
15.0
20.0
2Q
FY
17
3Q
FY
17
4Q
FY
17
1Q
FY
18
2Q
FY
18
3Q
FY
18
4Q
FY
18
1Q
FY
19
2Q
FY
19
3Q
FY
19
4Q
FY
19
1Q
FY
20
2Q
FY
20
3Q
FY
20
4Q
FY
20
Orders Received mn QoQ% - RHSMn
15
2.6
2
13
8.0
8
25
8.1
7
25
6.4
5
22
0.2
4
31
1.7
6
38
9.7
9
39
1.2
5
36
1.5
7
38
4.6
1
46
8.5
7
54
4.4
9
49
4.1
6
44
9.9
7
59
3.6
4
-40%
-20%
0%
20%
40%
60%
80%
100%
0
100
200
300
400
500
600
700
2Q
FY
17
3Q
FY
17
4Q
FY
17
1Q
FY
18
2Q
FY
18
3Q
FY
18
4Q
FY
18
1Q
FY
19
2Q
FY
19
3Q
FY
19
4Q
FY
19
1Q
FY
20
2Q
FY
20
3Q
FY
20
4Q
FY
20
Value (Rs bn) QoQ% - RHSRs bn
Page | 6
BSE: Results Review 4QFY20
BSE’s Revenue Segments & Assumptions
Segments FY15 FY16 FY17 FY18 FY19 FY20 FY21E FY22E CAGR
FY15-20
CAGR
FY17-20
CAGR
FY20-
22E
Securities services
Transaction Charges 505 550 1,224 1,581 1,139 1,193 1,302 1,697 18.8% -0.9% 19.3%
Income from Depository Services 1,046 1,227 0 0 0 0 0 0 NM NM NM
Treasury Income on margin deposit 532 413 405 408 307 215 211 206 -16.6% -19.0% -2.0%
Others 254 223 292 311 269 296 305 314 3.1% 0.4% 3.0%
Total 2,337 2,413 1,921 2,300 1,715 1,704 1,817 2,217 -6.1% -3.9% 14.1%
Growth YoY % 24.8% 3.3% -20.4% 19.7% -25.4% -0.7% 6.7% 22.0%
Securities services (ex CDSL)
Transaction Charges 505 550 1,224 1,581 1,139 1,193 1,302 1,697 18.8% -0.9% 19.3%
Treasury Income on margin deposit 532 413 405 408 307 215 211 206 -16.6% -19.0% -2.0%
Others 254 223 292 311 269 296 305 314 3.1% 0.4% 3.0%
Total 1,291 1,186 1,921 2,300 1,715 1,704 1,817 2,217 5.7% -3.9% 14.1%
Growth YoY % 28.9% -8.1% 62.0% 19.7% -25.4% -0.7% 6.7% 22.0%
Services to corporate
Listing Fees 958 1,446 1,382 1,776 1,881 1,880 2,019 2,168 14.4% 10.8% 7.4%
Book Building Software Charges 55 112 143 331 149 182 197 212 26.9% 8.3% 8.0%
Others 41 53 44 100 102 58 59 60 7.3% 9.8% 1.5%
Total 1,054 1,611 1,569 2,207 2,132 2,120 2,274 2,440 15.0% 10.6% 7.3%
Growth YoY % 78.2% 52.9% -2.6% 40.7% -3.4% -0.6% 7.3% 7.3%
Data Dissemination 221 224 447 565 656 681 702 723 25.3% 15.1% 3.0%
Growth YoY % 8.3% 1.4% 99.4% 26.4% 16.1% 3.9% 3.0% 3.0%
Total revenue from Operations 3,611 4,248 3,937 5,072 4,503 4,505 4,793 5,380 4.5% 4.6% 9.3%
Growth YoY % 35.4% 17.6% -7.3% 28.8% -11.2% 0.0% 6.4% 12.2%
Total revenue from Operations (ex
CDSL) 2,566 3,021 3,937 5,072 4,503 4,505 4,793 5,380 11.9% 4.6% 9.3%
Growth YoY % 42.8% 17.7% 30.3% 28.8% -11.2% 0.0% 6.4% 12.2%
Source: BSE, HSIE Research, ^excluding CDSL, FY15-16 Including CDSL
BSE’s Cost Analysis and EBITDA
Expenses (Including CDSL) FY14 FY15 FY16 FY17 FY18 FY19 FY20 FY21E FY22E CAGR
FY15-20
CAGR
FY17-20
CAGR
FY20-22E
Employee Expenses 854 999 1,074 1,162 1,201 1,392 1,512 1,572 1,651 8.6% 9.2% 4.5%
Technology Expenses 642 704 806 964 1,111 1,134 1,176 1,211 1,254 10.8% 6.9% 3.2%
Other operating Expenses 928 1,492 1,695 1,452 1,458 1,686 1,736 1,753 1,788 3.1% 6.1% 1.5%
Total Expenses 2,424 3,194 3,576 3,578 3,770 4,212 4,424 4,537 4,693 6.7% 7.3% 3.0%
Growth YoY % 0.1% 31.8% 11.9% 0.1% 5.4% 11.7% 5.0% 2.6% 3.4%
EDITDA (Including CDSL till
FY16) 244 417 673 359 1,302 291 81 256 687 -27.9% -39.1% 191.2%
Margin % 9.2% 11.5% 15.8% 9.1% 25.7% 6.5% 1.8% 5.3% 12.8%
Expenses (Excluding CDSL) FY14 FY15 FY16 FY17 FY18 FY19 FY20 FY21E FY22E CAGR
FY15-20
CAGR
FY17-20
CAGR
FY20-22E
Employee Expenses 679 807 859 1,162 1,201 1,392 1,512 1,572 1,651 13.4% 9.2% 4.5%
Technology + Other Operating
Expenses 1,182 1,787 2,127 2,415 2,569 2,820 2,912 2,965 3,042 10.3% 6.4% 2.2%
Total Expenses(ex CDSL) 1,862 2,593 2,986 3,578 3,770 4,212 4,424 4,537 4,693 11.3% 7.3% 3.0%
Growth YoY % -0.5% 39.3% 15.1% 19.8% 5.4% 11.7% 5.0% 2.6% 3.4%
EBITDA (ex CDSL) -83 -35 33 359 1,302 291 81 256 687 NM -39.1% 191.2%
Margin % -4.6% -1.4% 1.1% 9.1% 25.7% 6.5% 1.8% 5.3% 12.8%
Source: BSE, HSIE Research
Page | 7
BSE: Results Review 4QFY20
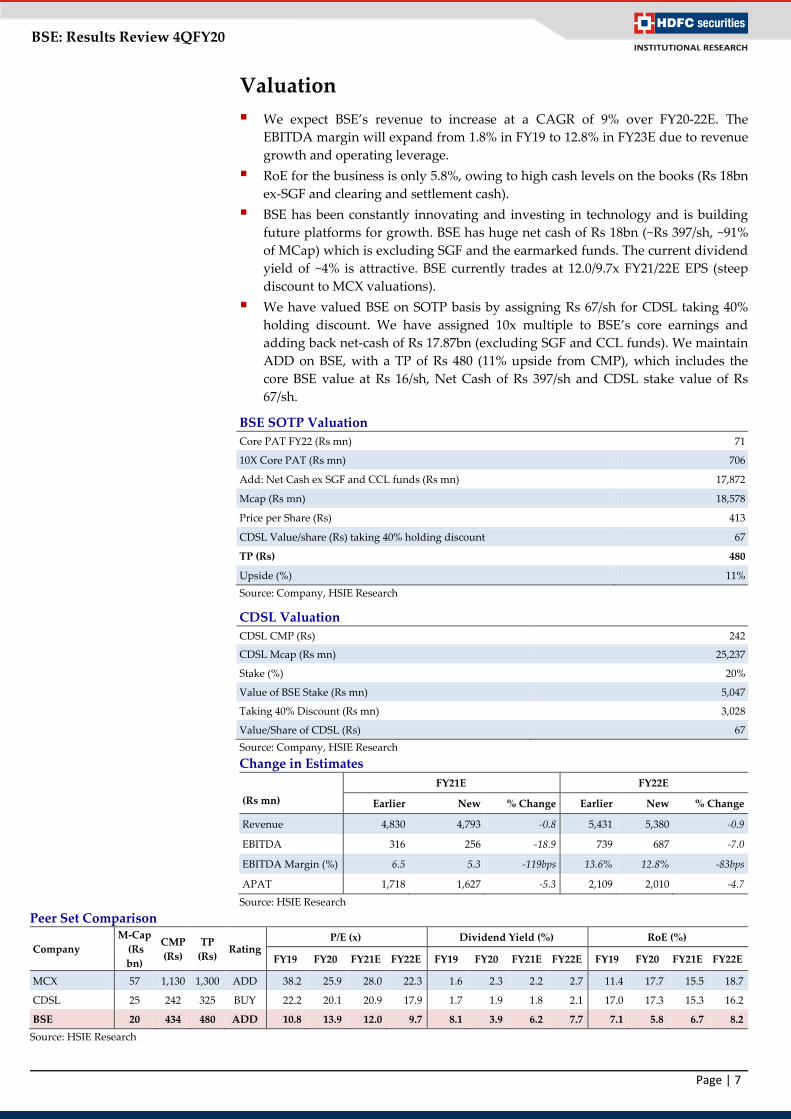
Valuation
We expect BSE’s revenue to increase at a CAGR of 9% over FY20-22E. The
EBITDA margin will expand from 1.8% in FY19 to 12.8% in FY23E due to revenue
growth and operating leverage.
RoE for the business is only 5.8%, owing to high cash levels on the books (Rs 18bn
ex-SGF and clearing and settlement cash).
BSE has been constantly innovating and investing in technology and is building
future platforms for growth. BSE has huge net cash of Rs 18bn (~Rs 397/sh, ~91%
of MCap) which is excluding SGF and the earmarked funds. The current dividend
yield of ~4% is attractive. BSE currently trades at 12.0/9.7x FY21/22E EPS (steep
discount to MCX valuations).
We have valued BSE on SOTP basis by assigning Rs 67/sh for CDSL taking 40%
holding discount. We have assigned 10x multiple to BSE’s core earnings and
adding back net-cash of Rs 17.87bn (excluding SGF and CCL funds). We maintain
ADD on BSE, with a TP of Rs 480 (11% upside from CMP), which includes the
core BSE value at Rs 16/sh, Net Cash of Rs 397/sh and CDSL stake value of Rs
67/sh.
BSE SOTP Valuation
Core PAT FY22 (Rs mn) 71
10X Core PAT (Rs mn) 706
Add: Net Cash ex SGF and CCL funds (Rs mn) 17,872
Mcap (Rs mn) 18,578
Price per Share (Rs) 413
CDSL Value/share (Rs) taking 40% holding discount 67
TP (Rs) 480
Upside (%) 11%
Source: Company, HSIE Research
CDSL Valuation
CDSL CMP (Rs) 242
CDSL Mcap (Rs mn) 25,237
Stake (%) 20%
Value of BSE Stake (Rs mn) 5,047
Taking 40% Discount (Rs mn) 3,028
Value/Share of CDSL (Rs) 67
Source: Company, HSIE Research
Change in Estimates
(Rs mn)
FY21E FY22E
Earlier New % Change Earlier New % Change
Revenue 4,830 4,793 -0.8 5,431 5,380 -0.9
EBITDA 316 256 -18.9 739 687 -7.0
EBITDA Margin (%) 6.5 5.3 -119bps 13.6% 12.8% -83bps
APAT 1,718 1,627 -5.3 2,109 2,010 -4.7
Source: HSIE Research
Peer Set Comparison
Company
M-Cap
(Rs
bn)
CMP
(Rs)
TP
(Rs) Rating
P/E (x) Dividend Yield (%) RoE (%)
FY19 FY20 FY21E FY22E FY19 FY20 FY21E FY22E FY19 FY20 FY21E FY22E
MCX 57 1,130 1,300 ADD 38.2 25.9 28.0 22.3 1.6 2.3 2.2 2.7 11.4 17.7 15.5 18.7
CDSL 25 242 325 BUY 22.2 20.1 20.9 17.9 1.7 1.9 1.8 2.1 17.0 17.3 15.3 16.2
BSE 20 434 480 ADD 10.8 13.9 12.0 9.7 8.1 3.9 6.2 7.7 7.1 5.8 6.7 8.2
Source: HSIE Research
Page | 8
BSE: Results Review 4QFY20
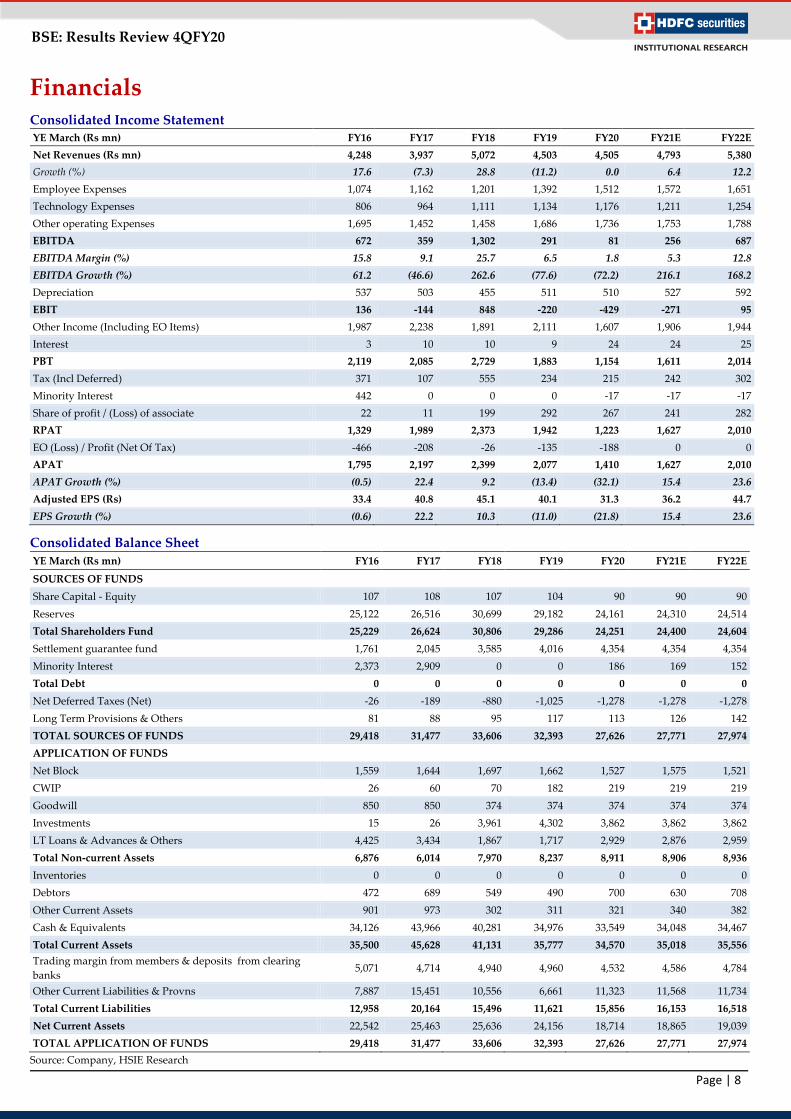
Financials Consolidated Income Statement YE March (Rs mn) FY16 FY17 FY18 FY19 FY20 FY21E FY22E
Net Revenues (Rs mn) 4,248 3,937 5,072 4,503 4,505 4,793 5,380
Growth (%) 17.6 (7.3) 28.8 (11.2) 0.0 6.4 12.2
Employee Expenses 1,074 1,162 1,201 1,392 1,512 1,572 1,651
Technology Expenses 806 964 1,111 1,134 1,176 1,211 1,254
Other operating Expenses 1,695 1,452 1,458 1,686 1,736 1,753 1,788
EBITDA 672 359 1,302 291 81 256 687
EBITDA Margin (%) 15.8 9.1 25.7 6.5 1.8 5.3 12.8
EBITDA Growth (%) 61.2 (46.6) 262.6 (77.6) (72.2) 216.1 168.2
Depreciation 537 503 455 511 510 527 592
EBIT 136 -144 848 -220 -429 -271 95
Other Income (Including EO Items) 1,987 2,238 1,891 2,111 1,607 1,906 1,944
Interest 3 10 10 9 24 24 25
PBT 2,119 2,085 2,729 1,883 1,154 1,611 2,014
Tax (Incl Deferred) 371 107 555 234 215 242 302
Minority Interest 442 0 0 0 -17 -17 -17
Share of profit / (Loss) of associate 22 11 199 292 267 241 282
RPAT 1,329 1,989 2,373 1,942 1,223 1,627 2,010
EO (Loss) / Profit (Net Of Tax) -466 -208 -26 -135 -188 0 0
APAT 1,795 2,197 2,399 2,077 1,410 1,627 2,010
APAT Growth (%) (0.5) 22.4 9.2 (13.4) (32.1) 15.4 23.6
Adjusted EPS (Rs) 33.4 40.8 45.1 40.1 31.3 36.2 44.7
EPS Growth (%) (0.6) 22.2 10.3 (11.0) (21.8) 15.4 23.6
Consolidated Balance Sheet
YE March (Rs mn) FY16 FY17 FY18 FY19 FY20 FY21E FY22E
SOURCES OF FUNDS
Share Capital - Equity 107 108 107 104 90 90 90
Reserves 25,122 26,516 30,699 29,182 24,161 24,310 24,514
Total Shareholders Fund 25,229 26,624 30,806 29,286 24,251 24,400 24,604
Settlement guarantee fund 1,761 2,045 3,585 4,016 4,354 4,354 4,354
Minority Interest 2,373 2,909 0 0 186 169 152
Total Debt 0 0 0 0 0 0 0
Net Deferred Taxes (Net) -26 -189 -880 -1,025 -1,278 -1,278 -1,278
Long Term Provisions & Others 81 88 95 117 113 126 142
TOTAL SOURCES OF FUNDS 29,418 31,477 33,606 32,393 27,626 27,771 27,974
APPLICATION OF FUNDS
Net Block 1,559 1,644 1,697 1,662 1,527 1,575 1,521
CWIP 26 60 70 182 219 219 219
Goodwill 850 850 374 374 374 374 374
Investments 15 26 3,961 4,302 3,862 3,862 3,862
LT Loans & Advances & Others 4,425 3,434 1,867 1,717 2,929 2,876 2,959
Total Non-current Assets 6,876 6,014 7,970 8,237 8,911 8,906 8,936
Inventories 0 0 0 0 0 0 0
Debtors 472 689 549 490 700 630 708
Other Current Assets 901 973 302 311 321 340 382
Cash & Equivalents 34,126 43,966 40,281 34,976 33,549 34,048 34,467
Total Current Assets 35,500 45,628 41,131 35,777 34,570 35,018 35,556
Trading margin from members & deposits from clearing
banks 5,071 4,714 4,940 4,960 4,532 4,586 4,784
Other Current Liabilities & Provns 7,887 15,451 10,556 6,661 11,323 11,568 11,734
Total Current Liabilities 12,958 20,164 15,496 11,621 15,856 16,153 16,518
Net Current Assets 22,542 25,463 25,636 24,156 18,714 18,865 19,039
TOTAL APPLICATION OF FUNDS 29,418 31,477 33,606 32,393 27,626 27,771 27,974
Source: Company, HSIE Research
Page | 9
BSE: Results Review 4QFY20
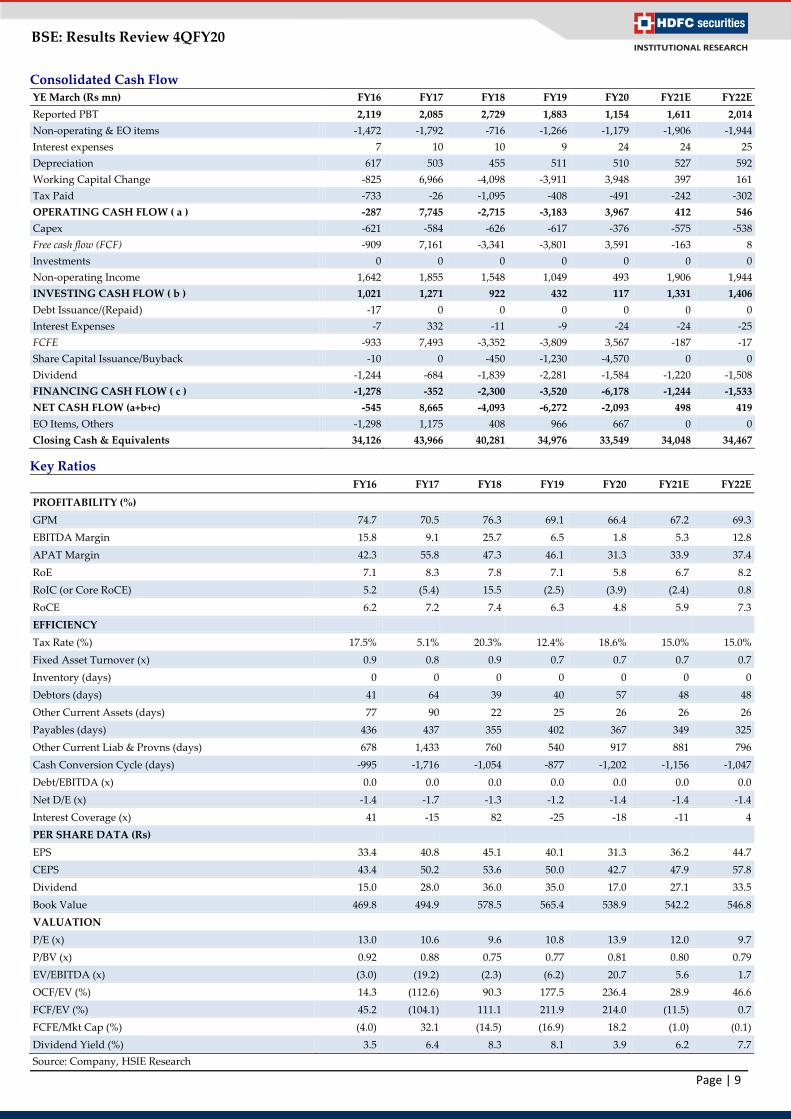
Consolidated Cash Flow YE March (Rs mn) FY16 FY17 FY18 FY19 FY20 FY21E FY22E
Reported PBT 2,119 2,085 2,729 1,883 1,154 1,611 2,014
Non-operating & EO items -1,472 -1,792 -716 -1,266 -1,179 -1,906 -1,944
Interest expenses 7 10 10 9 24 24 25
Depreciation 617 503 455 511 510 527 592
Working Capital Change -825 6,966 -4,098 -3,911 3,948 397 161
Tax Paid -733 -26 -1,095 -408 -491 -242 -302
OPERATING CASH FLOW ( a ) -287 7,745 -2,715 -3,183 3,967 412 546
Capex -621 -584 -626 -617 -376 -575 -538
Free cash flow (FCF) -909 7,161 -3,341 -3,801 3,591 -163 8
Investments 0 0 0 0 0 0 0
Non-operating Income 1,642 1,855 1,548 1,049 493 1,906 1,944
INVESTING CASH FLOW ( b ) 1,021 1,271 922 432 117 1,331 1,406
Debt Issuance/(Repaid) -17 0 0 0 0 0 0
Interest Expenses -7 332 -11 -9 -24 -24 -25
FCFE -933 7,493 -3,352 -3,809 3,567 -187 -17
Share Capital Issuance/Buyback -10 0 -450 -1,230 -4,570 0 0
Dividend -1,244 -684 -1,839 -2,281 -1,584 -1,220 -1,508
FINANCING CASH FLOW ( c ) -1,278 -352 -2,300 -3,520 -6,178 -1,244 -1,533
NET CASH FLOW (a+b+c) -545 8,665 -4,093 -6,272 -2,093 498 419
EO Items, Others -1,298 1,175 408 966 667 0 0
Closing Cash & Equivalents 34,126 43,966 40,281 34,976 33,549 34,048 34,467
Key Ratios
FY16 FY17 FY18 FY19 FY20 FY21E FY22E
PROFITABILITY (%)
GPM 74.7 70.5 76.3 69.1 66.4 67.2 69.3
EBITDA Margin 15.8 9.1 25.7 6.5 1.8 5.3 12.8
APAT Margin 42.3 55.8 47.3 46.1 31.3 33.9 37.4
RoE 7.1 8.3 7.8 7.1 5.8 6.7 8.2
RoIC (or Core RoCE) 5.2 (5.4) 15.5 (2.5) (3.9) (2.4) 0.8
RoCE 6.2 7.2 7.4 6.3 4.8 5.9 7.3
EFFICIENCY
Tax Rate (%) 17.5% 5.1% 20.3% 12.4% 18.6% 15.0% 15.0%
Fixed Asset Turnover (x) 0.9 0.8 0.9 0.7 0.7 0.7 0.7
Inventory (days) 0 0 0 0 0 0 0
Debtors (days) 41 64 39 40 57 48 48
Other Current Assets (days) 77 90 22 25 26 26 26
Payables (days) 436 437 355 402 367 349 325
Other Current Liab & Provns (days) 678 1,433 760 540 917 881 796
Cash Conversion Cycle (days) -995 -1,716 -1,054 -877 -1,202 -1,156 -1,047
Debt/EBITDA (x) 0.0 0.0 0.0 0.0 0.0 0.0 0.0
Net D/E (x) -1.4 -1.7 -1.3 -1.2 -1.4 -1.4 -1.4
Interest Coverage (x) 41 -15 82 -25 -18 -11 4
PER SHARE DATA (Rs)
EPS 33.4 40.8 45.1 40.1 31.3 36.2 44.7
CEPS 43.4 50.2 53.6 50.0 42.7 47.9 57.8
Dividend 15.0 28.0 36.0 35.0 17.0 27.1 33.5
Book Value 469.8 494.9 578.5 565.4 538.9 542.2 546.8
VALUATION
P/E (x) 13.0 10.6 9.6 10.8 13.9 12.0 9.7
P/BV (x) 0.92 0.88 0.75 0.77 0.81 0.80 0.79
EV/EBITDA (x) (3.0) (19.2) (2.3) (6.2) 20.7 5.6 1.7
OCF/EV (%) 14.3 (112.6) 90.3 177.5 236.4 28.9 46.6
FCF/EV (%) 45.2 (104.1) 111.1 211.9 214.0 (11.5) 0.7
FCFE/Mkt Cap (%) (4.0) 32.1 (14.5) (16.9) 18.2 (1.0) (0.1)
Dividend Yield (%) 3.5 6.4 8.3 8.1 3.9 6.2 7.7
Source: Company, HSIE Research
Page | 10
BSE: Results Review 4QFY20
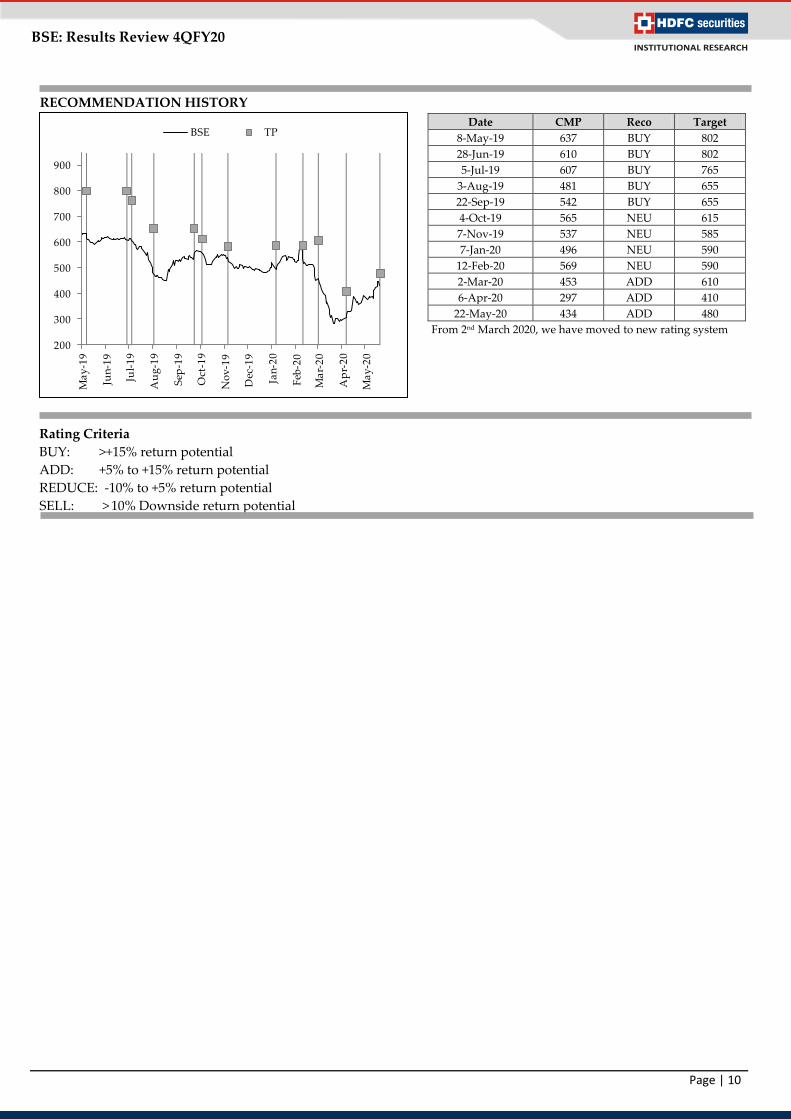
Rating Criteria
BUY: >+15% return potential
ADD: +5% to +15% return potential
REDUCE: -10% to +5% return potential
SELL: > 10% Downside return potential
Date CMP Reco Target
8-May-19 637 BUY 802
28-Jun-19 610 BUY 802
5-Jul-19 607 BUY 765
3-Aug-19 481 BUY 655
22-Sep-19 542 BUY 655
4-Oct-19 565 NEU 615
7-Nov-19 537 NEU 585
7-Jan-20 496 NEU 590
12-Feb-20 569 NEU 590
2-Mar-20 453 ADD 610
6-Apr-20 297 ADD 410
22-May-20 434 ADD 480
From 2nd March 2020, we have moved to new rating system
RECOMMENDATION HISTORY
200
300
400
500
600
700
800
900
Ma
y-1
9
Jun
-19
Jul-
19
Au
g-1
9
Sep
-19
Oct
-19
No
v-1
9
Dec
-19
Jan
-20
Feb
-20
Ma
r-2
0
Ap
r-2
0
Ma
y-2
0
BSE TP
Page | 11
BSE: Results Review 4QFY20
Disclosure:
We, Amit Chandra, MBA & Vinesh Vala, MBA, authors and the names subscribed to this report, hereby certify that all of the views expressed in this research
report accurately reflect our views about the subject issuer(s) or securities. HSL has no material adverse disciplinary history as on the date of publication of this
report. We also certify that no part of our compensation was, is, or will be directly or indirectly related to the specific recommendation(s) or view(s) in this
report.
Research Analyst or his/her relative or HDFC Securities Ltd. does not have any financial interest in the subject company. Also Research Analyst or his relative
or HDFC Securities Ltd. or its Associate may have beneficial ownership of 1% or more in the subject company at the end of the month immediately preceding
the date of publication of the Research Report. Further Research Analyst or his relative or HDFC Securities Ltd. or its associate does not have any material
conflict of interest.
Any holding in stock –No
HDFC Securities Limited (HSL) is a SEBI Registered Research Analyst having registration no. INH000002475.
Disclaimer:
This report has been prepared by HDFC Securities Ltd and is solely for information of the recipient only. The report must not be used as a singular basis of any
investment decision. The views herein are of a general nature and do not consider the risk appetite or the particular circumstances of an individual investor;
readers are requested to take professional advice before investing. Nothing in this document should be construed as investment advice. Each recipient of this
document should make such investigations as they deem necessary to arrive at an independent evaluation of an investment in securities of the companies
referred to in this document (including merits and risks) and should consult their own advisors to determine merits and risks of such investment. The
information and opinions contained herein have been compiled or arrived at, based upon information obtained in good faith from sources believed to be
reliable. Such information has not been independently verified and no guaranty, representation of warranty, express or implied, is made as to its accuracy,
completeness or correctness. All such information and opinions are subject to change without notice. Descriptions of any company or companies or their
securities mentioned herein are not intended to be complete. HSL is not obliged to update this report for such changes. HSL has the right to make changes and
modifications at any time.
This report is not directed to, or intended for display, downloading, printing, reproducing or for distribution to or use by, any person or entity who is a citizen
or resident or located in any locality, state, country or other jurisdiction where such distribution, publication, reproduction, availability or use would be
contrary to law or regulation or what would subject HSL or its affiliates to any registration or licensing requirement within such jurisdiction.
If this report is inadvertently sent or has reached any person in such country, especially, United States of America, the same should be ignored and brought to
the attention of the sender. This document may not be reproduced, distributed or published in whole or in part, directly or indirectly, for any purposes or in
any manner.
Foreign currencies denominated securities, wherever mentioned, are subject to exchange rate fluctuations, which could have an adverse effect on their value or
price, or the income derived from them. In addition, investors in securities such as ADRs, the values of which are influenced by foreign currencies effectively
assume currency risk. It should not be considered to be taken as an offer to sell or a solicitation to buy any security.
This document is not, and should not, be construed as an offer or solicitation of an offer, to buy or sell any securities or other financial instruments. This report
should not be construed as an invitation or solicitation to do business with HSL. HSL may from time to time solicit from, or perform broking, or other services
for, any company mentioned in this mail and/or its attachments.
HSL and its affiliated company(ies), their directors and employees may; (a) from time to time, have a long or short position in, and buy or sell the securities of
the company(ies) mentioned herein or (b) be engaged in any other transaction involving such securities and earn brokerage or other compensation or act as a
market maker in the financial instruments of the company(ies) discussed herein or act as an advisor or lender/borrower to such company(ies) or may have any
other potential conflict of interests with respect to any recommendation and other related information and opinions.
HSL, its directors, analysts or employees do not take any responsibility, financial or otherwise, of the losses or the damages sustained due to the investments
made or any action taken on basis of this report, including but not restricted to, fluctuation in the prices of shares and bonds, changes in the currency rates,
diminution in the NAVs, reduction in the dividend or income, etc.
HSL and other group companies, its directors, associates, employees may have various positions in any of the stocks, securities and financial instruments dealt
in the report, or may make sell or purchase or other deals in these securities from time to time or may deal in other securities of the companies / organizations
described in this report.
HSL or its associates might have managed or co-managed public offering of securities for the subject company or might have been mandated by the subject
company for any other assignment in the past twelve months.
HSL or its associates might have received any compensation from the companies mentioned in the report during the period preceding twelve months from t
hedate of this report for services in respect of managing or co-managing public offerings, corporate finance, investment banking or merchant banking,
brokerage services or other advisory service in a merger or specific transaction in the normal course of business.
HSL or its analysts did not receive any compensation or other benefits from the companies mentioned in the report or third party in connection with
preparation of the research report. Accordingly, neither HSL nor Research Analysts have any material conflict of interest at the time of publication of this
report. Compensation of our Research Analysts is not based on any specific merchant banking, investment banking or brokerage service transactions. HSL may
have issued other reports that are inconsistent with and reach different conclusion from the information presented in this report.
Research entity has not been engaged in market making activity for the subject company. Research analyst has not served as an officer, director or employee of
the subject company. We have not received any compensation/benefits from the subject company or third party in connection with the Research Report.
HDFC securities Limited, I Think Techno Campus, Building - B, "Alpha", Office Floor 8, Near Kanjurmarg Station, Opp. Crompton Greaves, Kanjurmarg
(East), Mumbai 400 042 Phone: (022) 3075 3400 Fax: (022) 2496 5066 Compliance Officer: Binkle R. Oza Email: [email protected] Phone: (022)
3045 3600
HDFC Securities Limited, SEBI Reg. No.: NSE, BSE, MSEI, MCX: INZ000186937; AMFI Reg. No. ARN: 13549; PFRDA Reg. No. POP: 11092018; IRDA
Corporate Agent License No.: CA0062; SEBI Research Analyst Reg. No.: INH000002475; SEBI Investment Adviser Reg. No.: INA000011538; CIN -
U67120MH2000PLC152193
HDFC securities
Institutional Equities
Unit No. 1602, 16th Floor, Tower A, Peninsula Business Park,
Senapati Bapat Marg, Lower Parel, Mumbai - 400 013
Board: +91-22-6171-7330 www.hdfcsec.com
Top Related