


Languages
Pages
Legal


2014 Impact Report
BUSINESS SOLUTIONS TO POVERTY 2TECHNOSERVE | 2014 IMPACT REPORT
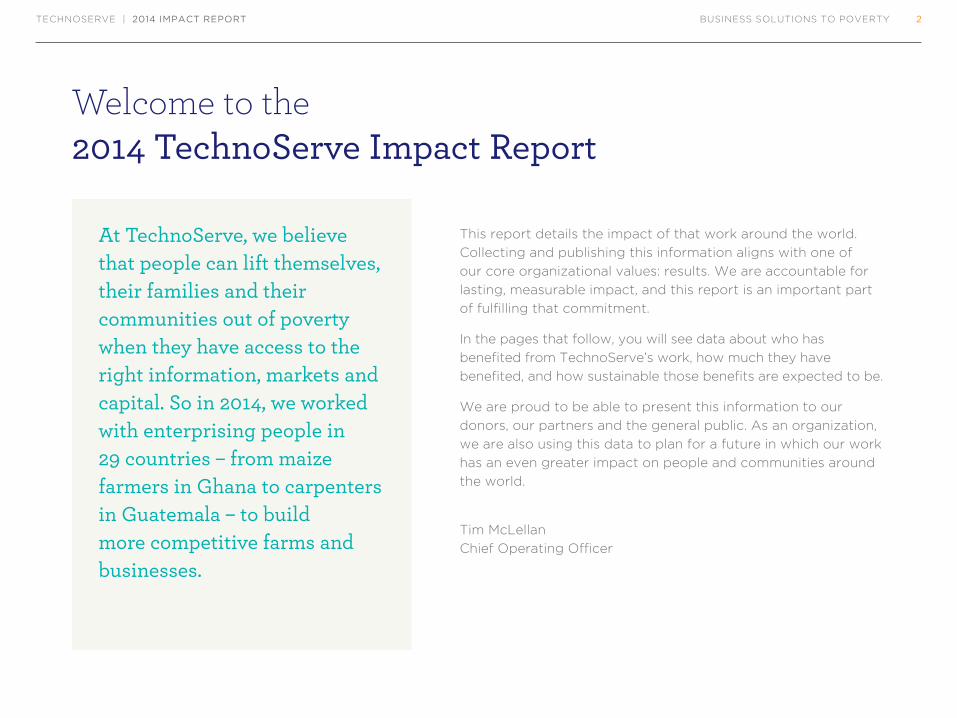
This report details the impact of that work around the world.
Collecting and publishing this information aligns with one of
our core organizational values: results. We are accountable for
lasting, measurable impact, and this report is an important part
of fulfilling that commitment.
In the pages that follow, you will see data about who has
benefited from TechnoServe’s work, how much they have
benefited, and how sustainable those benefits are expected to be.
We are proud to be able to present this information to our
donors, our partners and the general public. As an organization,
we are also using this data to plan for a future in which our work
has an even greater impact on people and communities around
the world.
Tim McLellan
Chief Operating Officer
Welcome to the 2014 TechnoServe Impact Report
At TechnoServe, we believe that people can lift themselves, their families and their communities out of poverty when they have access to the right information, markets and capital. So in 2014, we worked with enterprising people in 29 countries – from maize farmers in Ghana to carpenters in Guatemala – to build more competitive farms and businesses.
BUSINESS SOLUTIONS TO POVERTY 3TECHNOSERVE | 2014 IMPACT REPORT
A Year in Review: 2014 Impact Summary

$23,887,985New Finance Mobilized
by TechnoServe beneficiaries
2014 in Review
333,748Farmers, Businesses and Employees
benefiting directly from
TechnoServe’s work
$61,404,152Added Revenue and Wages
for TechnoServe beneficiaries
BUSINESS SOLUTIONS TO POVERTY 4TECHNOSERVE | 2014 IMPACT REPORT

BUSINESS SOLUTIONS TO POVERTY 5TECHNOSERVE | 2014 IMPACT REPORT
Reach: Who benefited from our work?
SEX
325,152 Farmers
2,986 Businesses
5,610 New Jobs
192,119 Male
107,025 Female
34,604 Unreported*
Definition of Reach: We work
with enterprising people in
the developing world to build
competitive farms, businesses and
industries. To measure our progress
against this mission, we count
farmers and businesses that are
better off because of TechnoServe
interventions, as well as newly
created jobs.182,023 East Africa
6,160 Asia
39,404 Latin America and the Caribbean
106,161 West and Southern Africa
REGION
TOTAL REACH BY
BENEFICIARY TYPE
*Unreported indicates that sex-disaggregated data was unavailable
333,748Total Reach
BUSINESS SOLUTIONS TO POVERTY 6TECHNOSERVE | 2014 IMPACT REPORT
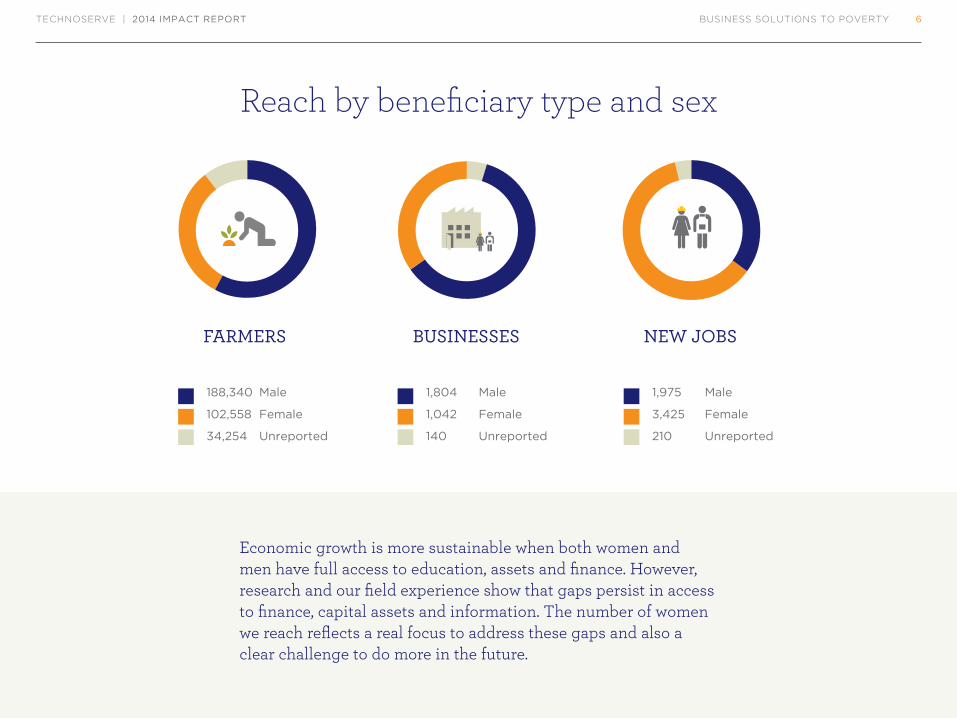
Reach by beneficiary type and sex
Economic growth is more sustainable when both women and men have full access to education, assets and finance. However, research and our field experience show that gaps persist in access to finance, capital assets and information. The number of women we reach reflects a real focus to address these gaps and also a clear challenge to do more in the future.
188,340 Male
102,558 Female
34,254 Unreported
1,804 Male
1,042 Female
140 Unreported
1,975 Male
3,425 Female
210 Unreported
FARMERS BUSINESSES NEW JOBS
BUSINESS SOLUTIONS TO POVERTY 7TECHNOSERVE | 2014 IMPACT REPORT
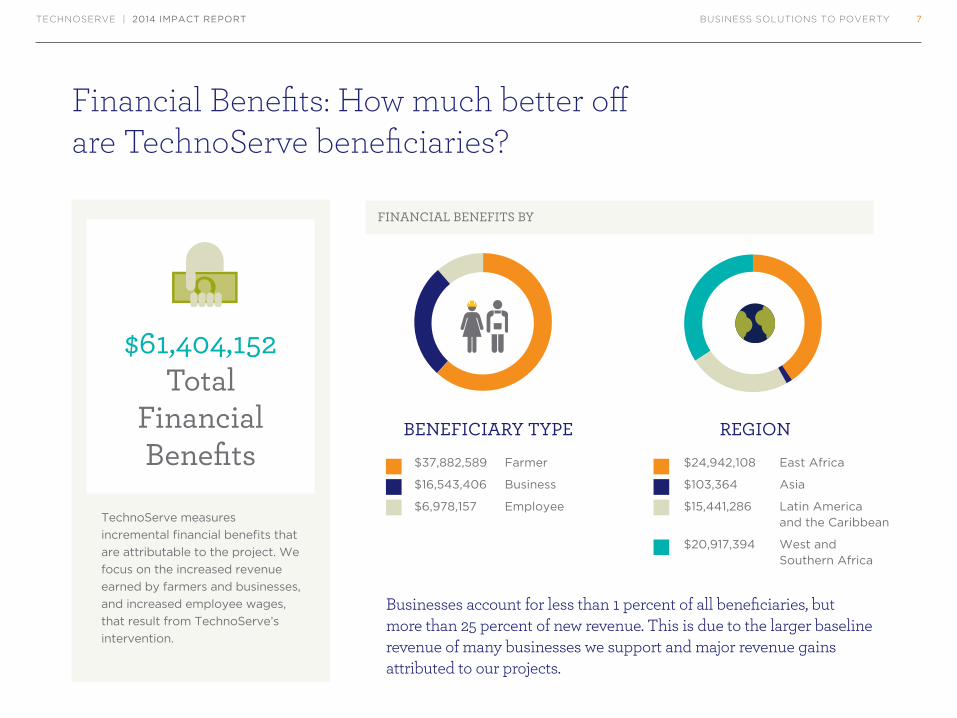
Financial Benefits: How much better off are TechnoServe beneficiaries?
$24,942,108 East Africa
$103,364 Asia
$15,441,286 Latin America and the Caribbean
$20,917,394 West and Southern Africa
$37,882,589 Farmer
$16,543,406 Business
$6,978,157 Employee
REGIONBENEFICIARY TYPE
$61,404,152Total
Financial Benefits
Businesses account for less than 1 percent of all beneficiaries, but more than 25 percent of new revenue. This is due to the larger baseline revenue of many businesses we support and major revenue gains attributed to our projects.
TechnoServe measures
incremental financial benefits that
are attributable to the project. We
focus on the increased revenue
earned by farmers and businesses,
and increased employee wages,
that result from TechnoServe’s
intervention.
FINANCIAL BENEFITS BY

BUSINESS SOLUTIONS TO POVERTY 8TECHNOSERVE | 2014 IMPACT REPORT
Sustainability: How much finance was mobilized by beneficiaries?
$7,154,015 East Africa
$311,309 Asia
$9,831,846 Latin America and the Caribbean
$6,590,815 West and Southern Africa
$11,206,370 Farmer
$12,681,615 Business
REGIONBENEFICIARY TYPE
$23,887,985Total Finance
Mobilized
We use finance mobilized as one
proxy for sustainability. Finance
in the form of private sector debt,
equity and quasi-equity investment
in the farms, businesses and
industries we support serves as an
indicator of whether the benefits
created through our work are likely
to be sustained.
FINANCE MOBILIZED BY
2012-2014Year-over-Year Data

BUSINESS SOLUTIONS TO POVERTY 10TECHNOSERVE | 2014 IMPACT REPORT
Key Indicators, 2012-2014
HEADLINE INDICATORS
Female Reach
Total Reach Total Financial Benefits
600 K
500 K
400 K
300 K
200 K
100 K
0
$80 M
$70 M
$60 M
$50 M
$40 M
$30 M
$20 M
$10 M
$0
2012 20122013 20132014 2014
598
,013
$67,
446,
327
$58,
546,
832
$61,
404,
152
335,
914
333,
748
107,
025
84,3
82
114,
888

BUSINESS SOLUTIONS TO POVERTY 11TECHNOSERVE | 2014 IMPACT REPORT
2012-2014 Year-over-Year Analysis: Farmers
The declining reach from 2012 to 2014 reflects the completion of three major farmer projects in 2012 and 2013.
HIGHLIGHT: FARMERS ADOPTING PROMOTED PRACTICES
600 K
500 K
400 K
300 K
200 K
100 K
0
2012
To
tal:
55
8, 4
64
2013
To
tal:
274
,229
2014
To
tal:
24
8,5
59
233,
050
82,034
195,
408
50,760
Coffee Initiative
East Africa Dairy Development
Tanzania Cotton
All other projects
Indicator 2012 2013 2014
Participating Farmers Adopting Technoserve-Promoted Practices
558,464 274,229 248,559
Farmers Linked to TechnoServe- Supported Businesses
28,320 48,273 76,593
Farmer Incremental Revenue $38,833,816 $30,158,509 $37,882,589
Incremental Revenue per Farmer* $70 $110 $152
*Revenue per farmer is calculated using farmers adopting new practices only.

BUSINESS SOLUTIONS TO POVERTY 12TECHNOSERVE | 2014 IMPACT REPORT
2012-2014 Year-over-Year Analysis: Businesses and Employees
Indicator 2012 2013 2014
Businesses Male Owned / Operated
474 1,737 1,804
Businesses Female Owned / Operated
774 1,530 1,042
Businesses Undefined Owned / Operated
352 374 140
Incremental Business Revenue $21,505,905 $20,179,693 $16,543,406
Incremental Revenue per Business $13,441 $5,542 $5,540
New Employees - Male 4,440 6,538 1,975
New Employees - Female 4,841 2,626 3,425
New Employees - Unreported 348 607 210
Incremental Wages $7,106,606 $8,208,630 $6,978,157
Many of the observed changes in TechnoServe’s business reach and incre-mental revenue reflect our growing focus on youth-oriented programs that work with very small businesses and startups. Meanwhile, the growth in female employment relative to male employment in 2014 is linked to a large project that specifically targeted women, as well as the increasing participation of women in other projects driving job creation. This reflects a deliberate effort by TechnoServe to increase the percentage of our beneficiaries who are women.

BUSINESS SOLUTIONS TO POVERTY 13TECHNOSERVE | 2014 IMPACT REPORT
2012-2014 Year-over-Year Analysis: Finance Mobilized
Indicator 2012 2013 2014
Finance Mobilized By Businesses
$21,769,391 $28,379,792 $12,681,615
Finance MobilizedBy Farmers
$24,673,783 $4,682,931 $11,206,370
Total Finance Mobilized $46,443,174 $33,062,723 $23,887,985
In each year, total finance mobilized – a proxy we use to measure lasting impact – is largely concentrated within a small handful of projects. The year-over-year variability reflects not only changes in TechnoServe’s portfolio of projects, but also the life cycle of those projects, since most finance is mobilized as a program nears completion.

TECHNOSERVE | 2014 IMPACT REPORT
1120 19th Street NW, 8th Floor
Washington, DC 20036
TEL: + 1 202 785 4515
technoserve.org
TechnoServe works with enterprising people in the developing world to build competitive farms, businesses and industries. We are a nonprofit organization that develops business solutions to poverty by linking people to information, capital and markets. Our work is rooted in the idea that given the opportunity, hardworking men and women in even the poorest places can generate income, jobs and wealth for their families and communities. With more than four decades of proven results, we believe in the power of private enterprise to transform lives.
Top Related