


Languages
Pages
Legal

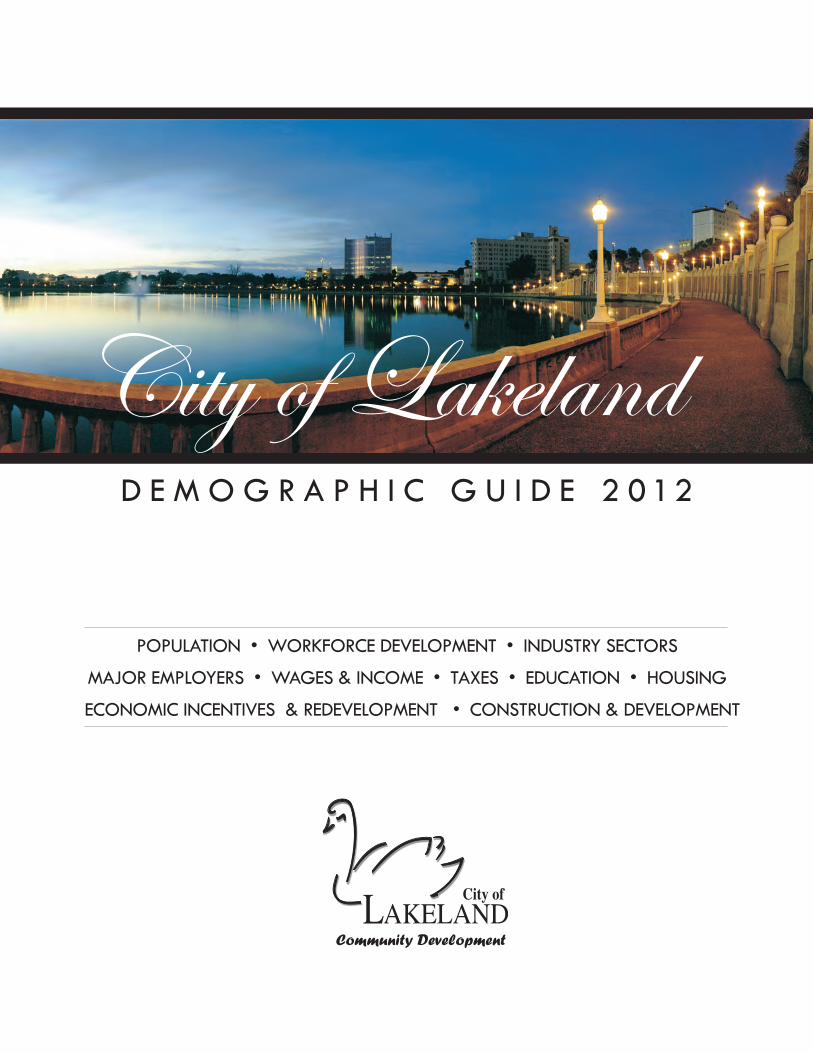
City of LakelandD E M O G R A P H I C G U I D E 2 0 12
POPULATION • WORKFORCE DEVELOPMENT • INDUSTRY SECTORS
MAJOR EMPLOYERS • WAGES & INCOME • TAXES • EDUCATION • HOUSING
ECONOMIC INCENTIVES & REDEVELOPMENT • CONSTRUCTION & DEVELOPMENT
Community Development
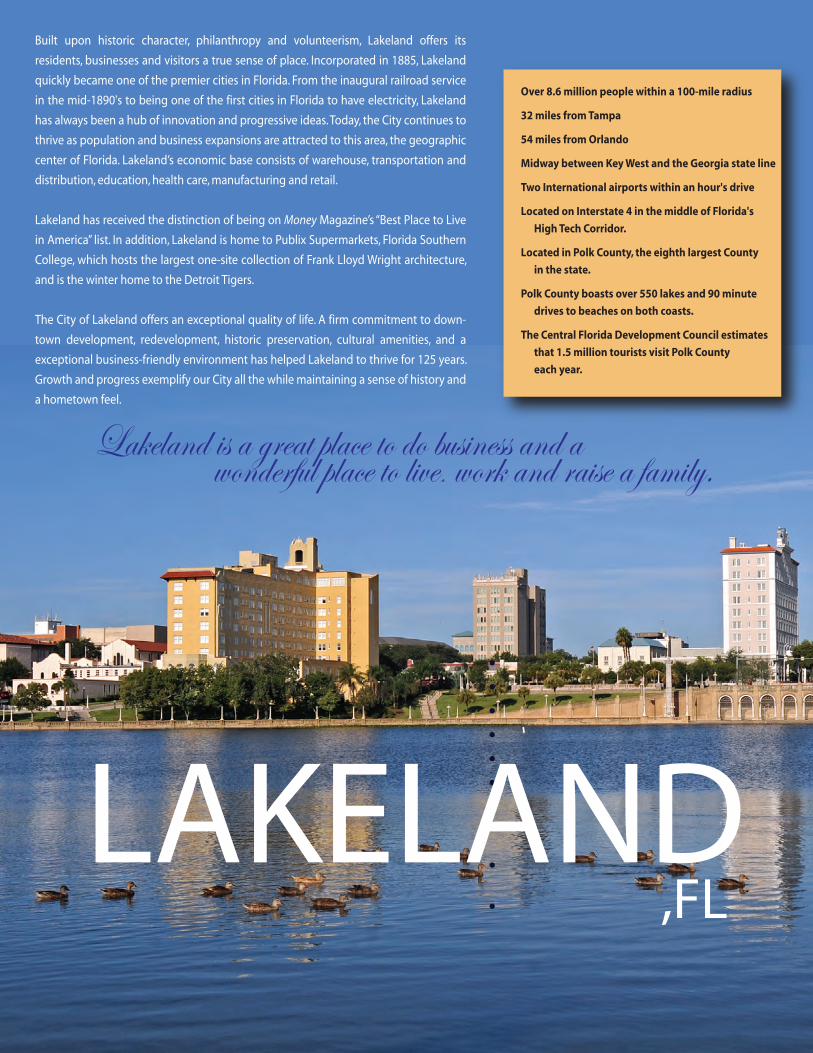
Built upon historic character, philanthropy and volunteerism, Lakeland offers its
residents, businesses and visitors a true sense of place. Incorporated in 1885, Lakeland
quickly became one of the premier cities in Florida. From the inaugural railroad service
in the mid-1890's to being one of the first cities in Florida to have electricity, Lakeland
has always been a hub of innovation and progressive ideas. Today, the City continues to
thrive as population and business expansions are attracted to this area, the geographic
center of Florida. Lakeland’s economic base consists of warehouse, transportation and
distribution, education, health care, manufacturing and retail.
Lakeland has received the distinction of being on Money Magazine’s “Best Place to Live
in America” list. In addition, Lakeland is home to Publix Supermarkets, Florida Southern
College, which hosts the largest one-site collection of Frank Lloyd Wright architecture,
and is the winter home to the Detroit Tigers.
The City of Lakeland offers an exceptional quality of life. A firm commitment to down-
town development, redevelopment, historic preservation, cultural amenities, and a
exceptional business-friendly environment has helped Lakeland to thrive for 125 years.
Growth and progress exemplify our City all the while maintaining a sense of history and
a hometown feel.
Lakeland is a great place to do business and a wonderful place to live, work and raise a family.
Over 8.6 million people within a 100-mile radius
32 miles from Tampa
54 miles from Orlando
Midway between Key West and the Georgia state line
Two International airports within an hour's drive
Located on Interstate 4 in the middle of Florida's
High Tech Corridor.
Located in Polk County, the eighth largest County
in the state.
Polk County boasts over 550 lakes and 90 minute
drives to beaches on both coasts.
The Central Florida Development Council estimates
that 1.5 million tourists visit Polk County
each year.
LAKELAND,FL

Table of ContentsEconomic & Demographic Snapshot............................................................................................................. 4
Population .............................................................................................................................................................. 5 Workforce Development .................................................................................................................................. 7 Industry Sectors.................................................................................................................................................... 8 Major Employers................................................................................................................................................... 9 Wages & Income.................................................................................................................................................10 Taxes ...................................................................................................................................................................... 11
Education.............................................................................................................................................................. 13 Economic Incentives and Redevelopment .............................................................................................. 14
Housing ................................................................................................................................................................ 16
Construction and Development................................................................................................................... 17
LAKELANDCNNMoney.com Ranked Lakeland 9th on
their list of Top 10 Turnaround towns for 2012.
2

Economic & Demographic SnapshotPOPULATION Source City of Lakeland Population (2011) 97,690 BEBR
Lakeland Electric Service Area (2011) 254,283 Lakeland Electric
Polk County Population (2011) 604,792 BEBR
State of Florida Population (2011) 18,905,048 BEBR
CITY OF LAKELAND Source Total Number of Households (2011 Est.) 38,248 Claritas
Average Household Income (2011 Est.) $51,760 Claritas
Median Household Income (2011 Est.) $38,430 Claritas
Lakeland Per Capita Buying Income (2011 Est.) $21,973 Claritas
Lakeland Labor Force (2011) 42,958 AWI
Employed (2011) 38,199 AWI
Unemployed (2011) 4,759 AWI
Lakeland Unemployment (2011) 11.10% AWI
Lakeland Private Employment (2011) 37,483 BLS
Average Home Sales Price (2011) $106,090 Mid Florida Regional MLS
Single Family Permits (2011) 115 City of Lakeland
Multi-Family Permits (2011) 6 City of Lakeland
Warehouse/Industrial Square Feet Permitted (2011) 890,718 City of Lakeland
Commercial Square Feet Permitted (2011) 11,522 City of Lakeland
Retail Square Feet Permitted (2011) 50,031 City of Lakeland
Sources:University of Florida Bureau of Economic & Business Research (BEBR)
Bureau of Labor & Statistics (BLS)
Claritas Market Place 2011
Lakeland Economic Development Council (LEDC)
Mid Florida Regional MLS
Florida Agency for Workforce Innovation (AWI)
City of Lakeland Historical Size and Population
Year Population Size in Square Miles
1960 41,350 16.78
1970 42,803 17.17
1980 47,406 20.59
1990 70,576 44.23
1995 74,626 50.55
2000 78,452 51.91
2001 82,942 54.15
2002 87,150 67.54
2003 88,741 67.60
2004 89,731 69.94
2005 90,851 71.38
2006 91,623 72.17
2007 93,428 73.41
2008 93,508 74.33
2009 94,163 74.40
2010 97,422 74.48
2011 97,690 74.62
3photo credit: Tom Hagerty

4
Population
1990 Population by Age 2000 Population by Age
2010 Population by SexMale 46.90%
Female 53.10%
2010 Population by Race White or Caucasian 70.80%
Black or African American 20.95%Hispanic or Latino 12.60%
Other 3.40%
Two or more races 2.70%
Asian 1.80%
Native American .30%
Sources: U.S. Census Bureau
City of Lakeland Year Population Sq. Miles
1995 74,626 50.55
2000 78,452 51.91
2001 82,942 54.15
2002 87,150 67.54
2003 88,741 67.60
2004 89,731 69.94
2005 90,851 71.38
2006 91,623 72.17
2007 93,428 73.41
2008 93,508 74.33
2009 94,163 74.40
2010 97,422 74.48
2011 97,690 74.62
Polk County & Florida Year Polk County Florida
1995 443,153 14,336,202
2000 483,924 15,982,378
2001 496,112 16,331,739
2002 502,385 16,674,608
2003 511,929 17,071,508
2004 528,389 17,561,732
2005 535,800 17,918,227
2006 564,868 18,349,132
2007 581,058 18,680,367
2008 585,733 18,807,219
2009 584,383 18,748,925
2010 602,095 18,801,310
2011 604,792 18,905,048
Source: U.S. Census Bureau
0 2000 4000 6000 8000
10000 12000 14000 16000
Under 5 5 to 14 15 to 24 25 to 34 35 to 44 45 to 54 55 to 64 65 to 74 75 to 84 85+
2010 Population by Age
Lakeland has seen an 85% increasein the population of residents aged
45-54 from 1990 to 2010

5
Metropolitan Statistical Area Population
Metro and Non-Metro Population, 2010
City Population
Florida’s Top 25Incorporated, 2010
Source: University of Florida Bureau of Economic
and Business Research, Florida
Miami/Ft Lauderdale/Miami Beach 5,564,635
Tampa/St. Petersburg/Clearwater 2,783,243
Orlando/Kissimmee 2,134,411
Jacksonville 1,345,596
Sarasota/Bradenton/Venice Beach 702,281
Cape Coral/Fort Myers 618,754
Lakeland 602,095
Melbourne/Titusville/Palm Bay 543,376
Daytona Beach/Ormond Beach 494,593
Pensacola 448,991
Fort Pierce/Port St. Lucie 427,107
Tallahassee 367,431
Ocala 331,298
Naples/Marco Island 321,520
Gainesville 264,275
Fort Walton Beach 180,822
Panama City 168,852
Punta Gorda 159,978
Sebastian/Vero Beach 138,028
Palm Coast 95,696
Total All MSA’s 17,692,982
Total Non-Metro 1,108,328
Total Florida 18,801,310
Population
Jacksonville 821,784
Miami 399,457
Tampa 335,709
St. Petersburg 244,769
Orlando 238,300
Hialeah 224,669
Tallahassee 181,376
Ft. Lauderdale 165,521
Port St. Lucie 164,603
Pembroke Pines 154,750
Cape Coral 154,305
Hollywood 140,768
Gainesville 124,354
Miramar 122,041
Coral Springs 121,096
Clearwater 107,685
Miami Gardens 107,167
Brandon 103,483
Palm Bay 103,190
West Palm Beach 99,919
Pompano Beach 99,845
Spring Hill 98,621
Lakeland 97,422
Davie 91,992
Miami Beach 87,779
Source: United States Census 2010
5

Workforce DevelopmentGRAPHSNEEDED
Workforce Development Lakeland
Recent Job Growth 0.14%
10-Year Job Growth 29.38%
Unemployment Rate 11.10%
Sales Taxes 7.00%
Income Taxes 0.00%
Median Household Income $38,430
Per Capita Buying Income $23,685
Lakeland's AverageAnnual Unemployment Rate
2011 Lakeland UnemploymentBy Month
Economic Development Activity 1995-2011
Year Projects Jobs Square Feet Est.Capital Investment
1995 32 602 1,290,400 $ 36,770,000
1996 25 690 1,057,100 $ 63,350,000
1997 18 730 1,110,000 $ 20,900,000
1998 22 1,093 1,552,500 $ 94,075,000
1999 20 3,295 1,676,000 $ 79,250,000
2000 25 533 1,861,000 $109,700,000
2001 27 1,705 1,692,450 $ 75,400,000
2002 23 1,505 1,431,517 $ 38,260,850
2003 20 768 770,968 $ 15,364,555
2004 26 1,300 1,269,673 $ 33,805,000
2005 23 1,110 1,640,489 $ 29,932,600
2006 30 609 1,309,512 $ 38,115,337
2007 29 734 1,057,892 $ 44,083,425
2008 16 1,247 1,827,878 $ 180,350,000
2009 14 1,468 434,006 $ 70,671,672
2010 20 401 691,833 $ 35,714,000
2011 15 212 613,220 $ 13,007,000
Source: Lakeland Economic Development Council (LEDC)
“Where The Jobs Will Be in 2012”In December of 2011 Forbes listed the Lakeland MSA as having the best job outlook in the nation for 2012.
The national employment survey completed by the Manpower Group, states that 17%of Lakeland employers plan to add employees in the 1st quarter of 2012.
Lakeland Annual Labor Force
!36000
38000
40000
42000
44000
2001 2002 2003 2004 2005 2006 2007 2008 2009 2010 2011
3.0%4.0%5.0%6.0%7.0%8.0%9.0%
10.0%11.0%12.0%
2001 2002 2003 2004 2005 2006 2007 2008 2009 2010 2011
9.5%10.5%10.5%11.0%11.5%12.0%12.5%13.0%
J F M A ,M J J A S O N D

Industry Sectors
Industry Sector Comparison
Lakeland MSA – Total Nonagricultural Employment (December 2011)
Goods Producing 23,800 12.3%Construction, Mining & Natural Resources 9,900 5.1%Manufacturing 13,900 7.2%
Service Providing 169,600 87.7%Wholesale Trade 8,400 4.3%Retail Trade 25,600 13.2%Transportation, Warehousing & Utilities 11,800 6.1%Information 1,700 0.9%Financial Activities 10,700 5.5%Professional & Business Services 28,000 14.5%Education & Health Services 29,400 15.2%Leisure & Hospitality 16,800 8.7%Other Services 8,000 4.1%Government 29,200 15.1% Source: Florida Agency for Workforce Innovation
5% 7% 4%
13%
6%
1% 6%
15%
15%
9%
4% 15%
0
5000
10000
15000
20000
25000
30000
35000
1 2 3 4 5 6 7 8 9 10 11 12
1990 Industry Sector 2011 Industry Sector
1. Construction, Mining & Natural Resources 2. Manufacturing 3. Wholesale Trade 4. Retail Trade 5. Transportation Warehouse & Utilities 6. Information
7. Financial Activities 8. Prof. & Business Services 9. Education & Health Services 10. Leisure & Hospitality 11. Other Services12. Government
Employment opportunities within Lakeland’s Education and Health Servicesand Professional Business industries have nearly doubled over the past 20 years.
Major Employers
8
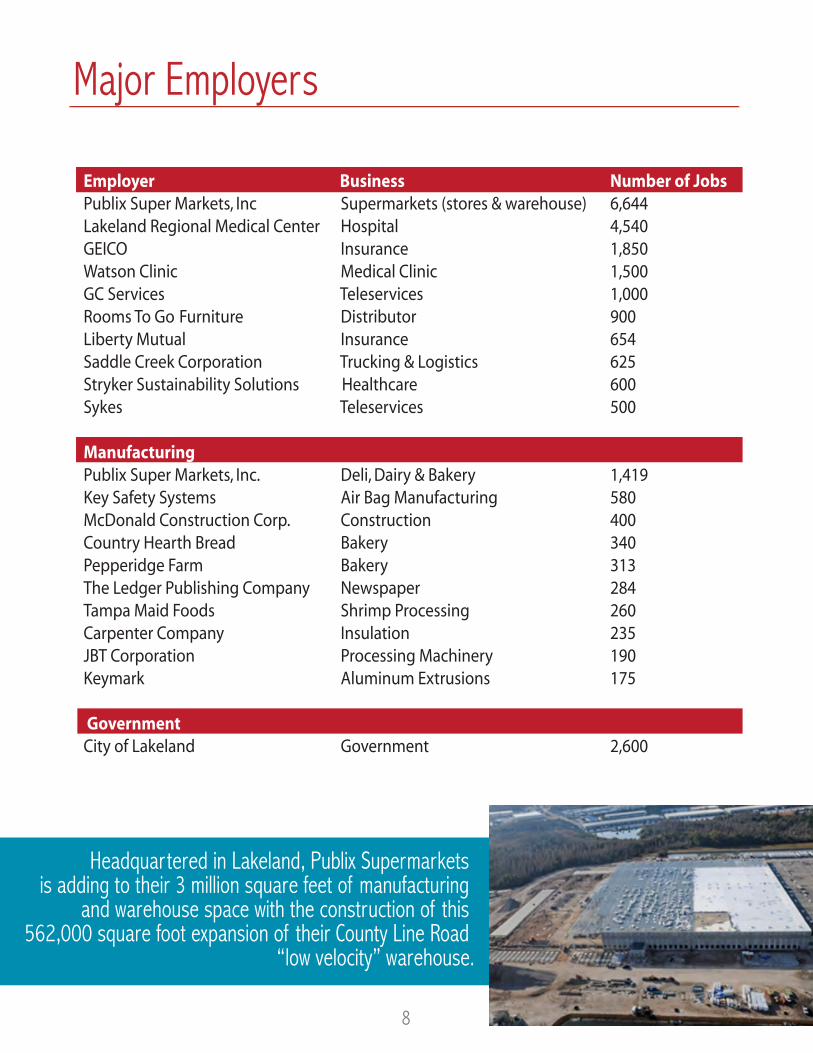
Employer Business Number of JobsPublix Super Markets, Inc Supermarkets (stores & warehouse) 6,644Lakeland Regional Medical Center Hospital 4,540GEICO Insurance 1,850Watson Clinic Medical Clinic 1,500GC Services Teleservices 1,000Rooms To Go Furniture Distributor 900Liberty Mutual Insurance 654Saddle Creek Corporation Trucking & Logistics 625Stryker Sustainability Solutions Healthcare 600Sykes Teleservices 500 Manufacturing Publix Super Markets, Inc. Deli, Dairy & Bakery 1,419Key Safety Systems Air Bag Manufacturing 580McDonald Construction Corp. Construction 400Country Hearth Bread Bakery 340Pepperidge Farm Bakery 313The Ledger Publishing Company Newspaper 284Tampa Maid Foods Shrimp Processing 260Carpenter Company Insulation 235JBT Corporation Processing Machinery 190Keymark Aluminum Extrusions 175 Government City of Lakeland Government 2,600
Headquartered in Lakeland, Publix Supermarkets is adding to their 3 million square feet of manufacturing
and warehouse space with the construction of this 562,000 square foot expansion of their County Line Road
“low velocity” warehouse.

Wages & Income
9
Industry Annual Wage
Private Industry $37,921
Public Administration $41,406
Agriculture, Forestry & Fishing $22,044
Construction $40,016
Manufacturing $39,400
Wholesale Trade $43,891
Retail Trade $28,160
Transportation & Warehousing $38,610
Utilities $51,370
Information $38,167
Finance & Insurance $44,191
Real Estate & Rental Leasing $35,263
Professional, Scientific Services $55,853
Management of Enterprises $53,599
Administration & Waste Services $34,203
Educational Services $36,412
Healthcare & Social Services $42,781
Arts & Entertainment & Recreation $28,684
Accommodations & Food Services $20,156
Other Services $34,545
Source: Florida Research & Economic Database 2011
2001 $28,890
2002 $29,505
2003 $30,277
2004 $31,387
2005 $31,928
2006 $33,592
2007 $35,568
2008 $36,920
2009 $37,356
2010 $37,939
2011 $37,185
Year Lakeland Florida
2001 $24,898 $29,804
2002 $25,106 $30,462
2003 $26,004 $31,242
2004 $27,965 $33,463
2005 $29,833 $35,498
2006 $31,090 $37,996
2007 $31,838 $39,256
2008 $32,433 $39,958
2009 $31,511 $37,387
2010 $31,998 $38,222
Per Capita Income
Source: Bureau of Economic Analysis(BEA) Per Capita Income by MSA
Source: Florida Research & Economic Database
20,000
25,000
30,000
35,000
40,000
2001 2002 2003 2004 2005 2006 2007 2008 2009 2010 2011
Average Annual Wage
The Tampa Bay Business Journalreported in December of 2011 that the
average annual compensation for high skill jobs in the Lakeland MSA had
risen to $46,318, marking a 1% from the previous year.
Tax Information
10
General Information The tax laws in Florida are advantageous both to industry and to individuals. There is no state personal income tax, no state ad valorem tax on real or tangible personal property, no inventory tax and no inheritance tax. This is indica-tive of Florida’s favorable tax climate – which is lower than most other southeastern states.
Ad valorem rates in Lakeland and Polk County compare favorably with taxes in any other section of the United States. The City of Lakeland has one of the lowest operating millages in the state at 4.1644.
State Sales Tax Florida has a 6% state sales tax. Exemptions include food and drugs, machinery and equipment for new businesses, and research and development equipment manufactured and used by a firm doing the research and development. Lakeland/Polk County has an additional 1% local sales tax as of January 2005.
Corporate Income TaxFlorida corporate income tax liability is computed using federal taxable income, modified by certain Florida adjustments, to determine adjusted federal income. A corporation doing business within Florida may apportion its total income. Adjusted federal income is apportioned to Florida using a three-factor formula. The formula is a weighted average, designating 25 percent each to factors for property and payroll, and 50 percent to sales. Non-business income allocated to Florida is added to the Florida portion of adjusted federal income. An exemption of up to $5,000 is subtracted to arrive at Florida net income. Tax is computed by multiplying Florida net income by 5.5 percent.
Communications TaxBusinesses providing communications services are required to register to collect and remit communications services tax. Communications services include telecommunications, cable, direct-to-home satellite, and related services. This definition encompasses voice, data, audio, video, or any other information or signals, including cable services that are transmitted by any medium.
Homestead Exemption On January 29, 2008 Florida voters approved an amendment to the Constitution allowing for a statewide reform of Florida’s existing Homestead Exemption criteria. This reform, designed by the Florida Legislature to provide property tax relief to homestead-exempted homeowners, owners of second homes, rental property owners and business owners provides four significant changes to the previous exemption.
Expanded Homestead Exemption: Increase the current $25,000 Homestead Exemption by an additional $25,000 except on school board taxes.
Portability: Allows Homeowners to transfer up to $500,000 of their Save Our Homes Assessment Limitation benefit to the new homestead.
Cap on Non-Homestead Property: The assessed value for all other properties without a homestead exemption will be limited to a maximum of 10% a year.
Tangible Personal Property Exemption: Businesses will be eligible for a $25,000 exemption on equipment such as computers, office furniture and fixtures.
In 2012 the tax Foundation ranked Florida as 5th best state on their annual State Business Tax Climate Index.

Tax Information
11
Statewide 2011Operating Millage Rate
Polk County 6.8665
School Board 7.67
*Parks MSTU 0.4219
*Library MSTU 0.2109
Auburndale 3.8393
Bartow 3.9962
Davenport 6.99
Dundee 7.6495
Eagle Lake 7.6516
Fort Meade 3.3509
Frostproof 7.8209
Haines City 6.99
Highland Park 9.9759
Hillcrest Heights 0.31
Lake Alfred 6.99
Lake Hamilton 7.593
Lakeland 4.1644
Lake Wales 7.9998
Mulberry 8.9
Polk City 8.6547
Winter Haven 5.79
* MSTU’s are paid by all residentialtaxpayers of unincorporated Polk County
County Wide 2011Millage Rates
Bradenton 5.2002
Clearwater 5.155
Daytona Beach 6.2598
Ft. Myers 8.4
Ft. Lauderdale 4.1193
Gainesville 4.2544
Hollywood 7.4479
Kissimmee 4.6253
Lakeland 4.1644
Miami 7.571
Orlando 5.65
Pensacola 4.2895
Plant City 4.7157
Sarasota 2.9249
St. Petersburg 5.9125
Tallahassee 3.7
Tampa 5.7326
West Palm Beach 8.0739
Winter Haven 5.79
Tax Summary Corporate Income Tax 5.50%
Sales Tax 6.00%
Local Option Sales Tax 1.00%
Gross Receipt Tax 2.37%
Unemployment Tax (varies) 2.70%
Communication Services Tax 7.03%
Intangible Tax - 1 mill per $1000 of assessed valuation
Education
12
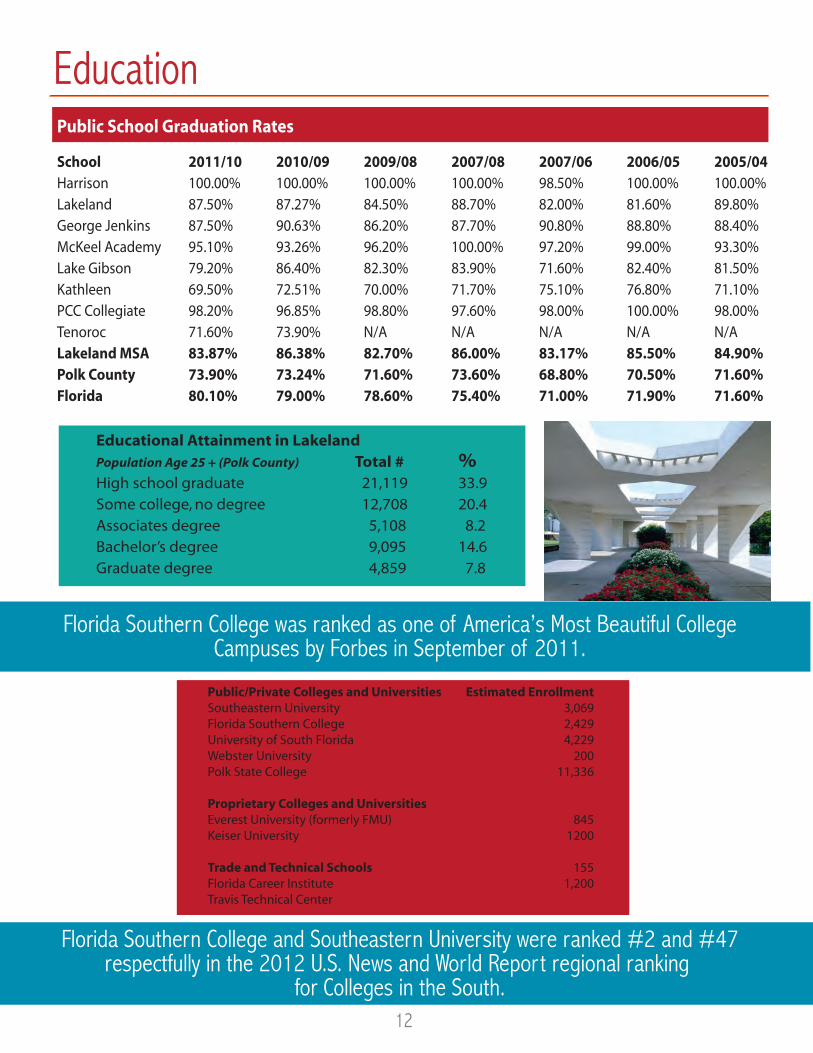
Public School Graduation Rates
School 2011/10 2010/09 2009/08 2007/08 2007/06 2006/05 2005/04Harrison 100.00% 100.00% 100.00% 100.00% 98.50% 100.00% 100.00%Lakeland 87.50% 87.27% 84.50% 88.70% 82.00% 81.60% 89.80%George Jenkins 87.50% 90.63% 86.20% 87.70% 90.80% 88.80% 88.40%McKeel Academy 95.10% 93.26% 96.20% 100.00% 97.20% 99.00% 93.30%Lake Gibson 79.20% 86.40% 82.30% 83.90% 71.60% 82.40% 81.50%Kathleen 69.50% 72.51% 70.00% 71.70% 75.10% 76.80% 71.10%PCC Collegiate 98.20% 96.85% 98.80% 97.60% 98.00% 100.00% 98.00%Tenoroc 71.60% 73.90% N/A N/A N/A N/A N/ALakeland MSA 83.87% 86.38% 82.70% 86.00% 83.17% 85.50% 84.90%Polk County 73.90% 73.24% 71.60% 73.60% 68.80% 70.50% 71.60%Florida 80.10% 79.00% 78.60% 75.40% 71.00% 71.90% 71.60%
Educational Attainment in Lakeland Population Age 25 + (Polk County) Total # % High school graduate 21,119 33.9Some college, no degree 12,708 20.4Associates degree 5,108 8.2Bachelor’s degree 9,095 14.6Graduate degree 4,859 7.8
Public/Private Colleges and Universities Southeastern University Florida Southern College University of South Florida Webster University Polk State College Proprietary Colleges and Universities Everest University (formerly FMU) Keiser University Trade and Technical Schools Florida Career Institute Travis Technical Center
Estimated Enrollment3,0692,4294,229
20011,336
8451200
1551,200
Florida Southern College was ranked as one of America’s Most Beautiful CollegeCampuses by Forbes in September of 2011.
Florida Southern College and Southeastern University were ranked #2 and #47respectfully in the 2012 U.S. News and World Report regional ranking
for Colleges in the South.
Economic Incentives and Redevelopment
13
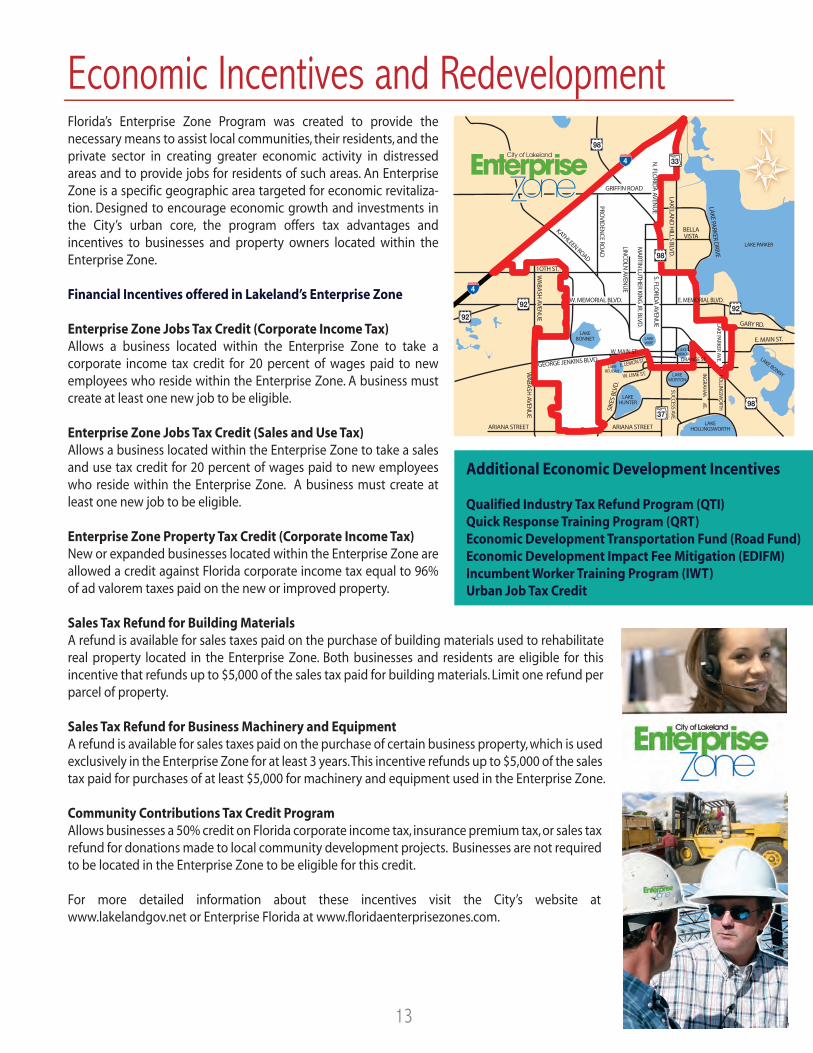
Additional Economic Development Incentives
Qualified Industry Tax Refund Program (QTI)Quick Response Training Program (QRT)Economic Development Transportation Fund (Road Fund)Economic Development Impact Fee Mitigation (EDIFM) Incumbent Worker Training Program (IWT)Urban Job Tax Credit
Florida’s Enterprise Zone Program was created to provide the necessary means to assist local communities, their residents, and the private sector in creating greater economic activity in distressed areas and to provide jobs for residents of such areas. An Enterprise Zone is a specific geographic area targeted for economic revitaliza-tion. Designed to encourage economic growth and investments in the City’s urban core, the program offers tax advantages and incentives to businesses and property owners located within the Enterprise Zone.
Financial Incentives offered in Lakeland’s Enterprise Zone
Enterprise Zone Jobs Tax Credit (Corporate Income Tax) Allows a business located within the Enterprise Zone to take a corporate income tax credit for 20 percent of wages paid to new employees who reside within the Enterprise Zone. A business must create at least one new job to be eligible.
Enterprise Zone Jobs Tax Credit (Sales and Use Tax) Allows a business located within the Enterprise Zone to take a sales and use tax credit for 20 percent of wages paid to new employees who reside within the Enterprise Zone. A business must create at least one new job to be eligible.
Enterprise Zone Property Tax Credit (Corporate Income Tax) New or expanded businesses located within the Enterprise Zone are allowed a credit against Florida corporate income tax equal to 96% of ad valorem taxes paid on the new or improved property.
Sales Tax Refund for Building Materials A refund is available for sales taxes paid on the purchase of building materials used to rehabilitate real property located in the Enterprise Zone. Both businesses and residents are eligible for this incentive that refunds up to $5,000 of the sales tax paid for building materials. Limit one refund per parcel of property.
Sales Tax Refund for Business Machinery and Equipment A refund is available for sales taxes paid on the purchase of certain business property, which is used exclusively in the Enterprise Zone for at least 3 years. This incentive refunds up to $5,000 of the sales tax paid for purchases of at least $5,000 for machinery and equipment used in the Enterprise Zone.
Community Contributions Tax Credit Program Allows businesses a 50% credit on Florida corporate income tax, insurance premium tax, or sales tax refund for donations made to local community development projects. Businesses are not required to be located in the Enterprise Zone to be eligible for this credit.
For more detailed information about these incentives visit the City’s website at www.lakelandgov.net or Enterprise Florida at www.floridaenterprisezones.com.
PROVID
ENCE RO
AD
KATHLEEN ROAD
LINCO
LN AVEN
UE
MARTIN
LUTH
ER KING
JR. BLVD.
W. MEMORIAL BLVD.
1OTH ST.
GEORGE JENKINS BLVD.W. MAIN ST.
E. MEMORIAL BLVD.
ARIANA STREETARIANA STREET
GRIFFIN ROAD
GARY RD.
E. MAIN ST.
LAKE PARKER DRIVE
BELLAVISTA
LAKE PARKER
LAKEMORTON
LAKE BONNY
LAKEHOLLINGSWORTH
LAKEHUNTER
LAKEBONNET LAKE
WIRE
LAKEMIRROR
LAKEBEULAH
ORANGE ST.
W. LIME ST.
E. LEMON ST.
SIKE
S BL
VD.
WABASH
AVENU
E
WABASH
AVENU
E
LAKELAND
HILLS BLVD
.
N. FLO
RIDA AVEN
UE
S. FLORID
A AVENU
E
ING
RAHAM
AVE.
HOLLINGSWORTH
SUCCESS AVE.
LAKE PARKER AVE.

Redevelopment and Economic Incentives
14
Lakeland Community Redevelopment AgencyThe City of Lakeland is on a course of constant change and improvement. Many of the major changes occurring within the “core” of our city are as a direct result of activities of the Lakeland Community Redevelopment Agency (CRA). The CRA works in concert with the City of Lakeland to rebuild and revitalize many of our more challenged neighborhoods. The goal of the CRA is to continue to build and strengthen the heart of our city by providing the appropriate infrastructure and incentives for new and renewed property investment.
OverviewThe City of Lakeland has four CRA target areas, or CRA districts. They are Downtown which was established in 1977, Dixieland and Mid Town which were created in 2001, and Williams which was created in 2002. Each of these areas are dependent taxing districts established by the local government for the purpose of carrying out redevelopment activities that include reducing or eliminating blight, improving the tax base, and encouraging public and private investments in the CRA.
OrganizationThe City Commission is the official Community Redevelopment Agency for Lakeland and each specific redevelopment area operates under the leadership of an Advisory Board.
Projects and FundingCRA projects must serve a public purpose and must address concerns raised in the adopted redevelopment plans for each area. Possible CRA programs include street and streetscape improvements, park improvements, develop-ment of infill housing, recruitment of new businesses and partnership with job-training and placement services.
CRA projects are funded by "tax increment financing"which works as follows: the value of real property in a redevelopment area is deter-mined on a fixed date; as the value of the real property appreciates, the tax revenue on the appreciated portion of the value (the incre-ment) is set aside for CRA projects; the City and County continue to collect the tax revenue on the original real property value. Most programs are designed to leverage tax increment by encouraging private developers to invest in CRA districts.
Mid Town Downtown Dixieland
Please visit www.ldda.org and www.lakelandcra.net for additional information.
CR 582 (GRIFFIN RD)
SLEEPY HILL RD
US 98
LAKE PARKER
LAKE HOLLINGSWORTH
LAKE BONNY
LAKEBONNET
LAKEHUNTER
LAKE MORTON
LAKE MIRROR
LAKEWIRE
LAKEBEULAH
MALL H
ILL DR
MALL HILL RD
KATHLEEN RD
ROBSON ST
N F
LORI
DA
AV
GRANADA ST
(LA
KELA
ND
HIL
LS B
LVD
)
E LA
KE P
ARK
ER D
R
BELLA VISTA ST
W TENTH ST TENTH ST
PRO
VID
ENCE
RD
BELLA VISTA ST
KATHLEEN RD
FIFTH ST
N W
ABA
SH A
V
MA
RTIN
LU
THER
KIN
G B
LVD
MA
SSA
CHU
SETT
S A
V
GARY RD
E MAIN ST
MA
SSA
CHU
SETT
S A
V
N F
LORI
DA
AV
PARKER STLA
KE P
ARK
ER A
V
MEMORIAL BLVD
WA
BASH
AV
GEORGE JENKINS BLVD
OLIVE ST
W MAIN ST
LIME STLIME ST
ORANGE ST
BARTOW RD IN
GRA
HA
M A
V
PALMETTO ST HO
LLING
SWO
RTH RD
MCDONALD ST
FLO
RID
A A
VM
ISSO
URI
AV
SOU
TH B
LVD
W HIGHLAND ST / GREENWOOD ST
S W
ABA
SH A
V
SIKES BLVD
HA
RDEN
BLV
D
ARIANA ST
BEACON RD SYLVESTER RD
NEW
JERS
EY R
D
Midtown CRA
Downtown CRA
Dixieland CRA
Housing
15
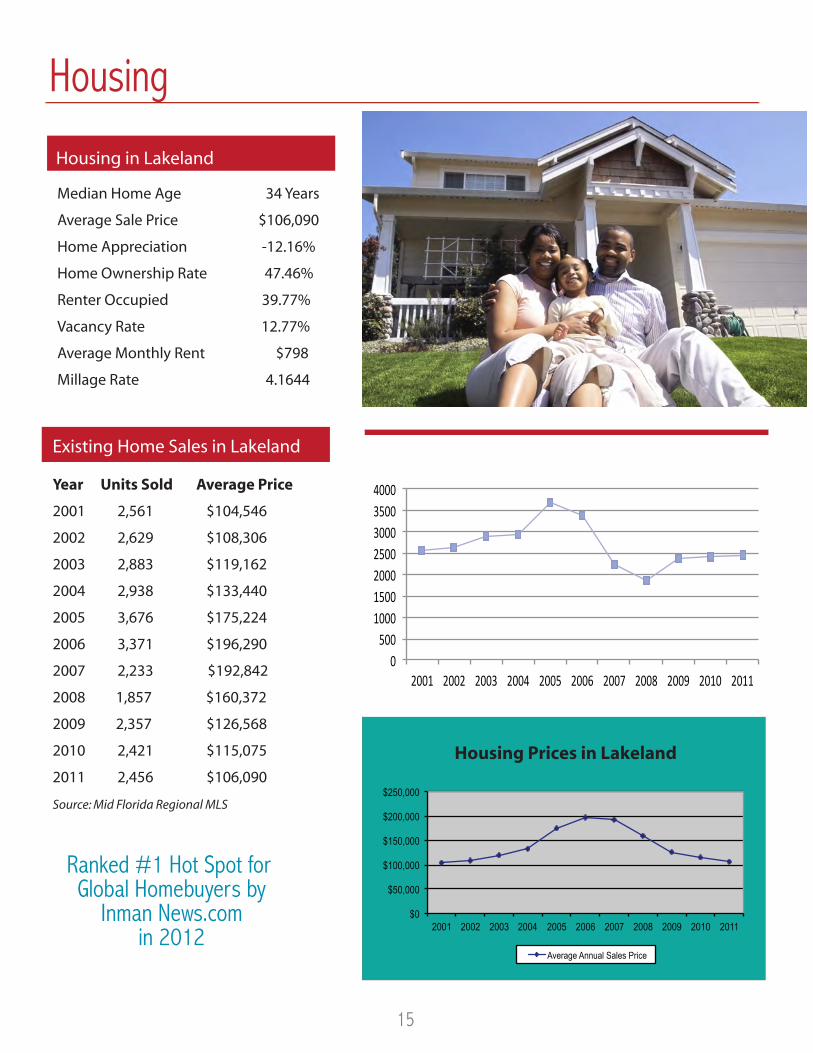
Housing in Lakeland
Housing Sales In Lakeland
Housing Prices in Lakeland
Existing Home Sales in Lakeland
Year Units Sold Average Price
2001 2,561 $104,546
2002 2,629 $108,306
2003 2,883 $119,162
2004 2,938 $133,440
2005 3,676 $175,224
2006 3,371 $196,290
2007 2,233 $192,842
2008 1,857 $160,372
2009 2,357 $126,568
2010 2,421 $115,075
2011 2,456 $106,090
Source: Mid Florida Regional MLS
Ranked #1 Hot Spot for Global Homebuyers by
Inman News.comin 2012
Median Home Age 34 Years
Average Sale Price $106,090
Home Appreciation -12.16%
Home Ownership Rate 47.46%
Renter Occupied 39.77%
Vacancy Rate 12.77%
Average Monthly Rent $798
Millage Rate 4.1644
$0
$50,000
$100,000
$150,000
$200,000
$250,000
2001 2002 2003 2004 2005 2006 2007 2008 2009 2010 2011
Average Annual Sales Price
0500
1000150020002500300035004000
2001 2002 2003 2004 2005 2006 2007 2008 2009 2010 2011

16
Construction & Development
Single Family Permits
Year Permits Permit Valuation
2001 183 $ 21,043,478
2002 220 $ 28,611,809
2003 257 $ 34,200,806
2004 380 $ 49,241,780
2005 544 $179,996,957
2006 544 $ 99,101,767
2007 458 $107,385,621
2008 252 $ 55,438,488
2009 144 $ 29,771,733
2010 142 $ 30,467,000
2011 115 $ 25,139,223
Residential Construction Units
Year Warehouse/Industrial Commercial Office Commercial Retail2002 508,656 84,393 184,0942003 139,373 113,486 155,6072004 1,537,656 122,057 543,7172005 456,816 81,231 447,5962006 1,047,852 190,472 443,8462007 926,792 92,825 324,0512008 24,446 103,447 97,5572009 76,000 101,517 3,2152010 103,482 81,857 18,0462011 890,718 11,522 50,031
Commercial/Industrial Square Foot Permitted
Total Permit Valuation
0 200 400 600 800
1000 1200 1400
2001 2002 2003 2004 2005 2006 2007 2008 2009 2010 2011
Single Family Multi-Family
$0 $100,000,000 $200,000,000 $300,000,000 $400,000,000 $500,000,000 $600,000,000
2001 2002 2003 2004 2005 2006 2007 2008 2009 2010 2011
In November of 2011 Realtor.com listed Lakeland as 7th on their national list of cities that are leading towards a general real estate recovery and
a stabilization of the housing sector.

Top Related