


Languages
Pages
Legal


2010 Survey of Registered Nurses
Joanne Spetz, Ph.D.Dennis Keane, M.P.H.Carolina Herrera, M.A.
University of California, San FranciscoSchool of Nursing
April 13, 2011

Survey of RNs, 2010
• 10,000 active RNs– New survey format tested on 50% of sample– 62.2% response rate (highest since 1997)
• 1,000 inactive & lapsed RNs– 500 inactive (unexpired) – 66.4% response rate– 500 lapsed in 2009 – 42.6% response rate
• Mailed April 23, 2010 (2 weeks earlier than 2008)– Paper survey with online option– Data collection ended August 23, 2010
• All survey management conducted at UCSF

Evidence of the recession
• Employment rate is higher than in 2008– Rose from 86.9% to 87.4%
• Large increase in number of non-retired RNs looking for nursing work
• Higher employment of RNs age 50+– Lower employment of RNs under 40 years
• More nurses age 55+ do not plan to reduce hours or leave nursing
– More nurses age 35 and under plan to increase hours
• Salaries have stabilized

Share of RNs that works in a nursing position
17.3% of working nurses have more than one RN job.

Share of RNs employed in nursing by age
0%10%20%30%40%50%60%70%80%90%100%
2004 2006 2008 2010

Ages of working RNs
0%
5%
10%
15%
20%
25%
<30 30-34 35-39 40-44 45-49 50-54 55-59 60-64 65+
1990 1997 2004 2008 2010
Average ages
1990 – 42.91993 – 43.61997 – 44.62004 – 47.62006 – 47.12008 – 47.12010 – 46.3

Gender of working RNs
94.6% 94.2% 92.6% 92.6% 89.5% 85.7% 89.3%
5.4% 5.8% 7.4% 7.4% 10.5% 14.4% 10.7%
0%
10%
20%
30%
40%
50%
60%
70%
80%
90%
100%
1990 1993 1997 2004 2006 2008 2010Female Male

Racial/ethnic mix of working RNs

Diversity greater among younger RNs

Initial nursing education for working RNs
32.3% 28.1% 23.6% 18.5% 15.7% 14.2% 11.1%
39.0% 43.0%44.3%
47.3% 47.3% 46.8%45.0%
2.9%
28.6% 28.6% 31.7% 33.4% 35.5% 37.5% 39.1%
0.1% 0.3% 0.5% 0.9% 1.6% 1.6% 1.9%
0%
10%
20%
30%
40%
50%
60%
70%
80%
90%
100%
1990 1993 1997 2004 2006 2008 2010
Master's orDoctorate Degree
Baccalaureatedegree
30 unit program
Associate degree
Diploma program
23% are internationally
-educated
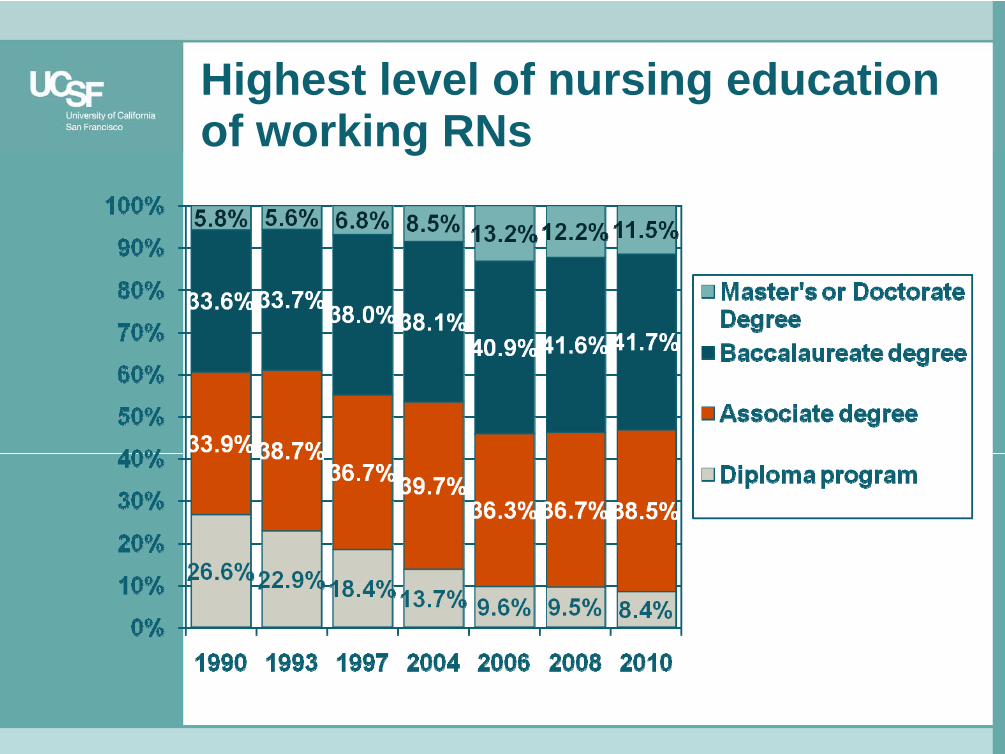
Highest level of nursing education of working RNs

Job titles of RNs for primary positions

Work settings of RNs for primary nursing position

Use of information technology in primary nursing job
59.6%
56.9%
54.6%
38.8%
63.0%
33.9%
20.2%
49.6%
21.9%
37.9%
3.8%
13.9%
52.6%
46.1%
50.6%
29.2%
59.4%
24.9%
16.3%
54.1%
14.1%
29.6%
8.7%
15.0%
0% 20% 40% 60% 80% 100%
Electronic patient records
Electronic nurse charting
Electronic radiology reports
Electronic care plans
Electronic lab reports
Computerized physician orders
Scanning for supplies
Computerized med distribution
Barcode scanning for medications
Electronic med admin record
Other
None
2010 2008
2006: 26.5% had problems with systems2010: 20.1% had problems with systems

Temporary agency employment of California-resident RNs
2006 2008 2010
% temp/travel 4.6% 4.1% 3.9%
Reasons why…
Wages 59.5% 58.6% 28.0%
Control schedule 57.2% 56.9% 52.6%
Supplement income 36.6% 42.6% 46.2%
Control work conditions 26.1% 24.2% 9.3%
Waiting for position 12.8% 16.1% 16.5%
Unable to find job/ insufficient hours 13.8%
Other 16.1% 12.9% 5.3%

Average income from all nursing positions

Highest job satisfaction ratings
• Interactions with patients• Feeling that work is meaningful• Job overall• Team work between coworkers• Work schedule
Job security was in the top 5 in 2008, but not in 2010. Job security satisfaction dropped 2008- 2010, first drop since 1990-1993. Employer- supported education satisfaction also dropped.

Lowest job satisfaction ratings
• Amount of paperwork required• Involvement in policy and management
decisions• Leadership from administration• Non-nursing tasks required• Recognition for a job well done
Recognition was not in bottom 5 in 2008.

Largest improvements in job satisfaction, 2004-2010• Adequacy of RN staffing• Benefits• Adequacy of clerical support• Paperwork required• Nursing profession overall• Salary• Physical work environment• Job overall• Time available for patient education• Non-nursing tasks

Changes in employment in past year• 29% report a change in past year• Most common:
– Decreased hours 26.3%– New position with same employer 20.6%– Increased hours 19.9%– New position with new employer 16.7%

Reasons for employment changes• Key reasons for decreased hours:
– Wanted more convenient hours– Salary– Family
• Key reasons for increased hours– Change in financial status– Salary– Family– Wanted more convenient hours
• Key reasons for new RN position– Salary– Change in financial status– Promotion– Family

Plans for next five years for working RNs
46.1%60.1% 57.1% 56.7% 53.1% 60.2%
32.7%21.8% 24.7% 22.1% 21.6% 19.8% 15.2%
6.7% 8.4% 8.5% 7.2% 9.5% 10.1% 13.1%14.6% 9.8% 9.7% 14.0% 15.8% 15.5% 11.5%
54.6%
0%10%20%30%40%50%60%70%80%90%
100%
1990 1993 1997 2004 2006 2008 2010
Plan to leavenursing/retire
Plan to increasehours of nursingwork
Plan to reducehours of nursingwork
Plan to workapproximately asmuch as now

Changes in plans…
Under 35 55-64 years2008 2010 2008 2010
Work as much as now 54.8% 60.0% 41.2% 49.3%Reduce hours 21.1% 12.6% 20.8% 18.6%Increase hours 19.3% 25.5% 2.3% 3.9%Leave nursing 4.7% 1.8% 35.8% 28.2%

Employment of active RNs who reside outside California

Employment status of active RNs who do not have a nursing job
22.7%33.9% 25.4% 26.9%
77.3%66.1% 74.6% 73.1%
0%10%20%30%40%50%60%70%80%90%
100%
2004 2006 2008 2010
Working outside nursing Not working outside nursing

Reasons for not having RN job2008 2010 Under
55 years55 years and older
Retired 32.4% 34.9% 6.0% 54.3%
Childcare responsibilities 25.8% 21.9% 37.2% 11.7%
Other family responsibilities 33.8% 29.7% 34.2% 26.6%
Stress on the job 47.5% 35.7% 33.9% 36.9%
Salary 27.8% 20.1% 23.8% 17.6%
Inconvenient schedules in nursing jobs
26.9% 19.9% 25.7% 16.1%
Difficult to find a nursing position 8.1% 19.3% 33.4% 9.8%
Laid Off * 15.7% 20.9% 12.2%

Intentions of non-retired RNs not working in nursing

Important factors in the decision to return to nursing for active RNs who are undecided about their plans
• Flexible work hours (80.6%)• Better support from nursing management (67.1%)• Availability of re-entry programs/mentoring (67%)• Adequate support staff (65%)• Better nurse-to-patient ratios (61.8%)• Better retirement benefits (53.6%)• Higher nursing salary (53.2%)• More support from other nurses (51.5%)
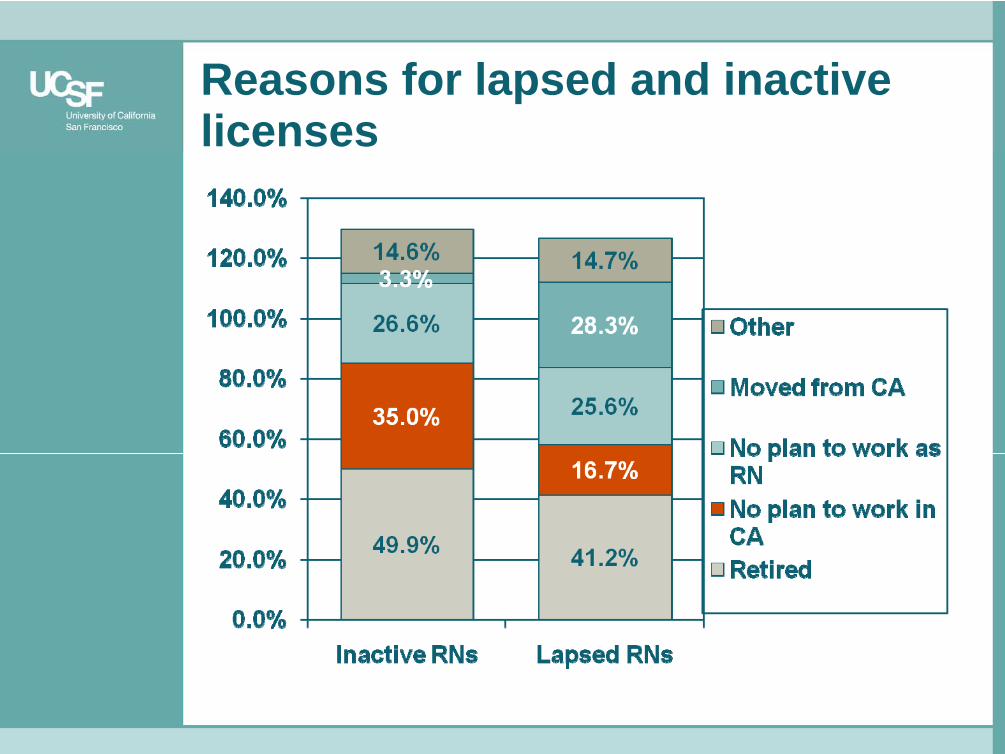
Reasons for lapsed and inactive licenses

Future plans for RNs with inactive or lapsed licenses
10.3% 9.5% 9.1% 6.7% 11.5% 12.3%
24.7% 22.4% 25.5%5.6%
22.3%14.0%
65.0% 68.1% 65.5%85.6%
64.1%73.2%
0%10%20%30%40%50%60%70%80%90%
100%
Inactive2006
Inactive2008
Inactive2010
Lapsed2006
Lapsed2008
Lapsed2010
Retired/will notreturn
Undecided
Plan to return
Currently seekingwork
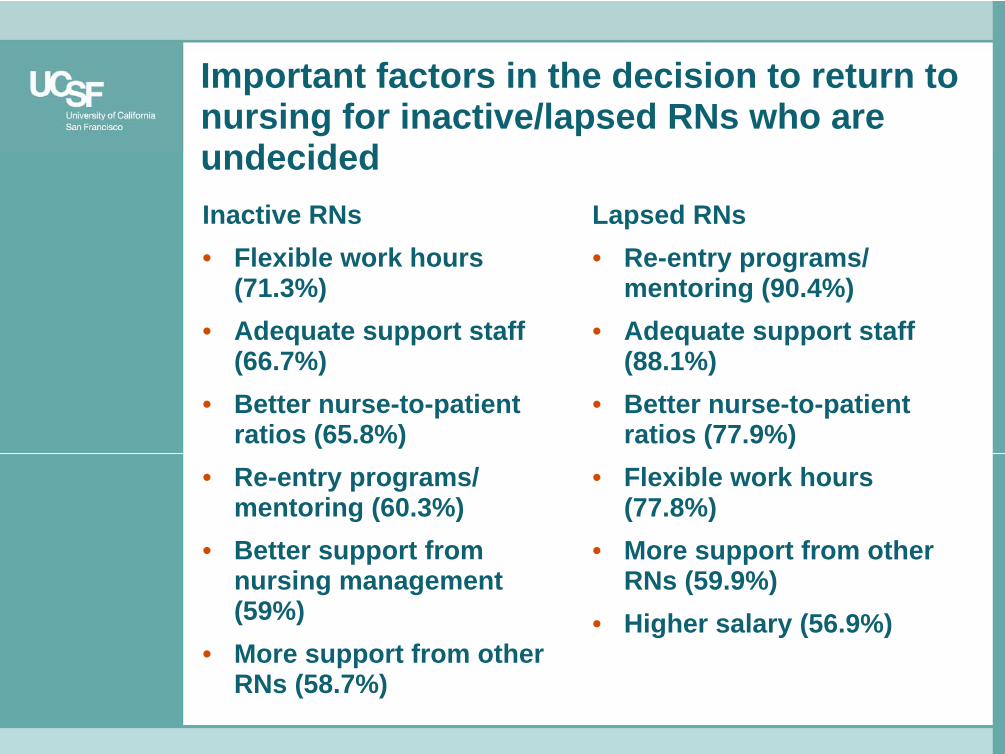
Important factors in the decision to return to nursing for inactive/lapsed RNs who are undecidedInactive RNs• Flexible work hours
(71.3%)• Adequate support staff
(66.7%)• Better nurse-to-patient
ratios (65.8%)• Re-entry programs/
mentoring (60.3%)• Better support from
nursing management (59%)
• More support from other RNs (58.7%)
Lapsed RNs• Re-entry programs/
mentoring (90.4%)• Adequate support staff
(88.1%)• Better nurse-to-patient
ratios (77.9%)• Flexible work hours
(77.8%)• More support from other
RNs (59.9%)• Higher salary (56.9%)

Summary of key findings• Employment rate rose between 2008 and 2010,
especially for older RNs, and dropped for younger RNs
• Fewer nurses plan to retire soon• More nurses want to increase hours of work• Employment settings have been relatively stable• Salaries have stabilized• Job satisfaction continues to rise• Diversity of nursing workforce is increasing• More than half of RNs had post-secondary
education before pursing RN education• More than half of RNs have a BSN or higher
degree
Top Related